copy 21.03.2011 no cover - warrington.gov.uk
TRANSCRIPT


Warrington Borough Council Carbon Management Programme
Carbon Management Plan working with
Page 1
Contents Foreword from Diana Terris and Councillor Mike Biggin 3 Foreword from the Carbon Trust 4 Management Summary 5 1 Introduction 8 2 Carbon Management Strategy 9
2.1 Context and drivers for Carbon Management 9 2.2 Targets and objectives 9
3 Emissions Baseline and Projections 11 3.1 Scope 11 3.2 Carbon Baseline 12 3.3 Display energy certificates 13 3.4 Projections and Value at Stake 14
4 Carbon Management Projects 16 4.1 Project Delivered between April 2009 and April 2011 16 4.2 Planned / funded projects 18 4.3 Unfunded and Aspirational 20 4.4 Projected achievement towards target 23
5 Carbon Management Plan Financing 24 5.1 Assumptions 24 5.2 Benefits / savings 24 5.3 Financial costs and sources of funding 25
6 Actions to Embed Carbon Management in the Organisation 27 6.1 Corporate Strategy – embedding CO2 saving across Warrington Borough Council 28 6.2 Programme Management – bringing it all together effectively 28 6.3 Responsibility – being clear that saving CO2 is everyone’s job 29 6.4 Data Management – measuring the difference, measuring the benefit 30 6.5 Communication and Training – ensuring everyone is aware 30 6.6 Finance and Investment – the money to match the commitment 32 6.7 Policy Alignment – saving CO2 across our operations 32 6.8 Engagement of Schools – working with Schools to reduce their carbon footprint 33
7 Programme Management of the CM Programme 34 7.1 The Programme Board – strategic ownership and oversight 34 7.2 The Climate Change Implementation Group – delivering the projects 35 7.2 Succession planning for key roles 36 7.3 Ongoing stakeholder management 36 7.4 Annual progress review 38
APPENDIX A: Value at Stake Scenarios 39 Appendix B: Carbon Management Matrix – Embedding 41 Appendix C: Highlight Report 43 Appendix D: Definition of Projects 45

Warrington Borough Council Carbon Management Programme
Carbon Management Plan working with
Page 2
Building and Engagement Projects (including schools) Business travel
Fleet Waste
Water Street lighting Renewable Technologies
Figures Figure 1 Breakdown of emissions for Warrington Borough Council for baseline year ................................................ 5 Figure 2 Salix funded solar bollard ............................................................................................................................. 8 Figure 3 The 5 step process of the local authority carbon management programme ................................................. 8 Figure 4 Our buildings DEC ratings (Oct 2010) .......................................................................................................... 9 Figure 5 Sectors included in our carbon footprint ..................................................................................................... 11 Figure 6 Numbers of buildings per DEC rating as of October 2010 .......................................................................... 13 Figure 7 DEC ratings versus carbon emissions of WBC buildings............................................................................ 13 Figure 8 The Value at Stake between acting and achieving our carbon reduction target of 40%, and continuing as usual ......................................................................................................................................................................... 15 Figure 9 Planned progress towards our carbon reduction target .............................................................................. 23 Figure 10 The Salix recycling fund process .............................................................................................................. 25 Figure 11 Salix recycled fund financing .................................................................................................................... 26 Figure 12 Carbon Management Matrix scores at the start of the plan and our targets for end score ...................... 27 Figure 13 Value at Stake for Schools ....................................................................................................................... 33 Figure 14 Organisational context of carbon management programme ..................................................................... 34 Figure 15 Organisational chart for carbon management programme ....................................................................... 35
Tables Table 1 Summary of carbon and financial benefits of the carbon management programme ...................................... 6 Table 2 Funding and investment required within plan ................................................................................................. 7 Table 3 Summary table of emissions for Warrington Borough Council for baseline year 2009/10 ........................... 12 Table 4 Value at Stake for different emissions reductions over the next 5 years ...................................................... 14 Table 5 Representation of the Value at Stake graph ................................................................................................ 15 Table 6 Projects undertaken between April 2009 and April 2011 ............................................................................. 16 Table 7 Funded projects for April 2011 to March 2015 ............................................................................................. 18 Table 8 Unfunded/aspirational projects for April 2011 to March 2015 ...................................................................... 20 Table 9 Renewable technology projects for April 2011 to March 2015 ..................................................................... 22 Table 10 Quantified Benefits and Savings of all projects .......................................................................................... 24 Table 11 Financial costs of projects in plan .............................................................................................................. 25 Table 12 Succession planning for key roles in Warrington Borough Councils carbon management plan................. 36 Table 13 The climate change communications plan ................................................................................................. 37 Table 14: Value at stake scenarios (figures are cumulative value at stake over 5 years) ........................................ 39

Warrington Borough Council Carbon Management Programme
Carbon Management Plan working with
Page 3
Foreword from Diana Terris and Councillor Mike Biggin Warrington Borough Council is determined to guide our community and lead Warrington to a sustainable, low-carbon future which will ensure that residents, visitors and businesses choose Warrington as a preferred location in which to live, work and invest. The challenges are significant but we are committed to leading the way.
Our growth and prosperity in the past was supported by affordable energy which gave rise to emissions of carbon that are now causing our climate to change. Some of these effects have already been seen in Warrington with extreme weather events such as high winds and flooding in recent years. Our challenge for the future will be to prosper as a community in a low carbon way. Now is an ideal time to seize the opportunity to reduce our emissions and make cost savings in the process.
Warrington Borough Council’s Sustainable Community Strategy sets us a carbon reduction target of reducing the borough’s carbon emissions by 40% from 2006 levels by 2030. In 2007 we produced our Climate Change Strategy which started us on our mission to embed carbon reduction across the council. We must all play our part in making deep reductions in carbon emissions and this Carbon Management Plan is the first step in the Council’s journey to set a low carbon example.
This plan will be used to identify opportunities for emissions reductions, monitoring our improvements and ensuring that carbon emissions and energy efficiency are at the centre of Warrington’s strategies going forward. This challenge is significant but we are confident that employees of Warrington Borough Council will pull together and help us achieve this ambitious plan, setting an example that the rest of the community and the sector will follow enthusiastically.
All Executive Directors have signalled their full support for the ambitions and objectives within this Plan.
Diana Terris
Chief Executive
Warrington Borough Council
Cllr Mike Biggin
Executive Board Member for Climate Change and Public
Protection
Warrington Borough Council Carbon Management Programme
Carbon Management Plan working with
Page 4
Foreword from the Carbon Trust Cutting carbon emissions as part of the fight against climate change should be a key priority for all public sector organisations. Carbon management is about realising efficiency savings, transparency, accountability and leading by example. The UK government has identified the public sector as key to delivering carbon reduction across the UK in line with its Climate Change Act commitments and the Local Authority Carbon Management Programme is designed in response to this. It helps organisations to save money on wasted energy and put it to better use in other areas, while making a positive contribution to the environment by lowering carbon emissions.
Warrington Borough Council partnered with the Carbon Trust on this programme in 2010 to realise the substantial carbon and cost savings. This Carbon Management Plan commits Warrington Borough Council to a target of reducing CO2 by 40% by 2015 and underpins potential financial savings and cost avoidance to the organisation of around £10 million by that date.
Public sector organisations can contribute significantly to reducing CO2 emissions and improving efficiency. The Carbon Trust is therefore very proud to support Warrington Borough Council in their on-going implementation of carbon management.
Richard Rugg
Head of Public Sector, Carbon Trust

Warrington Borough Council Carbon Management Programme
Carbon Management Plan working with
Page 5
Management Summary
This carbon management plan will help Warrington Borough Council to focus its strategies and policies towards mitigating the effect of climate change from April 2010 until March 2015. Saving carbon means that we will save energy and therefore money, which will assist in the council’s budget challenges and the efficiency savings that the council is undergoing.
The climate change programe is part of the Transforming Warrington agenda and thus has a high profile within the authority.
We have begun to embed climate change into our procedures and decision making to ensure that we meet the targets that are set by our government. We want to lead our community in a responsible attitude towards responding to the threat of climate change.
Action by local authorities will be critical to the achievement of the Government’s climate change objectives, such as the long term goal to reduce CO2 emissions by 80% by 2050, as set out in the Climate Change Act.
The carbon management plan will support Warrington’s climate change strategy which was produced in 2007. The carbon management plan is a strategic way forward for the authority to deliver carbon reduction of its own emissions.
Our emissions in 2009/2010 were as shown in Figure 1; our carbon footprint is 34,737 tonnes. The graph shows that the main areas for us to focus on are schools and streetlighting which together make up 60% of our emissions.
Figure 1 Breakdown of emissions for Warrington Borough Council for baseline year
Headlines In 2009 / 2010 Warrington Borough Council was responsible for emitting 34,737
tonnes of carbon costing the authority £7 million a year We have set an aspirational target to reduce these emissions by 40% by April
2015 The difference between taking action to achieve this target and doing nothing is
more than £10 million over 5 years

Warrington Borough Council Carbon Management Programme
Carbon Management Plan working with
Page 6
The incentive to reduce our emissions is driven by:
• Financial reasons: Assisting in the council’s cost saving efforts Anticipating saving money from the carbon reduction commitment
• Environmental reasons: Sustainable use of resources Action on climate change
• Political and social reasons: Boosts the council’s green credentials Supporting and acting as a leader to the residents and businesses of the borough
We have a set an aspirational target reduction of 40% of our 2009/2010 emissions by April 2015. The difference between taking action to achieve this target and doing nothing is more than £10 million over 5 years. As well as the environmental benefits, there is a clear financial incentive to act now.
2009/2010 2010 / 2011
2011 / 2012
2012 / 2013
2013 / 2014
2014 / 2015
Annual cost saving £38,694 £137,686 £945,879 £1,484,885 £1,903,248 £2,044,169
Annual CO2 saving 229.74 757.62 4827.76 7804.52 10369.09 11249.60
Table 1 Summary of carbon and financial benefits of the carbon management programme
The plan identifies projects that will achieve a reduction of 11,515 tonnes; or 33% of our carbon footprint. Over the next five years we will annually review our progress and continue to identify further projects that will help us achieve our target.
To achieve our target we are looking to:
• Directly reduce our emissions
• Embed the consideration of carbon
• Invest to save carbon and save money
• Raise awareness amongst staff
• Form a partnership with schools to address their energy use
Warrington Borough Council Carbon Management Programme
Carbon Management Plan working with
Page 7
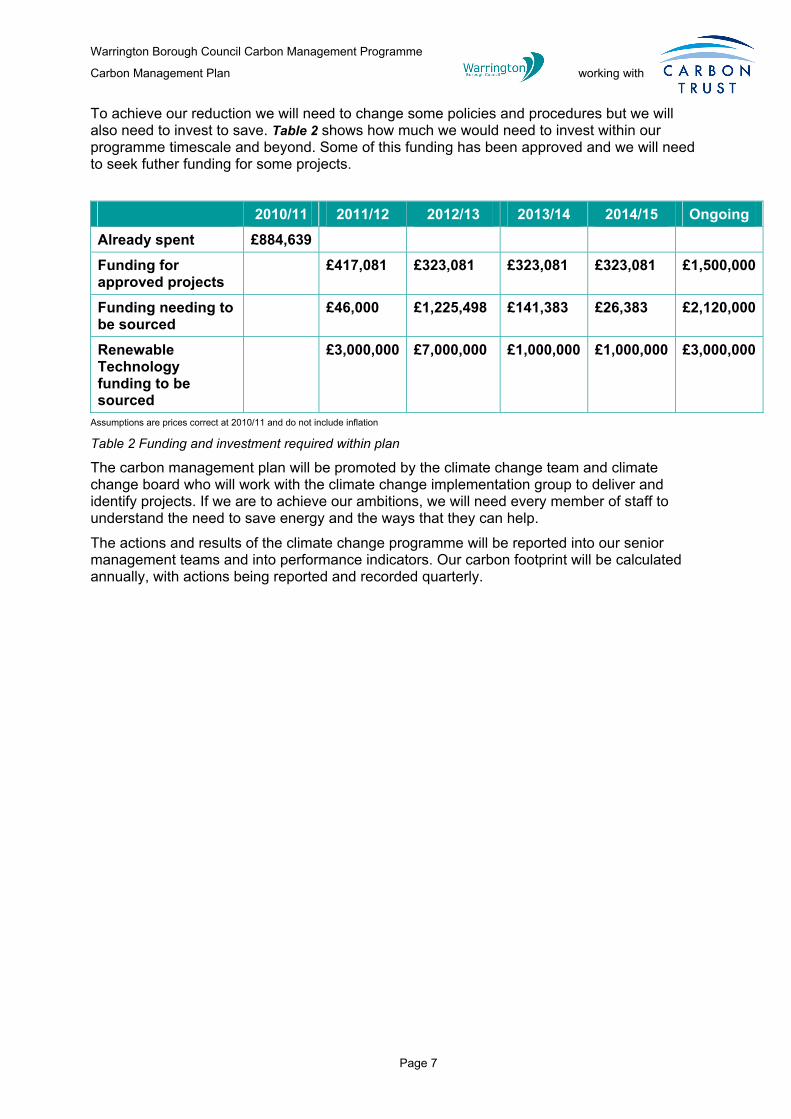
To achieve our reduction we will need to change some policies and procedures but we will also need to invest to save. Table 2 shows how much we would need to invest within our programme timescale and beyond. Some of this funding has been approved and we will need to seek futher funding for some projects.
2010/11 2011/12 2012/13 2013/14 2014/15 Ongoing
Already spent £884,639
Funding for approved projects
£417,081 £323,081 £323,081 £323,081 £1,500,000
Funding needing to be sourced
£46,000 £1,225,498 £141,383 £26,383 £2,120,000
Renewable Technology funding to be sourced
£3,000,000 £7,000,000 £1,000,000 £1,000,000 £3,000,000
Assumptions are prices correct at 2010/11 and do not include inflation
Table 2 Funding and investment required within plan
The carbon management plan will be promoted by the climate change team and climate change board who will work with the climate change implementation group to deliver and identify projects. If we are to achieve our ambitions, we will need every member of staff to understand the need to save energy and the ways that they can help.
The actions and results of the climate change programme will be reported into our senior management teams and into performance indicators. Our carbon footprint will be calculated annually, with actions being reported and recorded quarterly.

Warrington Borough Council Carbon Management Programme
Carbon Management Plan working with
Page 8
1 Introduction In May 2010 Warrington Borough Council joined the Carbon Trust local authority management programme. This provided us with 10 months of technical and organisational change support to give greater focus to the climate change programme in Warrington Borough Council.
Figure 2 Salix funded solar bollard
The programme has guided Warrington Borough Council through the 5 steps outlined in Figure 3.
Figure 3 The 5 step process of the local authority carbon management programme
Through the steps undertaken on the programme we have scrutinised our emissions and identified where we can make changes over the next 5 years and make a significant impact.
The benefits of producing and implementing this plan are:
• Acting to protect our environment
• Working towards reducing our environmental impacts and carbon emissions
• Reducing our energy costs
• Complying with legislation
• Leading the way and demonstrating best practice
The rest of this plan describes in detail our strategy, our emissions and the projects and steps that we will take to successfully reach our carbon reduction target. The plan looks at our progress from April 2010 and our plans till March 2015.
Prior to the programme we had produced our Climate Change Strategy in 2007 and developed a good understanding of our emissions. Through Salix funding in early 2010 we improved our street lighting assets and identified energy efficiency measures to improve some of our buildings.
We really needed to start to identify where we could implement big projects that would impact on our emissions and embed carbon management in the ethos of our organisation. The Carbon Trust programme has given us the opportunity to do this.

Warrington Borough Council Carbon Management Programme
Carbon Management Plan working with
Page 9
2 Carbon Management Strategy The carbon management strategy outlines our drivers, our targets for carbon reduction and our strategy for achievement over five years.
2.1 Context and drivers for Carbon Management Human activities are increasing the amount of greenhouse gases in our atmosphere to dangerous levels that are causing climate change and impacting upon our world. This is a global issue which we all have a part to play in combating.
The UK Government has placed an emphasis on local authorities setting an example and taking a leading role in taking action on Climate Change. Action by local authorities will be critical to the achievement of the Government’s climate change objectives, such as the long term goal to reduce CO2 emissions by 80% by 2050, as set in the Climate Change act.
Figure 4 Our buildings DEC ratings (Oct 2010)
As well as reducing the costs we pay through the carbon reduction commitment, measures to increase energy efficiency will reduce energy costs, which is particularly important for the future given both the predicted increases in and the continued volatility of energy prices. Energy and fuel costs have seen a dramatic rise in recent years, with energy prices increasing by well over 50% since 2004. This trend is not expected to change and we must accept that the price we pay for our energy will continue to increase in the coming years.
As budgets have been reduced due to the current financial situation, the need for efficiency and cost saving is even more important. Carbon saving programmes that aim to reduce energy and fuel usage will also result in cost savings, helping ease budget cuts and assist in efficiency savings.
As a council we have signed the Nottingham Declaration, declaring our commitment to assess our emissions and to reduce them. The climate change programme is part of Transforming Warrington; this programme is a high profile agenda in the council for major change projects. This helps to embed carbon management across our whole organisation.
All of these factors are driving us as an authority to reduce our carbon emissions.
2.2 Targets and objectives The climate change board have set an aspirational target reduction of 40% of our 2009/2010 emissions by April 2015.
The act has resulted in a number of legislative drivers for local authorities:
• Display Energy Certificates: As of 1 October 2008 there has been a legal requirement for all public sector buildings with a total floor area of over 1,000m2, to show a Display Energy Certificate (DEC) in a prominent place, clearly visible to the public. The majority of our buildings are below the average C/D rating.
• Carbon Reduction Commitment: As of April 2012, we will pay £12 per tonne for the carbon that we emit. The CRC scheme will cost Warrington Borough Council around £390k a year. This additional cost will help to justify the case for carbon saving.
Rating Number of
DECs A 0 B 4 C 4 D 41 E 34 F 6 G 20

Warrington Borough Council Carbon Management Programme
Carbon Management Plan working with
Page 10
This is considerably more ambitious than previous targets, reflecting the increasing urgency of making deep cuts in carbon emissions to meet UK and global requirements.
During development of this carbon management plan, we have identified carbon reduction projects that are predicted to reduce our carbon emissions by 33%. These projects are discussed in section 4. During the five year duration of the plan, we will be reviewing our projects on a regular basis and tracking our progress against our target at least annually, to coincide with publishing our annual carbon footprint report.
We are confident that with the support of all Warrington staff, we will continue to identify projects to help us achieve the full target within the programme plan.
2.3 Strategic themes To achieve our goals we will work towards the following themes.
• Directly reducing our emissions: the main areas where we seek to reduce emissions are through our schools, our fleet and our street lighting; these are the areas where there is the greatest room for improvement
• Embedding the consideration of carbon: we intend to ensure that our policies and procedures consider the impacts on or of climate change and amend policies to consider impact on emissions where possible
• Investing to save carbon and save money: we will seek to increase the amount of funding for invest to save projects so that the council can pursue its carbon reduction target
• Raising awareness amongst staff: Communicating the importance of carbon reduction to all our staff and making them aware of our progress
• Form a partnership with schools to address their energy use Schools account for 40% of Warrington Borough Council’s carbon footprint. They are our hardest engagement area because their energy and asset management processes are often complex. Overcoming these difficulties to form an effective partnership with schools will feature heavily in our plans.
Carbon Reduction Target We have a set an aspirational target to reduce our 2009/10 carbon emissions by
40% by April 2015.

Warrington Borough Council Carbon Management Programme
Carbon Management Plan working with
Page 11
3 Emissions Baseline and Projections This section describes how we calculated our carbon footprint and breaks down for the reader where our carbon emissions come from and the potential for significant carbon savings.
3.1 Scope To develop our baseline and measure our carbon footprint we have included:
• Electricity consumption from our buildings and street lighting
• Gas and oil consumption from our buildings
• All staff business travel (by car, plane and train)
• Our fleet’s fuel consumption (petrol, diesel and gas oil)
• Water consumption from our buildings
• Waste produced from council buildings
Figure 5 Sectors included in our carbon footprint and those we wish to incorporate in the future
This has been based on what we are required to report for the carbon reduction commitment, what we previously reported for the expired National Indicator 185 and what other information we were able to collate.
Areas that have not been included in this scope:
• Warrington Borough Transport fleet fuel usage: We want more people to use the public transport network in Warrington, focusing on reducing the carbon emissions per passenger. Therefore overall fuel usage may remain fairly static; this is monitored through the climate change implementation group.
In 2009/10 Warrington Borough Council was responsible for the emission of 34,737 tonnes of CO2 costing the organisation around £7 million

Warrington Borough Council Carbon Management Programme
Carbon Management Plan working with
Page 12
• Golden Gates Social Housing: Since starting this programme a stock transfer has taken place and Golden Gates are now entirely independent from the council. They are developing their own energy reduction strategy.
• Outsourced activities from our care providers: We aim to work with our providers in the future to ensure they all monitor their emissions to allow us to fully declare ours.
• Staff commuting: The last staff travel survey was completed in 2007. This information is out of date therefore we have not included it. We have a travel to work policy and are looking to improve our understanding of commuting and include this in our scope at a later date.
• Refrigerants: Refrigerant usage is not significant at Warrington Borough Council and there are therefore no consistent records of usage. This will be monitored.
3.2 Carbon Baseline We have used the financial year 1st April 2009 to 31st March 2010 as our baseline year.
Table 3 and figure 1 show the source of our emissions. Our carbon footprint for 2009/2010 is 34,737 tonnes.
The largest portion of our emissions comes from our schools which account of 40% of our carbon footprint.
Setting the baseline for 2009/2010 just before the authority started going through a significant organisational change, provided us the opportunity to propose our changes alongside this.
Because of the organisational changes that are taking place it will be important to note the emissions per employee. As of the 31st March 2010 there were 8,912 people employed by the council (including teachers) making emissions per employee 3.9 tonnes.
CO2 (tonnes) %31,696 91%
Transport 2,635 8%Housing - 0%Further scope 407 1%
34,737 100%
Buildings and street lights
F th
Table 3 Summary table of emissions for Warrington Borough Council for baseline year 2009/10
Figure 1 Breakdown of emissions for Warrington Borough Council for baseline year

Warrington Borough Council Carbon Management Programme
Carbon Management Plan working with
Page 13
3.3 Display energy certificates The Display Energy Certificate or DECs can be used to show how energy efficient our buildings are. As you can see in Figure 6 most of our buildings that hold DECs are below average (under C), in some cases because they have high emissions and others because they have equipment like oil fired boilers.
Figure 7 shows that most of our buildings use less than average amounts of energy and it is just a small number of buildings that are using a lot of energy. We have an audit programme of our buildings to investigate where their energy consumption can be improved.
Figure 6 Numbers of buildings per DEC rating as of October 2010
Figure 7 DEC ratings versus carbon emissions of WBC buildings
0 5 10 15 20 25 30 35 40 45
Number of DECs
A
B
C
D
E
F
G
DEC
Rat
ing
A ra
ting
B ra
ting
C ra
ting
D ra
ting
E ra
ting
F ra
ting
G ra
ting
Average emissions
0
200
400
600
800
1,000
1,200
0 50 100 150 200
DEC Score
Emis
sion
s of
bui
ldin
g (t
CO
2)
Warrington Borough Council Carbon Management Programme
Carbon Management Plan working with
Page 14
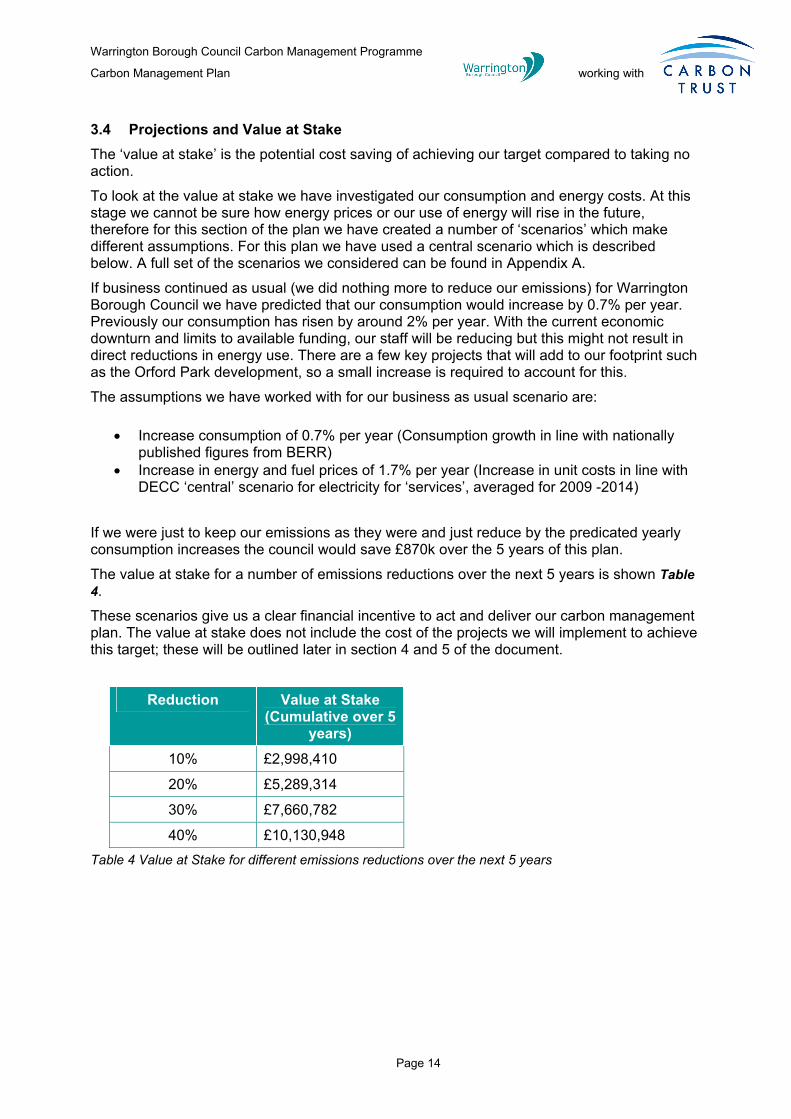
3.4 Projections and Value at Stake The ‘value at stake’ is the potential cost saving of achieving our target compared to taking no action.
To look at the value at stake we have investigated our consumption and energy costs. At this stage we cannot be sure how energy prices or our use of energy will rise in the future, therefore for this section of the plan we have created a number of ‘scenarios’ which make different assumptions. For this plan we have used a central scenario which is described below. A full set of the scenarios we considered can be found in Appendix A.
If business continued as usual (we did nothing more to reduce our emissions) for Warrington Borough Council we have predicted that our consumption would increase by 0.7% per year. Previously our consumption has risen by around 2% per year. With the current economic downturn and limits to available funding, our staff will be reducing but this might not result in direct reductions in energy use. There are a few key projects that will add to our footprint such as the Orford Park development, so a small increase is required to account for this.
The assumptions we have worked with for our business as usual scenario are:
• Increase consumption of 0.7% per year (Consumption growth in line with nationally published figures from BERR)
• Increase in energy and fuel prices of 1.7% per year (Increase in unit costs in line with DECC ‘central’ scenario for electricity for ‘services’, averaged for 2009 -2014)
If we were just to keep our emissions as they were and just reduce by the predicated yearly consumption increases the council would save £870k over the 5 years of this plan.
The value at stake for a number of emissions reductions over the next 5 years is shown Table 4.
These scenarios give us a clear financial incentive to act and deliver our carbon management plan. The value at stake does not include the cost of the projects we will implement to achieve this target; these will be outlined later in section 4 and 5 of the document.
Reduction Value at Stake (Cumulative over 5
years) 10% £2,998,410
20% £5,289,314
30% £7,660,782
40% £10,130,948 Table 4 Value at Stake for different emissions reductions over the next 5 years

Warrington Borough Council Carbon Management Programme
Carbon Management Plan working with
Page 15
If we do reduce our emissions by our target of 40%, the value at stake for Warrington Borough Council is just over £10 million over the next 5 years. This is illustrated in Figure 8. The business as usual (BaU) line with no action taken is the upper line. The lower line is where we would like to be. The value at stake is the difference between these two lines cumulatively over the five years.
Figure 8 The Value at Stake between acting and achieving our carbon reduction target of 40%, and continuing as usual
2010/2011 2011/2012 2012/2013 2013/2014 2014/2015
Yearly Value £ 727,593 £ 1,413,239 £ 2,060,791 £ 2,673,798 £ 3,255,528
Cumulative Value £ 727,593 £ 2,140,831 £ 4,201,622 £ 6,875,420 £ 10,130,948
Table 5 Representation of the Value at Stake graph
-
1,000,000
2,000,000
3,000,000
4,000,000
5,000,000
6,000,000
7,000,000
8,000,000
9,000,000
2009/10 2010/11 2011/12 2012/13 2013/14 2014/15Year
£
Actual cost BAU cost Target cost
} Value at stake is (cumulatively) over £10million
Warrington Borough Council Carbon Management Programme
Carbon Management Plan working with
Page 16
4 Carbon Management Projects The above statement makes clear how much carbon we have currently identified through a number of projects. The following sections will highlight those projects that have been delivered and the projects that we wish to deliver over the next 5 years.
The current carbon reduction projects identified represent a 33% reduction of our baseline. Whilst the current projects do not account for our full 40% reduction, we will endeavour to achieve it, continuing to identify carbon reduction projects as our situation changes. We will annually update our project sheets and make them publicly available.
Further detail about the projects listed in 4.2 and 4.3 can be found in appendix D.
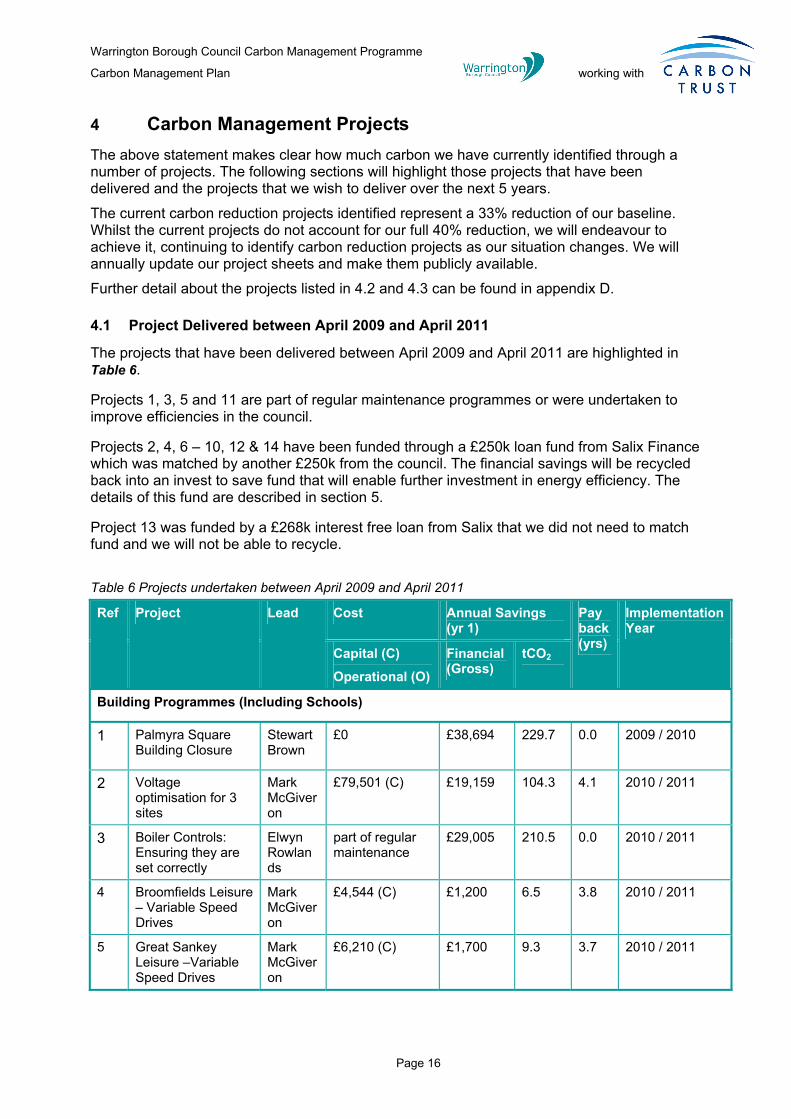
4.1 Project Delivered between April 2009 and April 2011
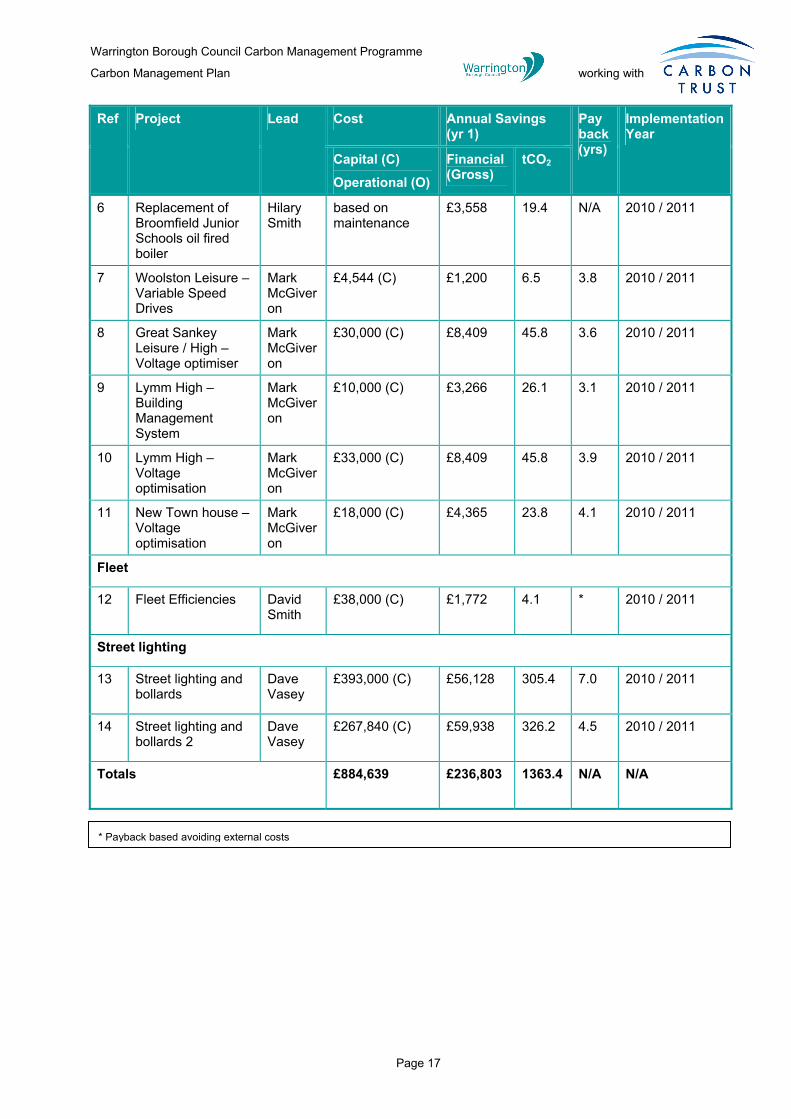
The projects that have been delivered between April 2009 and April 2011 are highlighted in Table 6.
Projects 1, 3, 5 and 11 are part of regular maintenance programmes or were undertaken to improve efficiencies in the council.
Projects 2, 4, 6 – 10, 12 & 14 have been funded through a £250k loan fund from Salix Finance which was matched by another £250k from the council. The financial savings will be recycled back into an invest to save fund that will enable further investment in energy efficiency. The details of this fund are described in section 5.
Project 13 was funded by a £268k interest free loan from Salix that we did not need to match fund and we will not be able to recycle.
Table 6 Projects undertaken between April 2009 and April 2011
Ref Project Lead Cost Annual Savings (yr 1)
Pay back (yrs)
Implementation Year
Capital (C) Operational (O)
Financial (Gross)
tCO2
Building Programmes (Including Schools)
1 Palmyra Square Building Closure
Stewart Brown
£0
£38,694 229.7 0.0 2009 / 2010
2 Voltage optimisation for 3 sites
Mark McGiveron
£79,501 (C)
£19,159 104.3 4.1 2010 / 2011
3 Boiler Controls: Ensuring they are set correctly
Elwyn Rowlands
part of regular maintenance
£29,005 210.5 0.0 2010 / 2011
4 Broomfields Leisure – Variable Speed Drives
Mark McGiveron
£4,544 (C)
£1,200 6.5 3.8 2010 / 2011
5 Great Sankey Leisure –Variable Speed Drives
Mark McGiveron
£6,210 (C)
£1,700 9.3 3.7 2010 / 2011
Warrington Borough Council Carbon Management Programme
Carbon Management Plan working with
Page 17
Ref Project Lead Cost Annual Savings (yr 1)
Pay back (yrs)
Implementation Year
Capital (C) Operational (O)
Financial (Gross)
tCO2
6 Replacement of Broomfield Junior Schools oil fired boiler
Hilary Smith
based on maintenance
£3,558 19.4 N/A 2010 / 2011
7 Woolston Leisure – Variable Speed Drives
Mark McGiveron
£4,544 (C)
£1,200 6.5 3.8 2010 / 2011
8 Great Sankey Leisure / High – Voltage optimiser
Mark McGiveron
£30,000 (C) £8,409 45.8 3.6 2010 / 2011
9 Lymm High – Building Management System
Mark McGiveron
£10,000 (C)
£3,266 26.1 3.1 2010 / 2011
10 Lymm High – Voltage optimisation
Mark McGiveron
£33,000 (C) £8,409 45.8 3.9 2010 / 2011
11 New Town house – Voltage optimisation
Mark McGiveron
£18,000 (C)
£4,365 23.8 4.1 2010 / 2011
Fleet
12 Fleet Efficiencies David Smith
£38,000 (C)
£1,772 4.1 * 2010 / 2011
Street lighting
13 Street lighting and bollards
Dave Vasey
£393,000 (C)
£56,128 305.4 7.0 2010 / 2011
14 Street lighting and bollards 2
Dave Vasey
£267,840 (C)
£59,938 326.2 4.5 2010 / 2011
Totals £884,639 £236,803 1363.4 N/A N/A
* Payback based avoiding external costs

Warrington Borough Council Carbon Management Programme
Carbon Management Plan working with
Page 18
4.2 Planned / funded projects From the Salix financing we received in 2010, we will have an invest to save ‘pot’ created from recycled funds that will be ring fenced for projects that payback with in 5 years. Project 31, the fleet electric vehicle has been funded by a DEFRA air quality grant.
We will also be receiving capital investment each year of £250k for invest to save projects. The projects outlined below will either be funded through the above, or create desirable efficiencies for the department on a cost basis or are relatively cost free (e.g. awareness raising) but will require policy changes or staff time.
Operational costs for building programmes have not been included as we have an internal building maintenance team that maintain systems as part of existing programmes. Operational costs are only included in new exceptional circumstances. Table 7 Funded projects for April 2011 to March 2015
Ref Project Lead Cost Annual Savings (yr 1)
Pay back (yrs)
Implementation Year
Capital (C)
Operational (O)
Financial (Gross)
tCO2
Building and Engagement Projects (Including schools)
15 5 Tanning Court – Voltage optimisation
Mark McGiveron
£24,000 (C)
£6,387 34.8 3.8 2010 / 2011
16 St Margaret’s Primary Rationalisation
Hilary Smith
Done for efficiencies
£12,495 73.2 N/A 2011/2012
17 Rationalisation of Bruche Primary
Hilary Smith
Done for efficiencies
£6,952 44.7 N/A 2011/2012
18 Rationalisation of Pupil Referral Unit
Hilary Smith
Based on maintenance
£39,702 266.3 N/A 2011/2012
19 New Build Chapelford Primary
Hilary Smith
Based on maintenance
£2,778 27.9 N/A 2011/2012
20 New Build Great Sankey Primary
Hilary Smith
Based on maintenance
£5,489 52.2 N/A 2011/2012
21 Schools Engagement Program
Hilary Smith
£500 (O) £106,967 674.3 0.0 2011/2012
22 Engagement: Eco-rep in each team
Laura Stanley
£500 (O) £69,893 380.3 0.0 2011/2012
23 Insulation: Flange and Value Insulation
Mark McGiveron
£117,849 (C)
£27,105 216.8 4.3 2011/2012
24 Broomfields Leisure –Building Management
Mark McGiveron
£18,000 (C)
£2,967 23.7 6.1 2011/2012

Warrington Borough Council Carbon Management Programme
Carbon Management Plan working with
Page 19
Ref Project Lead Cost Annual Savings (yr 1)
Pay back (yrs)
Implementation Year
Capital (C) Operational (O)
Financial (Gross)
tCO2
System
25 5 year building rationalisation
Stewart Brown
Based on Efficiencies
£33,214 204.8 N/A 2014/2015
26 Audits 7: 3 High School Energy Audits
Mark McGiveron
£32,230 (C) £37,787 232.9
Var
iabl
e du
e to
a n
umbe
r of d
iffer
ent p
roje
cts
the
maj
ority
pay
back
w
ithin
5 y
ears
These programmes will be implemented from April 2011 to March 2015 dependent on paybacks and funds available
27 Audits 1 Mark McGiveron
£140,500 (C)
£36,620 257.3
28 Audits 3: 20 schools energy audits
Mark McGiveron
£155,705 (C) £40,435 288.2
29 Audits 5: 12 schools energy audits & 1 recreation ground
Mark McGiveron
£31,317 (C) £8,375 59.1
30 Audits 6 Mark McGiveron
£356,000 (C)
£97,883 660.1
31 Audits 2 Mark McGiveron
£94,000 (C)
£24,846 151.7
32 Audits 4: 39 schools energy audits
Mark McGiveron
£147,686 (C) £38,420 273.7
33 Audits of libraries and C
Mark McGiveron
£108,708 (C)
£35,756 221.3
Business Travel
33 Package of Business Travel options
Steve Hunter / Ben Logan
£1,400 (C)
£1,070
£75,767 168.9 0.0 2012/2012
Fleet
35 Telematic System for Fleet
David Smith
£70,000
£58,043 133.9 1.2 2011/2012
36 Fleet electric vehicle
Rachel Waggett
£29,000 (C)
£1,205 2.8 Long Term Project
2011/2012

Warrington Borough Council Carbon Management Programme
Carbon Management Plan working with
Page 20
Ref Project Lead Cost Annual Savings (yr 1)
Pay back (yrs)
Implementation Year
Capital (C) Operational (O)
Financial (Gross)
tCO2
Waste
37 Corporate Waste Minimisation Strategy and implementation
Paul McHenry
N/A due to contracts
31.7 tCO2 N/A 2011 2011/2012
Water
38 Water 1: Save a Flush
Laura Stanley
£2,000 (C)
£18,934 3.2 0.1 2012/2013
Totals £1,388,395 £788,100 4,484 N/A N/A
4.3 Unfunded and Aspirational The following projects are ones that we hope to achieve over the next 5 years.
These are projects that we need to seek funding for or are of an aspirational nature that we would need to seek approval for or need to consult the public on.
We anticipate that this funding gap will be met by identification of external sources of funding, such as intermittent interest free loans and grants released by central Government. Table 8 Unfunded/aspirational projects for April 2011 to March 2015
Ref Project Lead Cost Annual Savings (yr 1)
Pay back (yrs)
Implementation Year
Capital (C)
Operational (O)
Financial (Gross)
tCO2
Building and Engagement Projects (Including Schools)
39 Boilers: Oil to gas boiler Conversion
Elwyn Rowlands / Hilary Smith
£1,690,000 (C) £80,508 453.4 17.7 Ongoing
40 Boilers 2: Oil to biomass boiler Conversion
Elwyn Rowlands / Hilary Smith
£430,000 (C) £27,935 273.1 15.4 Ongoing
41 Insulation 2: Cavity and loft insulation for schools
Mark McGiveron
£1,004,498 (C) £68,941 551.4 14.6 2012/2013
42 Bus Interchange: Lighting Replacement
Mark McGiveron
£46,000 (C) £5,385 29.3 8.5 2011/2012

Warrington Borough Council Carbon Management Programme
Carbon Management Plan working with
Page 21
Ref Project Lead Cost Annual Savings (yr 1)
Pay back (yrs)
Implementation Year
Capital (C) Operational (O)
Financial (Gross)
tCO2
43 Dedicated resource schools / energy management
Hilary Smith / Rachel Waggett
£26,383 (O) £106,967 674.3 0.0 2013/2014
Fleet
44 Fleet Replacement Strategy of RCV’s
David Smith
Based on maintenance
£161,207 372.9 0.0 2011/2012
Street Lighting
45 Street Lighting Bollard Replacement
Dave Vasey
£106,000 (C)
£15,341 83.5 6.9 2012/2013
46 Street Lighting Lantern Change Mercury Vapour Lamps
Dave Vasey
£117,000 (C) £31,283 170.2 3.7 2012/2013
47 Street Lighting Part Night Operation
Dave Vasey
£0 £311 1.7 0.0 2014/2015
48 Column Removal Dave Vasey
£0 £1,263 6.9 0.0 2013/2014
49 Street Lighting Sign Lantern Replacement
Dave Vasey
£115,000 (C)
£26,089 142.2 4.4 2013/2014
Totals £3,574,517 £525,230 2,759 N/A N/A
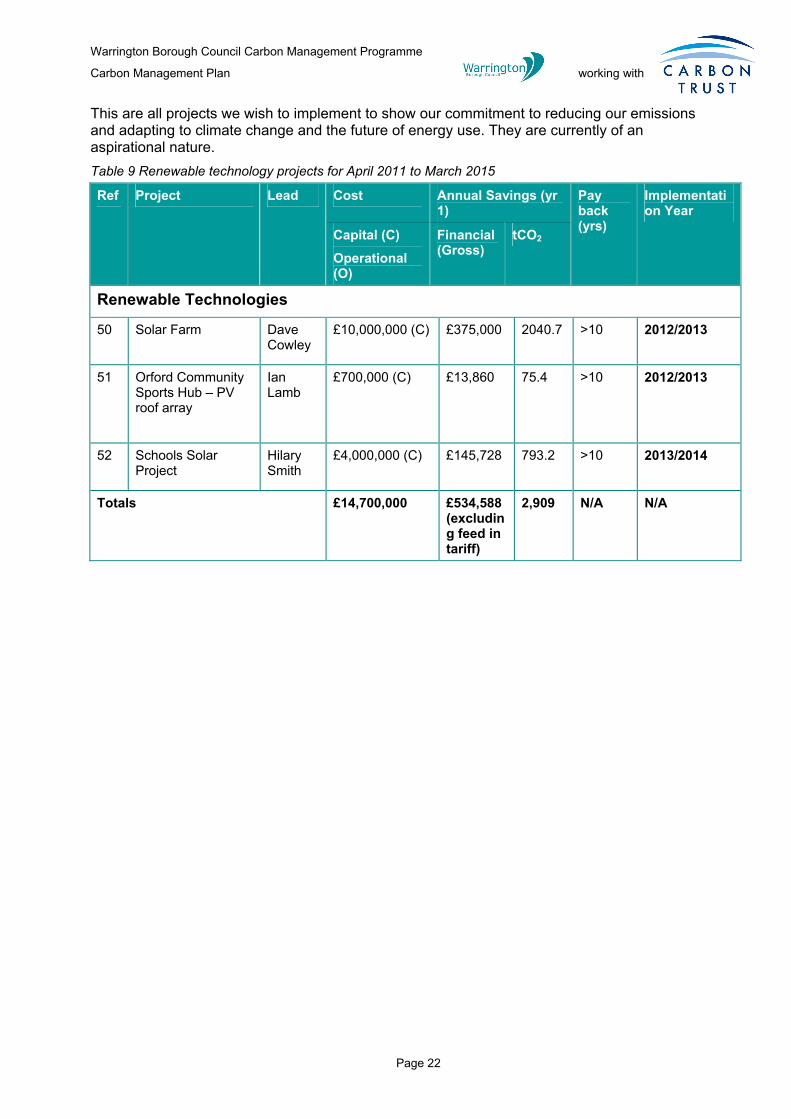
4.4 Renewable Technologies There are a number of reasons that renewable technologies have been separated out from the other projects. They are not as simple as invest to save and require more explanation.
The high cost of these projects would require the council to borrow finance to fund them. The figures below are estimates and do not include the additional costs of paying back the interest on the finance.
The savings do not show the income that is gained from the feed in tariff for renewable technology. This gives you a payment per kWh of energy produced. These large scale projects would create extra income from this feed in tariff, reducing payback periods and providing a long term income after this.
The solar farm project would also need public consultation as well as internal council approval and external financing.
Warrington Borough Council Carbon Management Programme
Carbon Management Plan working with
Page 22
This are all projects we wish to implement to show our commitment to reducing our emissions and adapting to climate change and the future of energy use. They are currently of an aspirational nature. Table 9 Renewable technology projects for April 2011 to March 2015
Ref Project Lead Cost Annual Savings (yr 1)
Pay back (yrs)
Implementation Year
Capital (C) Operational (O)
Financial (Gross)
tCO2
Renewable Technologies
50 Solar Farm Dave Cowley
£10,000,000 (C)
£375,000 2040.7 >10 2012/2013
51 Orford Community Sports Hub – PV roof array
Ian Lamb
£700,000 (C)
£13,860 75.4 >10 2012/2013
52 Schools Solar Project
Hilary Smith
£4,000,000 (C)
£145,728 793.2 >10 2013/2014
Totals £14,700,000 £534,588 (excluding feed in tariff)
2,909 N/A N/A

Warrington Borough Council Carbon Management Programme
Carbon Management Plan working with
Page 23
4.4 Projected achievement towards target To date we have identified a reduction of 33% of our 2009/10 carbon footprint highlighted in Figure 9. During the next 5 years we will seek to increase this reduction to at least 40% of our carbon footprint. Achieving our target will be reliant on funding being identified from a number of different internal and external sources. We will assess our progress annually and seek to identify further reductions and funding opportunities.
Figure 9 Planned progress towards our carbon reduction target
Carbon progress against target
-5,000
10,00015,00020,00025,00030,00035,00040,000
2010 2011 2012 2013 2014 2015
Year
Tonn
es C
O2
Predicted Business as Usual EmissionsTarget EmissionsEmissions in chosen plan

Warrington Borough Council Carbon Management Programme
Carbon Management Plan working with
Page 24
5 Carbon Management Plan Financing To deliver our carbon savings and make long term steps towards sustainability for Warrington Borough Council we need to make substantial investment. The following section outlines our current position with financing and resources, the different sources of funding we will seek to finance projects and the criteria we will use to judge which projects are a priority.
5.1 Assumptions
To calculate the cost savings of our projects, a number of cost assumptions and price predications were made.
• Average electricity rate for stationary sources in 2010 10p / kWh • Average gas rate for stationary sources in 2009 4p / kWh • Average cost of a litre of petrol in 2009 is 98p • Average cost of a litre of diesel in 2009 is 98p • Energy costs rise by 1.7% annually over the 5 years of the plan • Growth in CO2 emissions from Council estate is 0.7% per annum • 40% CO2 reduction target is achieved by a 9% reduction annually from year 2 (having
already identified 4% between April 2010 and March 2011).
5.2 Benefits / savings Quantifiable Benefits:
Each project identified that saves carbon will bring financial savings in terms of reduced energy bills. These savings can be broken down annually as shown in Table 10.
2009/2010 2010 /
2011 2011 / 2012
2012 / 2013 2013 / 2014
2014 / 2015
Annual cost saving
£38,694 £137,686 £945,879 £1,484,885 £1,903,248 £2,044,169
Annual CO2 saving
229.74 757.62 4827.76 7804.52 10369.09 11249.60
Table 10 Quantified Benefits and Savings of all projects
Non-quantifiable benefits:
• Enhance the council’s public image and green credentials
• Help the council adapt in the long term to changes in energy prices and pressures
• Leading the way for others in our community

Warrington Borough Council Carbon Management Programme
Carbon Management Plan working with
Page 25
5.3 Financial costs and sources of funding To deliver our management plan we will need to make substantial investment. There are a number of invest to save projects in our plan that will see paybacks in less than 10 years and there are a number of projects that are based on longer term investment and sustainability. Table 11 highlights the spread of this funding and the following paragraphs show where this funding will come from.
2010/11 2011/12 2012/13 2013/14 2014/15 Ongoing
Already spent £884,639
Funding for approved projects
£417,081 £323,081 £323,081 £323,081 £1,500,000(1)
Funding needing to be sourced
£46,000 £1,225,498 £141,383 £26,383 £2,120,000
Renewable Technology funding to be sourced
£3,000,000 £7,000,000 £1,000,000 £1,000,000 £3,000,000(2)
Table 11 Financial costs of projects in plan
Existing funding We have had success with securing a range of funding including Salix Loans and Salix recycled fund monies to implement a number of these projects as outlined in section 4.1.
The Salix finance recycled funding loan means we will have an ongoing source of funding available for future smaller scale projects using the reinvestment of energy savings generated by the current funded energy saving projects. Figure 10 demonstrates the Salix Recycling Fund process. Appendix A presents a worked example to illustrate the fund recycling process.
We have had success with securing some funding to implement a number of these projects, which has been outlined in Section 4.1. The Salix Finance recycled funding loan means we will have funding going back into a ‘pot’ to be reinvested as soon as the savings from projects are realised (see Figure 11).
Figure 10 The Salix recycling fund process
Notes
Assumption are prices correct at 2010/11 and do not include inflation
1. £250k per annum for a further 6 years
2. £1m per annum for a further 3 years

Warrington Borough Council Carbon Management Programme
Carbon Management Plan working with
Page 26
Figure 11 Salix recycled fund financing
Warrington Borough Council Capital Programme The council’s 10 year investment plan includes an annual notional capital budget of £250k for carbon reduction projects. Projects will be considered on an invest to save basis. WBC review the capital budget on a 6 monthly basis and if the opportunity arises there maybe more capital funding available.
We will be developing criteria to prioritise projects for funding, aiming to implement those with shorter payback periods sooner.
A key area for investment is in schools. We will be encouraging schools to identify potential projects for Salix investment. In addition we will be encouraging schools to seize any opportunities that may arise in their budgets to invest in energy reduction projects.
Operational costs for engagement programmes will be covered through team’s supplies and services budgets where they are of low monetary value.
Funding to be sourced For the reminder of our projects we will need to identify when funding streams become available and put in applications to help find the additional funding required. The climate change team will be able to assist teams who are looking to implement carbon reduction projects with their funding applications.
Prudential Borrowing is a source of funding that will need to be considered for large scale investment like the renewable projects. Salix loans requires a quick payback period therefore beneficial projects with longer paybacks and benefits can be considered, rather than limiting investigation to only short term projects. There may also be opportunities to identify Green Investment Bank funding in the future.
Future funding When further projects are identified to ensure we achieve our 40% reduction target, we will seek to identify funding either through current budgets or through new sources of funding that become available.
£0
£100,000
£200,000
£300,000
£400,000
£500,000
£600,000
year 1 year 2 year 3 year 4 year 5
Valu
e of
inve
st to
sav
e fu
nd
Invest to save fund Reinvested savings
Warrington Borough Council Carbon Management Programme
Carbon Management Plan working with
Page 27
6 Actions to Embed Carbon Management in the Organisation A key element of the Carbon Trust Programme is the management of change to embed carbon reduction into all the different parts of an organisation. If we are to be successful in achieving our carbon reduction targets, we will need everyone in the authority to work together towards this common goal. The Carbon Trust use a ‘carbon management matrix’ to illustrate the movement of an organisation between standard and best practice in carbon management (the matrix is reproduced in full in Appendix B). The matrix is designed to help organisations to embed carbon management across their organisation in 8 key areas:
• Corporate Strategy • Communication and Training
• Programme Management • Finance and Investment
• Responsibility • Policy Alignment
• Data Management • Engagement of schools
To embed carbon management across Warrington Borough Council we have sought to identify high level representatives to champion the key areas. Each of these representatives has pledged their support in achieving our carbon reduction objectives. We will monitor our progress in embedding carbon management within the organisation through our regular programme board, which is described in section 7.
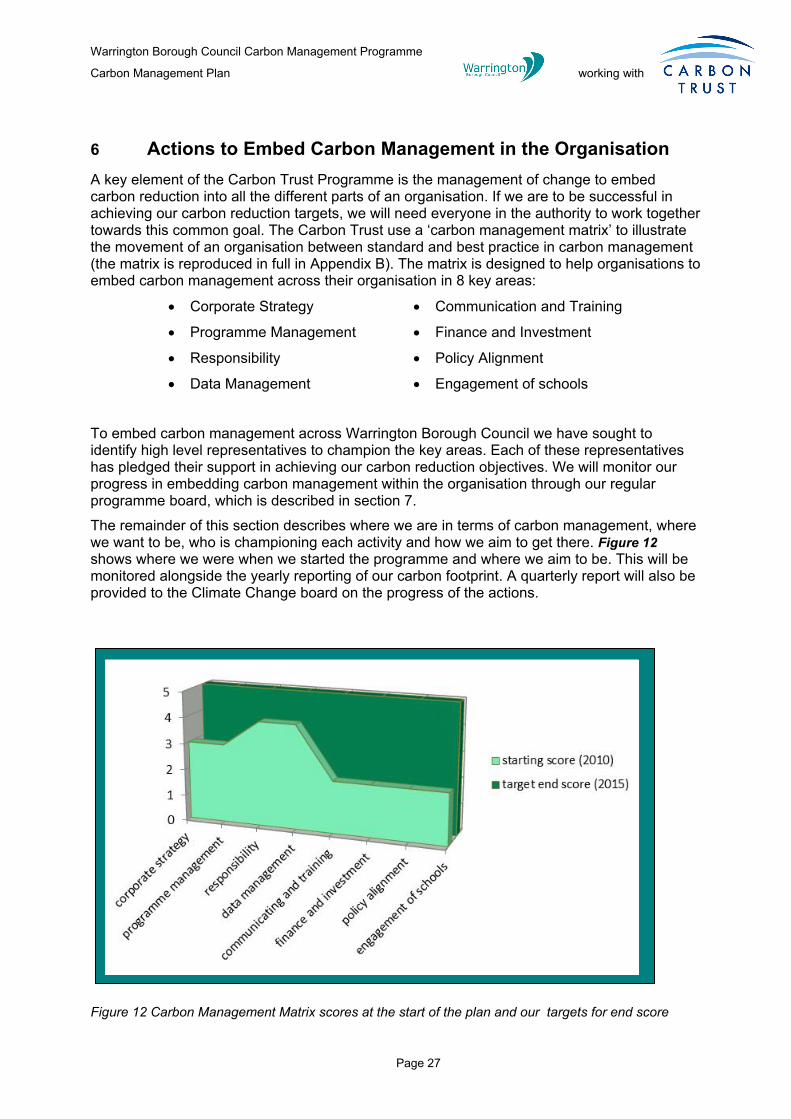
The remainder of this section describes where we are in terms of carbon management, where we want to be, who is championing each activity and how we aim to get there. Figure 12 shows where we were when we started the programme and where we aim to be. This will be monitored alongside the yearly reporting of our carbon footprint. A quarterly report will also be provided to the Climate Change board on the progress of the actions.
Figure 12 Carbon Management Matrix scores at the start of the plan and our targets for end score

Warrington Borough Council Carbon Management Programme
Carbon Management Plan working with
Page 28
6.1 Corporate Strategy – embedding CO2 saving across Warrington Borough Council
Target Level 5 by April 2013
Now Level 3
Owner Diana Terris, Chief Executive
We currently have a climate change strategy that has been signed off by the council. We have targets for CO2 reduction clearly stated in our corporate plan and sustainable communities strategy.
To achieve the Level 5 target, the executive board will agree the adoption of the high level targets embodied in this plan, and will ensure that these are distributed across all directorates. We will seek to refresh our climate change strategy in 2011 and incorporate action plans that are reviewed annually.
Each director will be required to ensure that carbon management is included in their directorate business plan. In turn, each service manager will ensure that their service plans contribute to and support the carbon targets by inclusion of actions and responsibilities applicable to their service area.
Actions are required from:
• Executive Board
• Directors
• Service Managers
6.2 Programme Management – bringing it all together effectively
Target Level 5 by April 2013
Now Level 3
Owner Anton Fields, Programme Manager, Transforming Warrington
Section 7 of this document outlines the core teams that we have working on carbon reduction.
The primary group tasked with management of this programme is the climate change board. The board is overseen and reports into the transformation board, which includes representation from all three political parties and Warrington Borough Council’s chief executive.
CORPORATE STRATEGY
5
Top level target allocated across organisation CO2 reduction targets in Directorate Business Plans Action plans in place to embed strategy. Progress routinely reviewed
4
CO2 reduction commitment in Corporate Strategy Top level targets set for CO2 reduction Climate Change Strategy reviewed annually
3
Vision for CO2 reduction clearly stated and published Climate Change Strategy endorsed by Cabinet and publicised with staff
2 Draft Climate Change Policy Climate Change references in other strategies
1 No policy No Climate Change reference

Warrington Borough Council Carbon Management Programme
Carbon Management Plan working with
Page 29
The transformation board reports in turn to the executive board, ensuring that the performance of the climate change programme will be safeguarded at the highest level.
The climate change team will provide reports every six weeks of performance against programme objectives to Transforming Warrington, which will enable oversight of all activities and progress to be made by the transformation board.
It is proposed to adopt the ‘Managing Successful Programmes’ (MSP) approach to the climate change programme to improve project management and accountability.
In addition, an annual review of progress against the carbon management plan will be made to cabinet in May each year in line with our carbon footprint for the previous financial year.
Actions are required from:
• Climate Change Board
• Transformation Board
6.3 Responsibility – being clear that saving CO2 is everyone’s job
Target Level 5 by April 2014
Now Level 4 (partial)
Owner Diana Terris, Chief Executive
There are currently over 100 green champions across Warrington Borough Council. We have 2 full time officers working on carbon reduction and a number of key individuals in other directorates of the council that sit on the climate change implementation group.
To achieve level 5, responsibility for integrating carbon management will be divided across the council. Section 6.1 describes the process that we will follow to embed responsibility from senior management team down to each head of service, and ultimately into the day to day activities of each person through their service plans.
Actions to provide a centralised advisory and information service will be co-ordinated by the climate change Manager and communications, through well maintained information portals.
Actions are required from: • Climate change board • Climate change manager • Climate change officer • Communications team
PROGRAMME MANAGEMENT
5
Cabinet / SMT review progress against targets on quarterly basis Regular diagnostic reports provided to Directorates Progress against target published externally
4
CO2 reduction commitment Sponsor reviews progress and removes blockages through regular Programme Boards Progress against targets routinely reported to Senior Mgt Team
3
Core team regularly review CM progress: o actions o profile & targets o new opportunities
2 Ad hoc reviews of CM actions progress
1 No CM monitoring
RESPONSIBILITY
5
CM integrated in responsibilities of senior managers CM part of all contracts / Ts & Cs Central CO2 reduction advice available Green Champions leading local action groups
4
CO2 reduction commitment CM integrated in to responsibilities of department heads Cabinet / SMT regularly updated Staff engaged though Green Champion network
3
An individual provides full time focus for CO2 reduction Key individuals have accountability for carbon reduction Senior Sponsor actively engaged
2 CO2 reduction a part-time responsibility of a few department champions
1 No recognised CO2 reduction responsibility

Warrington Borough Council Carbon Management Programme
Carbon Management Plan working with
Page 30
6.4 Data Management – measuring the difference, measuring the benefit
Target Level 5 by April 2012
Now Level 4
Owner Andy Farrall, Executive Director Environment & Regeneration
Data monitoring is already at a high standard, with collation on an annual basis of data and associated CO2 emissions from buildings, street lighting, transport, water and waste.
Annual data collation will occur after March each year and reported to the Climate Change Board, chaired by Andy Farrall and then upwards to senior management teams.
Targeting systems are being set in place for all buildings and for specific items such as business travel to improve our data. It is our intention to investigate and introduce external data verification within this programme plan.
Actions are required from:
• Department heads (collection of appropriate data)
• Climate change officer (collation and reporting)
• Energy officer
6.5 Communication and Training – ensuring everyone is aware
Target Level 5 by April 2014
Now Level 2
Owner Rachel Robins Director of People & Improvement
The communication and training currently at the council has been based around staff time. A presentation about the programme is given to new staff on the welcome to Warrington course and there is optional energy awareness training about home energy use for any front line staff.
Over the next 5 years we will introduce regular awareness campaigns and ensure that communication is a high priority. It will be scheduled into the yearly programme plan of the climate change team. Regular press stories will be issued to communicate successes to the wider community.
There is a yearly staff survey into which we will insert questions to test staff awareness on the carbon reduction programme.
The Green team will be extended with training formalised and they will be asked to disseminate this back to their teams.
COMMUNICATION & TRAINING
5
All staff given formalised CO2: o induction and training o communications Joint CM communications with key partners Staff awareness tested through surveys
4
All staff given CO2 reduction: o induction o communications o CM matters communicated to external community
3
Environmental / energy group(s) given ad hoc: o training o communications
2
Regular awareness campaigns Staff given CM information on ad-hoc basis
1 No communication or training reference
DATA MANAGEMENT
5
Regular collation of CO2 emissions for all sources Data externally verified Monitoring & Targeting in place for: o buildings o street lighting o transport/travel
4
Annual collation of CO2 emissions for: o buildings o street lighting o transport/travel Data internally reviewed
3 Collation of CO2 emissions for limited scope i.e. buildings only
2
No CO2 emissions data compiled Energy data compiled on a regular basis
1 No CO2 emissions data compiled

Warrington Borough Council Carbon Management Programme
Carbon Management Plan working with
Page 31
The people and improvement services have their own action plan to help them achieve this goal.
Action required from
• Climate change team
• Communications team
People and Improvement Carbon Management Action Plan
Owner – Rachel Robins
Action Target / Measure Timescale
Ensure that staff engagement panel is consulted about any climate change awareness campaigns and decisions that will affect staff
Feedback from staff recorded and evaluated
Ongoing
Consult staff through employee survey Awareness of environmental initiatives increase
Annually
Incorporate energy efficiency into existing and new staff training programmes where appropriate e.g. Premises managers
As stated December 2011
Work to raise awareness and ownership of carbon emissions through leadership programme and future leaders programme
Information on programmes
Ongoing
Employee Recognition Scheme to include recognition for delivering carbon reduction or identifying opportunities
As stated Ongoing
Warrington Rewards, ensure offers that can reduces staff’s personal carbon footprints are advertised
As stated Ongoing
Review directorate’s own policies to ensure climate change is considered
As stated December 2011

Warrington Borough Council Carbon Management Programme
Carbon Management Plan working with
Page 32
6.6 Finance and Investment – the money to match the commitment
Target Level 5 by April 2015
Now Level 2
Owner Lynton Green Chief Finance Officer
Over the past few years there has been ad hoc financing for CO2 reduction projects and match funding for the Salix invest to save fund.
Due to the current financial climate and uncertainty we are aiming to be at level 5 by 2015, in a position where each year we will be able to have finance committed for the next year for carbon reduction projects. We aspire to achieve level 5 within the programme plan; but since this is to some extent dependent on the national financial position, it will be reviewed in future years.
Since starting this programme it has been agreed that climate change invest to save project will receive £250k per year funding in the 10 year capital investment programme.
Action required from:
• Chief finance officer
• Climate Change Manager
6.7 Policy Alignment – saving CO2 across our operations
Target Level 5 by April 2015
Now Level 2
Owner Katherine Fairclough Assistant Chief Executive
There are only a few policies within the council that directly consider CO2; the local transport plan, the sustainable communities’ strategy and the climate change strategy are the main documents.
To get to level 5 and ensure that all key policies incorporate CO2 considerations we need to look at the corporate reporting process and aim to include a focus that takes into account CO2 and sustainability considerations, both positive and negative. This will ensure that when both new and current policies are created or reviewed that CO2 becomes a consideration. It will also allow us to monitor when a programme could have a big impact on our footprint.
The climate change team will be able to advise people on how to incorporate this into their plans and the reporting process will flag up when this is not being considered.
FINANCE & INVESTMENT
5
Finance committed for 2+yrs of Programme External funding being routinely obtained Ring-fenced fund for carbon reduction initiatives
4
Co-ordinated financing for projects via Programme Board Funding principles and processes agreed Finances committed 1year ahead Some external finance
3
A view of the cost of CO2 reduction is developing, but finance remains ad-hoc Some centralised resource allocated Finance representation on CM Team
2 Ad hoc financing for CO2 reduction projects
1 No specific funding for CO2 reduction projects
POLICY ALIGNMENT
5
CO2 friendly operating procedure in place Central team provide advice and review, when requested Barriers to CO2 reduction routinely considered and removed
4
Comprehensive review of policies complete Lower level policies reviewed locally Unpopular changes being considered
3
All high level and some mid level policies reviewed, irregularly Substantial changes made, showing CO2 savings
2 Partial review of key, high level policies Some financial quick wins made
1 No alignment of policies for CO2 reduction

Warrington Borough Council Carbon Management Programme
Carbon Management Plan working with
Page 33
Action from:
• Climate Change team
• Policy and Performance Teams
6.8 Engagement of Schools – working with Schools to reduce their carbon footprint
Schools are a key area for the council as they comprise the largest portion of our footprint at 40%. The value at stake for this area is £3,378,064, as illustrated in Figure 13.
The climate change team currently provide support and advice to those schools on the eco-schools programme and carbon reduction projects have been financed through external funding.
Children and Young People’s services have committed to delivering new schools which achieve BREEAM status Very Good or better. Since 2007 three new school buildings have been created which incorporate sustainable technologies for heating and lighting.
The introduction of the Carbon Trust Programme provided an opportunity for us to join-up our approach to
sustainability initiatives in all schools and the development of comprehensive individual school plans for 2011 and beyond.
An action plan will be produced during 2011 to ensure that both curriculum and energy consumption is addressed in schools, this program will be lead by Children and Young People’s Services Access and Assets Manager Hilary Smith.
Actions from:
• Climate change team
• Services access and assets manager – children’s services
Figure 13 Value at Stake for Schools
Target Level 5 by April 2015
Now Level 2
Owner Kath O’Dwyer Executive Director, Children and Young People’s Services
ENGAGEMENT OF SCHOOLS
5
A 'whole school approach' including curriculum Mature programme of engagement in place CO2 saving in schools having a wider community impact
4
A clear emphasis on energy / CO2 reduction in schools Council activities fully co-ordinated Broad set of education stakeholders engaged Funding in place
3
A person has responsibility for Schools CO2 reduction Schools CO2 reduction projects co-ordinated Ad-hoc funding
2 Ad-hoc schools projects to specifically reduce energy / CO2
1 No CO2 / energy reduction policy for schools
Comparison of emissions with BAU increases and reduction targets - financial
-
500,000
1,000,000
1,500,000
2,000,000
2,500,000
3,000,000
2009/10 2010/11 2011/12 2012/13 2013/14 2014/15Year
£
Actual cost BAU cost Target cost

Warrington Borough Council Carbon Management Programme
Carbon Management Plan working with
Page 34
7 Programme Management of the CM Programme To ensure that this 5 year management plan is delivered we need a team of people engaged at different levels and different directorates across our organisation. A cross cutting approach needs to be taken in order to fully embed carbon management across the organisation.
Successful programme governance can be summarised as:
• Having a strategic overview of our carbon reduction
• Aligning our organisational objectives to include carbon management
• Ensure key players are engaged and active
Figure 14 Organisational context of carbon management programme
7.1 The Programme Board – strategic ownership and oversight The programme board will meet every two months and ensure any blockages are removed from progressing the carbon management plan and make key decisions. The progress of the climate change implementation group will be reported to the board to ensure the carbon management plan continues to move forward. This will be done through a highlight report (Appendix C) produced by the climate change implementation group members and compiled by the climate change officer. The programme board minutes will be produced by the climate change officer and distributed to the board and the climate change implementation group. The board will decide when there is key information to be reported to the senior management team, and our organisational routes will be followed.

Warrington Borough Council Carbon Management Programme
Carbon Management Plan working with
Page 35
The Programme Board will comprise of:
Chair: Andy Farrall - Executive Director of Environment and Regeneration Cllr Mike Biggin – Executive member for climate change and public protection Lynton Green – Chief Finance Officer David Boyer – Assistant Director - Transportation, Engineering and Climate Change Rachel Waggett – Climate Change Manager Laura Stanley – Climate Change Officer
Figure 15 Organisational chart for carbon management programme
7.2 The Climate Change Implementation Group – delivering the projects The climate change implementation group will meet every two months, two weeks prior to the board meeting to enable the highlight report (Appendix C) to be produced for the board which identifies any progress made.
The climate change implementation group are responsible for delivering carbon reduction projects in their own areas. The group will report up to the climate change board through the climate change manager. The group membership will be reviewed regularly.
The climate change implementation group currently consists of people who cover areas that affect both our internal emissions and our borough’s emissions:
Chair: David Boyer - Assistant Director - Transportation, Engineering and Climate Change

Warrington Borough Council Carbon Management Programme
Carbon Management Plan working with
Page 36
Rachel Waggett - Climate Change Manager
Laura Stanley - Climate Change Officer
Elwyn Rowlands - Architect & Building Maintenance Unit Manager
Hilary Smith - Children and Young Peoples Services Access and Assets Manager
Stewart Brown - Chief Estate & Valuation Officer
Stephen Hunter - Service Manager - Strategic Transportation and Passenger Transport
Paul McHenry - Waste Strategy Development & Imp Manager
David Smith - Fleet Services & Vehicle Maintenance Manager
Stuart Sykes - Head Of Procurement
Alasdair Elder - Customer Services Manager (ICT)
Ben Logan - HR Information Analyst
Kevin Usher – Planning Policy Officer
Jane Critchley – Head of Neighbourhoods in Warrington
Dave Cowley – Head of Housing Services
Charlie Shannon – Warrington Borough Transport
Ian Robinson – Golden Gates Housing
7.2 Succession planning for key roles The carbon management plans implementation relies on the embedding of the program into the organisation and commitment from our team. Table 12 below shows the succession planning for our organisation.
Role Action to reduce risk Project Sponsor Ensure that councillor sponsor and senior management team are regularly
communicated to about the success of the carbon management plan and have full understanding. A series of briefing notes are being produced that will tell the story of the carbon management programme over time. If the project sponsor leaves then the person who takes this post will hold the agenda as part of their role.
Project Lead Ensure the programme board and implementation group own their aspects of the programme. Ensure deputy project lead is aware of any management decisions and project lead and deputy project lead communicate regularly about the project. As above this should eliminate any problems if the project lead was to leave.
Deputy Project Lead
The deputy project lead will produce a guidance note about where the components of the project are kept along with carbon trust guidance on how to use them. If this role was to be lost then those above or those replacing the post holder would be able to continue delivering the programme.
Table 12 Succession planning for key roles in Warrington Borough Councils carbon management plan
7.3 Ongoing stakeholder management To ensure ongoing stakeholder management we have worked with our communications team to produce a communications plan. This is shown in Table 13, and will be reviewed at each

Warrington Borough Council Carbon Management Programme
Carbon Management Plan working with
Page 37
climate change implementation group meeting to ensure that the group are delivering communications for good pieces of work.
Action Point Action Lead Timescale Audience
External communications
Press release Climate Change Team report to comms
Comms account manager/press team
As required All press
WIRE magazine Send articles in time for quarterly deadlines
Comms account manager/press team
As required All residents who receive WIRE magazine
Website Regular page updates Climate Change Team
Bi Annual All residents with access to the website
Relevant interest groups
Climate change team to update Low Carbon Lymm, Friends of the Earth and any new groups
Climate Change Team
Annually or as required
Interest groups
Stronger Together – Our Streets
Dependent on area, write articles when appropriate
Comms account manager
As required All residents in the Stronger Together area
Facebook & twitter
Regular updates on facebook and twitter
E-communications officer
Regular All residents with access to internet
Internal communications
Intranet Climate Change Team report to comms to get regular updates on front page
Communications
Regular All staff
Departmental Management Team briefings
Climate Change Team report to Senior management meetings.
Senior managers
Ongoing Departmental Managers
Member briefing Information to be included within member briefing. Information to be sent to Angela Horrigan
Climate Change Team
Monthly Members
Your Voice Feature in Your Voice – update.
Internal comms Monthly All staff
Customer contact centre
Brief staff in case of calls to contact Warrington following launch
Climate Change Team
All contact centre staff
Table 13 The climate change communications plan

Warrington Borough Council Carbon Management Programme
Carbon Management Plan working with
Page 38
7.4 Annual progress review With the abolishment of national indicators and at the time of writing there being no formal process for reporting our carbon emissions to government, there is no requirement for us report our emissions.
Climate change is part of the transforming Warrington programme and is high on the council’s agenda. As a result we will ensure that every April our yearly emissions are compiled and by June made public and reported to senior boards. This will consist of our carbon footprint, comparisons of consumption in each reportable area, cost savings, justifications for any changes and any wider sustainability achievement e.g. reductions in use of resources.
There are a number of internal performance indicators for climate change that means we will be regularly reporting the actions we are undertaking to reduce our emissions on a quarterly basis to members and senior managers. This can be used as an informal monitoring tool to ensure we reach yearly targets.
Warrington Borough Council Carbon Management Programme
Carbon Management Plan working with
Page 39
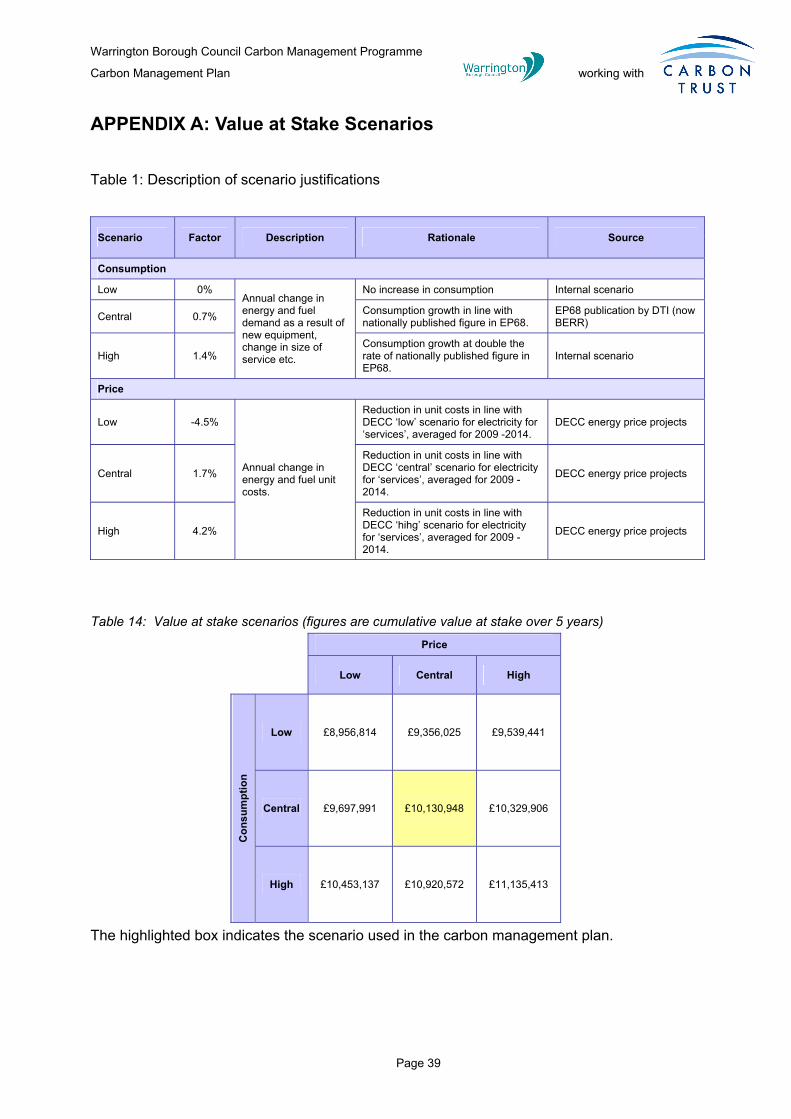
APPENDIX A: Value at Stake Scenarios
Table 1: Description of scenario justifications
Scenario Factor Description Rationale Source
Consumption
Low 0% Annual change in energy and fuel demand as a result of new equipment, change in size of service etc.
No increase in consumption Internal scenario
Central 0.7% Consumption growth in line with nationally published figure in EP68.
EP68 publication by DTI (now BERR)
High 1.4% Consumption growth at double the rate of nationally published figure in EP68.
Internal scenario
Price
Low -4.5%
Annual change in energy and fuel unit costs.
Reduction in unit costs in line with DECC ‘low’ scenario for electricity for ‘services’, averaged for 2009 -2014.
DECC energy price projects
Central 1.7%
Reduction in unit costs in line with DECC ‘central’ scenario for electricity for ‘services’, averaged for 2009 -2014.
DECC energy price projects
High 4.2%
Reduction in unit costs in line with DECC ‘hihg’ scenario for electricity for ‘services’, averaged for 2009 -2014.
DECC energy price projects
Table 14: Value at stake scenarios (figures are cumulative value at stake over 5 years)
Price
Low Central High
Con
sum
ptio
n
Low £8,956,814
£9,356,025
£9,539,441
Central £9,697,991
£10,130,948
£10,329,906
High £10,453,137 £10,920,572
£11,135,413
The highlighted box indicates the scenario used in the carbon management plan.

Warrington Borough Council Carbon Management Programme
Carbon Management Plan working with
Page 40
Salix Recycle Fund – worked example of project investment using this fund.
Project Cost£12,000 Loan Cumulative
Repayments Repayments(see notes)
WBC Ring £2,400 £2,400Funding Fenced £2,400 £4,800
Fund £2,400 £7,200Salix £2,400 £9,600Funding £500k £2,400 £12,000
Loan repayment 5 yearsNotes:Revenue Savings calcualted @ £3,200 per annum75% of reveune savings used to pay back into the fund @ £2,400
Project: Variable Speed Drive - Great Sankey Leisure Centre£12,000 project with 5 year payback

Warrington Borough Council Carbon Management Programme
Carbon Management Plan working with
Page 41
Appendix B: Carbon Management Matrix – Embedding
Now 3 3 4 4
In 5 yrs 5 5 5 5Challenge
CORPORATE STRATEGY
PROGRAMME MANAGEMENT
RESPONSIBILITY DATA MANAGEMENT
· Top level target allocated across organisation
· Cabinet / SMT review progress against targets on quarterly basis
· CM integrated in responsibilit ies of senior managers
· Regular collation of CO2 emissions for all sources
· CO2 reduction targets in Directorate Business Plans
· Regular diagnostic reports provided to Directorates
· CM part of all contracts / Ts & Cs
· Data externally verif ied
· Action plans in place to embed strategy. Progress routinely reviewed
· Progress against target published externally
· Central CO2 reduction advice av ailable
· Monitoring & Targeting in place for: o buildings
· Green Champions leading local action groups
o street lighting o transport/travel
· CO2 reduction commitment in Corporate Strategy
· Sponsor reviews progress and removes blockages through regular Programme Boards
· CM integrated in to responsibilit ies of department heads
· Annual collation of CO2 emissions for: o buildings o street lighting
· Top level targets set for CO2 reduction
· Progress against targets routinely reported to Senior Mgt Team
· Cabinet / SMT regularly updated
o transport/travel
· Climate Change Strategy reviewed annually
· Staff engaged though Green Champion network
· Data internally reviewed
· Vision for CO2 reduction clearly stated and published
· Core team regularly review CM progress: o actions o profile & targets
· An individual provides full time focus for CO2 reduction
· Collation of CO2 emissions for limited scope i.e. buildings only
· Climate Change Strategy endorsed by Cabinet and publicised with staff
o new opportunit ies · Key individuals have accountability for carbon reduction· Senior Sponsor actively engaged
· Draft Climate Change Policy
· No CO2 emissions data compiled
· Climate Change references in other strategies
· Energy data compiled on a regular basis
· No policy · No CO2 emissions data compiled
· No Climate Change reference
· Estimated billing
· No CM monitoring · No recognised CO2 reduction responsibility1
Start
Mature
5
4
3
2
· CO2 reduction a part-time responsibility of a few department champions
· Ad hoc reviews of CM actions progress

Warrington Borough Council Carbon Management Programme
Carbon Management Plan working with
Page 42
Now 2 2 2 2
In 5 yrs 5 4 5 5Challenge x x
COMMUNICATION & TRAINING
FINANCE & INVESTMENT POLICY ALIGNMENT * ENGAGEMENT OF SCHOOLS
· All staff giv en formalised CO2:
· Finance committed for 2+yrs of Programme
· CO2 friendly operating procedure in place
· A 'whole school approach' including curriculum
o induction and training o communications
· External funding being routinely obtained
· Central team provide adv ice and rev iew, when requested
· Mature programme of engagement in place
· Joint CM communications with key partners · Ring-fenced fund for
carbon reduction initiatives
· Barriers to CO2 reduction routinely considered and removed
· CO2 saving in schools hav ing a wider community impact
· Staff awareness tested through surveys
· All staff giv en CO2 reduction: o induction o communications
· Co-ordinated f inancing for CO2 reduction projects via Programme Board
· Comprehensive review of policies complete
· A clear emphasis on energy / CO2 reduction in schools
o CM matters ~ communicated to external community
· Funding principles and processes agreed
· Lower level policies reviewed locally
· Council activities fully co-ordinated
· Finances committed 1year ahead
· Unpopular changes being considered
· Broad set of education stakeholders engaged
· Some external financing · Funding in place
· Environmental / energy group(s) given ad hoc: o training o communications
· A view of the cost of CO2 reduction is developing, but finance remains ad-hoc
· All high level and some mid level policies rev iewed, irregularly
· A person has responsibility for Schools CO2 reduction
· Some centralised resource allocated
· Substantial changes made, showing CO2 sav ings
· Schools CO2 reduction projects co-ordinated
· Finance representation on CM Team
· Ad-hoc funding
· Regular awareness campaigns
· Part ial review of key, high level policies
· Staff given CM information on ad-hoc basis
· Some financial quick wins made
· No CO2 / energy reduction policy for schools
Mature
5
4
3
2
1
Start
· No communication or training
· No specific funding for CO2 reduction projects
· Ad hoc f inancing for CO2 reduction projects
· Ad-hoc schools projects to specif ically reduce energy / CO2
· No alignment of policies for CO2 reduction

Warrington Borough Council Carbon Management Programme
Carbon Management Plan working with
Page 43
Appendix C: Highlight Report Programme Name: Climate Change
Prepared by: Climate Change Officer
Date:
PID Version:
1. Programme Summary 7.4.1
Overall Status: Green1 Orange 2 Red 3 Reason for deviation / Board attention required
Asset management
- CRC
- Salix
- Estates energy
(Stewart Brown, Elwyn Rowlands, Rachel Waggett)
Schools (Hilary Smith)
Information technology (Alasdair Elder)
Carbon management programmes (Rachel Waggett)
- 10:10
- Cheshire Groups
- Carbon Trust LAMP
- EST 1 to 1
Sustainable land use patterns (Kevin Usher)
Travel and Transport (Steve Hunter, Ben Logan)
Street lighting (Dave Vassey)
Waste management (Paul Mchenry)
Fleet and Buses
(David Smith, Charlie Shannon)
Engagement (Jane Critchley, Rachel Waggett)
Domestic carbon (Dave Cowley)
Sustainable procurement
(Stuart Sykes)
Adaptation (Rachel Waggett)

Warrington Borough Council Carbon Management Programme
Carbon Management Plan working with
Page 44
1 Programme is within tolerance. 2 Programme is likely to or has deviated slightly from the plan or tolerance level. 3 Programme is likely to or has significantly behind plan or tolerance level.
Programme Manager’s Comments:
Carbon Savings to Date: Other Recordable figures:
2010 / 2011 Carbon Target
Asset Management (Elwyn Rowlands, Stewart Brown, Rachel Waggett)
Accomplishments during this Reporting Period
•
Plans during the next Reporting Period :
•
Items Requiring Management or Board Attention:
•
Recordable Carbon Savings or Engagement Figures
This continues for:
Information Technology
Carbon Management Programmes
Sustainable land use patterns
Sustainable mobility
Street lighting
Waste Management
Travel and Transport
Engagement
Domestic Carbon
Sustainable Procurement
Adaptation

Warrington Borough Council Carbon Management Programme
Carbon Management Plan working with
Page 45
Appendix D: Definition of Projects The project definition sheets over the remaining pages provide supplementary information and extra detail to section 4. They outline projects in more detail and the assumptions used to quantify them.
Building and Engagement Programmes
Project: Reference:
St Margaret’s Primary Rationalisation 16
Owner (person) Hilary Smith
Department Children and Young People
Description The existing St Margaret’s Primary School Junior building will be extended to consolidate the infant and junior provision on the same site. This will approximately double the size of the existing junior school. The infant school will then be closed.
The opportunity to improve carbon across the school has been taken, with the new extension meeting very high standards of energy efficiency. The retained element of the Junior school will also benefit from a new heating system and new lighting systems and controls.
Benefits • Financial savings: £3,328 per year
• Payback period: Immediate
• CO2 Emissions reduction: 80 tonnes per year
Funding • The energy efficiency measures have been included in this project without increasing the overall budget.
• Operational costs are likely to reduce rather than otherwise, therefore zero.
• Source of funding: internal.
• Decision to go ahead has been made.
Resources • Additional resource : advice from climate change team and planning team, delivered within current resources.
Ensuring Success
• Design team and client need to make sure that energy efficiency improvements remain in the project through implementation.
• Low risk as proven measures.
Measuring Success
• Electricity and gas meter readings/bills show a reduction in energy use against previous consumption.
• Annually at financial year end.
Timing • Milestones / key dates
o start date: July 2011
o completion date (when it will deliver savings): April 2012
Notes See attached calculation sheet. Projections of future energy use provided by Design Team.

Warrington Borough Council Carbon Management Programme
Carbon Management Plan working with
Page 46
Project: Reference:
Rationalisation of Bruche Primary
17
Owner (person)
Hilary Smith
Department Children and Young People
Description Demand for pupil places at Bruche has reduced from requirement for 420 in the past to 210 currently and foreseeable future. The school was accommodated across 2 separate infant and junior buildings but is now being rationalised into one building only. There is capital investment in the junior building currently in order to remodel and make it suitable for a 210 place primary school The infant building will be taken out of use and services disconnected..
Benefits • Financial savings: £6,952
• Payback period: 0 years
• CO2 Emissions reduction: 44.7 tonnes
Funding Approximately £500K to modernise and remodel the junior building.
Resources Central Government Grant: Primary Capital Programme
Ensuring Success
Infant building to be taken out of use to ensure that assets are fully utilised and resources used efficiently and effectively.
Measuring Success
Engagement with school community to ensure that the new primary school building is operated and maintained effectively and efficiently.
Timing Capital Project Completion: March 2011
Pupils and transfer transfer to new facility: April 2011
Benefits start to be realised with effect from April 2011
Notes Figures used to calculate carbon and cost savings
Before Rationalisation Energy for 2009/2010 Electricity 109,139
Gas 301,833
Floor area 2476
Energy per metre squared based on the above Electricity 44.07875606Gas 121.9034733
After Rationalisation (based on energy per square metre) Electricity 66647.07916Gas 184318.0517 Floor area 1512
Energy Saving Electricity 42,492Gas 117,515

Warrington Borough Council Carbon Management Programme
Carbon Management Plan working with
Page 47
Project:
Reference: Rationalisation of Horizons (Pupil Referral Unit)
18
Owner Hilary Smith
Department Children and Young People
Description Horizons is a short break provision for children with emotional and behavioural difficulties. The provision is currently located across two sites. Neither site is fit for purpose, buildings are in poor condition and heating and lighting systems are inefficient. In addition management and teaching staff spend a significant amount of time travelling between the two sites in order to deliver services to all pupils enrolled.
A former primary school, which is in reasonably good condition (significantly better than either of the 2 Horizon's sites) has become available following the close of the primary school in August 2010. The primary school building has sufficient capacity for all children and staff at Horizons to be accommodated under one roof. Consequently a project to remodel the primary school in order to make it fit for purpose for Horizons has been developed and will be implemented in June 2011 and completed at the end of 2011. Horizon staff and pupils will move into the facility in December 2011. In January 2012 the former Horizons buildings will be taken out of use.
Benefits Reduced carbon footprint as a result of (i) no requirement for management and teaching staff to move between sites in order to provide services to Horizon pupils; and (ii) improved quality environment and more energy efficient building.
• Financial savings: £39,702
• Payback period: 0 years
• CO2 Emissions reduction: 266.3 tonnes
Funding £500,000
Resources Central Government Capital Grant for Local Authorities.
Ensuring Success
Engagement with school community to ensure that the new facility is operated and maintained effectively and efficiently.
Measuring Success
Comparison of energy consumption for Horizons pre and post Implementation.
Timing Project implementation: June 2011 Project Completion: November 2011
Move to new facility: December 2011
Open on new site: effective from January 2012
Notes Figures used to calculate carbon and cost savings Horizons (Grappenhall Hall) 256,277 Kwh Elec 09/10 1,024,657 Kwh Gas 09/10 Horizons (Lousehers Lane) 26,272 Kwh Elec 09/10 Gas 09/10 New site (former Longbarn Primary School) 82,118 Kwh Elec 09/10 169,925 Kwh Gas 09/10
200,431 Kwh Elec Difference
854,732 Kwh Gas Difference

Warrington Borough Council Carbon Management Programme
Carbon Management Plan working with
Page 48
Project: Reference:
New Build Chapelford Primary School
19
Owner (person) Hilary Smith
Department Children & Young People’s Services
Description Design and Construction of a new build primary school at Chapelford to serve new community and to replace the existing Sycamore Lane Community Primary School.
The facility will replace existing facilities at Sycamore Lane when it is completed, currently planned for July 2012.
Benefits • CO2 Emissions reduction: 62.86 tonnes per year (see notes)
Funding • Within current budgets
Resources • Within current resources
Ensuring Success
• Carbon targets in Employer’s Requirements and other design requirements must be maintained throughout design and tender phase.
• Attention must be paid to maintaining energy efficiency of design during detailed design and construction, to ensure that achievements are maintained.
Measuring Success
• Measuring energy performance in early years of occupation.
• Year one, two and three following occupation.
Timing • Milestones / key dates e.g.
o start date: Start on site June 2011
o completion date (when it will deliver savings): September 2012
Notes The carbon benefits from this project involve the replacement of Sycamore Lane Community Primary with the new Chapelford Primary School.
Sycamore Lane CO2 07/08 elec (latest completed data) 09/10 gas
100 tonnes
Chapelford CO2 regulated emissions prediction (based on design target of 15kgCO2/m2/year with floor area 1650m2).
24.75 tonnes
Chapelford CO2 unregulated emissions prediction (assume 50% of regulated predicted emissions)
12.38 tonnes
Total predicted Chapelford CO2 emissions 37.13 tonnes
CO2 saving from project per year 62.86 tonnes

Warrington Borough Council Carbon Management Programme
Carbon Management Plan working with
Page 49
Project: Reference:
New Build Great Sankey Primary School
20
Owner (person) Hilary Smith
Department Children & Young People’s Services
Description Design and Construction of a new build primary school at Great Sankey to replace the existing Great Sankey Primary School on a new site.
The new school will replace existing facilities when it is completed, currently planned for July 2012.
Benefits • CO2 Emissions reduction: 409.47 tonnes per year (see notes)
Funding • Within current budgets
Resources • Within current resources
Ensuring Success
• Carbon targets in Employer’s Requirements and other design requirements must be maintained throughout design and tender phase.
• Attention must be paid to maintaining energy efficiency of design during detailed design and construction, to ensure that achievements are maintained.
Measuring Success
• Measuring energy performance in early years of occupation.
• Year one, two and three following occupation.
Timing • Milestones / key dates e.g.
o start date: Start on site June 2011
o completion date (when it will deliver savings): September 2012
Notes The carbon benefits from this project involve the replacement of the existing Great Sankey Primary School with a new school on an adjacent site.
Great Sankey (existing) CO2 09/10 (latest completed data)
452 tonnes
Great Sankey (new build) CO2 regulated emissions prediction (based on design target of 15kgCO2/m2/year with floor area 1890m2).
28.35 tonnes
Great Sankey (new build) CO2 unregulated emissions prediction (assume 50% of regulated predicted emissions)
14.18 tonnes
Total predicted Great Sankey (new build) CO2 emissions
42.53 tonnes
CO2 saving from project per year 409.47 tonnes

Warrington Borough Council Carbon Management Programme
Carbon Management Plan working with
Page 50
Project: Reference:
Schools Engagement Program
21
Owner (person) Hilary Smith
Department Children and young peoples services
Description Starting with the Secondary schools this program aims to support schools develop a carbon reduction plan. We will support schools on soft measures such as progressing with eco-schools and also provide support and advice on energy management. The program commenced in December 2010 with the secondary schools after this we will commence a similar approach with primary and special schools.
Benefits • Financial savings: £117,950
• CO2 Emissions reduction: 674 tonnes (5% of schools energy)
• Increased recycling and better use of natural resources
Funding • The project will be run with a minimal/no budget.
• Any funding that is required will come from CYPS Access and Asset Services or the climate change team.
Resources • Staff time from Access and Assets and climate change
• Staff time from schools business managers and teachers
Ensuring Success
• Key factors to success include: Buy in from schools Staff time to support schools
Measuring Success
• Schools energy consumption will be monitored during the program and measured at the end of each financial year.
• Quick wins and no cost measures will be identified and implementation monitored across the year. An impact assessment will be completed in year 2.
Timing Started on secondary schools: November 2010 All schools engaged: March 2012 Continual support after this time and the potential to develop a new program.

Warrington Borough Council Carbon Management Programme
Carbon Management Plan working with
Page 51
Project definition
ReferenceTitleDescription
OwnerDirectorate / teamDirector responsibleDate submitted
Carbon savings
Abated annual quantity
Units
Carbon source 1: 698,925 kWh/yrCarbon source 2:
Data quality
Quantification method
Financial
Capital cost Funding source(s)Annual operating cost £500Gross annual savings £55,914Net annual savings £55,414
Project start year 2011Year of first savings 2012Lifetime of project (years) 20
Payback period (years) * 0.0
Risk assessment
Risk item Probability Impact
Staff don't undertake roll fully
Medium Medium
Project status and next steps
Current Status of Project Enabling Actions to Change Status
Expand the Green team to ensure there is an eco-rep in each service within the authorityLaura Stanley
382,081
07 October 2010Andy Farrell
Conversion to kWh/year
(or tonnes for waste, or m3 for water)
698,925
Type of carbon source
Electricity (grid)
Eco-rep in each team22
Estimate given from carbon trusts deck of cards 5% saving of electricity energy (excluding streetlighting) from having active and engagement
Estimated costsGain approval to extend the green team with a report for assistant directors
Climate Change
2. Cheshire and Warrington Public Sector Carbon Management Group
Carbon savings(kgCO2/yr)
1. Climate supplies and services budget
Estimates
Steps to minimise probability Steps to minimise impact
Ensure full engagement Mointoring

Warrington Borough Council Carbon Management Programme
Carbon Management Plan working with
Page 52
Carbon savings
Abated annual quantity
Units
Carbon source 1: 1,178,493 kWh/yrCarbon source 2:
Data quality
Quantification method
Financial
Capital cost £117,849Annual operating costGross annual savings £27,105Net annual savings £27,105
Project start year 2011Year of first savings 2012Lifetime of project (years) 20
Payback period (years) * 4.3
Risk assessment
Risk item Probability Impact
Finance: Lack of capital investment
Medium High
Finance: Operational expense
Medium
Project status and next steps
Overall statusCurrent status of data
Save this file to:
Enabling actions to change status
Conversion to kWh/year
(or tonnes for waste, or m3 for water)
None identified
1,178,493
Estimates from RAP tool
Type of carbon source
Natural gas (kWh) 216,796
RAP tool estimate
* Note that this simple payback calculation only considers capital cost, maintenance cost, and revenues from abated energy use. Other cost factors may also be relevant (e.g. changing energy/fuel prices), and it is recommended that this calculation is che
Carbon savings(kgCO2/yr)
Estimates
[enter folder path here]
Cost based on cost per kwh of sites this technology has been identified suitable for
Green
Steps to minimise probability Steps to minimise impact
Look to identify existing capital budget. Seek

Warrington Borough Council Carbon Management Programme
Carbon Management Plan working with
Page 53
Project definition
ReferenceTitleDescription
OwnerDirectorate / teamDirector responsibleDate submitted
Carbon savings
Abated annual quantity
Units
Carbon source 1: 129,000 kWh/yrCarbon source 2:
Data quality
Quantification method
Financial
Capital cost £18,000Annual operating costGross annual savings £2,709Net annual savings £2,709
Project start year 2011Year of first savings 2012Lifetime of project (years) 20
Payback period (years) * 6.6
Risk assessment
Risk item Probability Impact
Finance: Lack of capital investment
Medium High
Project status and next steps
Overall statusCurrent status of data
As above
Mark McGiveron
23,731
20th January 2011Andy Farrell
Conversion to kWh/year
(or tonnes for waste, or m3 for water)
129,000
Type of carbon source
Natural gas (kWh)
Broomfields Leisure, Building Management System24
Estimated costsEnabling actions to change status
None identified
Research done for Salix Financing
Climate Change
Carbon savings(kgCO2/yr)
Estimates
Gain finance approval
Green
Steps to minimise probability Steps to minimise impact
Look to identify existing capital budget. Seek

Warrington Borough Council Carbon Management Programme
Carbon Management Plan working with
Page 54
Project: Reference:
Council office Accommodation strategy 25
Owner (person)
Stewart Brown
Department Environment & Regeneration, Estates & Valuation
Description To review and define the Councils short and medium term office accommodation needs
Benefits • Financial savings by rationalising its office accommodation, reducing building numbers and increasing utilisation amounts to be defined as the review takes form. Current spend for buildings we are looking to rationalise for energy & maintenance equate to nearly £300k over a 6 to 8 year period.
• If as rationalisation continues as currently planned, the electricity and gas for these buildings will be reduced, however electricity & gas will still be consumed within in an alternative building. Savings should be made, reasonable to project a 20% reduction. This equates to 75 tonnes of CO2.
• A number of public buildings are considered for closure (subject to consultation) with services not moved elsewhere. Savings here will equate to 145 tonnes.
• Total CO2 as of November 2010 – 220 tonnes
Funding • Operational costs, e.g. annual maintenance or running costs will be distributed across any buildings staffs are moved into.
Resources • This project will be delivered within current Estates staffing & financial planning resources
Ensuring Success
• Key success factors, senior management and Executive board approval, accurate projections on staffing needs over short and medium term, being able to dispose of surplus properties at full commercial rates.
• Principal risks: inaccurate staffing projections, lack of senior management or executive member approval to proposals, not being able to sell buildings.
Measuring Success
• Space audit results on staff utilisation and space given over to document storage.
• Reduced building budgets reflecting disposals of existing offices
• Annual space audit will show phased improvements of utilisation and rationalisation of offices
Timing • Milestones / key dates e.g.
o start date: spring 2011
o completion date (when it will deliver savings): Ongoing
Notes • Rationalisation will be an ongoing process to be reviewed annually in the current economic climate.

Warrington Borough Council Carbon Management Programme
Carbon Management Plan working with
Page 55
Project: Reference:
Energy Audits Program
26 - 32
Owner (person) Mark McGiveron
Department Environment and Regeneration
Description The audit program is looking at 108 council owned buildings. All assessments will be completed by March 2012. The audits identify projects that are suitable for individual sites such as voltage optimisation and variable speed drives. Example is provided below.
Benefits • Financial savings: £325,837
• Payback period: Various – Individual projects will have different payback periods. Majority of projects will payback in 5 years.
• CO2 Emissions reduction: 1,923 tonnes
Funding Total cost of project - £957,438
Funding mainly will be through the climate change capital funding through council budgets.
The current Salix invest to save pot can also be utilised.
This means all projects should be delivered by March 2014
Resources This project will be delivered by the current resources available
Ensuring Success
Need to make sure there is the budget is secured to deliver these projects
Need to work with partners to ensure those who have measures undertaken are willing to pay back.
Measuring Success
Energy will be monitored for buildings before and after projects are implemented
Timing • Start date: 01/04/2011
• Projects to be delivered on an ongoing basis
• completion date (when it will deliver savings): 31/03/2014
Notes To quantify the projects that have been identified through the audit program, the figures for energy saved from the surveyors has been used
Example of projects that come out of the energy audit program Project Potential Potential Possible
Building Project Type Project Budget kWh Cost PaybackCost Savings Savings
Lymm High Heating Cooling and Heating running at same time 200 14,000 294 0.68Lymm High Heating Recommission TREND BEMS 7,000 142,000 2,982 2.35Lymm High Lighting Replace Tungsten Lamps 500 4,361 362 1.38Lymm High pool Replace Pool Heat Exchanger 5,000 75,000 1,575 3.17Lymm High pool Reduce Filter Back wash 5,000 75,000 1,575 3.17Lymm High vsd VSD to Pool Pumps 7,000 35,000 2,905 2.41Lymm High pool Renew Pool Cover 18,000 250,000 5,250 3.43Lymm High Lighting Replace spot light to LEDs 650 2,175 181 3.60Lymm High insulation Block B roofing insulation 3,000 25,000 525 5.71Lymm High Lighting Lighting Controls, Zones and PIR 10,000 30,895 2,564 3.90Lymm High Lighting Replace Gym T12 Lighting to T5 850 1,951 162 5.25

Warrington Borough Council Carbon Management Programme
Carbon Management Plan working with
Page 56
Project: Reference:
Audit of Libraries and Community Centres to Identify Projects
33
Owner (person)
Mark McGiveron
Department Environment and Regeneration
Description Commission / Deliver an audit of our libraries and community centres which will in turn identify projects that will deliver carbon savings.
Benefits • Financial savings: £35,756
• Payback period: Various – Individual projects will have different payback periods. Majority of projects will payback in 5 years.
• CO2 Emissions reduction: 221 tonnes
Funding • Project cost - Audits £750 per audit based on 2010 prices - Projects £108,709
• Funding mainly will be capital funding through council capital budgets and the salix fund.
The current Salix invest to save pot can also be utilised.
Resources • The organisation of this project can be delivered within current resources
Ensuring Success
• To ensure success and minimise risk of this project it is vital that we secure funding for audits.
Measuring Success
• Audits delivered, projects implemented and delivering carbon savings
Timing • Milestones / key dates e.g.
o start date: April 2013
o completion date (when it will deliver savings): April 2014
A later start date for this project enables us to finish and implement the projects from the current audit programs.
Notes Total Gas usage for Libraries and Community Centres – 2,270279 Kwh
Total Electricity usage for Libraries and Community Centres – 1,265,617 Kwh
Assuming a 20% reduction as the current audit program is finding approximately this much per building
Total gas saving:454,055 Kwh
Total electricity saving: 253,123 Kwh
Previous Audits have shown projects cost about £492 per tonne
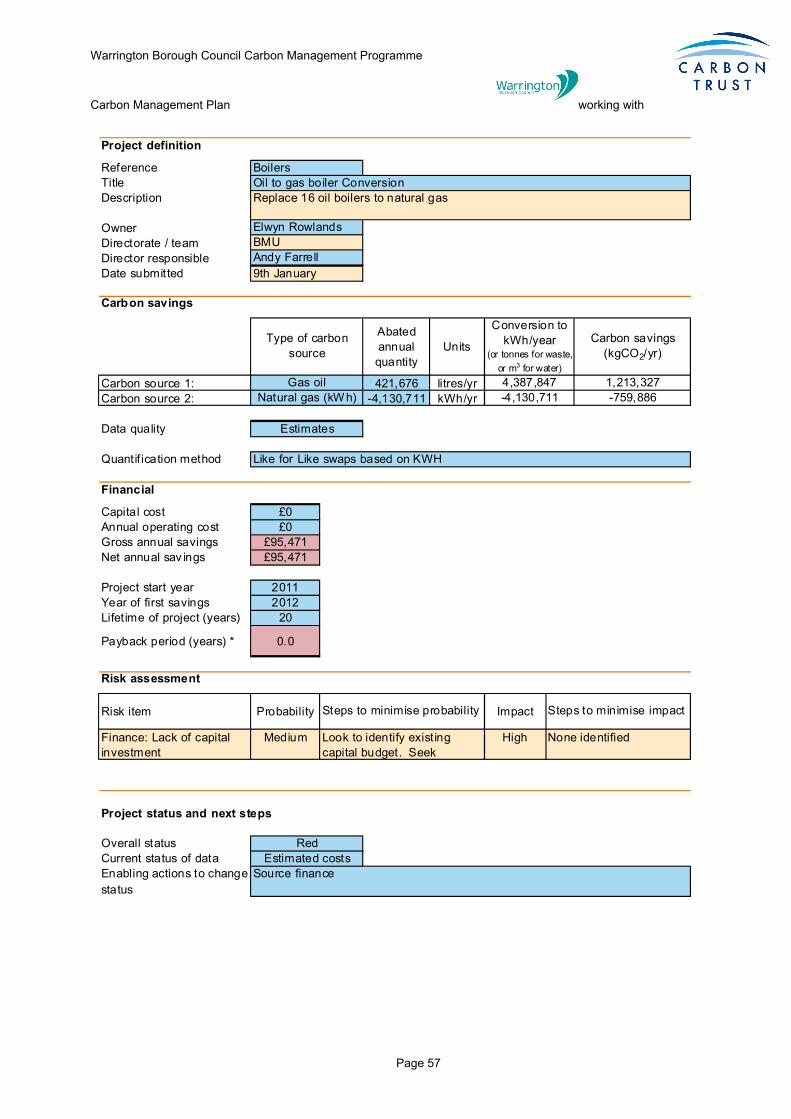
Warrington Borough Council Carbon Management Programme
Carbon Management Plan working with
Page 57
Project definition
ReferenceTitleDescription
OwnerDirectorate / teamDirector responsibleDate submitted
Carbon savings
Abated annual quantity
Units
Carbon source 1: 421,676 litres/yrCarbon source 2: -4,130,711 kWh/yr
Data quality
Quantif ication method
Financial
Capital cost £0Annual operating cost £0Gross annual savings £95,471Net annual sav ings £95,471
Project start year 2011Year of first savings 2012Lifetime of project (years) 20
Payback period (years) * 0.0
Risk assessment
Risk item Probability Impact
Finance: Lack of capital investment
Medium High
Project status and next steps
Overall statusCurrent status of data
Source finance
Red
Steps to minimise probability Steps to minimise impact
Look to identify existing capital budget. Seek
Estimated costs
Carbon savings(kgCO2/yr)
-759,886
Oil to gas boiler ConversionBoilers
Replace 16 oil boilers to natural gas
Elwyn Rowlands
1,213,327
9th JanuaryAndy FarrellBMU
Enabling actions to change status
Natural gas (kW h)
Conversion to kWh/year
(or tonnes for waste, or m3 for water)
None identified
4,387,847
Like for Like swaps based on KWH
-4,130,711
Type of carbon source
Gas oil
Estimates

Warrington Borough Council Carbon Management Programme
Carbon Management Plan working with
Page 58
Project definition
ReferenceTitleDescription
OwnerDirectorate / teamDirector responsibleDate submitted
Carbon savings
Abated annual quantity
Units
Carbon source 1: 103,750 litres/yrCarbon source 2: -342 tonnes/yr
Data quality
Quantif ication method
Financial
Capital cost £30,000Annual operating cost £0Gross annual savings £27,935Net annual sav ings £27,935
Project start year 2011Year of first savings 2012Lifetime of project (years) 20
Payback period (years) * 1.1 Just bas
Risk assessment
Risk item Probability Impact
Finance: Lack of capital investment
Medium High
Project status and next steps
Overall statusCurrent status of data
Estimates
Seek Finance and source biomass supplier
Red
Steps to minimise probability Steps to minimise impact
Look to identify existing capital budget. Seek
Estimated costs
Carbon savings(kgCO2/yr)
-25,415
Oil to biomass boiler ConversionBoilers 2
Replace 3 oil boilers to biomass in those buildings that don't have gas supplies alreadyElwyn Rowlands
298,529
18th January 2011Andy FarrellEnv and Regen
Enabling actions to change status
Wood
Conversion to kWh/year
(or tonnes for waste, or m3 for water)
None identified
1,079,595
Like for Like swaps based on KWH
-1,016,581
Type of carbon source
Gas oil

Warrington Borough Council Carbon Management Programme
Carbon Management Plan working with
Page 59
Project definition
ReferenceTitleDescription
OwnerDirectorate / teamDirector responsibleDate submitted
Carbon savings
Abated annual quantity
Units
Carbon source 1: 2,997,442 kWh/yrCarbon source 2:
Data quality
Quantification method
Financial
Capital cost £1,004,498Annual operating costGross annual savings £62,946Net annual savings £62,946
Project start year 2011Year of first savings 2012Lifetime of project (years) 20
Payback period (years) * 16.0
Risk assessment
Risk item Probability Impact
Finance: Lack of capital investment
Medium High
Finance: Operational expense
Medium
Project status and next steps
Overall statusCurrent status of data Enabling actions to change status
Conversion to kWh/year
(or tonnes for waste, or m3 for water)
None identified
2,997,442
Estimates from RAP tool and cost based on cost of insulation per m2 of a current quote for insulating high school
Type of carbon source
Natural gas (kWh)
Improving the cavity and loft insulation of our schools. We have estimated that half of our schools estate would need significant improvementMark McGiveron
551,409
20th January 2011Andy FarrellEstates
Cavity and loft insulation for schools41
RAP tool estimate
Carbon savings(kgCO2/yr)
Estimates
Look at finance optionsGet acurate quote - likely to come in lower if a large scheme was tendered.
Red
Steps to minimise probability Steps to minimise impact
Look to identify existing capital budget. Seek

Warrington Borough Council Carbon Management Programme
Carbon Management Plan working with
Page 60
Project definition
ReferenceTitleDescription
OwnerDirectorate / teamDirector responsibleDate submitted
Carbon savings
Abated annual quantity
Units
Carbon source 1: 53,845 kWh/yrCarbon source 2:
Data quality
Quantification method
Financial
Capital cost £46,000Annual operating costGross annual savings £5,385Net annual savings £5,385
Project start year 2011Year of first savings 2012Lifetime of project (years) 20
Payback period (years) * 8.5
Risk assessment
Risk item Probability Impact
Finance: Lack of capital investment
Medium High
New survey yields longer payback period
High Medium
Project status and next steps
Overall statusCurrent status of data Enabling actions to change status
Conversion to kWh/year
(or tonnes for waste, or m3 for water)
None identified
53,845
Estimates given from site survey by company in 2009
Type of carbon source
Electricity (grid)
None identified
As above
Tony Cross
29,435
19 January 2011Andy FarrellTransport
Bus Interchange Lighting Replacement42
Estimated costs
Dependent on funded
Carbon savings(kgCO2/yr)
Estimates
Get survey re-done with new Estimates
Red
Steps to minimise probability Steps to minimise impact
Look to identify existing capital budget. Seek
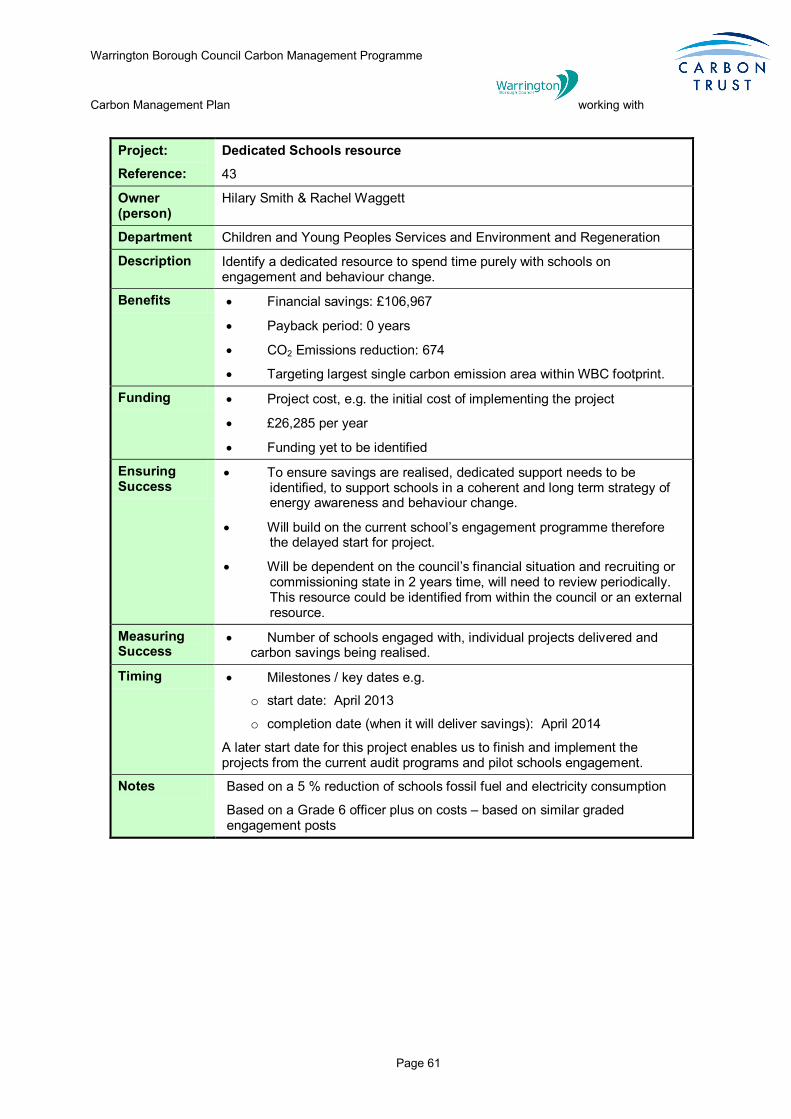
Warrington Borough Council Carbon Management Programme
Carbon Management Plan working with
Page 61
Project: Reference:
Dedicated Schools resource
43
Owner (person)
Hilary Smith & Rachel Waggett
Department Children and Young Peoples Services and Environment and Regeneration
Description Identify a dedicated resource to spend time purely with schools on engagement and behaviour change.
Benefits • Financial savings: £106,967
• Payback period: 0 years
• CO2 Emissions reduction: 674
• Targeting largest single carbon emission area within WBC footprint.
Funding • Project cost, e.g. the initial cost of implementing the project
• £26,285 per year
• Funding yet to be identified
Ensuring Success
• To ensure savings are realised, dedicated support needs to be identified, to support schools in a coherent and long term strategy of energy awareness and behaviour change.
• Will build on the current school’s engagement programme therefore the delayed start for project.
• Will be dependent on the council’s financial situation and recruiting or commissioning state in 2 years time, will need to review periodically. This resource could be identified from within the council or an external resource.
Measuring Success
• Number of schools engaged with, individual projects delivered and carbon savings being realised.
Timing • Milestones / key dates e.g.
o start date: April 2013
o completion date (when it will deliver savings): April 2014
A later start date for this project enables us to finish and implement the projects from the current audit programs and pilot schools engagement.
Notes Based on a 5 % reduction of schools fossil fuel and electricity consumption
Based on a Grade 6 officer plus on costs – based on similar graded engagement posts

Warrington Borough Council Carbon Management Programme
Carbon Management Plan working with
Page 62
Business travel – 34 The package of business travel options contains a number of different proposals which are outlined over the next few pages
Project: Reference:
Ways to Travel
34
Owner (person) Stephen Hunter / Ben Logan
Department Transport, Engineering, Climate Change / People and Improvement
Description Looking at the way staff travel will be split into a number of programs. This element of the program looks at awareness raising of travel alternative through a web travel portal, that will highlight travel alternatives. The other element will be a policy to be issued and enforced by managers across all directorates that gets staff to reduce their car travel modes.
Benefits • CO2 Emissions reduction: 5 % of business travel for the travel portal and 10% for the enforcement of alternative travel. 102 tonnes
• Financial savings to be measured
Funding • Travel portal development is being developed and funded through the Cheshire and Warrington public sector carbon management group.
Resources • The projects will be delivered from staff within smarter choices, climate change and people and improvement
Ensuring Success
• The key issue with this program will be ensuring that there is buy in from the very top, otherwise mangers lower down will not be motivated to enforce travel policy.
Measuring Success
• Reduction in car business mileage and flights will show success. As will the monitoring of bicycle users, IT technology and train travel.
• Travel will be monitored yearly.
Timing Start work: April 2011 Deliver savings: from October 2011

Warrington Borough Council Carbon Management Programme
Carbon Management Plan working with
Page 63
Project: Reference:
Pool Bus Pass
34
Owner (person) Stephen Hunter
Department Transport, Engineering and Climate Change
Description Annual bus pass available to be used by all staff in New Town House and Quattro, can be booked in the same way as pool cars.
Benefits • Financial savings: £670 per year
• Payback period: 1 year
• CO2 Emissions reduction: 5 tonnes
Funding • Project cost: £460 for an annual network bus pass
• Source of funding: Internal Travel Budgets
Resources • Booking will be managed by Business Support, useage will be monitored by smarter choices team
Ensuring Success
• Making sure the pass is utilised through promotion and awareness is key.
Measuring Success
• Number of miles travelled with the bus pass is comparable to a reduction in business mileage
Timing Purchase Pass: April 2011
Monitor usage and report back April 2012

Warrington Borough Council Carbon Management Programme
Carbon Management Plan working with
Page 64
Project: Reference:
Pool bikes & cycle training
34
Owner (person) Lesley McAllister
Department Strategic Transportation
Description The provision, management, maintenance and promotion of a pool of bicycles for short business journeys to reduce the need to bring and use car for work, and training for staff to ensure safety and competency.
Benefits • Financial savings: savings cost of car mileage 65p/mile
• Payback period: Year 1 onwards
• CO2 Emissions reduction: as part of package
• Healthier workforce
Funding • Project cost - £1400
• Operational costs - £400 per annum maintenance & £200 per annum training costs
• Source of funding: Unknown at present
• Internal decision on funding between Jan & March 2011
Resources Can be delivered by current resources (Smarter Choices team)
Ensuring Success
• Funding stream to be made available for purchase and maintenance of bikes and training of staff.
• Principal risks:- Bikes fall into disrepair due to lack of maintenance funding, strong management line to ensure bikes are considered and used for short journeys.
Measuring Success
• Measure - no. and length of car journeys replaced by cycling.
• Measured monthly/annually
Timing • Milestones / key dates e.g.
o Poss start date: 01/04/2011
o completion date (when it will deliver savings): 01/04/2012
o interim deliverable / decision points 01/10/2011
You could also lay these out as a milestone chart for ease and clarity.
Break the timescale down into a handful of milestone points so progress can be measured
Notes Explain sources used for quantification
Any further notes that will help the reader understand the project/initiative.

Warrington Borough Council Carbon Management Programme
Carbon Management Plan working with
Page 65
Project: Reference:
Staff Travel Survey
34
Owner (person) Lesley McAllister
Department Strategic Transportation
Description A survey of all staff to determine current mode of travel to and for work and what will be required to change and reduce car use.
Benefits • Enables measurement of current and future travel habits
• Identifies additional measures needed to enable change
• Raises awareness.
Funding • Project cost – staff time (Smarter Choices, IT & communications)
• Internal decision by end March 2011
Resources Can be delivered by current resources
Ensuring Success
• Strong senior management line to ensure completion.
• Principal risks:- non-completion of questionnaire by staff
Measuring Success
• Measure – high percentage of completion.
• On completion, and every two years.
Timing • Milestones / key dates e.g.
o Poss start date - August 2011
o completion date - August 2011
o Reporting – October 2011
Notes Explain sources used for quantification
Any further notes that will help the reader understand the project/initiative.

Warrington Borough Council Carbon Management Programme
Carbon Management Plan working with
Page 66
Fleet
Project definition
ReferenceTitleDescription
OwnerDirectorate / teamDirector responsibleDate submitted
Carbon savings
Abated annual quantity
Units
Carbon source 1: 11,016 litres/yrCarbon source 2:
Data quality
Quantification method
Financial
Capital cost £29,000Annual operating costGross annual savings £12,075Net annual savings £12,075
Project start year 2011Year of first savings 2012Lifetime of project (years) 10
Payback period (years) * 2.4
Risk assessment
Risk item Probability Impact
Finance: Operational expense
Medium High
Project status and next steps
Overall statusCurrent status of data
Conversion to kWh/year
(or tonnes for waste, or m3 for water)
None identified
110,425
Data from emissions of vehicle to be replaced by electric vehicle.
Type of carbon source
Diesel
Replacement of diesel vehicle with electrically fuelled vehicle.
Rachel Waggett/Dave Smith
27,935
20th January 2011Andy FarrallClimate Change
Fleet electric courier vehicleFleet
Estimated costs
Carbon savings(kgCO2/yr)
Actual
Green
Steps to minimise probability Steps to minimise impact
Maintenance contract for 2 years included in purchase price.

Warrington Borough Council Carbon Management Programme
Carbon Management Plan working with
Page 67
Project: Reference:
Fleet Telematic System
35
Owner (person) David Smith
Department Fleet Services
Description The required system will be a real time web based vehicle and plant telematics and tracking system. Scope of the requirements fall into three main categories of asset tracking, telematics and data reporting.
Benefits • Financial savings: £ 58,043
• Payback period: 1.2 years
• CO2 Emissions reduction: 133.9 tonnes of CO2
• Multiple benefits should be derived from the introduction of the system inclusive of;
o Fuel savings
o Greater fleet efficiency through improved utilisation
o Improved customer service
Funding • Purchase Cost: Estimated cost of £1,000 per unit, estimated cost £70,000
• Operational Cost: Data charges estimated to be £25 per month per unit.
• Source of funding: Waste Capital Programme
• Decision on capital already made currently out to tender.
Resources • Project will be delivered within current resources. Selected supplier providing additional resource during installation and launch.
Ensuring Success
• Key success factors: Data analysis is key with results forming part of the decision making process for fleet efficiencies.
• Principal risks: Expectation of system requirements are not fully met by supplier base. Anticipated efficiencies are not fully achieved.
Measuring Success
• Operational KPI’s. Increased fleet utilisation. Reduction in fuel usage.
• Monthly performance indicators and annual analysis of fuel spend.
Timing • Milestones / key dates e.g.
o Invitation to tender December 2010
o Contract award: March 2011
Notes Based on a 10% fuel saving for 70% of the fleet.

Warrington Borough Council Carbon Management Programme
Carbon Management Plan working with
Page 68
Project: Reference:
Fleet Replacement Strategy of RCV’s
44
Owner (person) David Smith
Department Fleet Services
Description Delivery of a fleet replacement strategy for refuse vehicles. Strategy is to maintain a maximum 7 year asset life through replacing 5 vehicles per annum progressing to an in life position by 2015. Current position of fleet is 44% out of life with 28% being 14 years old.
Benefits • Financial savings: £ 161,207
• CO2 Emissions reduction: 373 tonnes of CO2
Funding • Project cost: £700,000 per annum.
• Operational costs: Reduced operational costs from current position in addition to increased operational efficiency.
• Source of funding: Capital funding bid.
• Funding decision: Budget finalisation Feb 2011.
Resources • Additional resource: No additional resource is anticipated. Current internal Fleet Services / VMU resources will be utilised to deliver the replacement programme as part of a wider fleet replacement strategy.
Ensuring Success
• Key success factors: Capital budget approval.
• Principal risks: Capital budget approval is declined.
Measuring Success
• Metrics for displaying performance: Age profile of fleet.
• When success will be measured / evaluated: Annually within reporting structure.
Timing • Milestones / key dates e.g.
o start date: 01/04/2011
o completion date (when it will deliver savings): On going with savings achieved from point of delivery of new and removal of old assets from fleet.
Notes Using an estimate based on the Carbon Trusts RAP tool for 85% of the refuse fleet

Warrington Borough Council Carbon Management Programme
Carbon Management Plan working with
Page 69
Waste
Project: Reference:
Corporate Waste Minimisation Strategy and implementation
37
Owner (person) Paul McHenry
Department Waste Management
Description Develop and implement an authority wide waste minimisation strategy and action plan. This strategy would cover all the authority’s waste streams and would be developed in line with moving towards more desirable and sustainable elements of the Waste Hierarchy. This would mean the maximisation of recycling and the reuse and reduction of all waste whenever possible.
Examples of actions would include: waste education of all staff, increase office recycling, maximise reuse and recycling of waste through all new contracts and projects, procure recycled content items whenever possible, expand green team members to help promote waste minimisation and reduce and compost bio-degradable waste.
Benefits • Financial savings:
• Long term waste disposal cost savings to all departments
• CO2 Emissions reduction:
• Increased CO2 reduction the more we reduce, reuse and recycle our waste over sending waste to landfill or incineration. Estimated at 5% of waste emissions due to uncertainties – 31.7 tonnes
Funding • The strategy would be developed with a minimal budget.
• However the implementation of the plan would require funding from all departments, especially when looking at providing additional recycling facilities. A small budget would be required to promote the scheme to staff.
Resources • Staff time from the waste minimisation and recycling team and climate change officer
• Staff time from all departments to help implement changes.
Ensuring Success
• Key factors to success include: Buy-in from all departments and commitment from staff on all sites.
Measuring Success
• Waste tonnage from each building and levels of recycling (%) will be monitored and recorded and published at the end of each year. This will allow the calculation of CO2 reductions year on year.
• A review of the strategy and its achievements would be provided every two years.
Timing Draft Corporate Waste Minimisation Strategy to be produced by March 2011 for consultation.

Warrington Borough Council Carbon Management Programme
Carbon Management Plan working with
Page 70
Water
Project definition
ReferenceTitleDescription
OwnerDirectorate / teamDirector responsibleDate submitted
Carbon savings
Abated annual quantity
Units
Carbon source 1: 6,284 m3/yrCarbon source 2:
Data quality
Quantification method
Financial
Capital cost £2,000Annual operating costGross annual savings £12,819Net annual savings £12,819
Project start year 2011Year of first savings 2012Lifetime of project (years) 20
Payback period (years) * 0.2
Risk assessment
Risk item Probability Impact
Finance: Lack of capital investment
Medium High
Resources: Staff time during feasibility &
Medium Low
Project status and next steps
Current Status of Project Enabling Actions to Change Status
Method is based on average calulations from utility companies and save a flush information.
None identified
Steps to minimise probability Steps to minimise impact
Look to identify existing capital budget. Seek
Estimated costs- Gain finance approval- Liaise with building managers for implementation
Type of carbon source
Water
Carbon savings(kgCO2/yr)
Save a FlushWater 1
Estimates
Reduce water consumption by 3% by installing save a flush into all toilets
Laura Stanley
2,539
03 September 2010Andy Farrell
Conversion to kWh/year
(or tonnes for waste, or m3 for water)
6,284
Climate Change

Warrington Borough Council Carbon Management Programme
Carbon Management Plan working with
Page 71
Street Lighting Project: Street Lighting Bollard ReplacementReference: 45
Owner (person) Dave VaseyDepartment Transportation, Engineering & Climate Change
Part 1Replacement of remaining illuminated bollards with non illuminated & Solar Powred Qty 500 No
• Financial savings: £15,314 per annum• Payback period: 6.9 years• CO2 Emissions reduction: 83tonnes• Project cost: £106,000• No funding source has been identif ied to date.• Existing design staff • Additional funding will be required for labour & materials to carryout the replacement of the remaining Bollards. a) Brief Portfolio Memberb) Identify funding• Outcomes will be measured by comparing the estimated reduction in energy consumption and Carbon Emissions with the actual.• W hen success will be measured / evaluated Two months following the completion of the project• Milestones / key dates e.g.
o start date: Dependant on fundingo completion will be 6 months following implementiono interim deliverable / decision points
Explain sources used for quantificationThe quantif ication of this project is based on energy consumption calculated by nationally agreed criteria and industry standards
Capital expenditure is based on current market material & labour costsStreet lighting projects of this nature have previously been audited and approved by Salix demonstrating that they offer true energy eff iciencies and are deliverable
Description
Benefits
Funding
Notes
Resources
Ensuring Success
Measuring Success
Timing

Warrington Borough Council Carbon Management Programme
Carbon Management Plan working with
Page 72
Project: Street Lighting Lantern Change Mercury Vapour LampsReference: 46
Owner (person) Dave VaseyDepartment Transportation, Engineering & Climate Change
Replacement of old street lanterns which are both inefficient in terms Energy Consumption and Light Output.Qty 1300 No
• Financial savings: £31,283 per annum• Payback period: 3.7 years• CO2 Emissions reduction: 170 tonnes
• Project cost: £117,000• No funding source has been identif ied to date.• Existing design staff • Additional funding will be required for labour & materials to carryout the replacement of the remaining Bollards, this is detailed in the attached breakdown. a) Brief Portfolio Memberb) Identify funding
• Outcomes will be measured by comparing the estimated reduction in energy consumption and Carbon Emissions with the actual.• W hen success will be measured / evaluated Two months following the completion of the project.• Milestones / key dates e.g.
o start date: Dependant on fundingo completion will be 1 months following implementiono interim deliverable / decision points
Explain sources used for quantificationThe quantif ication of this project is based on energy consumption calculated by nationally agreed criteria and industry standards
Capital expenditure is based on current market material & labour costsStreet lighting projects of this nature have previously been audited and approved by Salix demonstrating that they offer true energy eff iciencies and are deliverable
Ensuring Success
Measuring Success
Timing
Notes
Description
Benefits
Funding
Resources

Warrington Borough Council Carbon Management Programme
Carbon Management Plan working with
Page 73
Project: Street Lighting Part Night OperationReference: 47
Owner (person) D VaseyDepartment Transportation, Engineering & Climate Change
Part 1Conversion of lighting units to part night, where nightime activity low or no act iv ity takes placed after certain times.Qty 34
• Financial savings: £311 per annum• Payback period: 0 years• CO2 Emissions reduction: 1.7 tonnes per annum• Project cost: £0• No funding source has been identif ied to date.• Existing design staff • Additional funding will be required for labour & materials to carryout the replacement of the remaining Bollards, this is detailed in the attached breakdown. a) Risk assessment or each location to be completedb) Brief Portfolio Member• Outcomes will be measured by comparing the estimated reduction in energy consumption and Carbon Emissions with the actual.• W hen success will be measured / evaluated Two months following the completion of the project.• Milestones / key dates e.g.
o start date: Dependant on fundingo completion will be 1 months following implementiono interim deliverable / decision points
Explain sources used for quantificationThe quantif ication of this project is based on energy consumption calculated by nationally agreed criteria and industry standards
Capital expenditure is based on current market material & labour costsStreet lighting projects of this nature have previously been audited and approved by Salix demonstrating that they offer true energy eff iciencies and are deliverable
Notes
Description
Funding
Resources
Ensuring Success
Benefits
Measuring Success
Timing

Warrington Borough Council Carbon Management Programme
Carbon Management Plan working with
Page 74
Project: Street Lighting Column Switch OffReference: 48
Owner (person) D VaseyDepartment Transportation, Engineering & Climate Change
Part 1Removal of street lighting columns on footpaths immediately adjacent existing road lighting where the road lighting is considered to be suff icient to meet the needs of the area.Part 2Removal of street lighting columns where the use of the road has changed eg: Stopped Up and lighting is no longer required..
• Financial savings: £1,263 per annum• Payback period: 0 years• CO2 Emissions reduction: 6.9 tonnes per annum
• Project cost: £0• No funding source has been identif ied to date.• Existing design staff • Additional funding will be required for labour & materials to carryout the replacement of the remaining Bollards, this is detailed in the attached breakdown. a) Risk assessment or each location to be completedb) Brief Portfolio Member• Outcomes will be measured by comparing the estimated reduction in energy consumption and Carbon Emissions with the actual.• W hen success will be measured / evaluated Two months following the completion of the project.• Milestones / key dates e.g.
o start date: Dependant on fundingo completion will be 1 months following implementiono interim deliverable / decision points
Explain sources used for quantificationThe quantif ication of this project is based on energy consumption calculated by nationally agreed criteria and industry standards
Capital expenditure is based on current market material & labour costsStreet lighting projects of this nature have previously been audited and approved by Salix demonstrating that they offer true energy eff iciencies and are deliverable
Notes
Description
Benefits
Funding
Resources
Ensuring Success
Measuring Success
Timing

Warrington Borough Council Carbon Management Programme
Carbon Management Plan working with
Page 75
Project: Street Lighting Sign Lantern ReplacementReference: 49
Owner (person) Dave VaseyDepartment Transportation, Engineering & Climate Change
Part 1Replacement of remaining sign lanterns to LED light source Qty 500 No
• Financial savings: £26,089 per annum• Payback period: 4.4 years• CO2 Emissions reduction: 142 tonnes• Project cost: £115,000• No funding source has been identif ied to date.• Existing design staff • Additional funding will be required for labour & materials to carryout the replacement of the remaining Bollards, this is detailed in the attached breakdown. a) Brief Portfolio Memberb) Identify funding• Outcomes will be measured by comparing the estimated reduction in energy consumption and Carbon Emissions with the actual.• W hen success will be measured / evaluated Two months following the completion of the project.• Milestones / key dates e.g.
o start date: Dependant on fundingo completion will be 5 months following implementiono interim deliverable / decision points
The quantif ication of this project is based on energy consumption calculated by nationally agreed criteria and industry standards
Capital expenditure is based on current market material & labour costsStreet lighting projects of this nature have previously been audited and approved by Salix demonstrating that they offer true energy eff iciencies and are deliverableStreet lighting projects of this nature have previously been audited and approved by Salix demonstrating that they offer true energy eff iciencies and are deliverableAny further notes that will help the reader understand the project/initiative.
Description
Benefits
Funding
Resources
Ensuring Success
Measuring Success
Timing
Notes

Warrington Borough Council Carbon Management Programme
Carbon Management Plan working with
Page 76
Renewable Technologies
Project: Reference:
Warrington Solar Farm
50
Owner (person) Dave Cowley and Andy Doyle
Department Environment & Regeneration
Description It is proposed to develop a free-standing solar photovoltaic system on currently unused land in Warrington. The system will be designed to minimise impact on surroundings and the local community. It will also be designed to allow other sustainable site uses including farming and agriculture.
Benefits • Financial income : Depending on timing of implementation the financial income is estimated at £31.3m or £28.9m over 25 years
• Capital cost estimated at £10m with £3m operating and maintenance costs
• Payback period: 25 years
• CO2 Emissions reduction: 2040 tonnes per year
Funding • Prudential borrowing repaid by feed in tariff.
• Operational costs will be included within this funding assessment.
• Source of funding: to be determined
• A decision on a project of this magnitude will be made at Executive level, likely to be approximately November 2011.
Resources • Additional resource is required from legal and other advisors. This cost will be factored into the funding assessment.
Ensuring Success
• It will be essential to have the support and buy-in of local ward councillors and communities for this important landmark project.
• Learning lessons from other proposed and installed solar systems of this size will reduce risk.
Measuring Success
• Output from system in terms of energy and financial benefit.
• Annually at financial year end.
Timing • Estimated milestones / key dates
o Agreement to proceed with initial investigations: February 2011
o All agreements in place to procure system: November 2011
o start date: March 2012
o completion date (when it will deliver savings): June 2012
Notes Annual energy generation = 750 kWh/kWp Assuming an installation of 5 MW, then estimated energy generation is
5,000 x 750 = 3,750,000 kWh/yr Assuming CO2 at 0.544kg/kWh, carbon saved will be 2040 tonnes/year

Warrington Borough Council Carbon Management Programme
Carbon Management Plan working with
Page 77
Project: Reference:
Orford Community Sports Hub – PV roof array
51
Owner (person)
Ian Lamb
Department Planning & Regeneration
Description The new Orford Park Community Sports Hub will contain community facilities including library, meeting and lecture rooms, café and informal socialising space, swimming pool, health and fitness centre, dance studios, squash courts, a sports hall and crèche facilities. There will also be considerable new outdoor space including playing fields, skateboarding and BMX facilities, play areas, bowling greens and dog walking areas.
This project proposes the installation of photovoltaic panels on the roof of the building which will operate to provide electricity to the building and will feed energy to the grid if not used by the building. The panels will be installed during the construction phase, minimising installation cost.
The roof area of the building is 2,800m2 however considerable allowance needs to be made for roof mounted plant. Therefore the area assumed to be used for photovoltaic installation is 1,400m2.
Benefits • An estimated 138,600kWh electricity would be generated by the array. The majority of this is likely to be used within the building given the extended opening hours and range of uses. Estimated savings in electricity costs alone £13,860.
• Estimated carbon savings 74.84 tonnes per year.
• Promotion of the energy efficiency characteristics of the building due to the highly visible nature of the PV system.
• Use as a learning tool given that the building will be used by the community and by William Beamont School pupils for sports activity.
Funding • Estimated installed cost based on Carbon Trust benchmark figures £700,000 for 1400m2. This is likely to be sourced from prudential borrowing which would be repaid using revenue from Feed In Tariff income.
Resources • As the building is under construction, the design team and project team can carry out this project using current resource.
Ensuring Success
• Funding constraints will be the main barrier to the success of this project.
• Planning amendment will need to be made.
Measuring Success
• Measuring energy performance in early years of occupation.
• Year one, two and three following occupation.
Timing o start date: Start on site October 2010
o completion date (when it will deliver savings): January 2012
Notes Assumptions as below:
Typical output 132 Wp/m2 (average of published figures for UK)
750 kWh/kWp for well sited PV in the UK.
0.54kgCO2/kWh

Warrington Borough Council Carbon Management Programme
Carbon Management Plan working with
Page 78
Project: Reference:
Schools Solar Project
52
Owner (person) Rachel Waggett
Department Children and Young Peoples services
Description Taking the opportunity of feed in tariffs and ensuring as many schools as possible have solar power PV panels on their roofs.
Benefits • Financial savings: £145,728 per year excluding feed-in tarriffs
• Payback period: Would need to be quantified in line with return from feed-in tariffs. Will be most relevant to calculate for indivuduals schools. The Financial saving and emissions reduction are based on estimates
• CO2 Emissions reduction: 793
Funding • Estimated cost of project is £4,887,745 excluding the cost of borrowing.
• Funding is currently being discussed with a view to assessing available options.
• Operational costs will be included within this funding assessment.
• Source of funding: to be determined
• A decision on a project of this magnitude will be made at Executive level.
Resources • Additional resource is required from legal and other advisors. This cost will be factored into the funding assessment.
Ensuring Success
• It will be essential to have the support and buy-in of local ward councillors and school head teachers..
• Learning lessons from schools that have delivered this before will reduce risk.
Measuring Success
• Output from systems in terms of energy and financial benefit.
• Annually at financial year end in line with carbon footprint reporting.
Timing • Estimated milestones / key dates
o Start looking at feasibility of this program September 2011
Notes o Assuming an installation on every school in the borough that will produce - 1,457,280 kWh/yr in line with the calculations for the solar farm.
o Assuming CO2 at 0.544kg/kWh, carbon saved will be 793 tonnes/year