copy - us epa · instruments should be referenced to national geodetic vertical datum (ngvd). all...
TRANSCRIPT

COPY
SESD Operating Procedure Page 2 of 23 SESDPROC-501-R4
Hydrological Studies Hydrological Studies(501)_AF. R4
Effective Date: September 26, 2016
Revision History The top row of this table shows the most recent changes to this controlled document. For previous revision history information, archived versions of this document are maintained by the SESD Document Control Coordinator on the SESD local area network (LAN).
History Effective Date
SESDPROC-501-R4, Hydrological Studies, replaces SESDPROC-501-R3. Cover Page: Changed Author from Stacey Box to Derek Little. Changed Ecological Assessment Branch Chief to Field Services Branch Chief. Changed the FQM from Bobby Lewis to Hunter Johnson. References 1.4: Updated References Section 3.2: Removed reference to Turner Scuffa units Section 7.1: Removed “Available current meters for conducting stream gaging include various acoustic Doppler velocimeters and vertical-axis mounted Price AA and Price pygmy meters.” Section 7.1.4: Revised recommendations for minimum logbook recordings. Removed references to Price/Pygmy meters. Removed 3rd paragraph and replaced with table of recommendations along with data quality objectives considerations.
September 26, 2016
SESDPROC-501-R3, Hydrological Studies, replaces SESDPROC-501-R2.
August 15, 2012
SESDPROC-501-R2, Hydrological Studies, replaces SESDPROC-501-R1.
November 6, 2009
SESDPROC-501-R1, Hydrological Studies, replaces SESDPROC-501-R0.
November 1, 2007
SESDPROC-501-R0, Hydrological Studies, Original Issue February 05, 2007
COPY

SESD Operating Procedure Page 3 of 23 SESDPROC-501-R4
Hydrological Studies Hydrological Studies(501)_AF. R4
Effective Date: September 26, 2016
TABLE OF CONTENTS
1 General Information ................................................................................................. 4
1.1 Purpose .............................................................................................................. 4 1.2 Scope/Application ............................................................................................. 4 1.3 Documentation/Verification ............................................................................. 4 1.4 References .......................................................................................................... 5 1.5 General Precautions ......................................................................................... 6
1.5.1 Safety ............................................................................................................ 6 1.5.2 Procedural Precautions ............................................................................... 6
2 Special Sampling Considerations ............................................................................ 7 2.1 Quality Control ................................................................................................. 7 2.2 Records .............................................................................................................. 7
3 General Considerations ............................................................................................ 8 3.1 General ............................................................................................................... 8 3.2 Equipment Selection Considerations .............................................................. 8
4 Surface Water Stage/Tape Down ............................................................................ 9 5 Time-of-Travel ........................................................................................................ 10
5.1 Floats ................................................................................................................ 10 5.2 Cross-Section Measurements ......................................................................... 10 5.3 Tracers ............................................................................................................. 11 5.4 Bucket Flow Method ....................................................................................... 12
6 Dilution..................................................................................................................... 13 7 Surface Water Flow ................................................................................................ 15
7.1 Stream Gaging ................................................................................................. 15 7.1.1 Cross Section Selection .............................................................................. 15 7.1.2 Stream Width/Depth ................................................................................... 16 7.1.3 Measurement Spacing................................................................................ 16 7.1.4 Velocity Measurement................................................................................ 16 7.1.5 Calculating Flow ........................................................................................ 17 7.1.6 Example Flow Calculation ........................................................................ 18
7.2 Acoustic Doppler Current Profiler (ADCP) ................................................. 22 8 Current Measurement ............................................................................................ 23
COPY

SESD Operating Procedure Page 4 of 23 SESDPROC-501-R4
Hydrological Studies Hydrological Studies(501)_AF. R4
Effective Date: September 26, 2016
1 General Information 1.1 Purpose The purpose of this operating procedure is to document both general and specific methods and considerations to be used when measuring current or flow (direction/rates) in streams, rivers, estuaries and coastal waters.
1.2 Scope/Application This document describes both general and specific methods to be used by field personnel when obtaining hydrological data during water quality surveys. In the event that Science and Ecosystem Support Division (SESD) field personnel determine that any of the procedures described in this section are inappropriate, inadequate or impractical for a given site or station and that another procedure must be used to obtain a representative measurement, the variant procedure will be documented in the field logbook (in accordance with SESD Operating Procedure for Logbooks, SESDPROC-010, most recent version), along with a description of the circumstances requiring its use. Mention of trade names or commercial products in this operating procedure does not constitute endorsement or recommendation for use. Hydrological studies are an important component of virtually all branch field studies and include activities such as time-of-travel studies, current/circulation studies, dye dilution surveys, flow measurement and stage/discharge relationship development. Time-of travel surveys are frequently required as part of water quality model calibration surveys or as a component of other activities such as reaeration measurements. Dye dilution studies are extremely useful for evaluating the mixing of effluents with receiving waters. Stage measurement and the determination of stage-discharge relationships are also important hydrological data collected by the branch. For example, stage-discharge studies are extremely useful for determining flow in conjunction with Total Maximum Daily Load (TMDL) storm event sampling efforts. As much attention and care should be given to hydrological measurements in the design of a sampling program as to the collection of water quality samples and subsequent laboratory analysis. 1.3 Documentation/Verification This procedure was prepared by persons deemed technically competent by SESD management, based on their knowledge, skills and abilities and has been tested in practice and reviewed in print by a subject matter expert. The official copy of this procedure resides on the SESD local area network (LAN). The Document Control Coordinator (DCC) is responsible for ensuring the most recent version of the procedure is placed on LAN and for maintaining records of review conducted prior to its issuance.
COPY

SESD Operating Procedure Page 5 of 23 SESDPROC-501-R4
Hydrological Studies Hydrological Studies(501)_AF. R4
Effective Date: September 26, 2016
1.4 References Bureau of Reclamation, 2001. Water Measurement Manual, Third Edition, Revised. SESD Operating Procedure for Dye Tracer Measurements, SESDPROC-514, Most Recent Version. SESD Operating Procedure for Logbooks, SESDPROC-010, Most Recent Version. United States Environmental Protection Agency (USEPA). 1991. Technical Support Document for Water Quality-based Toxics Control. Office of Water, EPA/505/2-90-001. USEPA. Safety, Health and Environmental Management Program Procedures and Policy Manual. Science and Ecosystem Support Division, Region 4, Athens, Georgia. Most Recent Version. United States Geological Survey (USGS). 1968. General Procedure for Gaging Streams, Applications of Hydraulics, Book 3, Chapter A6, United States Department of Interior, Geological Survey. United States Geological Survey (USGS). 1986. Fluorometric Procedures for Dye Tracing, Book 3, Chapter A12, United States Department of Interior, Geological Survey. USGS. 2010. Discharge Measurement at Gaging Stations, Applications of Hydraulics, Book 3, Chapter A8. USGS. 1985. Measurement of Discharge Using Tracers, Applications of Hydraulics, Book 3, Chapter A16. USGS. 1986. Fluorometric Procedures for Dye Tracing, Applications of Hydraulics, Book 3, Chapter A12, Revised. USGS. 1989. Measurement of Time of Travel in Streams by Dye Tracing, Applications of Hydraulics, Book 3, Chapter A9. USGS. 1993. Discharge-Measurement System Using an Acoustic Doppler Current Profiler with Applications to Large Rivers and Estuaries, Water Supply Paper 2395. USGS. 1993. Simulation of Soluble Waste Transport and Buildup in Surface Waters Using Tracers, Applications of Hydraulics, Book3, Chapter A20.
COPY

SESD Operating Procedure Page 6 of 23 SESDPROC-501-R4
Hydrological Studies Hydrological Studies(501)_AF. R4
Effective Date: September 26, 2016
1.5 General Precautions
1.5.1 Safety Proper safety precautions must be observed when conducting hydrological studies. Refer to the SESD Safety, Health and Environmental Management Program Procedures and Policy Manual and any pertinent site-specific Health and Safety Plans (HASP) for guidelines on safety precautions. These guidelines, however, should only be used to complement the judgment of an experienced professional. These methods may be employed during periods of high stream flow, in estuarine/coastal areas with tides and currents, in waterbodies with barge/ship traffic and in conditions of limited visibility. 1.5.2 Procedural Precautions
The following precautions should be considered when conducting hydrological studies: • All instrumentation should be in good condition and operating within the
manufacturer’s recommended tolerances. • All instrumentation should be calibrated and deployed in accordance with the
manufacturer’s requirements.
COPY

SESD Operating Procedure Page 7 of 23 SESDPROC-501-R4
Hydrological Studies Hydrological Studies(501)_AF. R4
Effective Date: September 26, 2016
2 Special Sampling Considerations 2.1 Quality Control
Stream flow will be expressed as volume per unit time (e.g., cubic feet per second [cfs] or cubic meters per second [m3/sec]). Current velocities will be expressed as distance per unit time (e.g., feet per second [fps] or meters per second [m/sec]). Time records associated with hydrological studies will be (1) kept in local time, (2) recorded in 24-hour military format and (3) recorded to at least the nearest five minutes. All field equipment should be operated, calibrated and maintained according to manufacturer’s specifications. All equipment should be visually inspected prior to deployment to ensure proper operation. 2.2 Records Information generated or obtained by SESD personnel will be organized and accounted for in accordance with SESD records management procedures. Field notes, recorded in a bound field logbook will be generated, as well as chain-of-custody documentation. All hydrological measurements will be thoroughly documented in field records. All measurements will be traceable to the personnel making the measurements and the equipment utilized.
COPY
SESD Operating Procedure Page 8 of 23 SESDPROC-501-R4
Hydrological Studies Hydrological Studies(501)_AF. R4
Effective Date: September 26, 2016
3 General Considerations 3.1 General The techniques and equipment described in Sections 4 through 8 of this procedure document are designed to provide representative measurements of specific hydrologic parameters and rates. Care should be applied in the selection of measurement sites and/or reaches to ensure personnel and equipment safety. For example, bridge-based flow measurements may be required when stream velocities preclude wading. Unattended monitoring equipment or samplers should be located outside of navigation channels in large river/estuary surveys and above anticipated water levels during stream-bank deployments. 3.2 Equipment Selection Considerations The type and size of the water body under investigation will often dictate the equipment required for flow measurement. For example, in wadeable streams, flow will usually be measured using an acoustic Doppler velocimeter affixed to a wading rod. In deeper or larger streams, a bridge rig equipped with a Doppler velocimeter may be required. For very large river systems and estuarine waters, use of an acoustic Doppler current profiler may be warranted. Water level/stage measurements can be made using a transducer/logger unit, vented data sonde or a staff gauge. Dye monitoring equipment selection will be influenced by the desired level of resolution and the need for attended versus unattended monitoring. Available equipment includes: For attended monitoring:
• Turner 10-AU and 10-005 field fluorometers • Turner Aquafluor™ hand-held fluorometer
For unattended monitoring:
• YSI data sondes equipped with rhodamine probes • Turner 10-AU field fluorometer in logging mode
COPY
SESD Operating Procedure Page 9 of 23 SESDPROC-501-R4
Hydrological Studies Hydrological Studies(501)_AF. R4
Effective Date: September 26, 2016
4 Surface Water Stage/Tape Down Water level recorders provide a time series record of water levels. When necessary, these instruments should be referenced to National Geodetic Vertical Datum (NGVD). All notes on water level tracings should include beginning and ending date and time, site location, stage scale, time scale and the name of the field investigators responsible for the data. Standard United States Geological Survey (USGS) staff gauges may be employed at each water level recorder site to provide a reference and check on the recorder trace. Water stage should be recorded to the nearest 0.01 foot, where possible. Tape downs provide instantaneous water stage as referenced to a known elevation. An engineering tape is fashioned with a plumb bob to measure from a bridge deck or other reference point to the water surface. The plumb bob provides weight for the tape as well as providing a discernible contact with the water surface. All measurements should be to the nearest 0.01 foot accompanied by a date, time and station location. The exact reference or point from which a tape down is measured should be permanently marked on the ref-erence (wing wall or bridge rail by etching a reference with a chisel, etc.) and a complete description of the reference should be made in the field records. Photographs are also helpful for referencing a site. Both of these procedures (water stage and tape downs) are predicated upon accurate references to established measuring points. As mentioned above, the NGVD is an established datum that provides correlation of water surface recordings to engineering structures (bridge, wing walls, sea wall caps, clarifier cat walks, etc.). When recording water-level dynamics in relation to a particular flow device, the datum is established in relation to the flow device reference point. The flow through rectangular and V-notch weirs, for instance, is proportional to the water level referenced to the weir crest or, in the case of partially-filled pipes, the flow rate is proportional to the depth of flow. Therefore, when employing a water-level recorder or tape down on primary flow devices, the reference or datum is the weir crest, or in the case of pipes, the invert.
COPY
SESD Operating Procedure Page 10 of 23 SESDPROC-501-R4
Hydrological Studies Hydrological Studies(501)_AF. R4
Effective Date: September 26, 2016
5 Time-of-Travel Four principal methods are used to determine time-of-water-travel in streams: surface floats, measurements of cross-sectional velocity, tracers such as dye and the bucket flow test. Tracer dyes provide a direct and highly accurate method of determining time-of-travel. This is the preferred method if resources are available. 5.1 Floats Time-of-travel is determined using surface floats by releasing the floats at a given location and timing the arrival of the floats at a known distance downstream. Floats may include natural objects such as sticks or oranges or manufactured objects such as balls or drogues engineered for this specific purpose. If possible, the floats should be visually tracked as they may become entangled in debris or the stream bank. Professional judgment must be applied in the determination of when to retrieve entangled floats and where to return them to the current. Also, since surface water velocity is generally greater than the depth-averaged velocity, surface floats tend to overestimate average water velocity. A correction factor of 0.85 to the float velocity is recommended to determine average water velocity. 5.2 Cross-Section Measurements Time-of-travel may also be obtained by averaging cross-sectional velocities at several locations within a stream reach. Professional judgment must be applied in determining the required number of cross-section locations as this determination is influenced by the intended use of the data (i.e., planning versus reporting) and available time and resources. Calculation of cross-section velocity requires either direct measurement of the stream velocity (Section 7) or determination of the cross-sectional area of the stream and the flow in the stream at the cross-section location. Cross-sectional area determination requires measurement of stream depth at several locations along the cross-section along with the total width. The resulting data are then plotted and the cross-section area calculated or planimetered. Stream flow may be available from a USGS gaging station or may be measured. In addition, USGS stations may also provide width/depth data for the cross-section at the location of the gauge. In wadeable streams, depth is usually measured by wading rod or graduated staff. For larger streams, depth may be measured by acoustic profiler, sounding weight, weighted tape down, or by surveying. Stream flow measurement methods are described in Section 7, Surface Water Flow.
COPY

SESD Operating Procedure Page 11 of 23 SESDPROC-501-R4
Hydrological Studies Hydrological Studies(501)_AF. R4
Effective Date: September 26, 2016
5.3 Tracers Tracers include a variety of conservative constituents such as salt, radioisotopes, or dyes. Rhodamine WT dye is the most common tracer used. Rhodamine WT dye is water soluble and can be detected at concentrations as low as 0.01 parts per billion (ppb) by a fluorometer. This dye is slightly photoreactive. Decay rates (ekt where k=0.034/day for exposure to full sunlight) are reported in the literature; however, actual rates are normally insignificant. Prior to injection into the stream, the concentrated dye is often diluted with stream water. This enhances immediate dispersion. For a single instantaneous release, the dye should be released in the stream as nearly instantaneously as possible. In larger or slow-moving systems, it may be necessary to release the dye while moving across the stream width to enhance initial mixing. This will likely be infeasible for continuous dye releases. For an instantaneous release, the times-of-travel to a downstream point is the differences between the time the dye was added to the stream and the times the centroid of the dye mass arrives at the downstream points. The length of the dye cloud and the peak concentrations produces a measure of in-stream dispersion. For a continuous release, the time-of-travel is calculated as the difference in time between the onset of the dye cloud plateau of two downstream monitoring points. Most methods of calculating the dosage of dye needed at the upstream point involve estimates of one or more stream characteristics, such as flow, velocity or channel geometry. The USGS has produced excellent publications regarding time-of-travel techniques such as "Measurement of Time of Travel in Streams by Dye Tracing" (USGS 1985) and "Fluorometric Procedures for Dye Tracing" (USGS 1986). There are three primary methods by which the stream water can be sampled and analyzed for dye (SESDPROC-514). A submersible pump can be used to pump the dye continuously through a fluorometer; stream samples can be grabbed (either by hand or by automatic sampler) at specified frequencies and then placed into the fluorometer individually; and logging data sondes equipped with rhodamine probes can be deployed for in-situ dye measurements. Readings directly from the fluorometer scale or conversion to dye concentration corrected for temperature can be manually plotted against time. A version of the grab sampling technique is to use an automatic sequential water sampler which discharges into separate bottles. The samples collected at preset intervals are analyzed and the concentrations plotted against time. The frequency of tracer monitoring will vary depending on the anticipated duration of the dye cloud at the sampling point. It is preferable to err on the side of more frequent
COPY
SESD Operating Procedure Page 12 of 23 SESDPROC-501-R4
Hydrological Studies Hydrological Studies(501)_AF. R4
Effective Date: September 26, 2016
monitoring. If necessary, multiple monitors or samplers can be deployed at a single location to increase monitoring frequency or duration. Ideally, dye samples should continue to be analyzed until the stream background concentration following the peak is measured. With a time versus concentration plot from background level to peak to background level, the centroid, and thus actual travel time, can be determined. Where it is infeasible to continue monitoring to the stream background concentration, the trailing edge of the dye cloud should at least be monitored until the in-stream tracer concentration is no more than 2 to 5 % of the peak concentration. Prior to conducting tracer studies in freshwater systems, water supplies should be inventoried to insure that the dye tracer concentrations will not impart color to downstream public or private water supplies. Rhodamine WT concentrations in the dye cloud should be maintained below 10 ppb at water supply intakes. Commercially available Rhodamine WT is a 20% solution. 5.4 Bucket Flow Method The bucket flow test is a simple but effective way to calculate a flow rate when the above three methods are not appropriate due to field limitations. The equipment required to complete the test are a bucket with known volumetric graduations and a device to record elapsed time (stopwatch). Place the bucket underneath the water flow and time how many seconds it takes to fill the bucket to a chosen volume. Dividing the volume of water collected by the elapsed time will provide the flow rate for that particular location.
COPY
SESD Operating Procedure Page 13 of 23 SESDPROC-501-R4
Hydrological Studies Hydrological Studies(501)_AF. R4
Effective Date: September 26, 2016
6 Dilution A great deal of the previous section (time-of-travel studies) applies to this section and USGS publications provide references to appropriate techniques, in particular "Measurement of Discharge by Using Tracers" (USGS 1986). Dilution studies using tracer dyes evolved from "mass conservation" principles (i.e., a known mass of tracer is introduced at an upstream point, and after mixing with the water to be traced, this mass should be accountable at downstream locations). In dilution studies, the tracer dye is precisely metered into the waters to be traced and then monitored after mixing at downstream stations. This series of events requires highly controlled metering rates and very accurate fluorometric analyses. State-of-the-art fluorometers make the dilution study methods valuable assessment tools. The principal of superposition as developed by Kilpatrick et al. (USGS 1989) of the USGS is a reliable method to determine dilution levels of wastewaters in receiving estuaries. A tracer dye is metered into the wastewater stream during a tidal cycle. Successive slack tide measurements of dye concentrations in the estuary at selective distances from the outfall produce a series of concentration curves. By superposition, the accumulative concentration at each station provides a determination of the ultimate concentrations or steady-state concentration of a continuous discharge. By simple proportioning, with due regard to any tracer photo decay, the dilution levels of the discharge can be produced for selective points in the estuary. Calculation Procedure:
Cw = [(Cd)(ekt)(Vw)] / Vd Where: Cw = ultimate concentration of wastewater at point of interest Cd = ultimate concentration of dye tracer (by superposition) at
point of interest ekt = photo decay of tracer Vw = wastewater discharge per tidal day Vd = volume dye tracer released in tidal day Investigations of industrial and municipal facilities for National Pollutant Discharge Elimination System (NPDES) permit compliance require measurements of discharge rates.
COPY
SESD Operating Procedure Page 14 of 23 SESDPROC-501-R4
Hydrological Studies Hydrological Studies(501)_AF. R4
Effective Date: September 26, 2016
Often encountered during these investigations are flow-measuring devices such as orifices and magnetic meters which are inaccessible for measurements of flow by standard equations relating to hydraulic head and structure size. The following provides a direct technique for measurement of flow through these devices using dye tracers. Calculation: The discharge rate through any structure can be defined by the following mass balance equation: MASS BALANCE EQUATION (C1) (q1) = (C2) (Q2 + q1) then, Q2 =[(C1) (q1) - (C2) (q1)]/C2 Where:
Q2 = flow rate in pipe
C1 = tracer injection concentration
q1 = tracer injection rate
C2 = tracer concentration after mixing Assuming a constant discharge rate and complete mixing of the tracer in the waste stream, the task is (1) to inject into the waste stream a tracer at a constant rate and constant concentration, and (2) to measure the concentration of the tracer after mixing with the waste stream. It is suggested that at least three injection rates and resulting mixed tracer concentration measurements be used to calculate the discharge rate. The Environmental Protection Agency’s (EPA) technical support document also provides guidance for conducting a “quick saltwater dilution assessment” using a dye tracer (USEPA 1991).
COPY
SESD Operating Procedure Page 15 of 23 SESDPROC-501-R4
Hydrological Studies Hydrological Studies(501)_AF. R4
Effective Date: September 26, 2016
7 Surface Water Flow Surface waters are considered to be open channels for flow measurement purposes. Flow measurements shall be made using stream gaging or acoustic Doppler techniques. 7.1 Stream Gaging Where practical, flow data and/or rating curves may be obtained from existing permanent stream gaging stations maintained by the USGS, United States Army Corps of Engineers or other federal or state agencies. Where permanent stations do not exist, flow may be measured using stream gaging techniques. In making stream gaging measurements and calculating flow, personnel shall utilize the procedures outlined in the USGS publications General Procedures for Gaging Streams (USGS 1968) and Discharge Measurements at Gaging Stations (USGS 2010). If a station is to be used more than one time during a water quality survey, a rating curve may be developed for that station. A rating curve is constructed by making a series of independent flow measurements and simultaneous tape down or staff gauge measurements for the same section of a particular station at different water levels and plotting the resulting data pairs on a semi-log graph. At least two (preferably three) flow measurement-tape downs shall be made to develop a rating curve. For wadeable streams, these meters may be deployed using a top-setting wading rod. For nonwadeable or inaccessible streams, a meter may be deployed on a weighted line using a bridge rig system or by using an extended length top-setting rod from a bridge. Depth may be determined from a standard top-setting wading rod, or by taking the difference of tape down or bridge rig measurements of the river bottom and surface.
7.1.1 Cross Section Selection The section of reach where the flow measurements will be made should be selected using the following criteria:
1) A straight reach with the threads of velocity parallel to each other. 2) Stable streambed free of large rocks, weeds and protruding obstructions such as
piers which would create turbulence. 3) A flat streambed profile to eliminate vertical components of velocity.
Natural conditions rarely exhibit a reach that satisfies all of these criteria but a section should be chosen that meets criteria as best as possible. Rocks and other debris within a desired cross section and upstream may be removed prior to any measurements to improve conditions.
COPY
SESD Operating Procedure Page 16 of 23 SESDPROC-501-R4
Hydrological Studies Hydrological Studies(501)_AF. R4
Effective Date: September 26, 2016
7.1.2 Stream Width/Depth After the cross section has been selected the width of the stream must be determined. For wading conditions width measurements may be made using a Lee-Au galvanized steel tag line segmented into equal lengths, steel tapes or cloth tapes. For non-wading conditions, total width may be determined by using a laser range finder. Width should be taken from the edges of the water and bank directly perpendicular to flow. Record the depth by holding the wading rod in a vertical position. For a bridge measurement, lower the tow body to the water surface and set the counter to “Ø”. Lower the tow body to the bottom of the water body to determine total depth. Adjust the Ø every 2-3 measurements to account for a bridge crown or slope.
7.1.3 Measurement Spacing Division of measurements should be made such that no partial flow section contains more than 10% of the total discharge. On average there should be 25 to 30 partial sections. For cross section with a smooth level bottom and good velocity distribution fewer cross sections can be used. A uniform partial section size is not required. Partial section sizes may be adjusted, where needed, to ensure that 10% of the total discharge is not exceeded.
7.1.4 Velocity Measurement At a minimum the following information should be recorded in logbooks in addition to those required according to SESD Operating Procedure (SESDPROC 010):
1. Total Discharge 2. Total Width 3. Total Area
When recording velocity one should stand in a position that least affects the velocity of water passing the current meter, usually facing upstream behind the rod and meter. In low flow conditions measurements should be made after ample time has passed that any eddy created by moving has passed. Bridge measurements should be made on the upstream side where feasible. Data quality objectives (DQO) determine the degree of procedures for the measurement. DQOs for the measurement can be divided into two general categories; low and high. Examples of low and high DQO scenarios and their corresponding measurement method
COPY

SESD Operating Procedure Page 17 of 23 SESDPROC-501-R4
Hydrological Studies Hydrological Studies(501)_AF. R4
Effective Date: September 26, 2016
cutoff recommendations are provided below. Determination of the DQO level is determined by the project leader.
• Low DQO measurements: o Reconnaissance o Generalized Loading Calculations o Dye tracer travel estimates
• High DQO: o Rating Curves o High Priority Loadings Calculations
Measurement Method
DQO Level 0.6 Depth 0.2 and 0.8 Depth Low Total Depth < 2.5 ft Total Depth ≥ 2.5 ft High Total Depth < 1.5 ft Total Depth ≥ 1.5 ft
A signal to noise ration of greater than 10dB is recommended by the manufacturer of the SonTek Flowtracker but can be operated as low as 2-3 dB.
7.1.5 Calculating Flow A current meter measurement for discharge is the summation of the products of the partial areas of the stream cross section and their respective average velocities.
( )∑=
=ni
nnvaQ0
Where Q is the total discharge, an is the partial cross-section area for partition n, vn is the mean velocity of the flow normal to the corresponding partial area. A midsection method is used in calculating total discharge where each measured velocity is assumed to equal the mean velocity for that cross-sectional division area. The area extends laterally half the distance for the preceding meter location to half the distance to the next and vertically from the water surfaced to the sounded depth.
COPY

SESD Operating Procedure Page 18 of 23 SESDPROC-501-R4
Hydrological Studies Hydrological Studies(501)_AF. R4
Effective Date: September 26, 2016
7.1.6 Example Flow Calculation Table 1 and Figure 1 detail an idealistic cross section dimensions and its corresponding velocity measurements. The bold boxes in Figure 1 represent the midpoint area for the first two measurements. Velocity measures at those distances are assumed to be throughout the highlighted box.
Table 1: Sample Measurements
Dist Width Depth V (ft) (ft) (ft) (fps)
0 0 0.00 0.00 5 5 1.00 1.00
10 5 1.00 1.40 15 5 1.25 1.20 20 5 1.25 1.50 25 5 1.25 1.80 30 5 1.25 1.50 35 5 1.25 1.50 40 5 1.50 1.60 45 5 1.50 1.50 50 5 1.50 1.60 55 5 1.50 1.50 60 5 1.50 1.50 65 5 1.50 1.50 70 5 1.50 1.50 75 5 1.50 1.50 80 5 1.25 1.50 85 5 1.25 1.40 90 5 1.25 1.50 95 5 1.25 1.50
100 5 1.00 1.20 105 5 0 0
COPY

SESD Operating Procedure Page 19 of 23 SESDPROC-501-R4
Hydrological Studies Hydrological Studies(501)_AF. R4
Effective Date: September 26, 2016
Figure 1: Example of cross section division
For each velocity a corresponding area and flow are calculated. The area is calculated as:
( ) ( )x
xxx d
bba
−= −+
211
Where:
bX = location of measurement point b(X-1) = distance from the measurement point to the preceding location, x-1 b(X+1) = distance from the measurement point to the next location, x+1 dX = depth of water at location x
0.00
0.20
0.40
0.60
0.80
1.00
1.20
1.40
1.60
0 20 40 60 80 100
Cross section Lateral Distance (ft)
Dep
th (f
t)
COPY
SESD Operating Procedure Page 20 of 23 SESDPROC-501-R4
Hydrological Studies Hydrological Studies(501)_AF. R4
Effective Date: September 26, 2016
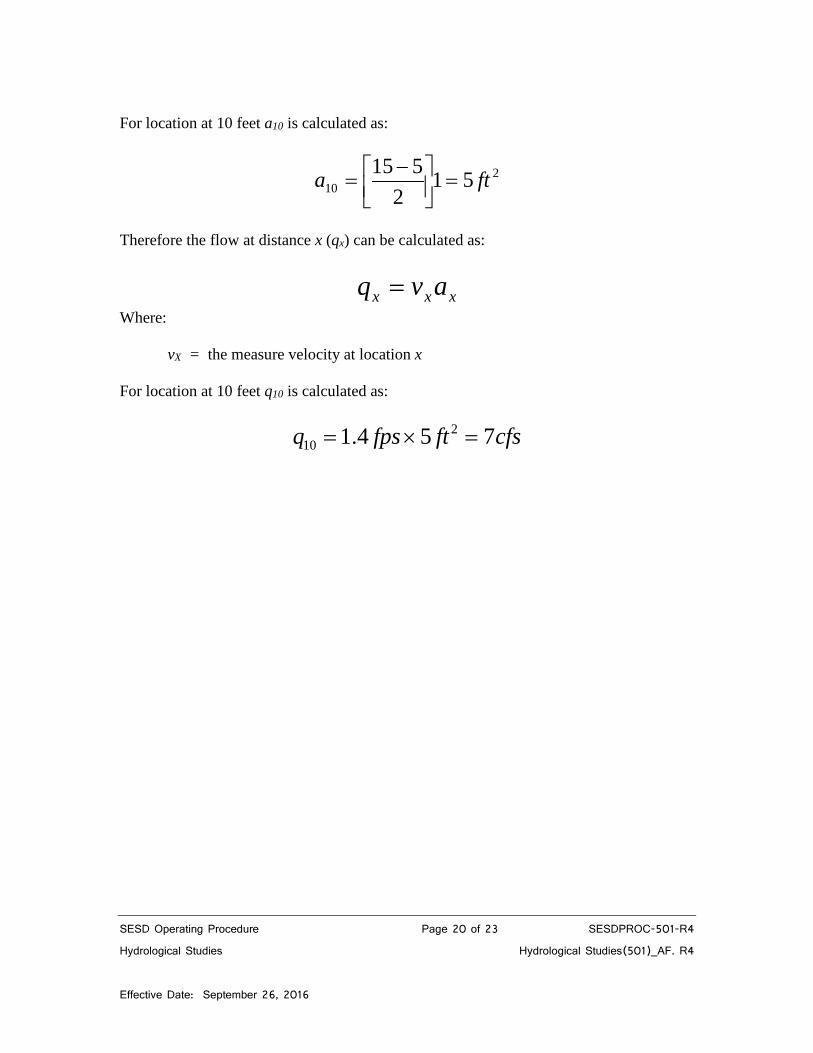
For location at 10 feet a10 is calculated as:
210 51
2515 fta =
−
=
Therefore the flow at distance x (qx) can be calculated as:
xxx avq = Where: vX = the measure velocity at location x For location at 10 feet q10 is calculated as:
cfsftfpsq 754.1 210 =×=
COPY

SESD Operating Procedure Page 21 of 23 SESDPROC-501-R4
Hydrological Studies Hydrological Studies(501)_AF. R4
Effective Date: September 26, 2016
Total flow can then be calculated by the summation of the individual flows at all points x. Table 2 provides a summary of the results for Table 1.
Table 2: Results
Dist Width Depth V Area Flow (ft) (ft) (ft) (fps) (ft2) (cfs)
0 0 0.00 0.00 0.00 0.00 5 5 1.00 1.00 5.00 5.00
10 5 1.00 1.40 5.00 7.00 15 5 1.25 1.20 6.25 7.50 20 5 1.25 1.50 6.25 9.38 25 5 1.25 1.80 6.25 11.25 30 5 1.25 1.50 6.25 9.38 35 5 1.25 1.50 6.25 9.38 40 5 1.50 1.60 7.50 12.00 45 5 1.50 1.50 7.50 11.25 50 5 1.50 1.60 7.50 12.00 55 5 1.50 1.50 7.50 11.25 60 5 1.50 1.50 7.50 11.25 65 5 1.50 1.50 7.50 11.25 70 5 1.50 1.50 7.50 11.25 75 5 1.50 1.50 7.50 11.25 80 5 1.25 1.50 6.25 9.38 85 5 1.25 1.40 6.25 8.75 90 5 1.25 1.50 6.25 9.38 95 5 1.25 1.50 6.25 9.38
100 5 1.00 1.20 5.00 6.00 105 5 0 0 0 0
Total
Flow Q 193.3
COPY
SESD Operating Procedure Page 22 of 23 SESDPROC-501-R4
Hydrological Studies Hydrological Studies(501)_AF. R4
Effective Date: September 26, 2016
7.2 Acoustic Doppler Current Profiler (ADCP) Measuring flow by Acoustic Doppler Current Profiler (ADCP) is a fairly new method of flow measurement relative to stream gaging. The ADCP meters used in flow measurements may be deployed via a boat-mounted configuration for larger river/estuarine systems or mounted on a tethered float for smaller stream measurement applications. The ADCP provides velocities at several depths along a cross-section of the river. Also, ADCP meters may be used to determine depth and width in conjunction with a laser range finder or other means for determining edge distances. The USGS publication “Discharge-Measurement System Using an Acoustic Doppler Current Profiler with Applications to Large River and Estuaries” (USGS 1993) provides guidance in the use of ADCP for flow measurement. When using an ADCP in a steady flow system, flow should be measured a minimum of four times along a transect, preferably twice in each direction, and an average of the flows determined. If the four measurements vary by >10%, two to four additional measurements should be made to improve the average flow determination. In unsteady flows or when other field demands limit available time, a flow can be determined from fewer than four transects. In some instances (e.g., tidal river), measurements may be limited to a single transect. ADCP flow is calculated by the manufacturer’s software. Adjustments to the resulting flow calculations may be made by the field investigator following data collection based on professional judgment in concert with manufacturer and USGS guidance.
COPY
SESD Operating Procedure Page 23 of 23 SESDPROC-501-R4
Hydrological Studies Hydrological Studies(501)_AF. R4
Effective Date: September 26, 2016
8 Current Measurement Current measurements may be made by several different instruments. Available equipment includes:
Acoustic Doppler Current meters Electromagnetic Current meters
Each meter may be programmed via appropriate connection to a computer prior to deployment, deployed in an unattended mode, and interrogated for data download by computer following data collection. Likewise, the meters may be used for real-time data collection in profiling applications. For unattended applications, deployment in and out times/dates should be recorded in the field record. The field record should also include the location and depth(s) of the deployment and serial number or other appropriate identifier of the meter(s) used in the deployment. For unattended applications, the meters may be deployed on a weighted tether line with a subsurface float to keep the tether line taut and a surface float for locating the meter. Multiple meters can be deployed at any depth(s) on the tether. Meters should be deployed in a way that minimizes potential equipment damage or interference from ship traffic or other obstructions. Doppler current meters may be deployed in a variety of ways. For unattended current measurements, these meters may be mounted to a weighted platform specifically designed to minimize potential impacts from drag lines or nets; or in a protective load cage attached to a tether line at a specific depth. The meter may also be boat mounted for real-time data collection and profiling.
COPY