copyright 2000, media cybernetics, l.p. array-pro ® analyzer software
TRANSCRIPT

Copyright 2000, Media Cybernetics, L.P.
Array-Pro® Analyzer Software

Copyright 2000, Media Cybernetics, L.P.
Problems with Current Array Analysis
• Tedious manual application of grid templates
• Non-reproducibility from one user to another or the same user doing a similar analysis on another sample
• Poor user feedback on image and hybridization quality
• Poor signal/noise performance due to lack of understanding of signal/background

Copyright 2000, Media Cybernetics, L.P.
Goals for Array-Pro• Automate grid/spot finding based on our superior knowledge
of image processing; find regular & irregular array spotting• Allow manual setup but let the computer make decisions
whenever possible for reproducibility• Give the user constant feedback in processing and data to aid
their assessment of array and spot quality• Use our experience in image processing to optimize
signal/noise performance• Read existing file formats (mostly TIFF)• Drive confocal microscopes with automation to collect
images

Copyright 2000, Media Cybernetics, L.P.
Application Goals
• Ability to generate information from all kinds of arrays – Spotted arrays
– Gene chips (e.g. Affymetrix)
– Membranes (e.g. Clontech Atlas, Research Genetics) • Especially well-suited for gene expression
– Ratios (usually Cy3/Cy5) – Scatter plots, tables, color-coded graphics, etc. to expose gene
expression

Copyright 2000, Media Cybernetics, L.P.
Experiment Driven

Copyright 2000, Media Cybernetics, L.P.
Spot ID Wizard

Copyright 2000, Media Cybernetics, L.P.
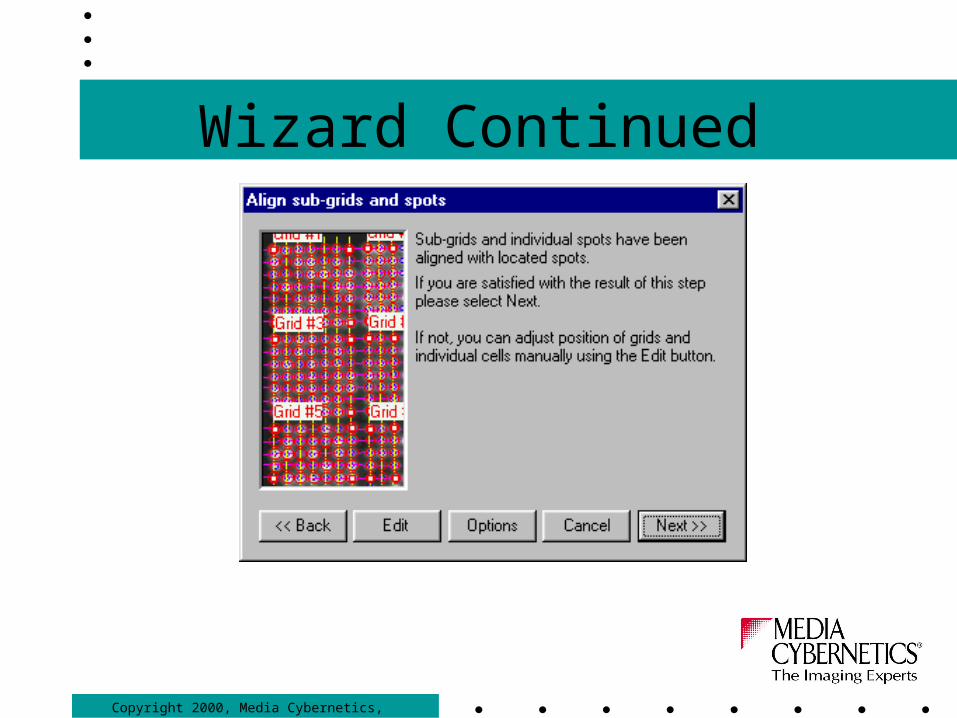
Wizard Continued

Copyright 2000, Media Cybernetics, L.P.
Wizard Continued

Copyright 2000, Media Cybernetics, L.P.
Wizard Continued

Copyright 2000, Media Cybernetics, L.P.
Wizard Continued

Copyright 2000, Media Cybernetics, L.P.
Wizard Continued
Copyright 2000, Media Cybernetics, L.P.
Wizard Continued

Copyright 2000, Media Cybernetics, L.P.
Wizard Continued

Copyright 2000, Media Cybernetics, L.P.
Auto Grid/Spot Detection Parameters

Copyright 2000, Media Cybernetics, L.P.
Advanced Detection

Copyright 2000, Media Cybernetics, L.P.
Numerous Measurements/Descriptors

Copyright 2000, Media Cybernetics, L.P.
Analysis Options

Copyright 2000, Media Cybernetics, L.P.
Labeling

Copyright 2000, Media Cybernetics, L.P.
Background Characterization

Copyright 2000, Media Cybernetics, L.P.
Information View Definition

Copyright 2000, Media Cybernetics, L.P.
ID and Replication

Copyright 2000, Media Cybernetics, L.P.
Grid Labeling Options

Copyright 2000, Media Cybernetics, L.P.
Data Tables

Copyright 2000, Media Cybernetics, L.P.
Statistical Feedback

Copyright 2000, Media Cybernetics, L.P.
Data Histograms

Copyright 2000, Media Cybernetics, L.P.
Cell Group Information

Copyright 2000, Media Cybernetics, L.P.
Scatter Plot

Copyright 2000, Media Cybernetics, L.P.
Other Features• Floating windows of information over cells in image
• Label importing
• Definition of groups, including fiducials, background, housekeeping genes, outliers, etc.
• Interactivity of data and graphics
• Working with spots or user-defined groups of spots
• Image & hybridization quality metrics; user weighted
• Scope-Pro as a plug-in module to automate microscope stages
• Database storage
Copyright 2000, Media Cybernetics, L.P.
Partnership with Applied Maths
• Array-Pro shares data seamlessly with GeneMaths®
• Can start GeneMaths from Array-Pro and pass
experiment data automatically
• Sophisticated statistical analysis of experimental series data

Copyright 2000, Media Cybernetics, L.P.
GeneMaths®
• Standardization of data matrix using offset and scaling functions (averages, Root Mean Square, Standard Deviation)
• Transformation of data matrix (flipping)
• Powerful two-way cluster analysis of rows and columns using a variety of similarity/distance coefficients, and several pair-group clustering methods, Ward, and Neighbor Joining
• Cluster significance indication based on bootstrap techniques
• Very powerful dendrogram layout and visualization tools to facilitate interpretation of analyses of extreme sizes
• Use and display up to 20 database fields both for rows and columns
• Advanced search and select functions based upon database information
• Pattern matching: search for closest matches with specific profiles, average profiles or theoretical profiles
• Single, composite or average profile curve or bar graph plotting with indication of standard deviations
• X-Y plots, time course plots, and scatterplots; 2-D and 3-D Principal Component Analysis and Discriminant Analysis with or without variance
• Advanced Self-Organizing maps (Kohonen maps) of any size with unique presentation and interpretation
tools; Powerful WYSIWYG printing of any result.

Copyright 2000, Media Cybernetics, L.P.
GeneMaths®

Copyright 2000, Media Cybernetics, L.P.
GeneMaths®