copyright © 2002 terabeam corporation. all rights reserved. 1 predicting availability what is link...
Post on 18-Dec-2015
218 views
TRANSCRIPT
Copyright © 2002 Terabeam Corporation. All rights reserved. 1
Predicting AvailabilityWhat is Link Availability?Predicting AvailabilityWhat is Link Availability?
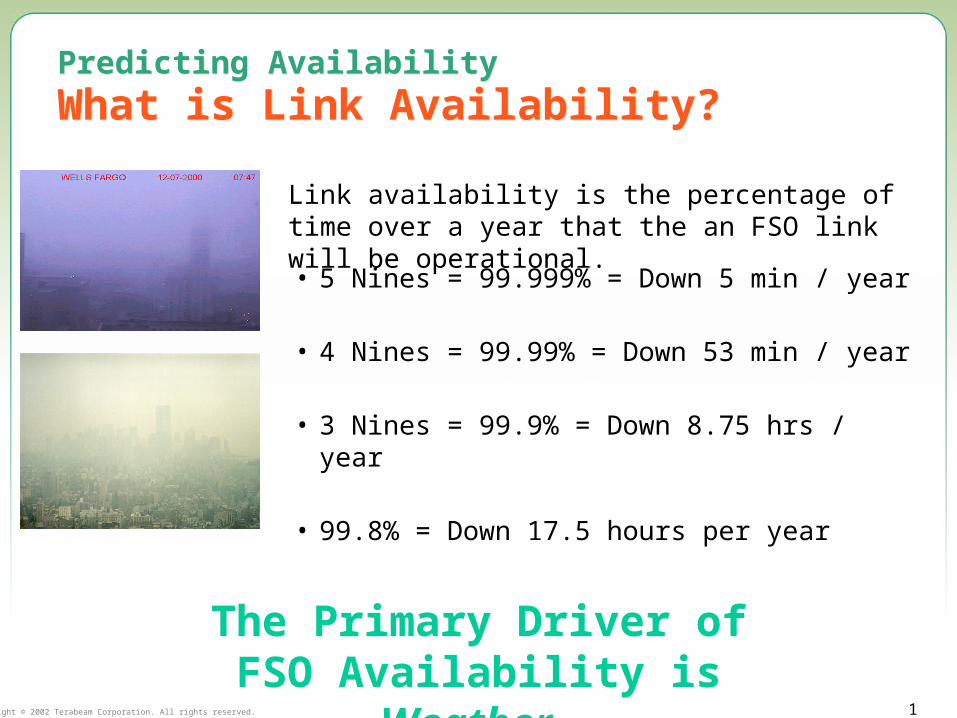
• 5 Nines = 99.999% = Down 5 min / year
• 4 Nines = 99.99% = Down 53 min / year
• 3 Nines = 99.9% = Down 8.75 hrs / year
• 99.8% = Down 17.5 hours per year
The Primary Driver of FSO Availability is Weather
Link availability is the percentage of time over a year that the an FSO link will be operational.

Copyright © 2002 Terabeam Corporation. All rights reserved. 2
• Difference between the optical power received in clear air versus the minimum power level required for a given error rate.
• Expressed in terms of “dB”– 30dB of margin = 1 part in 1,000 required– 50dB of margin = 1 part in 100,000 required
• Typical error rate 1e-9 (1 in a billion)– 1e-12 reduces margin by approximately 1 dB– 1e-6 increases margin by approximately 1 dB
Predicting AvailabilityPart 1: Clear Air Link MarginPredicting AvailabilityPart 1: Clear Air Link Margin

Copyright © 2002 Terabeam Corporation. All rights reserved. 3
Predicting AvailabilityPart 2: Weather AttenuationPredicting AvailabilityPart 2: Weather Attenuation
• Curves based upon surface visibility
• Seattle 99.99 attenuation = >212 dB/km
• Seattle 99.9 attenuation = 98 dB/km
• Denver 99.9 attenuation = 40 dB/km
• Phoenix 99.9 attenuation = <5 dB/km

Copyright © 2002 Terabeam Corporation. All rights reserved. 4
Predicting Availability
The Hard Part – Atmospheric Attenuation Curve
Predicting Availability
The Hard Part – Atmospheric Attenuation CurveThe Inputs
1. Visibility information from nearby airport weather stations• 100m visibility corresponds to 128 dB/km at 1550nm• 400m visibility corresponds to 27 dB/km at 1550nm
2. Cloud ceiling information3. Geographic location of airport vs. installation location4. Urban heat island effects
The Output• A four dimensional atmospheric model
– Latitude– Longitude– Altitude– Time
Visibility Sensor

Copyright © 2002 Terabeam Corporation. All rights reserved. 5
Description Visibility Loss
Dense Fog 40-70 m 392-220 dB/km
Thick Fog 70-250 m 220-58 dB/km
Moderate Fog 250-500 m 58-28.2 dB/km
Light Fog 500-1000 m 28.2-13.4 dB/km
Thin Fog 1-2 km 13.4-6.3 dB/km
Haze 2-4 km 6.3-2.9 dB/km
Light Haze 4-10 km 2.9-1.03 dB/km
Clear 10-20 km 1.03-0.45 dB/km
Very Clear 20-50 km 0.45-0.144 dB/km
Extremely Clear 50-150 km 0.144-0.03 dB/km
Visibility of 1 football field ~ 130 dB/kmVisibility of 1 football field ~ 130 dB/km
Predicting AvailabilityExamples of VisibilityPredicting AvailabilityExamples of Visibility
Copyright © 2002 Terabeam Corporation. All rights reserved. 6
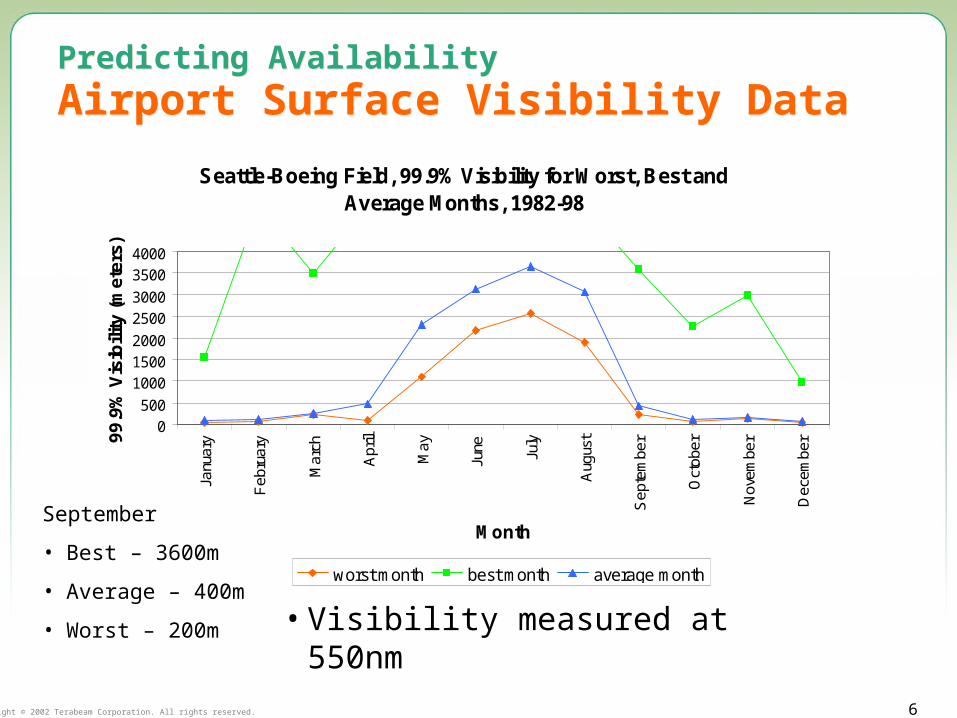
Seattle-Boeing Field, 99.9% Visibility for Worst, Best and Average Months, 1982-98
0500
100015002000
25003000
35004000
Janu
ary
Feb
ruar
y
Mar
ch
Apr
il
May
June July
Aug
ust
Sep
tem
ber
Oct
ober
Nov
embe
r
Dec
embe
r
Month
99
.9%
Vis
ibili
ty (
me
ters
)
worst month best month average month
Predicting AvailabilityAirport Surface Visibility DataPredicting AvailabilityAirport Surface Visibility Data
• Visibility measured at 550nm
September
• Best – 3600m
• Average – 400m
• Worst – 200m

Copyright © 2002 Terabeam Corporation. All rights reserved. 7
0 20 40 60 80 100 120 140 160 180 200
Surface
30
60
90
120
150
180
Heig
ht
AG
L (
m)
Attenuation (dB/km), 99.9% Availability
Stockholm, Sweden, 1982-97
Predicting AvailabilityCloud Ceiling ImpactPredicting AvailabilityCloud Ceiling Impact

Copyright © 2002 Terabeam Corporation. All rights reserved. 8
Predicting AvailabilityAttenuation Vs. Percentage Time Occurrence
Predicting AvailabilityAttenuation Vs. Percentage Time Occurrence Three Altitudes in Seattle
At 99.8 Availability
• Surface = 60 dB/km
• 30th fl = 85 dB/km
• 52nd fl = 105 dB/km
A link capable of operating at 50 dB/km
• Surface = 99.78%
• 30th fl = 99.72%
• 52nd fl = 99.58%
Copyright © 2002 Terabeam Corporation. All rights reserved. 9
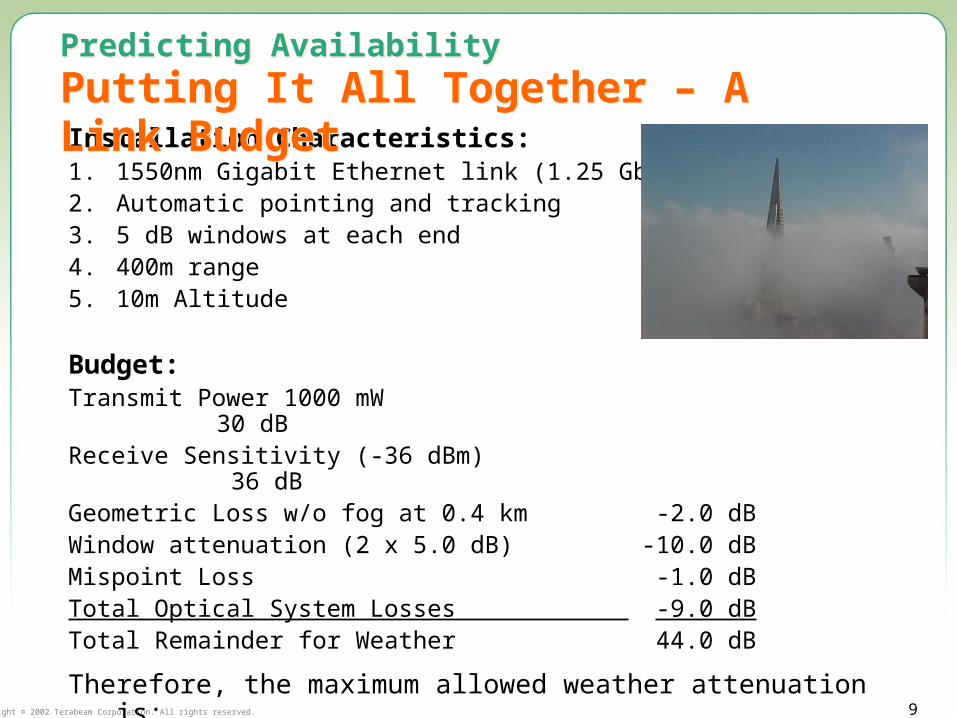
Installation Characteristics:1. 1550nm Gigabit Ethernet link (1.25 Gbps)2. Automatic pointing and tracking3. 5 dB windows at each end4. 400m range5. 10m Altitude
Budget:Transmit Power 1000 mW 30 dBReceive Sensitivity (-36 dBm) 36 dBGeometric Loss w/o fog at 0.4 km -2.0 dBWindow attenuation (2 x 5.0 dB) -10.0 dBMispoint Loss -1.0 dBTotal Optical System Losses -9.0 dBTotal Remainder for Weather 44.0 dB
Therefore, the maximum allowed weather attenuation is:44 dB/ 0.40 km = 110 dB/km
Predicting AvailabilityPutting It All Together – A Link Budget
Predicting AvailabilityPutting It All Together – A Link Budget

Copyright © 2002 Terabeam Corporation. All rights reserved. 10
•Best Year = 99.995
•Average Year = 99.94
•Worst Year = 99.66
Predicting Availability
Final Result: Link Weather Final Result: Link Weather AvailabilityAvailability
Predicting Availability
Final Result: Link Weather Final Result: Link Weather AvailabilityAvailability

Copyright © 2002 Terabeam Corporation. All rights reserved. 11
0
50
100
150
200
250
300P
hoen
ix
Las
Veg
as
Nic
e
Hon
g K
ong
Sin
gapo
re
Syd
ney
Tok
yo
Bur
bank
, CA
Dal
las
Sto
ckho
lm
Den
ver
Was
hing
ton,
D.C
.
New
Yor
k
Phi
lade
lphi
a
Osl
o
San
Fra
ncis
co (
City
)
Chi
cago
Sub
urbs
Hel
sink
i
Det
roit
Fra
nkfu
rt
Sea
ttle
Mad
rid
Par
is (
Orly
)
San
ta A
na, C
A
Am
ster
dam
Cop
enha
gen
Bos
ton
(Log
an)
Chi
cago
Loo
p
Milw
auke
e
Los
Ang
eles
(LA
X)
Bru
ssel
s
Long
Bea
ch In
t'l
Mila
n
Lond
on (
Hea
thro
w)
99
.9%
Att
en
ua
tio
n (
dB
/km
)
Predicting Availability99.9% Attenuation MarginsPredicting Availability99.9% Attenuation Margins
Attenuation margin (dB/km) required for 99.9% availability - City by City
Notes:Data derived from surface visibility data (altitude effects not included) and Kruse formulaSource: Terabeam Weather Group, Jan 2001

Copyright © 2002 Terabeam Corporation. All rights reserved. 12
Predicting AvailabilityVariability w/ Location: Washington, DC
Predicting AvailabilityVariability w/ Location: Washington, DC
Washington National
Dulles Relative link footprints
99.7
99.8
99.9
99.799.8
99.9

Copyright © 2002 Terabeam Corporation. All rights reserved. 13
Ne
w Y
ork
0m
2000m
4000m
6000m
Se
attle
De
nve
r
Da
llas
Mia
mi
Ph
oen
ix
Predicting AvailabilityReal World 99.9% FSO Ranges
Predicting AvailabilityReal World 99.9% FSO Ranges

Copyright © 2002 Terabeam Corporation. All rights reserved. 14
Eye SafetyThe Eye’s Response to Laser Light
Eye SafetyThe Eye’s Response to Laser Light• Cornea
– Wavelengths above 1400 nm almost completely absorbed by the cornea and not transmitted to the retina
• Retina
– Wavelengths below 1400 nm (close to visible light) focused onto the retina, so power levels must be lower to ensure safety
• Maximum Permissible Exposure (MPE) limits established by ANSI
Retina
Cornea

Copyright © 2002 Terabeam Corporation. All rights reserved. 15
Eye SafetyLaser Standards OrganizationsEye SafetyLaser Standards Organizations
Organization Jurisdiction What they classify
CDRHCenter for Devices & Radiological Health
United States;
Part of the FDA
Product safety(labeling, installation, etc.)
ANSIAmerican National Standards Institute
United States;
Recognized by OSHA
User safety(maximum permissible exposure)
IECInternational Electrotechnical Commission
Much of the world;
Generally associated with the CE Mark
Product and user safety

Copyright © 2002 Terabeam Corporation. All rights reserved. 16
Eye SafetyLaser Safety StandardsEye SafetyLaser Safety Standards
Class One
Eye-Safe (all conditions) aided I 1 1
Eye-Safe w/o Optical Aids unaided -- 1 1 M
Class Two
(Visible only 400 to 700 nm)
< 0.25 sec (eye aversion) aided II 2 2
< 0.25 sec unaided -- 2 2 M
Class Three “a” or “R”
Minor Hazard aided IIIa (visible only) 3a 3 R
(5 times Class 1) unaided -- 3a --
any IIIb 3 b 3 B
Class Four
Eye Hazard any IV 4 4
ViewingCondition
Class Three “b” - Eye Hazard
• Most FSO systems are Class 1 or 1M

Copyright © 2002 Terabeam Corporation. All rights reserved. 17
Eye SafetyStandards and FSO UseEye SafetyStandards and FSO Use
• Class 1 systems can be installed in Unrestricted locations
• Class 1M systems can be installed in Restricted areas
• Class 3B and above only in Controlled locations

Copyright © 2002 Terabeam Corporation. All rights reserved. 18
• “Sprinkler head” extensions of fiber
• Closure of SONET/SDH metro rings
• Spatial diversity
• Emergency communications
• Data outsourcing/mirroring/SANS
• Wireless backhaul
Applications & Network Integration Emerging FSO UsesApplications & Network Integration Emerging FSO Uses

Copyright © 2002 Terabeam Corporation. All rights reserved. 19
Applications & Network IntegrationDeploymentsApplications & Network IntegrationDeployments
1 Single customer access
Multi-tenant building
Campus connection
Diverse lateral
Backhaul or ring closure
Point-to-point connection2
3
4
5
6
23
4
5
6
5
1
and more…
• Mobile network extensions• Mobile network backhaul• Spatial diversity

Copyright © 2002 Terabeam Corporation. All rights reserved. 20
Jersey City ManhattanHudson River
Merrill Lynch Office Merrill Lynch Office
Merrill Lynch Office
2.6 km
1.8 km
1.6 km
• Merrill Lynch urgently needed additional connectivity to three locations.
• Terabeam installed Gig-E FSO units to build a ring topology to back up the SONET network
• Installation was completed within 7 days of first call
Applications & Network IntegrationDisaster Recovery – After 9/11Applications & Network IntegrationDisaster Recovery – After 9/11

Copyright © 2002 Terabeam Corporation. All rights reserved. 21
Applications & Network IntegrationHybrid SolutionsApplications & Network IntegrationHybrid Solutions
Automatic protection switching between FSO, Millimeter Wave, and/or terrestrial fiber can approach 99.999% availability
FSO
RF
Copper or Fiber

Copyright © 2002 Terabeam Corporation. All rights reserved. 22
Applications & Network Integration
Hybrid Solutions: Non-Correlated Failures
Applications & Network Integration
Hybrid Solutions: Non-Correlated Failures
C O 2
C O 2
O 3
O 2
O 2
H O2
H O2
H O2
H O , C O2 2
H O2
H O2
H O2
D R IZ Z L E (0 .2 5 m m /h r)
M illimeter
10 GHz3 cm
0.1 dB/Km
1 dB/Km
10 dB/Km
100 dB/Km
1,000 dB/Km
100 GHz3 mm
1 THz0.3 mm
10 THz30 m
100 THz3 m
1,000 THz0.3 m
Submillimeter Infrared Visible
H E AV Y R A IN (2 5 m m /h r)
V is ib i lity 5 0 m F O G (0 .1 g /m )3
E X C E S S IV E R A I N (1 5 0 m m /h r)
MMW (60 GHz)
FSO (30-400 THz)

Copyright © 2002 Terabeam Corporation. All rights reserved. 23
Applications & Network IntegrationFree-Space & 60 GHz MMW Hybrids
Applications & Network IntegrationFree-Space & 60 GHz MMW Hybrids
FSO 60 GHz Radio
Weather Works well in rain Works well in fog
Licensing Unlicensed Unlicensed
Interference No interference Minimal interference
Range 20m – 4 km 20m – 1.2 km
Mounting Options
Indoor, outdoor Outdoor

Copyright © 2002 Terabeam Corporation. All rights reserved. 24
The Future of FSOFSO TodayThe Future of FSOFSO Today
• The high bandwidth of fiber with the speed and ease of installation of wireless
• Unlicensed all over the world due to its inherent resistance to interference
• Highly secure and safe
• Allows through the window connectivity and single customer service
• Fundamentally compliments fiber by accelerating the first and last mile

Copyright © 2002 Terabeam Corporation. All rights reserved. 25
The Future of FSOWhat’s on the Horizon?The Future of FSOWhat’s on the Horizon?
• All optical – “Fiber through the air”
• Lighter, smaller units
• “Innocuous” form factors (e.g., a pane of glass acting as a receive element)
• Fundamentally the cheapest way to cross the street at 100 Mbps
• Can be used to provision big bandwidth almost everywhere
– Where fiber can’t offer an adequate ROI
– Where 99.9 is acceptable
– To the home?

Copyright © 2002 Terabeam Corporation. All rights reserved. 26
Thank YouThank You