copyright 2004, southwest research institute, all rights reserved. nessus capabilities for...
TRANSCRIPT

Copyright 2004, Southwest Research Institute, All Rights Reserved.
NESSUS Capabilities for Ill-Behaved Performance Functions
David Riha and Ben Thacker
Southwest Research Institute
Simeon Fitch
Mustard Seed Software
45th AIAA/ASME/ASCE/AHS/ASC Structures,Structural Dynamics & Materials Conference
6th AIAA Non-Deterministic Approaches Forum
Palm Springs, California
April 19-22, 2004
Copyright 2004, Southwest Research Institute, All Rights Reserved.
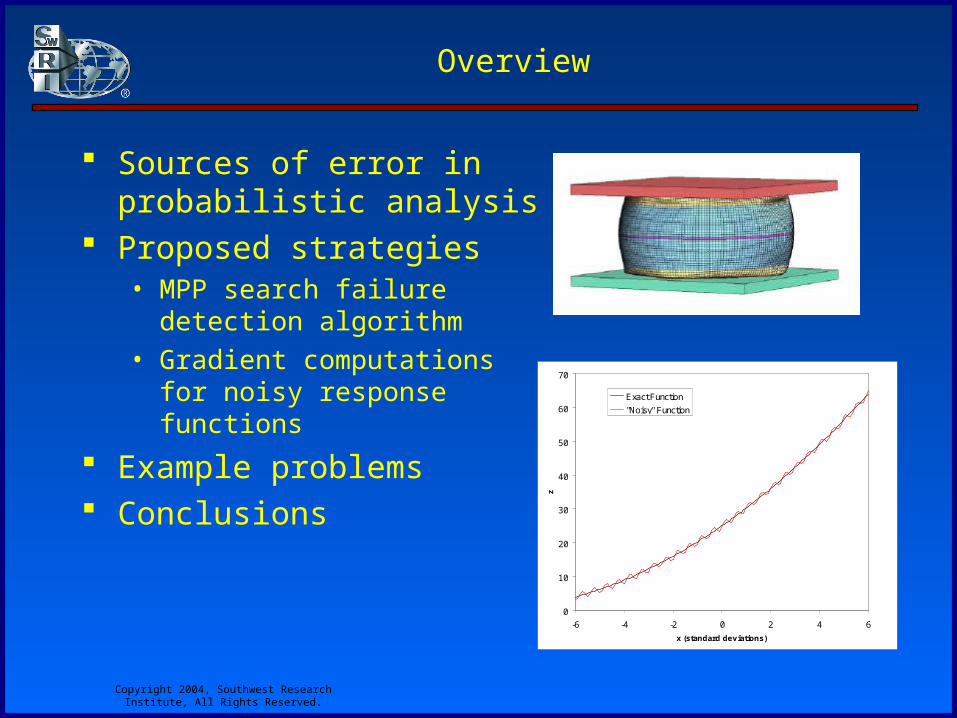
Overview
Sources of error in probabilistic analysis
Proposed strategies• MPP search failure detection
algorithm
• Gradient computations for noisy response functions
Example problems Conclusions
0
10
20
30
40
50
60
70
-6 -4 -2 0 2 4 6
x (standard deviations)
z
Exact Function
"Noisy" Function
Copyright 2004, Southwest Research Institute, All Rights Reserved.
Source of Error in Probabilistic Analysis
1. Model Approximation• First and second-order approximation
• Calculation of derivatives
• Model simplification
2. Uncertainty Characterization• Insufficient data
• Selection of incorrect distribution
3. Numerical Algorithm• Transformations to standard normal
• Convergence error in locating the MPP
• Algorithm error (wrong or multiple MPP
4. Probability Integration• Insufficient number of samples
• First or second-order approximation
All Forms of Error are Reducible• V&V of the probabilistic analysis
• Increased data collection
• Development of more accurate and robust analysis methods
Copyright 2004, Southwest Research Institute, All Rights Reserved.
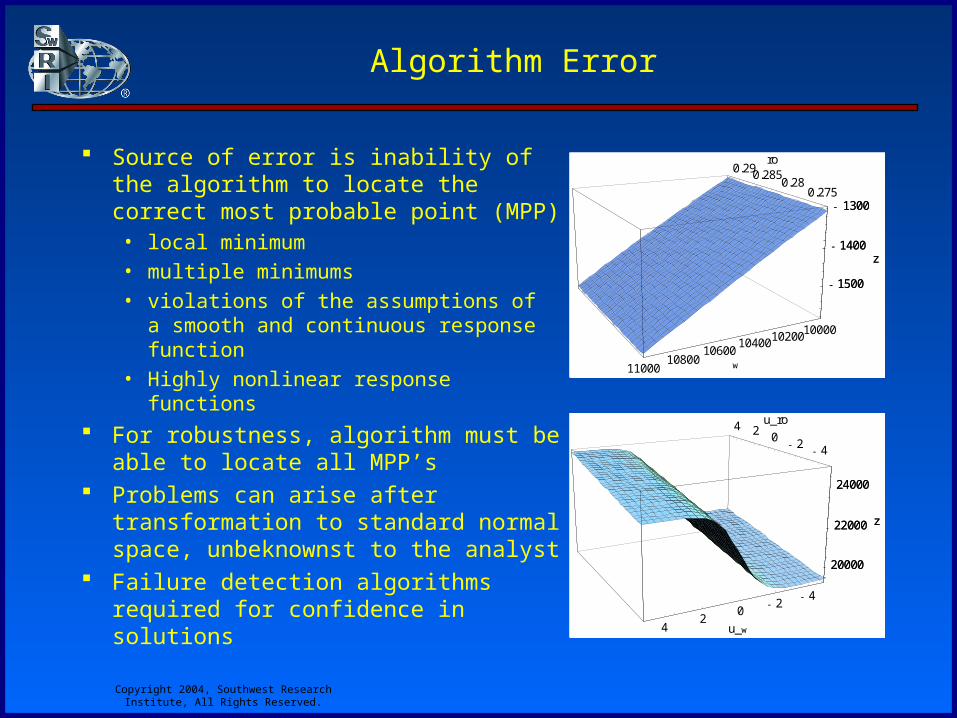
Algorithm Error
Source of error is inability of the algorithm to locate the correct most probable point (MPP)• local minimum
• multiple minimums
• violations of the assumptions of a smooth and continuous response function
• Highly nonlinear response functions
For robustness, algorithm must be able to locate all MPP’s
Problems can arise after transformation to standard normal space, unbeknownst to the analyst
Failure detection algorithms required for confidence in solutions
0.2750.280.2850.29
ro
1000010200104001060010800
11000 w
- 1500
- 1400
- 1300
z
- 1500
- 1400
- 1300
z
- 4- 2024 u_ro
- 4- 202
4 u_w
20000
22000
24000
z
20000
22000
24000
z

Copyright 2004, Southwest Research Institute, All Rights Reserved.
Model Approximation
Model approximation can result from a trade-off between computational efficiency and accuracy• Mesh size• Time integration settings
Derivative calculations• Analytical derivatives generally not
available for nonlinear analyses• Source code not available for third party
analysis packages to implement analytical derivatives
• Finite difference approximations are required
Response Surface approach commonly used to avoid derivative computations• May not capture local response• Large number of function evaluations
may be required
Copyright 2004, Southwest Research Institute, All Rights Reserved.
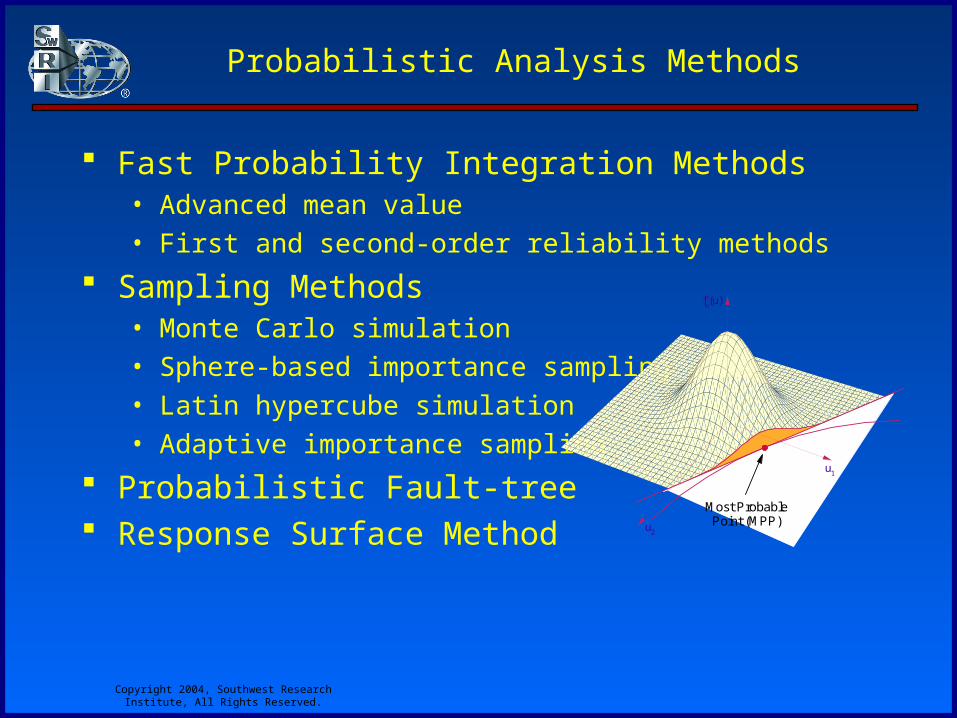
Probabilistic Analysis Methods
Fast Probability Integration Methods• Advanced mean value
• First and second-order reliability methods
Sampling Methods• Monte Carlo simulation
• Sphere-based importance sampling
• Latin hypercube simulation
• Adaptive importance sampling
Probabilistic Fault-tree Response Surface Method
u1
u2
f (u)u
Most Probable Point (MPP)
Copyright 2004, Southwest Research Institute, All Rights Reserved.
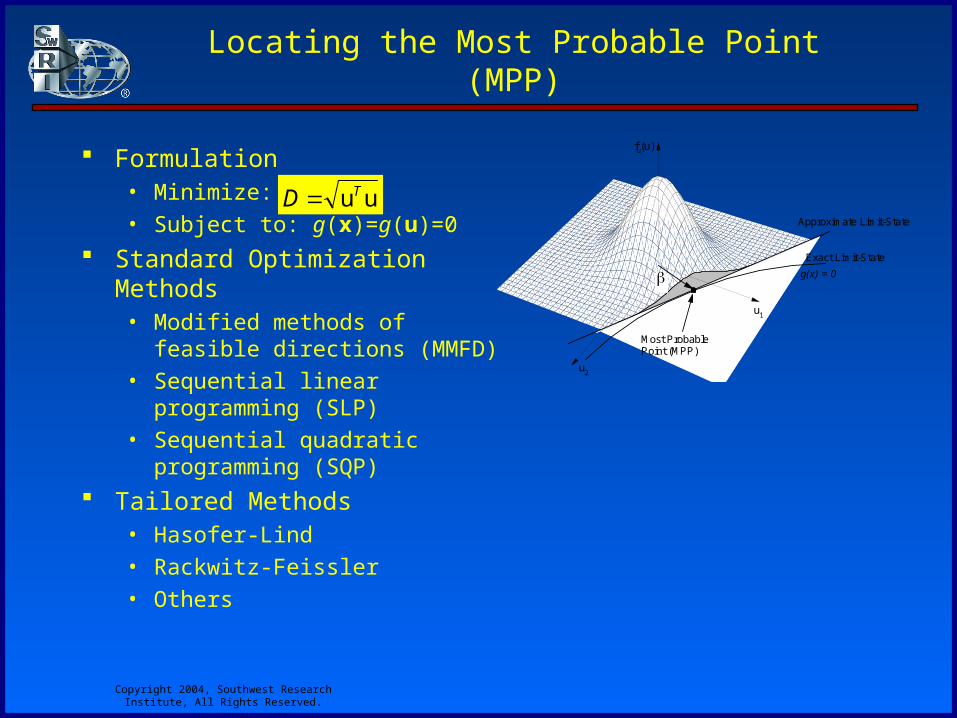
Locating the Most Probable Point (MPP)
Formulation• Minimize:
• Subject to: g(x)=g(u)=0
Standard Optimization Methods• Modified methods of feasible
directions (MMFD)
• Sequential linear programming (SLP)
• Sequential quadratic programming (SQP)
Tailored Methods• Hasofer-Lind
• Rackwitz-Feissler
• Others
uuTD
u1
u2
f (u)u
Most Probable Point (MPP)
Approximate Limit-State
Exact Limit-State
g(x) = 0

Copyright 2004, Southwest Research Institute, All Rights Reserved.
MPP Search Failure Detection Algorithm
Literature and experience identifies the Rackwitz-Feissler MPP search algorithm as being more efficient when it converges over other optimization algorithms (MMFD, SQP, etc.)
Approach needed to identify when RF fails• Determine failure is occurring early in the search process to
eliminate potentially expensive function evaluations
• Automatically switch to a more robust yet computationally efficient optimization algorithm to locate the MPP
• Utilize initial search points as a starting point for more robust optimization methods
Copyright 2004, Southwest Research Institute, All Rights Reserved.
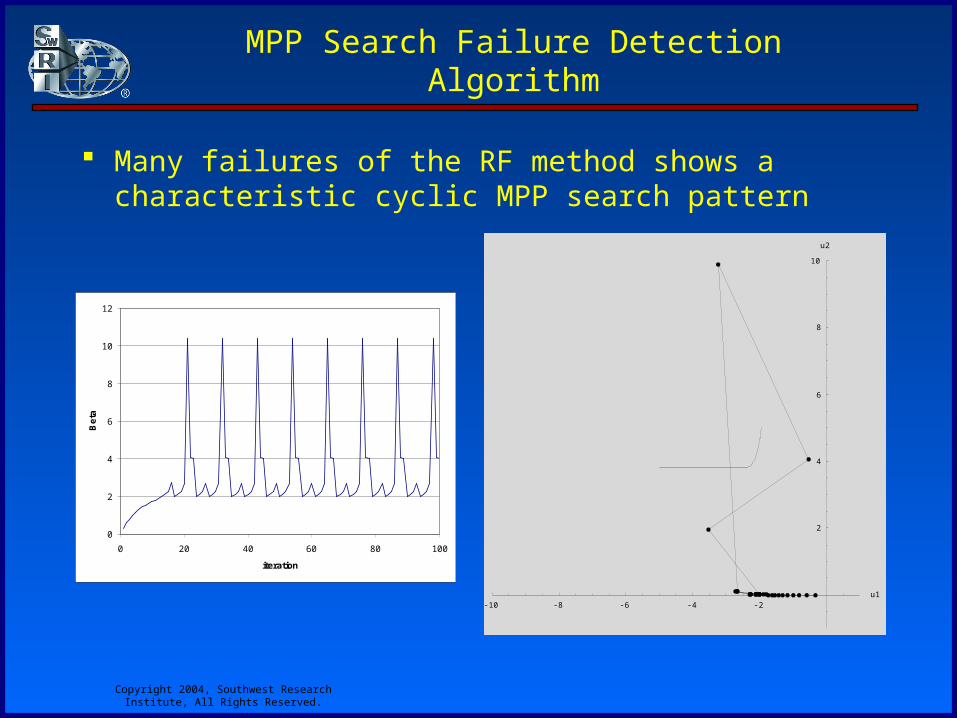
MPP Search Failure Detection Algorithm
Many failures of the RF method shows a characteristic cyclic MPP search pattern
-10 -8 -6 -4 -2u1
2
4
6
8
10
u2
0
2
4
6
8
10
12
0 20 40 60 80 100
iteration
Be
ta

Copyright 2004, Southwest Research Institute, All Rights Reserved.
MPP Search Failure Detection Algorithm
Algorithm• Monitor the autocorrelation of
during the search process• k is the lag between search points
and a large autocorrelation value indicates similar points in the search
• Initial points in the search are eliminated from the test to avoid the initial search process
• Failure is defined when the autocorrelation exceeds a critical correlation value (e.g., 0.5) for 3 points
• MPP Search algorithm changed upon failure detection
-0.4
-0.2
0
0.2
0.4
0.6
0.8
1
0 5 10 15 20 25 30
lag
Au
toc
orr
ela
tio
n
N
ii
kN
ikii
kr
1
1
)(
))((

Copyright 2004, Southwest Research Institute, All Rights Reserved.
Gradient Computations forNoisy Response Functions
Gradient information required for efficient probabilistic algorithms• Gradient-based optimization for MPP search
Noisy response• Transient analyses• Impact and blast loading• Sliding friction and contact surfaces• Models using course meshes and time steps
Analytical derivatives not available• Nonlinear solutions• Third party software packages
Finite difference• Forward, backward, central difference• Step size is critical• Capture global response and local sensitivity• Noisy solutions can cause problems
Copyright 2004, Southwest Research Institute, All Rights Reserved.
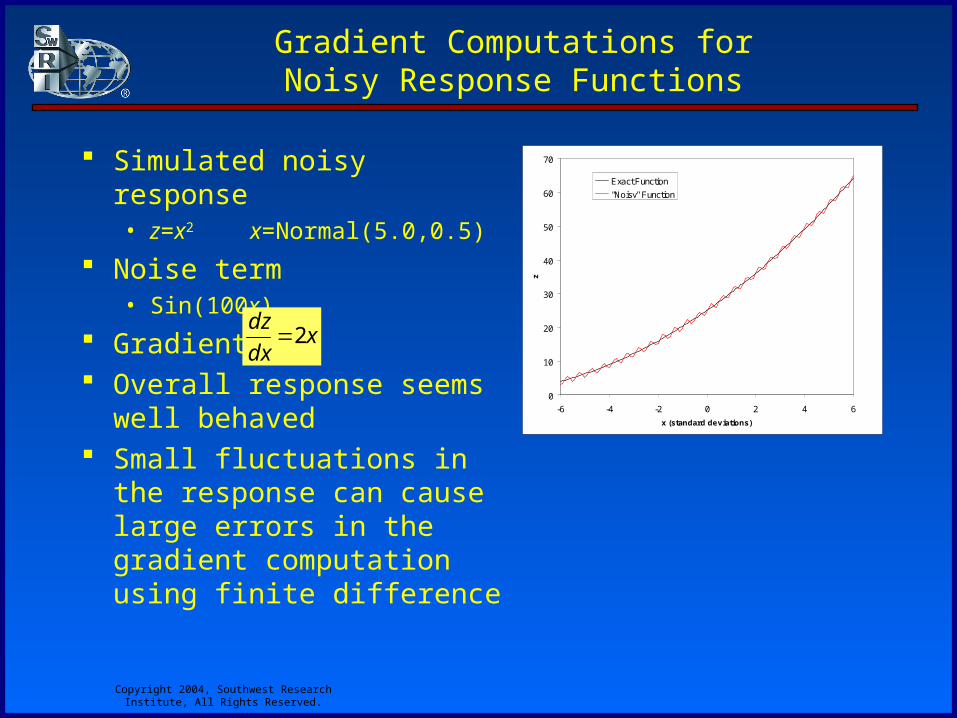
Gradient Computations forNoisy Response Functions
Simulated noisy response• z=x2 x=Normal(5.0,0.5)
Noise term• Sin(100x)
Gradient Overall response seems well
behaved Small fluctuations in the
response can cause large errors in the gradient computation using finite difference
0
10
20
30
40
50
60
70
-6 -4 -2 0 2 4 6
x (standard deviations)
z
Exact Function
"Noisy" Function
xdx
dz2

Copyright 2004, Southwest Research Institute, All Rights Reserved.
Example Finite Difference Approximationfor a Noisy Response function
Small step size causes large error in the gradient (0.1) Inspecting the response variation provides a step size that
captures the local sensitivity but eliminates the majority of the noise (0.5
-20
-10
0
10
20
30
40
-6 -4 -2 0 2 4 6
x (standard deviations)
dz/
dx
Analytical Derivative
Finite Difference (0.1*sigma)0
2
4
6
8
10
12
14
16
18
-6 -4 -2 0 2 4 6
x (standard deviations)
dz/
dx
Analytical DerivativeFinite Difference (0.5*sigma)
Copyright 2004, Southwest Research Institute, All Rights Reserved.
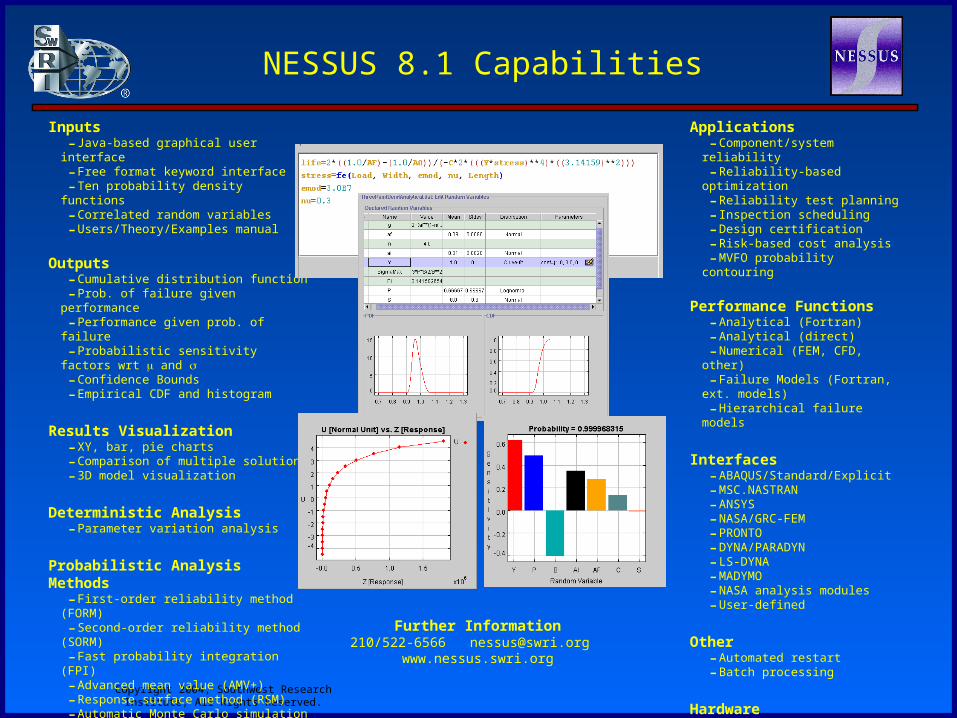
Inputs-Java-based graphical user interface-Free format keyword interface-Ten probability density functions-Correlated random variables-Users/Theory/Examples manual
Outputs-Cumulative distribution function-Prob. of failure given performance-Performance given prob. of failure-Probabilistic sensitivity factors wrt and -Confidence Bounds-Empirical CDF and histogram
Results Visualization-XY, bar, pie charts-Comparison of multiple solutions-3D model visualization
Deterministic Analysis-Parameter variation analysis
Probabilistic Analysis Methods-First-order reliability method (FORM)-Second-order reliability method (SORM)-Fast probability integration (FPI)-Advanced mean value (AMV+)-Response surface method (RSM)-Automatic Monte Carlo simulation (MC)-Importance sampling (ISAM)-Latin hypercube simulation (LHS)-Adaptive importance sampling (AIS)-Probabilistic fault-tree (PFTA)
Applications-Component/system reliability-Reliability-based optimization-Reliability test planning-Inspection scheduling-Design certification-Risk-based cost analysis-MVFO probability contouring
Performance Functions-Analytical (Fortran)-Analytical (direct)-Numerical (FEM, CFD, other)-Failure Models (Fortran, ext.
models)-Hierarchical failure models
Interfaces-ABAQUS/Standard/Explicit-MSC.NASTRAN-ANSYS-NASA/GRC-FEM-PRONTO-DYNA/PARADYN-LS-DYNA-MADYMO-NASA analysis modules-User-defined
Other-Automated restart-Batch processing
Hardware-PC (NT4, W2000, XP)-Unix workstations (HP, Sun, SGI)-Other systems
NESSUS 8.1 Capabilities
Further Information210/522-6566 [email protected] www.nessus.swri.org

Copyright 2004, Southwest Research Institute, All Rights Reserved.
MPP Search Failure Detection Algorithm Example
Response function:• x1=uniform(0,100)
• x2 Beta(=0.5)
Transformation to u-space causes increased non-linearity Modified RF method does not converge for Z0=4.52
50100 25.3
1 xxz
-4 -2 2 4u1
-4
-2
2
4
u2
-4 -2 2 4u1
-4
-2
2
4
u2

Copyright 2004, Southwest Research Institute, All Rights Reserved.
MPP Search Failure Detection Algorithm Example
Autocorrelation computed for incrementally increasing iteration numbers• used to eliminate initial search
points
Failure detected after 40 steps• 0.5 correlation cutoff
• 3 successive points
• detected after 2 cycles
SQP method used after failure is detected and identifies the correct MPP
-0.3
-0.1
0.1
0.3
0.5
0.7
0.9
0 10 20 30 40 50
Starting Iteration
Au
toco
rrel
atio
n 30
33
40
50
100
0
2
4
6
8
10
12
0 20 40 60 80 100
iteration
Be
ta

Copyright 2004, Southwest Research Institute, All Rights Reserved.
Noisy Response Function Example
Stainless steel float crush between two platens
Response is the total energy to crush the float
Anticipate a “noisy” solution because of the contact surfaces and coarseness of the model
r=4.4735
r
t
Platen location is a functionof the thickness and radius
Copyright 2004, Southwest Research Institute, All Rights Reserved.
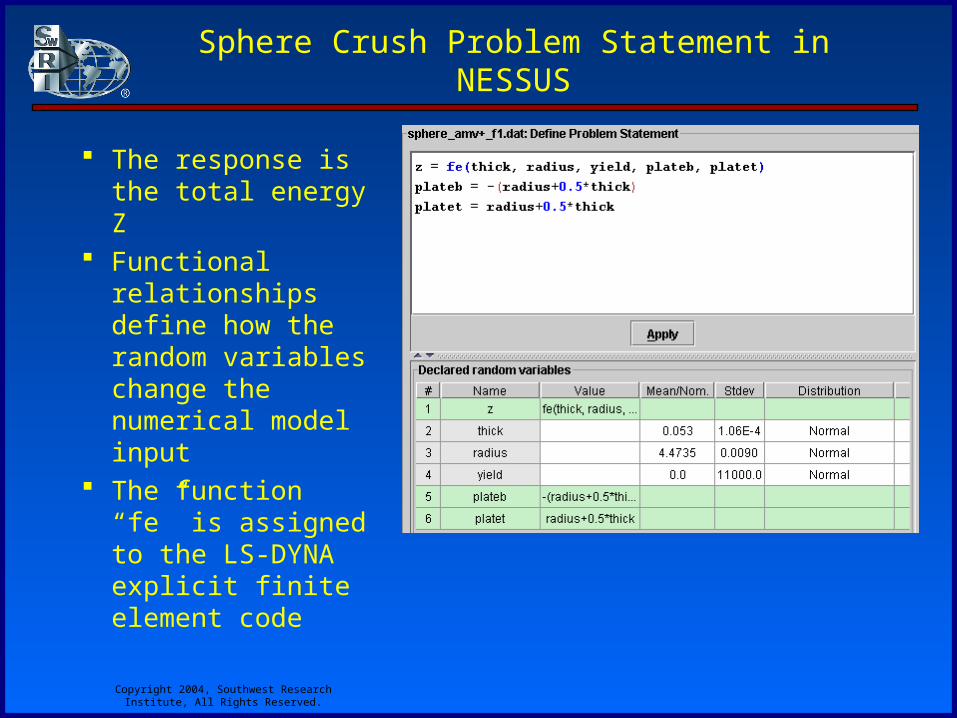
Sphere Crush Problem Statement in NESSUS
The response is the total energy Z
Functional relationships define how the random variables change the numerical model input
The function “fe” is assigned to the LS-DYNA explicit finite element code
Copyright 2004, Southwest Research Institute, All Rights Reserved.
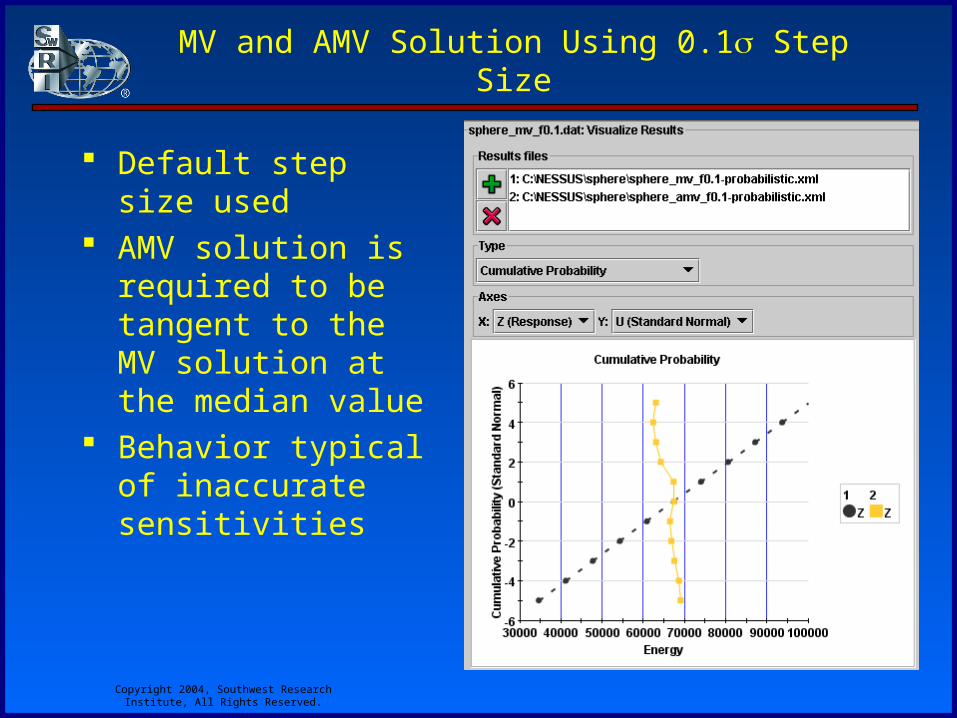
MV and AMV Solution Using 0.1 Step Size
Default step size used AMV solution is
required to be tangent to the MV solution at the median value
Behavior typical of inaccurate sensitivities

Copyright 2004, Southwest Research Institute, All Rights Reserved.
Parameter Variation Analysis
Parameter variation analysis provides a tool to understand the deterministic response
Select step sizes for finite difference
Verify model for parameter values away from the mean
A step size of 1.0 is selected to capture the gradient while maintaining the local sensitivity

Copyright 2004, Southwest Research Institute, All Rights Reserved.
AMV+ Solution Using ImprovedFinite Difference Step Size
Step size selection critical for noisy response functions
AMV and AMV+ solutions tangent to MV solution at the median value
AMV+ converges within a 5% tolerance on Z

Copyright 2004, Southwest Research Institute, All Rights Reserved.
Noisy Response FunctionAMV+ Compared to LHS
AMV+ solution compares well with LHS (2000 samples)
Error may be caused by crude mesh and/or contact surfaces
Copyright 2004, Southwest Research Institute, All Rights Reserved.
Conclusions
MPP search failure detection algorithm developed• Able to identify characteristic cyclic behavior of the RF MPP search
algorithm early in the solution• Once failure is detected, an alternative solution strategy can be
automatically employed• Research continues to identify critical correlation values to identify failure
and the use of function solutions for starting the next solution strategy NESSUS visualization capabilities provide a practical tool for
performing probabilistic analysis with noisy response functions where analytical derivatives are not available• Parameter variation analysis aides in understanding the deterministic
problem and selecting step sizes for finite difference approximations to the gradients
• Overlay of different steps in the AMV+ solution indicates the potential of inaccurate gradient solutions
Continued robustness improvements in probabilistic methods and tools is required for acceptance of the probabilistic design approach