copyright © 2006. earthquakes and megacities initiative
TRANSCRIPT
Copyright © 2006. Earthquakes and Megacities Initiative, Inc. (EMI) All Rights Reserved. This publication or any part thereof must not be produced in any form without the written permission from the Earthquakes and Megacities Initiative, Inc. (EMI). ISSN: 1908-3653
Opinions expressed in signed contributions are those of the authors and do not necessarily reflect those of the Earthquakes and Megacities Initiative Inc. Printed in the Philippines by Earthquakes and Megacities Initiative, Inc. (EMI) An international not-for-profit scientific organization dedicated to disaster risk reduction of the world’s megacities 2nd Floor Puno Bldg. Annex, 47 Kalayaan Avenue, Diliman, Quezon City, Philippines, 1101 (+63) 2 9279643 http://www.earthquakesandmegacities.org [email protected]
Editor: Dr. Marqueza L. Reyes Editorial Consultants: Mrs. Shirley Mattingly Dr. Fouad Bendimerad Prof. Jeannette Fernandez Dr. Asteya Santiago Cover Design: Kristoffer B. Berse Layout: Jerome E. Cruz Cover Photo Credit: Makati City Gov’t, Philippines

Cross-Cutting Capacity Development Series Fifth Metro Manila Field Trip Proceedings
Mainstreaming Disaster Risk Reduction Through Land Use
Planning and Enhancing Management Practices
Edited by
Marqueza L. Reyes
Earthquakes and Megacities Initiative
Organizers
3cd Program Implementation Team • Dr. Fouad M. Bendimerad, EMI Chairman • Mrs. Shirley Mattingly, Program Director • Mr. Khalid Bouzina, Project Manager • Prof. Jeannette Fernandez, Component 1 Coordinator
EMI Secretariat
• Atty. Violeta S. Seva, General-Secretary • Dr. Antonio L. Fernandez, Principal Scientist • Dr. Marqueza L. Reyes, Urban Seismic Risk Reduction Specialist • Ms. Tara L. Ledesma, Program and Administrative Assistant • Ms. Aubrey P. Lo, Finance and Administrative Assistant • Mr. Jerome E. Cruz, Research Assistant • Ms. Cristina Jean C. Dazo, Research Assistant
Philippine Institute of Volcanology and Seismology (Local Investigator)
• Dr. Renato U. Solidum, Director • Ms. Myla Panol • Ms. Annie Encarnacion • Ms. Esther Garrido
i
FOREWORD
For about two years now, the Earthquakes and Megacities Initiative (EMI) has had the pleasure of working with outstanding local and international partners in a program to reduce disaster risk in Metropolitan Manila. The most significant outcome of these efforts so far has been the growth of tight partnerships and friendships that bond us together with a common goal. The cities of Makati, Marikina, and Quezon City have each welcomed multi-disciplinary teams from the other cities to collaborate together on enhancing risk reduction capabilities. Workshops on diverse topics have brought together representatives from national government agencies, government agencies operation in the National Capital Region (NCR) agencies, universities, non-governmental organizations, and the seventeen cities and municipalities of Metro Manila for thoughtful discussions and the setting of future work agendas. Five self-sustaining Focus Groups have been formed to pursue several objectives, all part of developing and implementing Metro Manila’s Disaster Risk Management Master Plan in order to make Metro Manila safer from disaster. It is well recognized that the Philippines is highly prone to multiple types of disasters, and that Metro Manila, due to its vast population, complexity, and concentration of governmental entities and services, is particularly vulnerable to disasters. Efforts to enhance the urban area’s security and resilience in the face of disasters are by no means new. The Philippine Institute of Volcanology and Seismology, Metro Manila Development Authority, and cities and municipalities in the metropolis, and many other organizations are dedicating ongoing efforts to these goals. EMI’s main contribution is to partner with these institutions as well as international organizations such as the Pacific Disaster Center in Maui, Hawaii, USA, the United Nations Development Programme (UNDP/BCPR), and the ProVention Consortium in a strategic program to focus resources and expertise where they are needed most and based on the combined local and international experience and expertise and local conditions. EMI is proud to be an organization that is based in Metro Manila and is here for the long term. EMI stands proud to work with the people and institutions of Metro Manila, who ultimately hold the key to their own security and protection from disaster’s harm. I look forward to more progress and more accomplishments.
Dr. Fouad Bendimerad Chairperson
Earthquakes and Megacities Initiative

ii
Message Natural hazards kill and affect lives, cultural heritage, economies, development gains, and opportunities. A connection is now recognized between disaster, environmental degradation, and poverty. Hence, recently evolving global efforts in managing disasters, as acknowledged in the “Hyogo Framework for Action 2005-2015”, approach disaster risks reduction through systematic integration into policies, plans and programs for sustainable development and poverty reduction. The Cross-Cutting Capacity Development (3cd) Program, under the umbrella of the Earthquakes and Megacities Initiatives, is one such effort. The 3CD forges partnerships among actors and stakeholders in disaster management. It creates space for participation of researchers, administrators, disaster management practitioners, and civil society members. It has a potential for being an instrument of social transformation – from reactive to anticipative. The fifth fieldwork undertaken in Metro Manila by the 3cd Program introduces a new concept called the Risk Indicators, previously piloted in Bogota, Colombia and brought here for further testing and improvement. It also continues to build on previously established works in land-use planning. Like in previous meetings, the participants represent a wide cross-section of the civil society. The messages and results contained in this proceeding are small steps in achieving the goals of the 3cd Program in particular, and the Hyogo Framework in general. We recognize that the birth pains may be long and wearisome. But it is also through this process that we are able to develop our capacities, harness our collective talents, and emerge better skilled.

iii
Message EMI’s Cross-Cutting Capacity Development Program, 3cd, launched its implementation phase in March 2004, after almost a year of careful design and solid engagement of different allies. 3cd is a multi-disciplinary, multi-partner program that builds on seven years of knowledge and experience accumulated by EMI as a result of working with a network of nearly 20 cities around the world. 3cd has the clear mission of working with megacities in the developing world to enhance their efforts to shift the current disaster management processes from response-oriented to mitigation-oriented. Unless mitigation is implemented at the local level, the negative effects of increasing urbanization, aging of buildings, environmental degradation and other physical and social factors will continue to overshadow progress in sustainable development and poverty reduction in megacities. As part of the 3cd Program, the Fifth Field Trip is aimed at giving local stakeholders the tools to integrate into their fields principles and practices that incorporate disaster risk reduction and mitigation. The Risk Indicators Workshop has provided us with an assessment of the capabilities of the local government units in dealing with disasters, and has given us a “where are we now?” perspective and enables us to plan “where we want to go.” The Land Use Planning Workshop on the other hand equips city planners with the right tools to be able to integrate risk reduction into their line of work. Through this publication we hope to fan the flames that were started and continue to push for a culture of disaster risk reduction and mitigation. With our partner organizations and the local stakeholders not only in Metro Manila, but in all cities around the world, together we can work towards a safer society. I praise EMI and its partner institutions for their unrelenting efforts and programs that continue to promote disaster risk reduction practice and methodologies. I congratulate you on the success of the Fifth Field Trip in Metro Manila.
HON. Metro Manila Development Authority

iv
Acknowledgements The accomplishments of the Cross-Cutting Capacity Development Program (3cd) under the aegis of the Earthquakes and Megacities Initiative would not have been possible without the tremendous support, financial and otherwise, of the following partner institutions: United Nations Development Program, Bureau of Crisis Prevention and Recovery (UNDP/BCPR), the ProVention Consortium, Earthquake Disaster Mitigation Research Center (EdM), Kobe University, and the Pacific Disaster Center (PDC). For the success of the Fifth Field Trip in Metro Manila (3cd – Metro Manila) from May 21-26, 2006 during which the Workshops on Risk Indicators and Mainstreaming Disaster Risk Reduction in Land Use Planning took place, we are grateful to the unwavering support and assistance of our local partners, namely, the Philippine Institute of Volcanology and Seismology, in particular to its director, Dr. Renato U. Solidum, the Metro Manila Development Authority, and the three partner cities of EMI in Metro Manila: Makati, Marikina, and Quezon. Our warmest thanks also go to the Barcelona Team composed of Dr. Omar Cardona , Ms. Liliana Carreño and Mr. Alex Barbat of the Institute of Environmental Studies-International Center for Numerical Methods in Engineering (IDEA-CIMNE), Ms. Laurie Johnson, and Mr. Hossein Kalali for sharing their time, expertise, and experience with all the workshop participants and stakeholders in Metro Manila. We also wish to thank Quezon City for providing financial contributions to make the Land Use Planning Workshop possible. Lastly, we would like to thank all the members of the Focus Groups of 3cd-Metro Manila for their deep commitment and heartfelt engagement in the process of implementing the Disaster Risk Management Master Plan of Metro Manila. We are proud to work hand-in-hand with you in making our home a safer and disaster-resilient metropolis. Earthquakes and Megacities Initiative
v
3cd in Metro Manila The Cross-Cutting Capacity Development (3cd) Program is conceived as a long-term inter-disciplinary and multi-partner program that establishes a framework for EMI's capacity building agenda. The Program’s detailed design is developed in collaboration with the participating city and partner institutions and is founded on the local context and institutional capacities, using a highly participatory process. The goal is to establish a disaster risk management process that would ultimately equip cities with a disaster risk management master plan (DRMMP) and assist partner cities to implement sound practices for disaster risk management. The Program is led by a Program Implementation Team (PIT). Through international partnership associations, 3cd develops approaches and tools that can be put in place by megacity governments with the support of local experts and practitioners. The combination of international research and development expertise with megacity governance experience is a hallmark of 3cd. Today, three cities are actively engaged in the 3cd Program: Metro Manila, Philippines; Kathmandu, Nepal; and Mumbai, India.
The First 3cd Coordination Meeting took place in June 2004 in Seeheim, Germany. It was attended by about 20 cities that are members of EMI’s Cluster Cities Project (CCP) and global network of cities. In Metro Manila, the Program implementation phase (Proof of Concept) began in August 2004 with the First Field Trip. Delegates from the cities of Makati and Quezon, Metro Manila Development Authority (MMDA), and other government and non-government organizations participated in an initial fieldwork and workshop. The objectives were to understand the current structures and framework for disaster risk management in Metro Manila and identify some relevant sound practices intended to reduce the impact of flooding and earthquakes. In January 2005, a Memorandum of Cooperation was signed between EMI and MMDA, represented by the EMI Chairman, Dr. Fouad Bendimerad and the MMDA Chairman, Mr. Bayani Fernando. This mutual agreement kicked off what can only be described as a fruitful and beneficial program for Metro Manila. The Second Field Trip of April 2005 initiated formal discussions with MMDA and the future partner cities of Quezon, Makati and Marikina, as well as with local stakeholders to begin the development of the DRMMP of Metro Manila. This was soon followed by the Third Field Trip in August 2005 during which a Stakeholders Workshop was held at the Makati City Hall. More than 80 local stakeholders representing local, regional and national government agencies, NGOs, business sector, media, and the academe participated in the daylong activity. This workshop also led to the creation of five Focus Groups that correspond to the thematic areas of cooperation under the banner of 3cd-Metro Manila. The Fourth Field Trip held in December 2005 highlighted two separate Seminar-Workshops with a unified theme of “Mainstreaming Disaster Risk Reduction in Metro Manila” and a Second Focus Group Meeting. The implementation of the DRMMP of Metro Manila continued with the 5th Field trip in May 2006 where the First Seismic Risk Reduction and Risk Management Indicators Workshop and a Workshop on Mainstreaming Disaster Risk Reduction in Land Use Planning were conducted. This volume is a product of these last two workshops. The next Field Trip for 3cd-Metro Manila is slated in October 2006.
vi
Cross-Cutting Capacity Development Series
Table of Contents Foreword Dr. Fouad Bendimerad Chairperson, Earthquakes and Megacities Initiative Message Dr. Renato U. Solidum Philippine Institute of Volcanology and Seismology Local Investigator, EMI 3cd Program Message Hon. Bayani Fernando Chairperson, Metropolitan Manila Development Authority Acknowledgements
3cd in Metro Manila
The Cross-Cutting Capacity (3cd) Program in Metro Manila 1 Prof. Jeannette Fernandez
I. First Seismic Risk Reduction and Risk Management 7 Indicators Workshop in Metro Manila
Using USRi and DRMi in Megacities: The Case of Bogota 10 Ms. Martha Liliana Carreno
Workshop Outputs Disaster Risk Management Index 33 Urban Seismic Risk Index 41 II. Mainstreaming Disaster Risk Reduction in Land Use Planning 56
Strategy for Mainstreaming Disaster Risk Reduction in 59 Land Use Planning: The 3cd Experience in Metro Manila Dr. Marqueza Reyes, EnP Integrating Risk Management in Land Use Planning 62 Ms. Laurie Johnson, AICP Workshop Outputs 77 Assessment on Institutional Mainstreaming of DRR using the Tearfund Tool Hands on Group Exercise III. Appendices 92
List of Participants Photo Gallery Workshop Evaluation

1
3cd Program—DRMMP Implementation in Metro Manila
The Cross-Cutting Capacity Development (3cd) Program
Prof. Jeannette Fernandez1
The Cross-Cutting Capacity Development Program or 3cd Program is a long-term inter-disciplinary program, conceived to assist megacity governments in implementing sound disaster risk management practices. The purpose of the 3cd Program is to find ways to conduct risk reduction and management activities before disasters strike, in order to preserve lives, enhance economic activities, historical wealth, and social structures in communities, particularly in megacities of developing nations. 1. EMI’s Mainstreaming Model The primary goal of disaster risk management is to reduce the risk through various measures of prevention and mitigation. The EMI mainstreaming model (Figure 1) suggests that local governments should be able to utilize the structure already in place to promote risk reduction. The inner boxes show the responsibilities that local government units carry out in their daily affairs that can incorporate risk reduction practices. Further, the interaction with the organized civil society is key to raising awareness and to initiating participatory processes that enable concrete action through innovative tools. Finally, the support of the national level authorities should contribute to these efforts by strengthening the legal and regulatory instruments, providing required resources and general oversight of locally driven processes. Ultimately, effective management of risk should reinforce society and contribute to poverty reduction
Urban Planning
Building & Construction
Social Services
Financial Planning
Public Works
Emergency Management
Public Safety
Education & Recreation
Local Authorities
Civil Society
Academia Media Business
NGOs CBOs
Central Authorities
Legal and Institutional Framework
Polic
y an
d R
egul
atio
nR
esources and Oversight
Urban Planning
Building & Construction
Social Services
Financial Planning
Public Works
Emergency Management
Public Safety
Education & Recreation
Urban Planning
Building & Construction
Social Services
Financial Planning
Urban Planning
Building & Construction
Social Services
Financial Planning
Public Works
Emergency Management
Public Safety
Education & Recreation
Public Works
Emergency Management
Public Safety
Education & Recreation
Local Authorities
Civil Society
Academia Media Business
NGOs CBOsNGOs CBOs
Central Authorities
Legal and Institutional Framework
Polic
y an
d R
egul
atio
nR
esources and Oversight
Central Coordination + Local Implementation + Participation
Figure 1 EMI Mainstreaming Model
1 Component 1 Coordinator, EMI-3cd Program; Megacities Specialist, Pacific Disaster Center (PDC), Maui, Hawaii.

2
Cross-Cutting Capacity Development Series
2. Disaster Risk Management Master Plan (DRMMP) The DRMMP and its implementation process (Figure 2) results in the development of a “menu” of actions to be prioritized and organized into “action plans,” comprising the overall master plan for disaster risk reduction. These action plans are driven by the knowledge and understanding of the hazards that may impact a particular location and how the exposed elements could be affected.
3. DRMMP Development Process The DRMMP was developed using five steps, namely:
3.1 Evaluate the results of previously concluded studies.
Metro Manila Studies Products
Earthquake and Tsunami Disaster Mitigation Technologies and their Integration for the Asia Pacific Region (EqTAP)—Earthquake Disaster Mitigation—National Research Institute for Earth Science and Disaster Prevention (EdM-NIED),2004
Case study to operationalize the EqTAP Master Plan and set up a risk management framework
Metro Manila Earthquake Impact Reduction Study (MMEIRS)—Japan International Cooperation Agency (JICA), Metro Manila Development Authority (MMDA),PHIVOLCS, 2004
Master Plan for earthquake impact reduction for MM, damage scenarios for earthquakes and related hazards
Marikina Risk and Vulnerability Assessments, Pacific Disaster Center (PDC), 2004
Framework for assessing risk and mitigating the impacts from urban flooding and earthquakes in Marikina City
Figure 2 Components of DRMMP
Table 1 Concluded Studies Done in Metro Manila
Disaster Risk Assessment
Risk Parameters
Disaster Risk Management Master Plan DRMMP
Mitigation and Prevention Action Plan
Response and Recovery
Action Plan
Preparedness and
Awareness
Institutional Building
Action Plan
Pilot Studies

3
3cd Program—DRMMP Implementation in Metro Manila
Quezon MarikinaMakati
Pilot Cities
Quezon MarikinaMakati
Pilot Cities
MMDA PHIVOLCSPacificDisaster Center
UNDPPROVENTIONEdM‐Team 4
MMDAMMDA PHIVOLCSPHIVOLCSPacificDisaster Center
PacificDisaster Center
UNDPPROVENTIONEdM‐Team 4
UNDPPROVENTIONEdM‐Team 4
The 3cd Program has set up a partnership structure composed of a local investigator, three pilot cities and six focus groups to institutionalize and streamline DRM efforts in the metropolis and to facilitate coordination with international partners. Each of the six focus groups is concerned with one of the following areas of interest:
1.Information and communication technologies for disaster risk management, ICT2.Land use planning, LUP3.Disaster risk management training needs assessment, TNA4.Contribution of civil society to disaster risk management 5.Legal and institutional arrangements, LIA, to support risk reduction efforts6.Use of a megacity indicators system, MIS, for risk reduction and risk management
LocalInvestigatorPHIVOLCS
SixFocus Groups
LocalInvestigatorPHIVOLCS
SixFocus Groups
M IE M IE
3.2 Determine current practices, sound practices, and gaps.
Figure 2. Screen shot of the MDRM-KB
3.3 Establish a structure that will be used for disaster risk management implementation.
PARTNERSHIP STRUCTURE Focus Groups on: 1. Information and
communication, ICT 2. Land Use and Planning,
LUP 3. Training Needs
Assessment, TNA 4. Civil Society and NGOs,
CBOs 5. Legal and Institutional
Arrangements, LIA 6. Megacity Indicator System,
MIS (in the process of being established)
Figure 3. Partnership Structure in Metro Manila

4
Cross-Cutting Capacity Development Series
3.4 Translate this knowledge into action plans. This has resulted in the formation of a Ten-Point Action Plan (Table 2) and a Five-Point Consensus (Table 3) among various stakeholders.
5-Point Consensus DRMMP of Metro Manila
Area of Cooperation No. 1 Use of Technologies for Risk Communication and Awareness (Map Viewer) Local Lead Team: PHIVOLCS, MMDA
Area of Cooperation No. 2 Incorporate risk reduction criteria in land use plans Local Lead Team: MMDA (Planning Office), Marikina City
Area of Cooperation No. 3 Training assessment and capacity enhancement for DRM Local Lead Team: Office of Civil Defense, MMDA
Area of Cooperation No. 4 Mobilizing resources among NGOs and professional organizations in DRM process Local Lead Team: MMDA, PHIVOLCS, PICE
Area of Cooperation No. 5 Improving legal and institutional arrangements for improved DRM delivery Local Lead Team: MMDA, NDCC
10-Point Action Plan (DRMMP of Metro Manila)
1. Strengthen the Metropolitan Manila Disaster Coordinating Council (MMDCC).
2. Promote adoption of disaster management ordinance by each city and municipality.
3. Promote the reorganization and revitalization of city/municipality and barangay disaster coordinating council.
4. Institutionalize local government framework and financing for disaster management.
5. Enhance lateral and vertical inter-agency and inter-governmental communication and coordination.
6. Enhance legal basis for disaster risk management at the national level by updating/replacing PD1566.
7. Promote policies that encourage implementation of disaster risk reduction measures; Identify mechanisms for mainstreaming DRM into city functions.
8. Promote local government mitigation planning through the use of existing planning tools.
9. Conduct training needs assessment and develop capacity building programs.
10. Strengthen barangay level preparedness for disaster response and relief.
Table 2
Table 3
5
3cd Program—DRMMP Implementation in Metro Manila
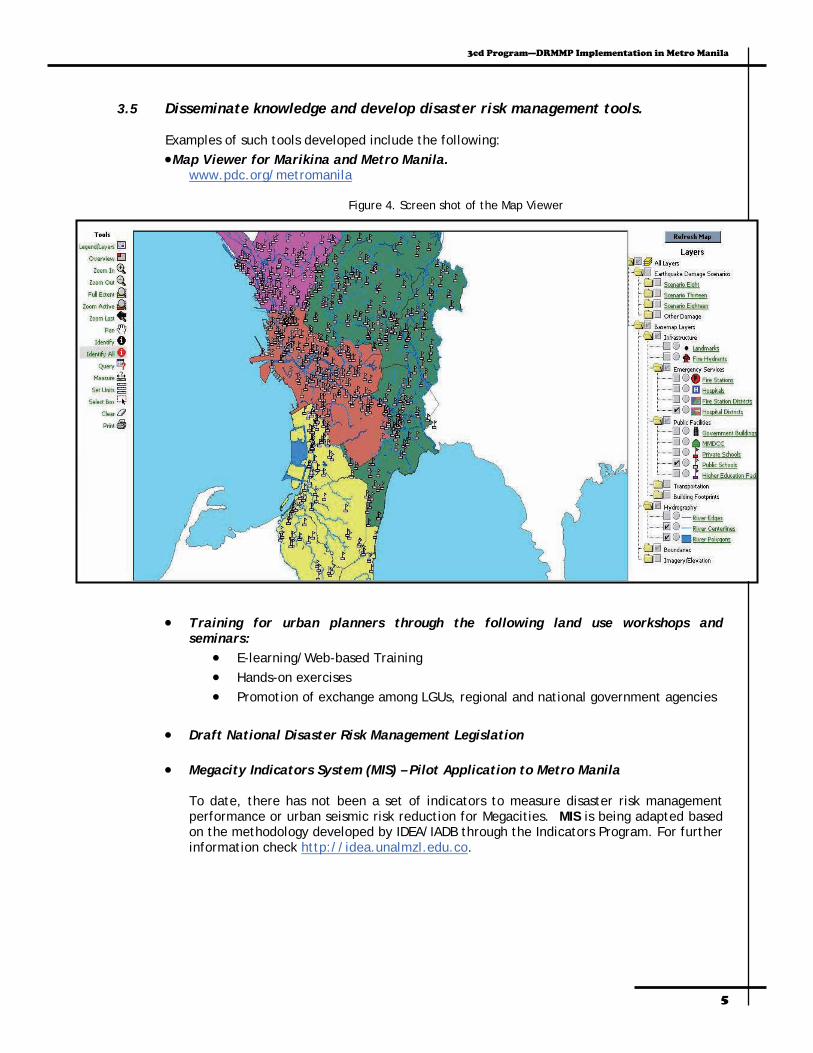
3.5 Disseminate knowledge and develop disaster risk management tools.
Examples of such tools developed include the following: •Map Viewer for Marikina and Metro Manila.
www.pdc.org/metromanila
Figure 4. Screen shot of the Map Viewer
• Training for urban planners through the following land use workshops and seminars:
• E-learning/Web-based Training • Hands-on exercises • Promotion of exchange among LGUs, regional and national government agencies
• Draft National Disaster Risk Management Legislation • Megacity Indicators System (MIS) – Pilot Application to Metro Manila
To date, there has not been a set of indicators to measure disaster risk management performance or urban seismic risk reduction for Megacities. MIS is being adapted based on the methodology developed by IDEA/IADB through the Indicators Program. For further information check http://idea.unalmzl.edu.co.

6
Cross-Cutting Capacity Development Series
There are two indices that are being tested for application in Metro Manila. These are the Disaster Risk Management Index (DRMi) and the Urban Seismic Risk Index (USRi). The following figures show the definitions and indicators of each index. 4. Concluding Note These five steps have been applied and followed by the 3cd Program in developing and implementing the Disaster Risk Management Master Plan of Metro Manila.
Figure 5 Disaster Risk Management Index
Figure 5 Disaster Risk Management Index

8
Cross-Cutting Capacity Development Series
First Seismic Risk Reduction and Risk Management Indicators Workshop May 22, 2006 PHIVOLCS Auditorium Background Monitoring the progress of managing disaster risks in a city can benefit from using indicators that can be compared against benchmarks. In Bogota City, Colombia city officials have been using a system of indicators that allows comparison among the districts. This has helped the city monitor its progress in the field of disaster risk management. This system was developed at the Institute of Environmental Studies (IDEA) at Universidad Nacional de Colombia-Manizales. Recently, the system was piloted in Barcelona by the International Center of Numerical Methods in Engineering (CIMNE) at the Technical University of Catalonia (referred to as the Barcelona Team). At the Project Implementation Team meeting held on February 17-19, 2006 at Seeheim, Germany, the Barcelona Team presented the methodology of the indicators system. Judging that the methodology is the best approach to integrate a system of risk reduction and risk management indicators at the megacity level with the Cross-Cutting Capacity Development (3cd) program, the group of experts from the EMI, the Pacific Disaster Center, IDEA and CIMNE then decided to pilot the system in Metro Manila. The workshop followed an earlier half-day meeting held at the Phivolcs on March 14, 2006. At the earlier meeting, the concept and methodology were introduced to a group of 18 stakeholders from selected national agencies, local government units (LGUs), and research organizations. Focusing on Metro Manila, the EMI Secretariat conducted a pilot run of the methodology, using a set of standardized questionnaire forms sent by the Barcelona Team. The data were sent to the Barcelona Team for analysis. The expert team met again at the John Blume Center of the University of Stanford, U.S. on April 21, 2006 to discuss and analyze the preliminary results of the pilot run, their consistency, and issues concerning data availability and completeness. This time around, 51 local stakeholders attended the one-day workshop on May 22, 2006. Nineteen participants came from the local government, 16 from the national government, and 16 from various sectors. The aims of the workshop were:
• To further explain the composition of the Urban Seismic Risk Index (USRi) and discuss with stakeholders the most relevant variables integrating the indices.
• To introduce preliminary results based on initial consultation and learn from stakeholders how these results make sense to them.
• To gain additional input on possible sources for missing information and look for alternative variables or proxy indicators that may be used for the risk indices.
• Engage the three 3cd Program pilot cities of Makati, Marikina and Quezon in Metro Manila, Philippines, in an independent evaluation of their own Disaster Risk Management Index (DRMi).
• To get all involved parties to understand how each of the pieces fit in the context of the overall 3cd Program and the development and implementation of a comprehensive Disaster Risk Management Master Plan for Metro Manila.

Risk Indicators Workshop
9
Program of Activities Welcome Remarks Dr. Renato Solidum Phivolcs Director and 3cd Program Local Investigator The Cross-Cutting Capacity Development (3cd) Program in Metro Manila (see page 1) Prof. Jeanette Fernandez 3cd Program Component 1 Coordinator, EMI and Pacific Disaster Center Urban Seismic Risk Index (USRi): A Holistic Approach for Seismic Risk Evaluation Ms. Martha Liliana Carreno CIMNE-Technical University of Catalonia, Spain Disaster Risk Management Index (DRMi): An Assessment of Disaster Risk Management Effectiveness Ms. Martha Liliana Carreno CIMNE-Technical University of Catalonia, Spain Open Discussion Small Group Workshop Disaster Risk Management Index Group 1 – Quezon City Group 2 – Makati City and Marikina City Urban Seismic Risk Index Group 3 - Government Agencies and Academe Closing Remarks Pictures from:http://members.tripod.com/~Mountain_Province/index-6.html

10
Cross-Cutting Capacity Development Series
Disaster Risk Management Index
An Assessment of Disaster Risk Management Effectiveness
Martha Liliana Carreño1 Omar Dario Cardona2
Alex H. Barbat3 1. Disaster Risk Management Index (DRMi) It is a composite index that measures the country performance level on risk management, taking into account its organization, development and institutional action to reduce vulnerability, reduce loss in case of hazardous events, and preparedness for response in case of crisis and efficient recovery. Disaster risk management (DRM) involves four different but related public policies, namely:
• Risk identification. • Risk reduction. • Disaster management. • Risk transfer.
The following are the different indicators under Risk Identification:
• RI1: Systematic disaster and loss inventory. • RI2: Hazard monitoring and forecasting. • RI3: Hazard evaluation and mapping. • RI4: Vulnerability and risk assessment. • RI5: Public information and community participation. • RI6: Training and education on risk management.
These are the Risk Reduction Indicators, namely: • RR1: Risk consideration in land use and urban planning. • RR2: Hydrographic basin intervention and environmental protection. • RR3: Implementation of hazard event control and protection techniques. • RR4: Housing improvement and human settlement relocation from disaster prone areas. • RR5: Updating and enforcement of safety standards and construction codes. • RR6: Reinforcement and retrofitting of public and private assets.
The Disaster Management Indicators are as follows: • DM1: Organization and coordination of emergency operations. • DM2: Emergency response planning and implementation of warning systems. • DM3: Endowment of equipments, tools and infrastructure. • DM4: Simulation, updating and test of inter-institutional response. • DM5: Community preparedness and training. • DM6: Rehabilitation and reconstruction planning.
Government and Financial Protection Indicators are listed as:
• FP1: Inter-institutional, multi-sectoral and decentralizing organization. • FP2: Reserve funds for institutional strengthening.
1 International Center for Numerical Methods in Engineering (CIMNE)-Technical University of Catalonia, Spain 2 Technical Director, Information and Indicators Program for Disaster Risk Management, Inter-American Development Bank (IADB)-Universidad Nacional de Colombia-Sede Manizales– Institute of Environmental Studies(IDEA). 3 International Center for Numerical Methods in Engineering (CIMNE)-Technical University of Catalonia, Spain
Risk Indicators Workshop
11
• FP3: Budget allocation and mobilization. • FP4: Implementation of social safety nets and funds response. • FP5: Insurance coverage and loss transfer strategies of public assets. • FP6: Housing and private sector insurance and reinsurance coverage.
2. Computing the DRMi. In computing for the Disaster Risk Management Index, we use the following formula: Linguistic variables are used to determine the classification of DRMi, namely: • Low: There are some basic and superficial data on the history of events that have affected the city • Incipient: There is a continual registering of current events, incomplete catalogues of the
occurrence of some phenomena and limited information on losses and effects. • Significant: There are some complete catalogues at the national and regional levels,
systematization of actual events and their economic, social and environmental effects. • Outstanding: There is a complete inventory and multiple catalogues of events; registry and detailed
systematization of effects and losses at the local level. • Optimal: There is a detailed inventory of events and effects for all types of existing hazards and
data bases at the sub-national and local levels. It is necessary that experts who know the actual risk management progress in the study area evaluate the indicators and assign relative importance between them for each public policy according to their experience and knowledge. 3. Evaluating Public Policy Qualification for each public policy (Risk Identification, Risk Reduction, Disaster Management and Financial Protection) is the result of the union of the weighted fuzzy sets, represented by the following formula and graphs (Figures 1 & 2):
),,,(
1
1),,,( FPDMRRRIN
ii
N
i
tici
tFPDMRRRIc
w
IwRMI
∑
∑
=
==
4/)( FPDMRRRI RMIRMIRMIRMIRMI +++=
( ) ( )( )NCNCPRMI CwCw μμμ ××= ,,max 11 K
( ) ( )( )[ ]centroidNCNCP CwCwRMI μμ ××= ,,max 11 K
12
Cross-Cutting Capacity Development Series
0 10 20 30 40 50 60 70 80 90 1000
0.1
0.2
0.3
0.4
Weighted membership functions
Wei
ght
0 10 20 30 40 50 60 70 80 90 1000
0.1
0.2
0.3
0.4
Weighted membership functions
Wei
ght
4. Analytical Hierarchy Process The Analytical Hierarchy Process (AHP) is a widely used technique for multi-attribute decision making. It enables decomposition of a problem into hierarchy and assures that both qualitative and quantitative aspects of a problem are incorporated in the evaluation process, during which opinion is systematically extracted by means of pair wise comparisons. AHP allows for the application of data, experience, insights, and intuition in a logical and detailed way within a hierarchy as a whole.
0 10 20 30 40 50 60 70 80 90 1000
0.1
0.2
0.3
0.4Union and defuzzification
RMI = 22.71
Wei
ght
0 10 20 30 40 50 60 70 80 90 1000
0.1
0.2
0.3
0.4Union and defuzzification
RMI = 22.71
Wei
ght
Figure 1
Figure 2
Table 1 Strength of Preference
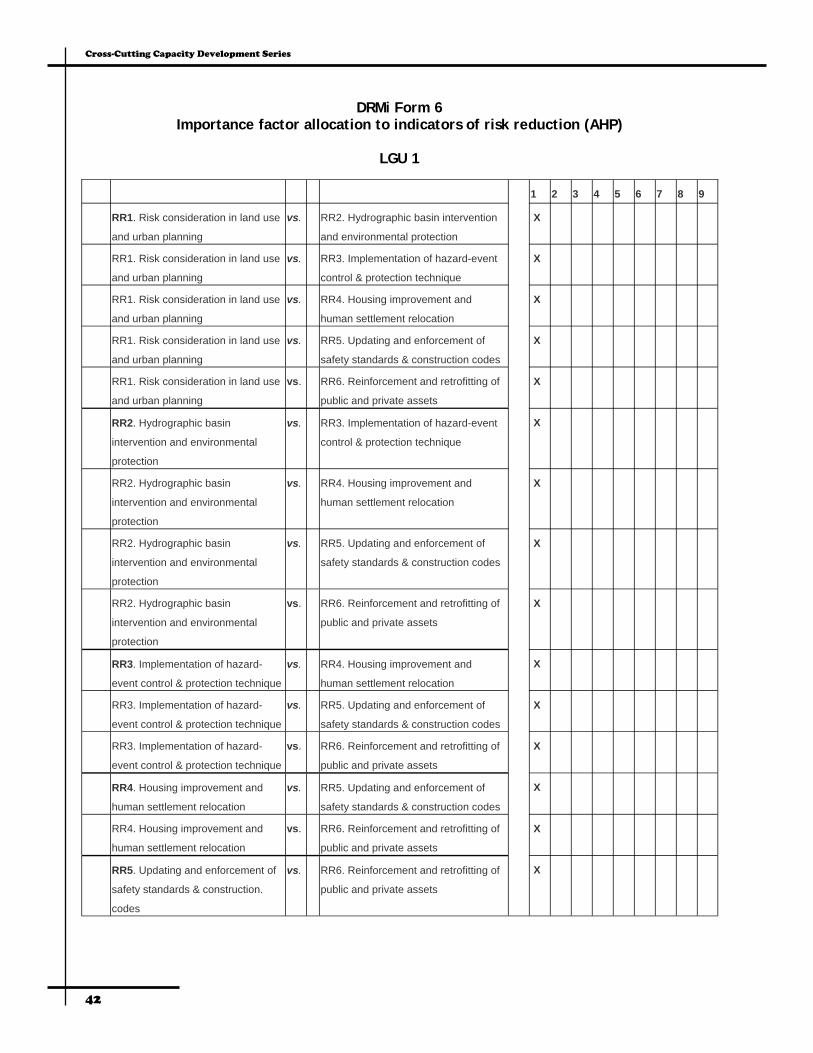
In the AHP, we use the importance of one factor vis-à-vis another, using a scale of one to nine (Table 1), with one being equally important, and nine signifying that it is extremely more important than the other.
Importance Judgment Points
Extremely more important 9
8
Very strongly more important 7
6
Strongly more important 5
4
Moderately more important 3
2
Equally important 1
DRMI = 22.71
Risk Indicators Workshop
13
lmax = 6.08775 CI = 0.018 CR = 0.014
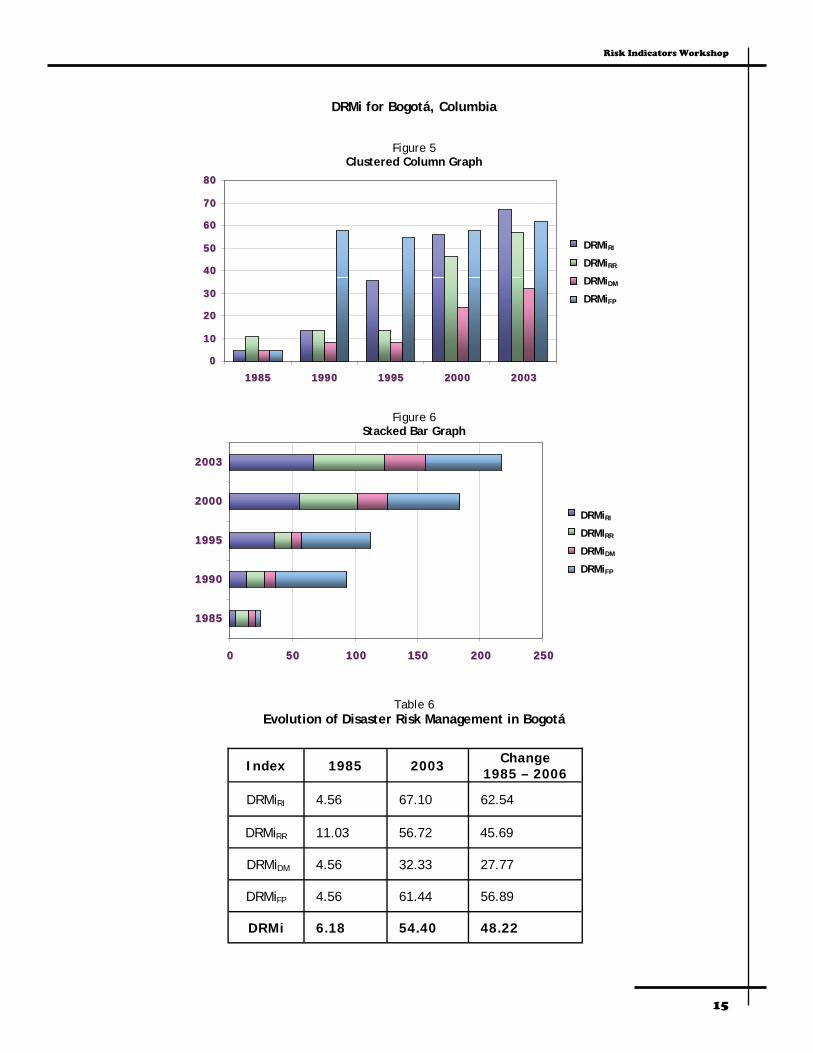
5. The Case of Bogotá, Columbia The Directorate for Risk Mitigation and Emergency Preparedness (DPAE) of Bogotá, Colombia, and aca-demics of the city evaluated the Risk management benchmark and weighed each indicator. The assess-ment was made between the period of 1985 and 2003. Tables 2 to 6 and Figures 3 to 6 summarize the results of the assessment.
Indicator 1985 1990 1995 2000 2003 RI1 1 1 2 3 3
RI2 1 1 2 3 3
RI3 1 2 3 4 5
RI4 1 1 1 3 4
RI5 1 1 2 2 3
RI6 1 1 1 2 4
Table 2 Qualifications for Risk Identification
Indicator RI1 RI2 RI3 RI4 RI5 RI6
RI1 1 0.2 0.2 0.2 1 0.33
RI2 5 1 0.5 1 5 2
RI3 5 2 1 2 5 4
RI4 5 1 0.5 1 5 2
RI5 1 0.2 0.2 0.2 1 0.33
RI6 3 0.5 0.25 0.5 3 1
Table 3 Comparison Matrix for Risk Identification
Weight RI RR DM FP
w1 0.05 0.14 0.11 0.21
w2 0.22 0.09 0.11 0.46
w3 0.36 0.07 0.40 0.12
w4 0.22 0.31 0.22 0.05
w5 0.05 0.20 0.05 0.12
w6 0.12 0.19 0.11 0.04
Table 4 Weights Obtained
14
Cross-Cutting Capacity Development Series
Calculation of the DRMiRI for 2003
Index 1985 1990 1995 2000 2003
DRMiRI 4.56 13.90 35.57 56.15 67.10
DRMiRR 11.03 13.90 13.90 46.14 56.72
DRMiDM 4.56 8.25 8.25 24.00 32.33
DRMiFP 4.56 57.49 54.80 57.64 61.44
DRMi 6.18 23.38 28.13 45.98 54.40
Table 5 Results for the DRMi of Bogotá, Columbia
0 10 20 30 40 50 60 70 80 90 1000
0.1
0.2
0.3
0.4Weighted membership functions
Wei
ght
a)
0 10 20 30 40 50 60 70 80 90 1000
0.1
0.2
0.3
0.4Union and defuzzification
RMIIR= 67.0971
Wei
ght
b)
Figure 3 Weighted Membership Functions
Figure 4 Union and Defuzzification
DRMiIR = 67.0971
Risk Indicators Workshop
15
00
1010
2020
3030
4040
5050
6060
7070
8080
19851985 19901990 19951995 20002000 20032003
RMIRMIRIRI
RMIRMIRRRR
RMIRMIDMDM
RMIRMIFPFP
00
1010
2020
3030
4040
5050
6060
7070
8080
19851985 19901990 19951995 20002000 20032003
RMIRMIRIRI
RMIRMIRRRR
RMIRMIDMDM
RMIRMIFPFP
DRMi for Bogotá, Columbia
00 5050 100100 150150 200200 250250
19851985
19901990
19951995
20002000
20032003
RMIRMIRIRI
RMIRMIRRRR
RMIRMIDMDM
RMIRMIFPFP
00 5050 100100 150150 200200 250250
19851985
19901990
19951995
20002000
20032003
RMIRMIRIRI
RMIRMIRRRR
RMIRMIDMDM
RMIRMIFPFP
Figure 5 Clustered Column Graph
Figure 6 Stacked Bar Graph
Index 1985 2003 Change 1985 – 2006
DRMiRI 4.56 67.10 62.54
DRMiRR 11.03 56.72 45.69
DRMiDM 4.56 32.33 27.77
DRMiFP 4.56 61.44 56.89
DRMi 6.18 54.40 48.22
Table 6 Evolution of Disaster Risk Management in Bogotá
DRMiRI
DRMiRR
DRMiDM
DRMiFP
DRMiRI
DRMIRR
DRMiDM
DRMiFP

16
Cross-Cutting Capacity Development Series
Final results of the DRMI by localities Considering the localities or urban districts in which the city is divided, a detailed study was also performed for 2003, starting from the qualifications made by DPAE using the same methodology.
4.56
7.02
5.52
17.70
18.84
17.15
5.96
7.2413.15
33.83
9.0417.15
17.15
4.56
4.56
4.564.56
4.56
4.56
4.56
7.02
5.52
17.70
18.84
17.15
5.96
7.2413.15
33.83
9.0417.15
17.15
4.5
4.56
7.02
5.52
17.70
18.84
17.15
5.96
7.2413.15
33.83
9.0417.15
17.15
4.56
4.56
4.564.56
4.56
4.56
8 0 8 Kilometres8 0 8 Kilometres
0 - 1515 – 3030 – 4545 – 6060 – 7575 – 100
00 - 1515 – 3030 – 4545 – 6060 – 7575 – 100
0
NN
6. Final Comments The Disaster Risk Management index enables the depiction of disaster risk management at any scale, allowing for the creation of risk management performance benchmarks, in order to establish a performance target for improving management effectiveness. The conceptual and technical bases of this index are robust, despite the fact that they are inherently subjective. Lastly, this index has the advantage of being composed of measures that directly map set specific decisions/actions into sets of desirable outcomes.
- smaller
Figure 7

Risk Indicators Workshop
17
Urban Seismic Risk Index A Holistic Approach for Seismic Risk Evaluation
Martha Liliana Carreño1 Omar Darío Cardona2
Alex H. Barbat3
1. Seismic Risk Evaluation
Disaster risks have been assessed in a fragmented way, according to the perspective of each scientific discipline involved in its appraisal. But risks require a multidisciplinary evaluation. Risk evaluation should take into account not only the expected physical damage, such as the number and type of casualties or the economic losses, but also the conditions related to social fragility and lack of resilient conditions, which favor the second order effects when a hazard event strikes an urban center (Figure 1).
HAZARDS
εε11
εε22
εε33
..
..
..
εεii
..
..
..
εεnn
CORRECTIVE AND PROSPECTIVE
INTERVENTION
Risk IdentificationRisk ReductionDisaster ManagementRisk Transfer
ACTUATION SYSTEM
Social andEconomic Fragilitiesnon hazarddependent
Exposure andPhysical
Susceptibility
hazard dependent RISK
R (Hi , V)Potential Social,
Economic and Environmental Consequences
RISK MANAGEMENT SYSTEMCONTROL SYSTEMCONTROL SYSTEM
Hi (I (t) ,t) i = 1, 2,…, m
VULNERABILITY FACTORSV (εi (t), t ) i=1,2…,n
EXPOSED ELEMENTS(COMPLEX DYNAMIC SYSTEM)
Lack of Resilienceor Ability to Cope and Recovering
non hazarddependent
D
F
¬R
““HARDHARD”” RISKRISK
Potential Damage on Potential Damage on Physical Infrastructure Physical Infrastructure
and Environmentand Environment
““SOFTSOFT”” RISKRISK
Potential Socioeconomic Potential Socioeconomic Impact on Communities Impact on Communities
and Organizationsand Organizations
Figure 1
1 International Center for Numerical Methods in Engineering (CIMNE)-Technical University of Catalonia, Spain 2 Technical Director, Information and Indicators Program for Disaster Risk Management, Inter-American Development Bank (IADB)-Universidad Nacional de Colombia-Sede Manizales– Institute of Environmental Studies(IDEA). 3 International Center for Numerical Methods in Engineering (CIMNE)-Technical University of Catalonia, Spain
18
Cross-Cutting Capacity Development Series
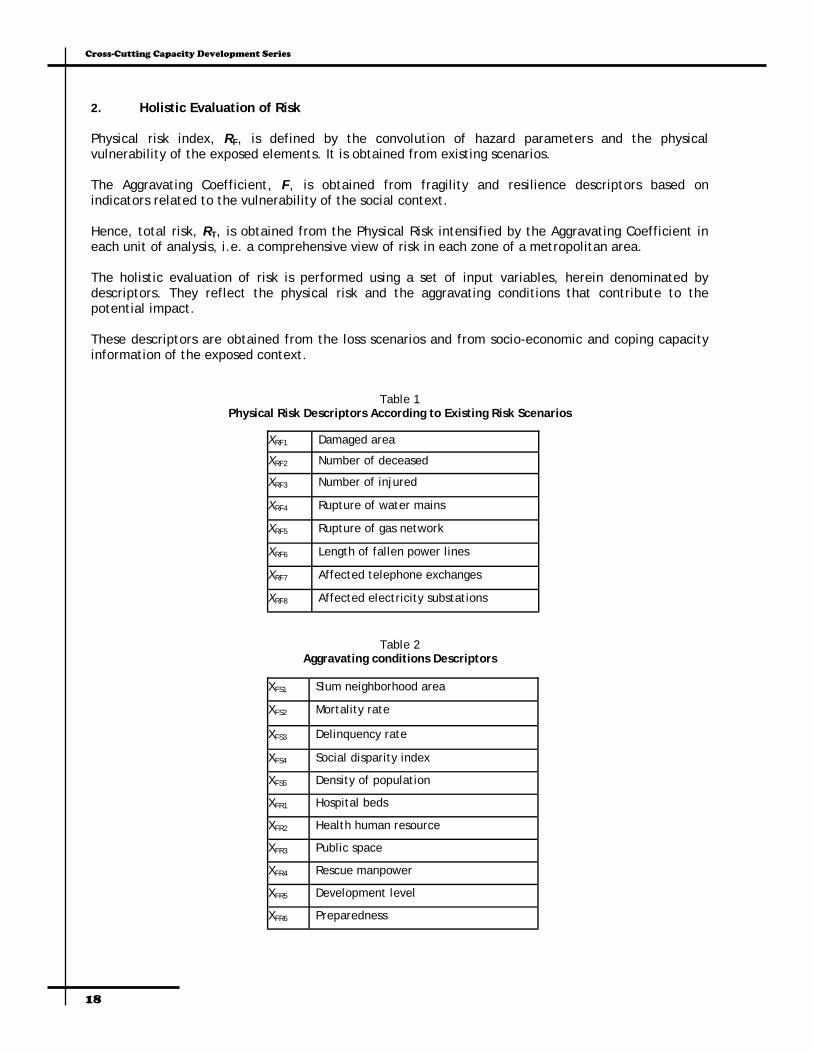
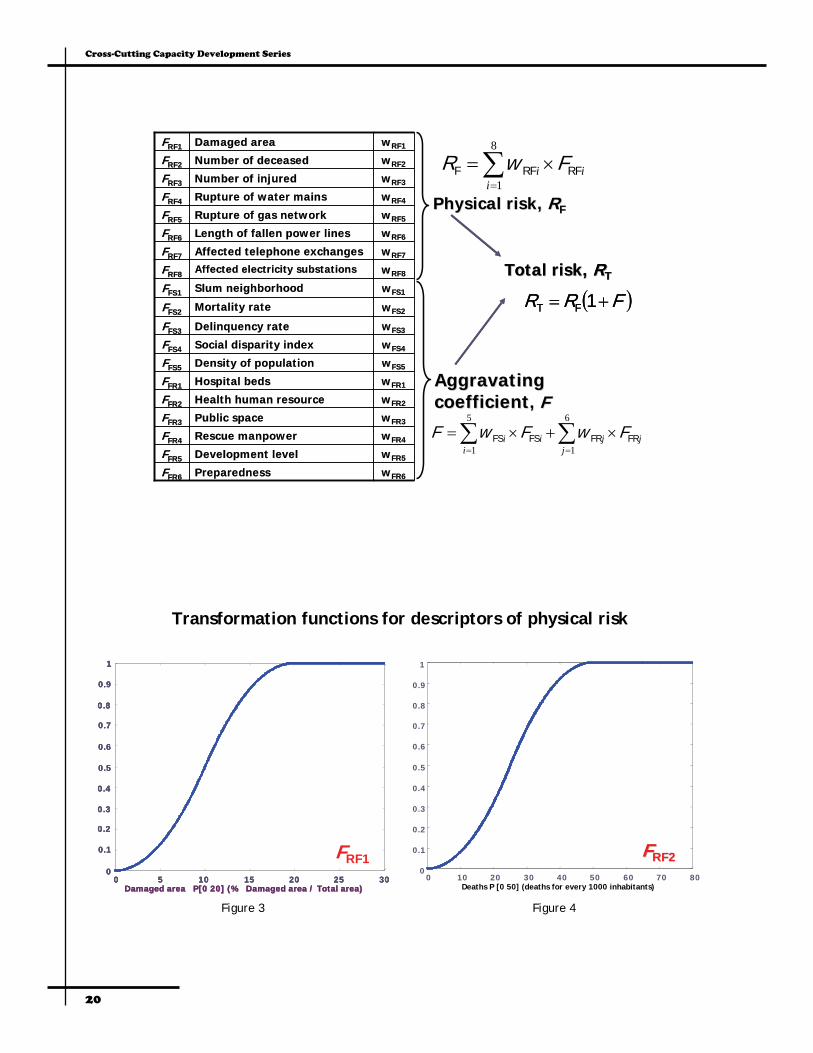
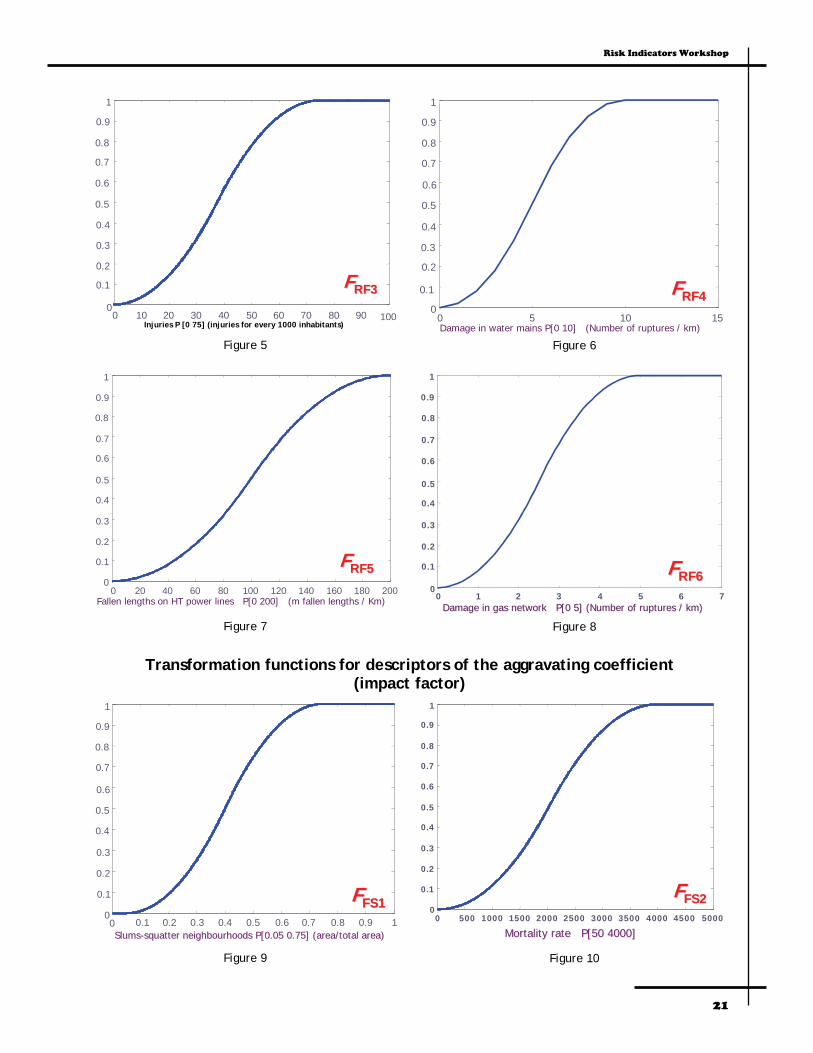
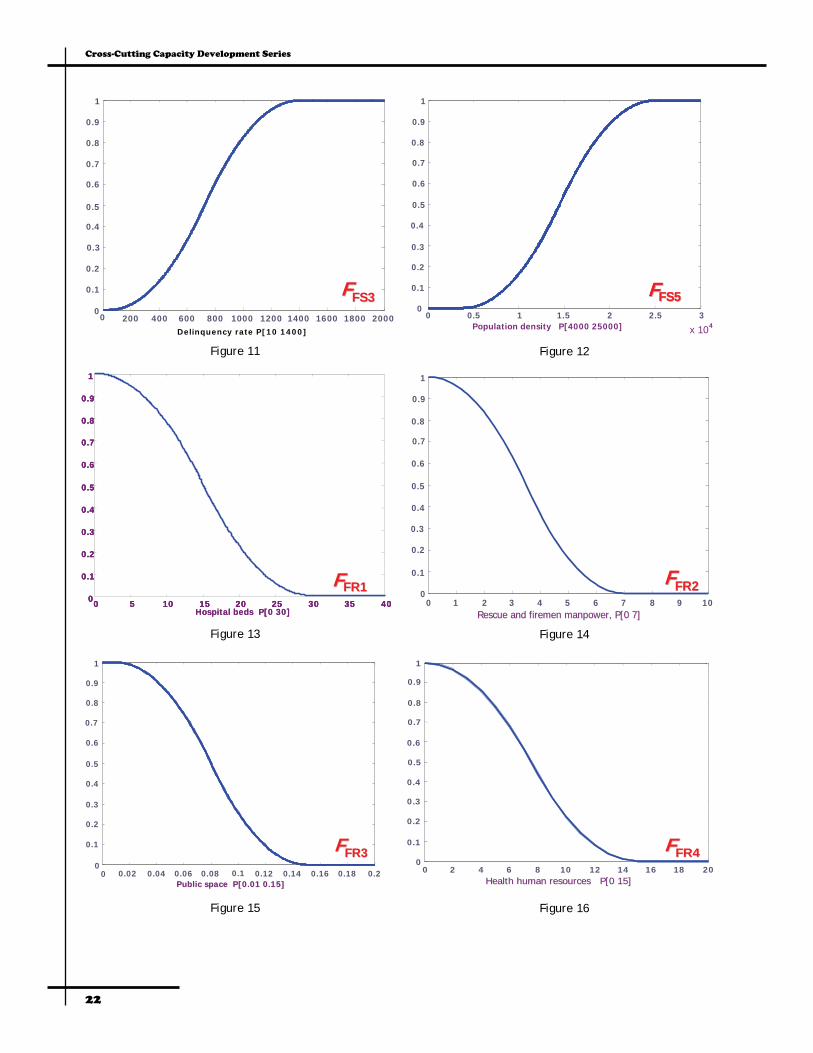
2. Holistic Evaluation of Risk
Physical risk index, RF, is defined by the convolution of hazard parameters and the physical vulnerability of the exposed elements. It is obtained from existing scenarios. The Aggravating Coefficient, F, is obtained from fragility and resilience descriptors based on indicators related to the vulnerability of the social context. Hence, total risk, RT, is obtained from the Physical Risk intensified by the Aggravating Coefficient in each unit of analysis, i.e. a comprehensive view of risk in each zone of a metropolitan area. The holistic evaluation of risk is performed using a set of input variables, herein denominated by descriptors. They reflect the physical risk and the aggravating conditions that contribute to the potential impact. These descriptors are obtained from the loss scenarios and from socio-economic and coping capacity information of the exposed context.
XRF1 Damaged area
XRF2 Number of deceased
XRF3 Number of injured
XRF4 Rupture of water mains
XRF5 Rupture of gas network
XRF6 Length of fallen power lines
XRF7 Affected telephone exchanges
XRF8 Affected electricity substations
Table 1 Physical Risk Descriptors According to Existing Risk Scenarios
XFS1 Slum neighborhood area
XFS2 Mortality rate
XFS3 Delinquency rate
XFS4 Social disparity index
XFS5 Density of population
XFR1 Hospital beds
XFR2 Health human resource
XFR3 Public space
XFR4 Rescue manpower
XFR5 Development level
XFR6 Preparedness
Table 2 Aggravating conditions Descriptors
Risk Indicators Workshop
19
XRF1 Damaged area
XRF2 Number of deceased
XRF3 Number of injured
XRF4 Rupture of water mains
XRF5 Rupture of gas network
XRF6 Length of fallen power lines
XRF7 Affected telephone exchanges
XRF8 Affected electricity substations
XFS1 Slum neighborhood
XFS2 Mortality rate
XFS3 Delinquency rate
XFS4 Social disparity index
XFS5 Density of population
XFR1 Hospital beds
XFR2 Health human resource
XFR3 Public space
XFR4 Rescue manpower
XFR5 Development level
XFR6 Preparedness
Transformation Functions
3. The Analytical Hierarchy Process The Analytical Hierarchy Process (AHP) is used to determine the importance between two risk indicators. As used in the DRMi, we again use a scale of one to nine, with 1 indicating that there is equal importance among the indicators, and 9 denoting extreme importance of one indicator over the other.
0
0.1
0.2
0.3
0.4
0.5
0.6
0.7
0.8
0.9
1
0 10 20 30 40 50 60 70 80
Dead people P[0 50] (dead people each 1000 inhabitants)
0
0.1
0.2
0.3
0.4
0.5
0.6
0.7
0.8
0.9
1
0 10 20 30 40 50 60 70 800
0.1
0.2
0.3
0.4
0.5
0.6
0.7
0.8
0.9
1
0
0.1
0.2
0.3
0.4
0.5
0.6
0.7
0.8
0.9
1
0 10 20 30 40 50 60 70 800 10 20 30 40 50 60 70 80
Dead people P[0 50] (dead people each 1000 inhabitants)
FFRF2RF2
Figure 2
randomCICICR =
1max
−−
=n
nCI λ
1.0≤CR
Consistency Reliability
Matrix of pair wise comparison (n x n)
n 1 2 3 4 5 6 7 8 9 10
Crandom 0 0 0.5 0 .1 1 1 1 1 1.49
Deaths P [0 50] (Deaths for every 1000 inhabitants)
20
Cross-Cutting Capacity Development Series
∑∑==
×+×=6
1
5
1 jjj
iii FRFRFSFS FwFwF
∑=
×=8
1iii RFRFF FwR
PhysicalPhysical riskrisk, , RRFF
AAggravatingggravatingcoefficientcoefficient, , FF
( )FRR += 1FT
Total Total riskrisk, , RRTT
( )FRR += 1FT
Total Total riskrisk, , RRTT
wwFR6FR6PreparednessPreparednessFFFR6FR6
wwFR5FR5DevelopmentDevelopment levellevelFFFR5FR5
wwFR4FR4RescueRescue manpowermanpowerFFFR4FR4
wwFR3FR3PublicPublic spacespaceFFFR3FR3
wwFR2FR2HealthHealth human human resourceresourceFFFR2FR2
wwFR1FR1Hospital Hospital bedsbedsFFFR1FR1
wwFS5FS5DensityDensity ofof populationpopulationFFFS5FS5
wwFS4FS4Social Social disparitydisparity indexindexFFFS4FS4
wwFS3FS3DelinquencyDelinquency raterateFFFS3FS3
wwFS2FS2MortalityMortality raterateFFFS2FS2
wwFS1FS1SlumSlum neighborhoodneighborhoodFFFS1FS1
wwRF8RF8AffectedAffected electricityelectricity substationssubstationsFFRF8RF8
wwRF7RF7AffectedAffected telephonetelephone exchangesexchangesFFRF7RF7
wwRF6RF6LengthLength ofof fallen fallen powerpower lineslinesFFRF6RF6
wwRF5RF5RuptureRupture ofof gas gas networknetworkFFRF5RF5
wwRF4RF4RuptureRupture ofof waterwater mainsmainsFFRF4RF4
wwRF3RF3NumberNumber ofof injuredinjuredFFRF3RF3
wwRF2RF2NumberNumber ofof deceaseddeceasedFFRF2RF2
wwRF1RF1DamagedDamaged areaareaFFRF1RF1
Transformation functions for descriptors of physical risk
Damaged area P[0 20] (% Damaged area / Total area)Damaged area P[0 20] (% Damaged area / Total area)0 5 10 15 20 25 30
0
0.1
0.2
0.3
0.4
0.5
0.6
0.7
0.8
0.9
1
FRF1
Damaged area P[0 20] (% Damaged area / Total area)Damaged area P[0 20] (% Damaged area / Total area)0 5 10 15 20 25 30
0
0.1
0.2
0.3
0.4
0.5
0.6
0.7
0.8
0.9
1
Damaged area P[0 20] (% Damaged area / Total area)Damaged area P[0 20] (% Damaged area / Total area)0 5 10 15 20 25 30
0
0.1
0.2
0.3
0.4
0.5
0.6
0.7
0.8
0.9
1
FRF10 10 20 30 40 50 60 70 80
0
0.1
0.2
0.3
0.4
0.5
0.6
0.7
0.8
0.9
1
Dead people P[0 50] (dead people each 1000 inhabitants)
FFRF2RF2
Figure 3 Figure 4
Deaths P [0 50] (deaths for every 1000 inhabitants)
Risk Indicators Workshop
21
0 10 20 30 40 50 60 70 80 90 1000
0.1
0.2
0.3
0.4
0.5
0.6
0.7
0.8
0.9
1
Injured people P[0 75] (Injured people each 1000 inhabitants)
FFRF3RF3
0 5 10 150
0.1
0.2
0.3
0.4
0.5
0.6
0.7
0.8
0.9
1
Damage in water mains P[0 10] (Number of ruptures / km)
FFRF4RF4
0 20 40 60 80 100 120 140 160 180 2000
0.1
0.2
0.3
0.4
0.5
0.6
0.7
0.8
0.9
1
Fallen lengths on HT power lines P[0 200] (m fallen lengths / Km)
FFRF5RF5
0 1 2 3 4 5 6 70
0.1
0.2
0.3
0.4
0.5
0.6
0.7
0.8
0.9
1
Damage in gas network P[0 5] (Number of ruptures / km)Damage in gas network P[0 5] (Number of ruptures / km)
FFRF6RF6
Transformation functions for descriptors of the aggravating coefficient (impact factor)
0 0.1 0.2 0.3 0.4 0.5 0.6 0.7 0.8 0.9 10
0.1
0.2
0.3
0.4
0.5
0.6
0.7
0.8
0.9
1
FFFS1FS1
SlumsSlums--squatter neighbourhoods P[0.05 0.75] (area/total area)squatter neighbourhoods P[0.05 0.75] (area/total area)
0 500 1000 1500 2000 2500 3000 3500 4000 4500 50000
0.1
0.2
0.3
0.4
0.5
0.6
0.7
0.8
0.9
1
Mortality rate P[50 4000]Mortality rate P[50 4000]
FFFS2FS2
Figure 5 Figure 6
Figure 7 Figure 8
Figure 9 Figure 10
Injuries P [0 75] (injuries for every 1000 inhabitants)
22
Cross-Cutting Capacity Development Series
0 200 400 600 800 1000 1200 1400 1600 1800 20000
0.1
0.2
0.3
0.4
0.5
0.6
0.7
0.8
0.9
1
Delinquency rate P[10 1400]Delinquency rate P[10 1400]
FFFS3FS30 0.5 1 1.5 2 2.5 3
x 104
0
0.1
0.2
0.3
0.4
0.5
0.6
0.7
0.8
0.9
1
Population density P[4000 25000]
FFFS5FS5FFFS5FS5
0 5 10 15 20 25 30 35 400
0.1
0.2
0.3
0.4
0.5
0.6
0.7
0.8
0.9
1
Hospital beds P[0 30]0 5 10 15 20 25 30 35 400 5 10 15 20 25 30 35 400
0.1
0.2
0.3
0.4
0.5
0.6
0.7
0.8
0.9
1
0
0.1
0.2
0.3
0.4
0.5
0.6
0.7
0.8
0.9
1
Hospital beds P[0 30]
FFFR1FR10 1 2 3 4 5 6 7 8 9 10
0
0.1
0.2
0.3
0.4
0.5
0.6
0.7
0.8
0.9
1
Rescue and firemen manpower, P[0 7]Rescue and firemen manpower, P[0 7]
FFFR2FR2
0 0.02 0.04 0.06 0.08 0.1 0.12 0.14 0.16 0.18 0.20
0.1
0.2
0.3
0.4
0.5
0.6
0.7
0.8
0.9
1
Public space P[0.01 0.15]Public space P[0.01 0.15]
FFFR3FR30 2 4 6 8 10 12 14 16 18 20
0
0.1
0.2
0.3
0.4
0.5
0.6
0.7
0.8
0.9
1
Health human resources P[0 15]Health human resources P[0 15]
FFFR4FR4
Figure 11 Figure 12
Figure 13 Figure 14
Figure 15 Figure 16
Delinquency rate P[10 1400]
Risk Indicators Workshop
23
1 1.5 2 2.5 3 3.5 40
0.1
0.2
0.3
0.4
0.5
0.6
0.7
0.8
0.9
1
Development levelDevelopment level
FFFR5FR5
0 0.2 0.4 0.6 0.8 1 1.2 1.4 1.6 1.8 20
0.1
0.2
0.3
0.4
0.5
0.6
0.7
0.8
0.9
1
Emergency planningEmergency planning
FFFR6FR6
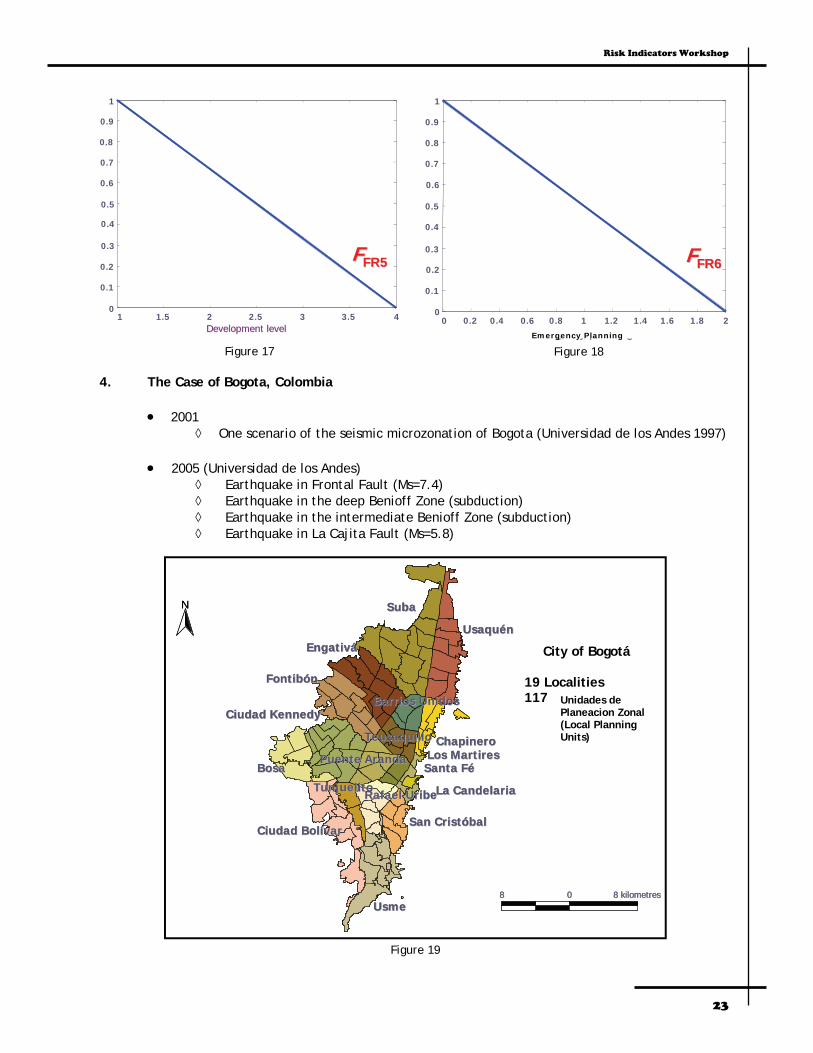
4. The Case of Bogota, Colombia
• 2001 ◊ One scenario of the seismic microzonation of Bogota (Universidad de los Andes 1997)
• 2005 (Universidad de los Andes) ◊ Earthquake in Frontal Fault (Ms=7.4) ◊ Earthquake in the deep Benioff Zone (subduction) ◊ Earthquake in the intermediate Benioff Zone (subduction) ◊ Earthquake in La Cajita Fault (Ms=5.8)
NN SubaSuba
UsaquUsaquéénnEngativEngativáá
FontibFontibóónn
ChapineroChapineroTeusaquilloTeusaquillo
TunjuelitoTunjuelito
Ciudad BolCiudad Bolíívarvar
UsmeUsme
Rafael UribeRafael Uribe
Ciudad KennedyCiudad Kennedy
Puente ArandaPuente Aranda Los Los MartiresMartiresSanta Santa FFéé
La CandelariaLa Candelaria
San CristSan Cristóóbalbal
BosaBosa
Barrios UnidosBarrios Unidos
SubaSuba
UsaquUsaquéénnEngativEngativáá
FontibFontibóónn
ChapineroChapineroTeusaquilloTeusaquillo
TunjuelitoTunjuelito
Ciudad BolCiudad Bolíívarvar
UsmeUsme
Rafael UribeRafael Uribe
Ciudad KennedyCiudad Kennedy
Puente ArandaPuente Aranda Los Los MartiresMartiresSanta Santa FFéé
La CandelariaLa Candelaria
San CristSan Cristóóbalbal
BosaBosa
Barrios UnidosBarrios Unidos
8 kilometres8 kilometres88 00 8 kilometres8 kilometres88 00
19 localities19 localities117 117 upzupz’’ss
Figure 17 Figure 18
Figure 19
City of Bogotá
19 Localities 117 Unidades de
Planeacion Zonal (Local Planning Units)
Emergency Planning
24
Cross-Cutting Capacity Development Series
0 m 4000 m
136
143
137
146 157
147 168154
158
142
155138
144
169145
159148
133 160139
149140 170156
131 150141
130 161151
129
167153
171
128
115 152
127116
125166
162126
117114
97122
163165164
113 118 27
96
172
28
119124
981
112 46
7 8
111 123120
992
84
3 5
85
68
69
10100 110
949
109
95
121101 13102
12
70 11103
10893 16
105
104
17175
92
67
86107
83
1891
87
10682 21
17366 209081
71
19
62
88
60
22
61
72
174
65
8063
23
58
73
64
26
8974
7924
57 5575
59176
7677
78 25
54
353436
42 17756
17953 178
1443
4433 132
45180
3851
32
37
4152 15
46 134
31 13540
3047
50
39
4829
49
Av . S an J ose
Av
13
Cll 13 4
Av .
Sa
nta
Bar
b ara
Cll 17 0
Cll 13 8
Av.
Su
ba
Dia g . 12 9
Av . 81
Aut . M
ed ell in
Av
. Pa
so d
el C
ou n
try
Av. Rodr ig o La ra B on i ll a
Av . 1 47
Av. La s O rq uid ea s
Av
. 7
Autop
ista El D
orado
Cll 68
Av . Chi le
Di a g. 53C
ra 1
1
Cll 10 0
Av .
Ca
raca
s
Diag . 53
Av. Lui s Ca r lo
s Ga lan
Av. Las Ame ricas
Diag . 57
Cl l 1 3
Av . 6
8
Av . B
o yaca
Av. Lo s Com
un eros
Cl l 1 8A
Av . C
iudad
de C
ali
Av. 1 de Mayo
Av
7
Av .
Boy
ac a
Autop is ta Sur
Av.
10
Av.
Ca
r aca
s
Cll 44 Sur
X=1 ' 013 .000 m
X=1 ' 017 .000 m
X=1 ' 0 21 .0 00m
X=1 ' 009 .000 m
X=1 ' 0 05 .0 00m
X=1 ' 001 .000 �m
X= 99 7.000m
X= 993.000 m
Y=
99
7.0
00m
Y=
1'0
01
.00
0m
Y=
1'0
05
.00
0m
Y=
1'0
09
.00
0m
Y=
99
3.0
00m
Y=
98
9.0
00
�m
Y=
98
5.0
00m
N
EW
S
% Damaged area0 - 55 - 1010 - 1515 - 2020 - 2525 - 30
Roads
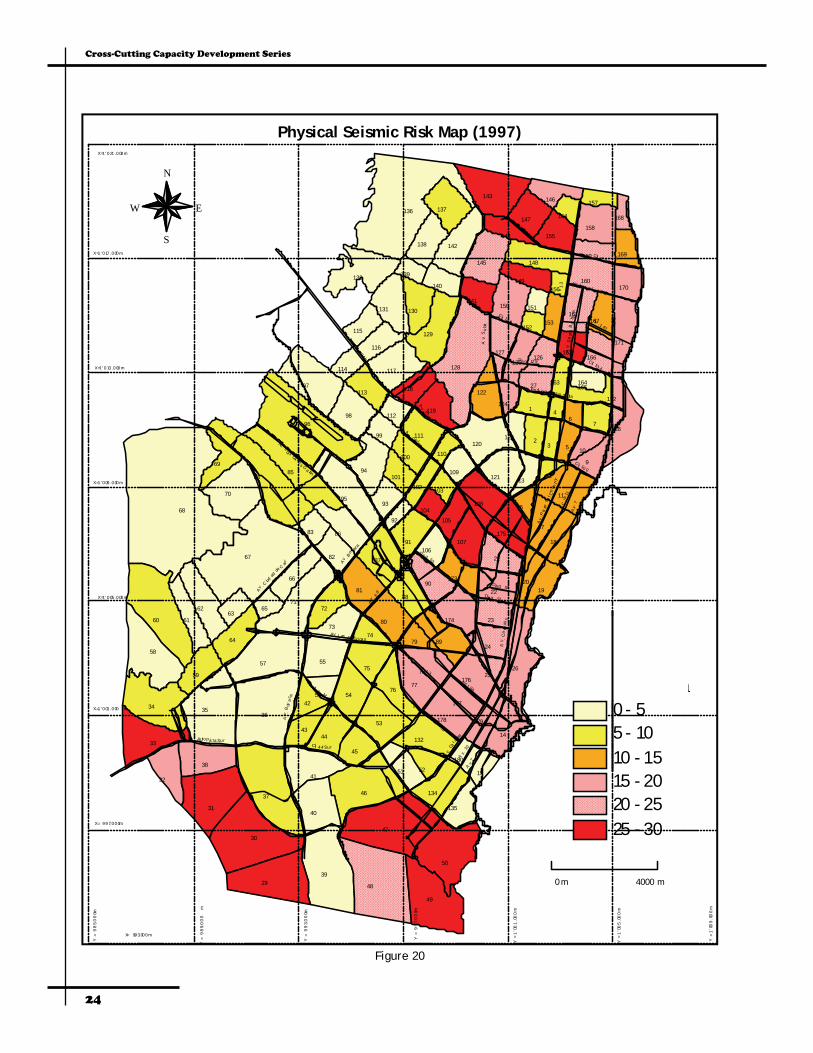
Physical Seismic Risk Map (1997)
Figure 20
Risk Indicators Workshop
25
FRF1 Damaged area 31 FRF2 Number of deceased 10
FRF3 Number of injured 10
FRF4 Rupture of water mains 19
FRF5 Rupture of gas network 11
FRF6 Length of fallen power lines 11
FRF7 Affected telephone exchanges 4
FRF8 Affected electricity substations 4
FFS1 Slum neighborhood 18
FFS2 Mortality rate 4
FFS3 Delinquency rate 4
FFS4 Social disparity index 18
FFS5 Density of population 18
FFR1 Hospital beds 6
FFR2 Health human resource 6
FFR3 Public space 4
FFR4 Rescue manpower 4
FFR5 Development level 9
FFR6 Preparedness 9
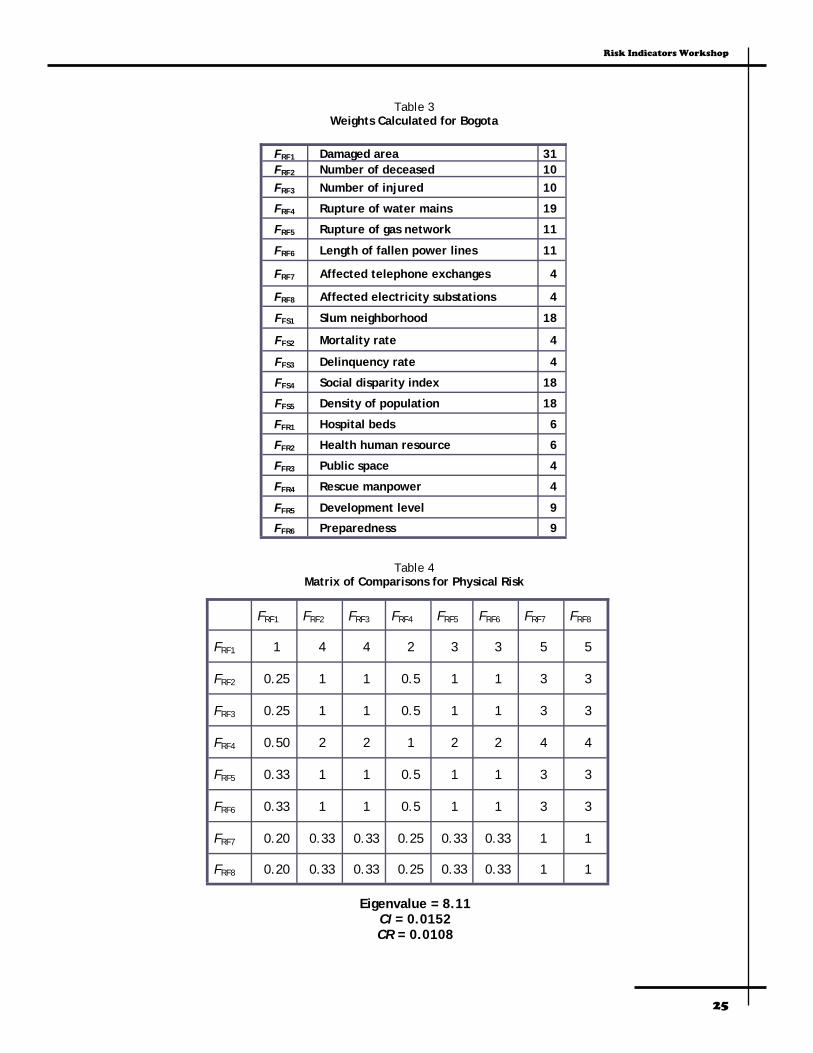
Table 3 Weights Calculated for Bogota
FRF1 FRF2 FRF3 FRF4 FRF5 FRF6 FRF7 FRF8
FRF1 1 4 4 2 3 3 5 5
FRF2 0.25 1 1 0.5 1 1 3 3
FRF3 0.25 1 1 0.5 1 1 3 3
FRF4 0.50 2 2 1 2 2 4 4
FRF5 0.33 1 1 0.5 1 1 3 3
FRF6 0.33 1 1 0.5 1 1 3 3
FRF7 0.20 0.33 0.33 0.25 0.33 0.33 1 1
FRF8 0.20 0.33 0.33 0.25 0.33 0.33 1 1
Table 4 Matrix of Comparisons for Physical Risk
Eigenvalue = 8.11 CI = 0.0152 CR = 0.0108
26
Cross-Cutting Capacity Development Series
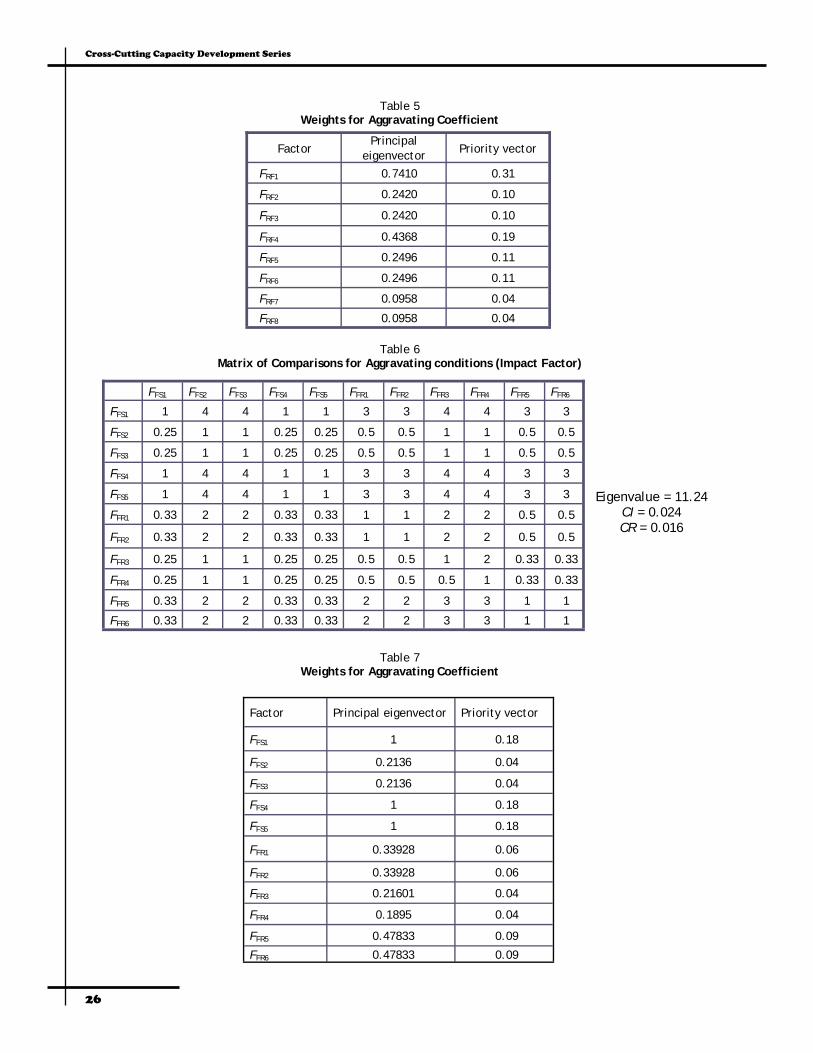
Factor Principal
eigenvector Priority vector
FRF1 0.7410 0.31
FRF2 0.2420 0.10
FRF3 0.2420 0.10
FRF4 0.4368 0.19
FRF5 0.2496 0.11
FRF6 0.2496 0.11
FRF7 0.0958 0.04
FRF8 0.0958 0.04
Eigenvalue = 11.24 CI = 0.024 CR = 0.016
FFS1 FFS2 FFS3 FFS4 FFS5 FFR1 FFR2 FFR3 FFR4 FFR5 FFR6
FFS1 1 4 4 1 1 3 3 4 4 3 3
FFS2 0.25 1 1 0.25 0.25 0.5 0.5 1 1 0.5 0.5
FFS3 0.25 1 1 0.25 0.25 0.5 0.5 1 1 0.5 0.5
FFS4 1 4 4 1 1 3 3 4 4 3 3
FFS5 1 4 4 1 1 3 3 4 4 3 3
FFR1 0.33 2 2 0.33 0.33 1 1 2 2 0.5 0.5
FFR2 0.33 2 2 0.33 0.33 1 1 2 2 0.5 0.5
FFR3 0.25 1 1 0.25 0.25 0.5 0.5 1 2 0.33 0.33
FFR4 0.25 1 1 0.25 0.25 0.5 0.5 0.5 1 0.33 0.33
FFR5 0.33 2 2 0.33 0.33 2 2 3 3 1 1
FFR6 0.33 2 2 0.33 0.33 2 2 3 3 1 1
Table 6 Matrix of Comparisons for Aggravating conditions (Impact Factor)
Factor Principal eigenvector Priority vector
FFS1 1 0.18
FFS2 0.2136 0.04
FFS3 0.2136 0.04
FFS4 1 0.18
FFS5 1 0.18
FFR1 0.33928 0.06
FFR2 0.33928 0.06
FFR3 0.21601 0.04
FFR4 0.1895 0.04
FFR5 0.47833 0.09
FFR6 0.47833 0.09
Table 7 Weights for Aggravating Coefficient
Table 5 Weights for Aggravating Coefficient
Risk Indicators Workshop
27
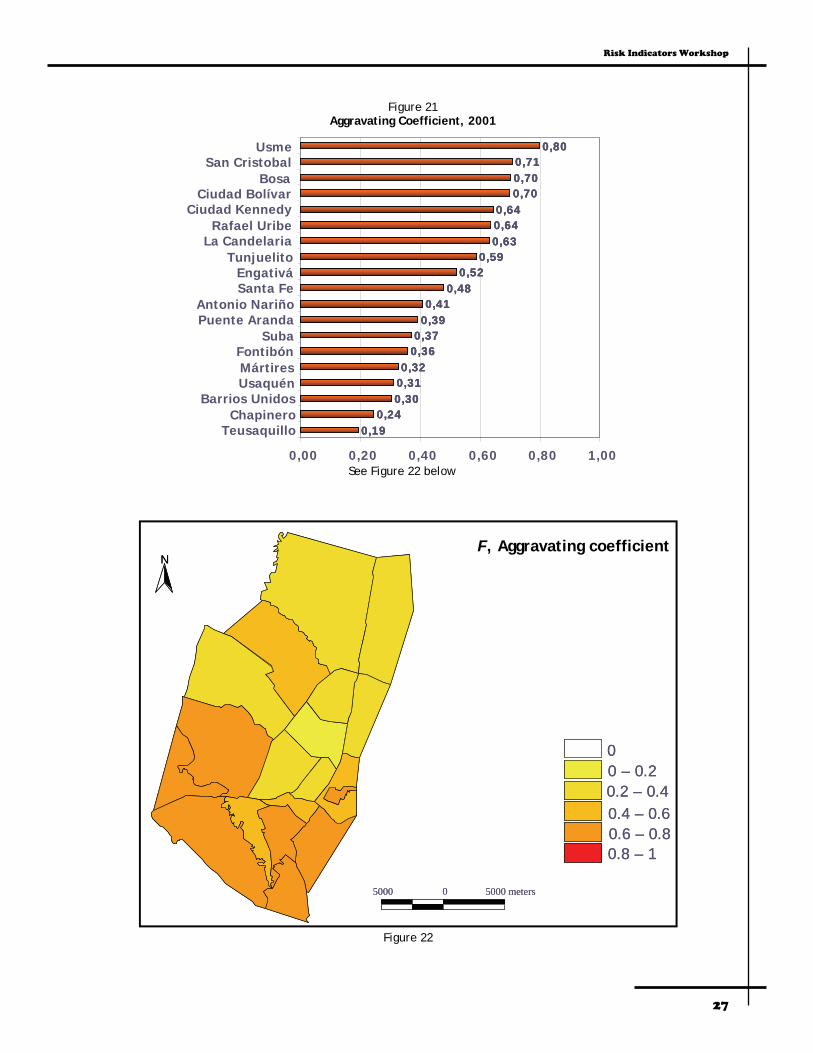
0,190,24
0,300,310,32
0,360,37
0,390,41
0,480,52
0,590,630,640,64
0,700,700,71
0,80
0,190,24
0,300,310,32
0,360,37
0,390,41
0,480,52
0,590,630,640,64
0,700,700,71
0,80
0,190,24
0,300,310,32
0,360,37
0,390,41
0,480,52
0,590,630,640,64
0,700,700,71
0,80
0,00 0,20 0,40 0,60 0,80 1,00
TeusaquilloChapinero
Barrios UnidosUsaquénMártiresFontibón
SubaPuente ArandaAntonio Nariño
Santa FeEngativá
TunjuelitoLa Candelaria
Rafael UribeCiudad Kennedy
Ciudad BolívarBosa
San CristobalUsme
Figure 21 Aggravating Coefficient, 2001
NN
5000 meters5000 0 5000 meters5000 0
00 – 0.20.2 – 0.40.4 – 0.60.6 – 0.80.8 – 1
00 – 0.20.2 – 0.40.4 – 0.60.6 – 0.80.8 – 1
F, Aggravating coefficient
Figure 22
See Figure 22 below

28
Cross-Cutting Capacity Development Series
RRT T , Total , Total riskriskNN
5000 meters5000 0 5000 meters5000 0
00 – 0.20.2 – 0.40.4 – 0.60.6 – 0.80.8 – 11 – 1.21.2 – 1.41.4 – 1.61.6 – 1.81.8 – 2
00 – 0.20.2 – 0.40.4 – 0.60.6 – 0.80.8 – 11 – 1.21.2 – 1.41.4 – 1.61.6 – 1.81.8 – 2
RT, Total Risk
Figure 24
NN
00 – 0.20.2 – 0.40.4 – 0.60.6 – 0.80.8 – 1
00 – 0.20.2 – 0.40.4 – 0.60.6 – 0.80.8 – 1
5000 metros5000 0 5000 metros5000 0
RF , scenario of the seismic microzonation
TR=500 years
Figure 23

Risk Indicators Workshop
29
Physical Seismic Risk, 2005
Figure 25
Damage in Percentage

30
Cross-Cutting Capacity Development Series
0,200,27
0,440,460,480,490,500,510,520,520,53
0,550,56
0,590,610,610,62
0,670,67
0,200,27
0,440,460,480,490,500,510,520,520,53
0,550,56
0,590,610,610,62
0,670,67
0,0 0,2 0,4 0,6 0,8
ChapineroTeusaquillo
Barrios UnidosUsaquen
Los MártiresLa Candelaria
Antonio NariñoEngativá
Puente ArandaSuba
TunjuelitoFontibón
Rafael UribeSan Cristóbal
Santa FeBosa
Ciudad KennedyCiudad Bolívar
Usme
Figure 26 Aggravating coefficient, F, 2005
F, Aggravatingcoefficient
8000 metros8000 0 8000 metros8000 0
00 – 0.20.2 – 0.40.4 – 0.60.6 – 0.80.8 – 1
00 – 0.20.2 – 0.40.4 – 0.60.6 – 0.80.8 – 1
NN
20052005
Figure 27
F, Aggravating Coefficient
2005
See Figure 27 below

Risk Indicators Workshop
31
RF , Frontal faultTR=500 years
NN
00 – 0.20.2 – 0.40.4 – 0.60.6 – 0.80.8 – 1
00 – 0.20.2 – 0.40.4 – 0.60.6 – 0.80.8 – 1
8000 metros8000 0 8000 metros8000 0
20052005
RRTT, Frontal , Frontal faultfaultRRTT==RRFF(1+(1+FF) )
NN
00 – 0.20.2 – 0.40.4 – 0.60.6 – 0.80.8 – 11 – 1.21.2 – 1.41.4 – 1.61.6 – 1.81.8 – 2
00 – 0.20.2 – 0.40.4 – 0.60.6 – 0.80.8 – 11 – 1.21.2 – 1.41.4 – 1.61.6 – 1.81.8 – 2
8000 metros8000 0 8000 metros8000 0
RF, Frontal Fault TR=500 Years
2005
RF, Frontal Fault RT=RF(1+F)
Figure 28
Figure 29
32
Cross-Cutting Capacity Development Series
5. Final Comments The Urban Seismic Risk Index methodology allows using a common “rule” of measurement to compare and benchmark the results. It is a comprehensive technique where the underlying concept is one of controlling risk rather than obtaining a precise evaluation of it (physical truth). The goal of the model (like the goal of a consensus), in many risk analysis applications, is not only to "reveal a truth", but rather to provide information and analyses that can "improve decisions".
Verbal Variable Numerical Equivalent
Low 1
Significant 3
Outstanding 4
Optimal 5
Incipient 2
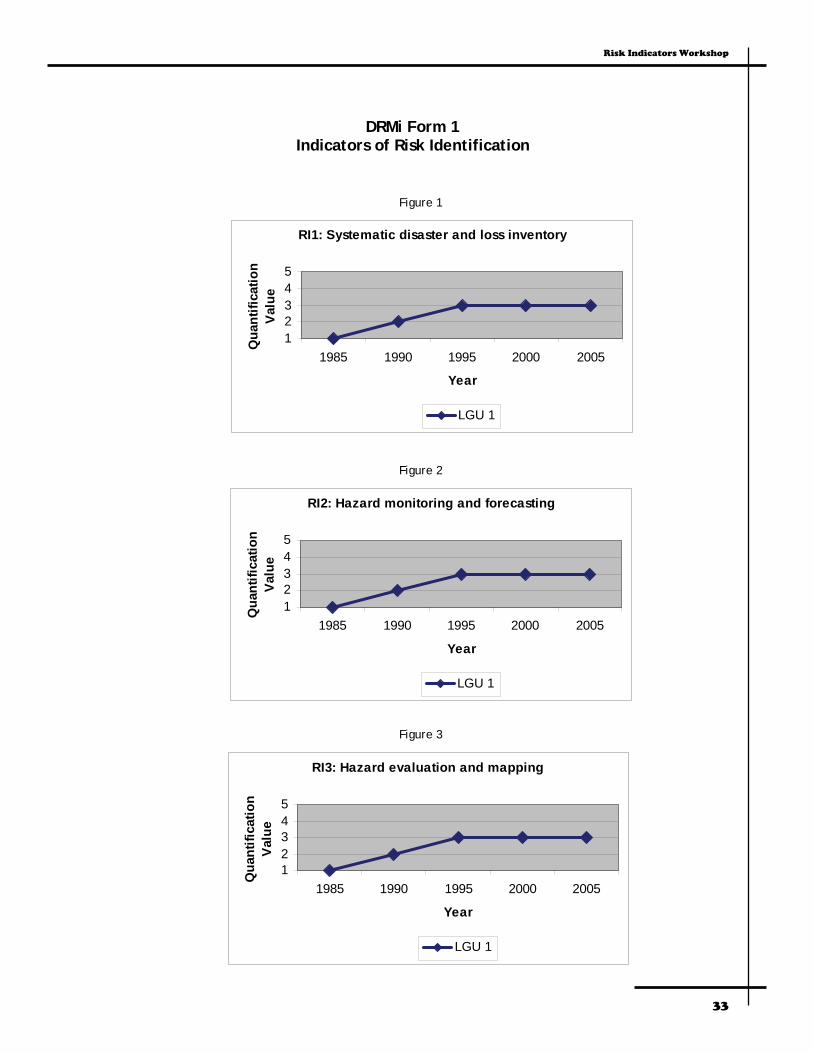
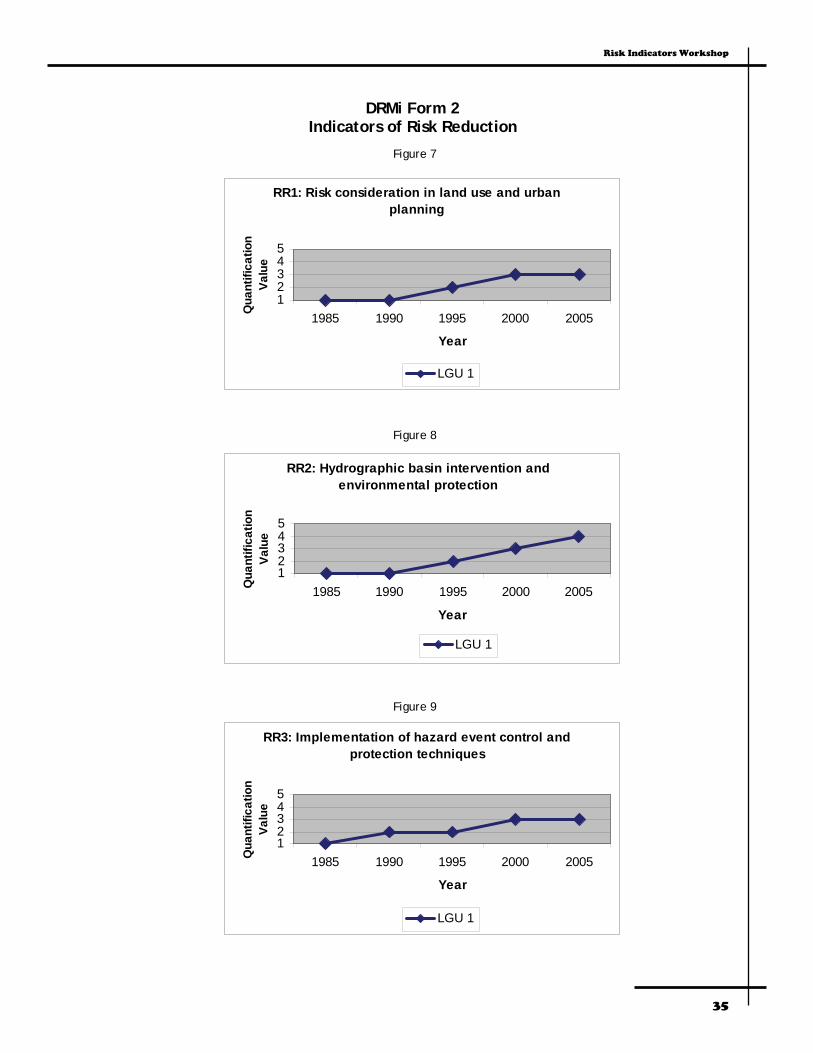
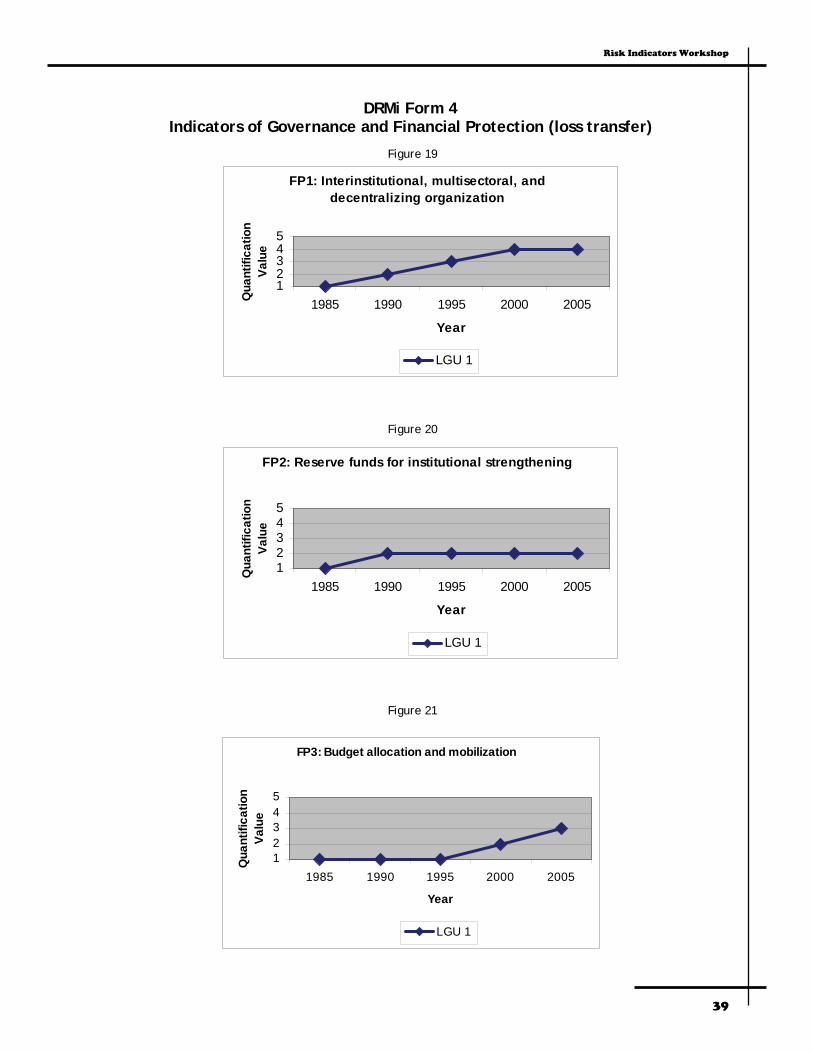
Risk Indicators Workshop Outputs The three partner cities, namely: Makati, Marikina, and Quezon, were involved in filling out the Disaster Risk Management index forms. They were composed of 19 planning officers from the Planning and Devel-opment Offices of the three cities. The cities were divided into two groups: Quezon City, with the larg-est number of participants, facilitated by Dr. Marqueza Reyes, and Makati and Marikina as the other group, facilitated by Prof. Jeanette Fernandez. While the three partner cities were busy with filling up the DRMi forms, the participants from the differ-ent national government agencies formed another big group whose task was to finish the USRi forms. The participants were from the following government offices and agencies: National Economic and De-velopment Authority, Department of Public Works and Highway, Metro Manila Development Authority, Philippine Institute of Volcanology and Seismology, Manila Observatory, University of the Philippines, Office of Civil Defence, and Housing and Land Use Regulatory Board. The following graphs (Figures 1 to 24) and tables (DRMi Forms 5-8, USRi Forms 1-2) show the raw results for the DRMi and USRi questionnaires that were filled up by the Workshop participants. The survey re-sults are shown here as actual outputs of the Workshop. It must be emphasized that the survey results will be processed and analyzed further by the Risk Indicators Team in order to give definitive assess-ments of Metro Manila’s disaster risk management and urban seismic risk conditions. Quantification Levels The numerical values of each quantification level in the following graphs are tied to a verbal variable, namely:
Risk Indicators Workshop
33
RI1: Systematic disaster and loss inventory
12345
1985 1990 1995 2000 2005
Year
Qua
ntifi
catio
n V
alue
LGU 1
RI2: Hazard monitoring and forecasting
12345
1985 1990 1995 2000 2005
Year
Qua
ntifi
catio
n Va
lue
LGU 1
RI3: Hazard evaluation and mapping
12345
1985 1990 1995 2000 2005
Year
Qua
ntifi
catio
n V
alue
LGU 1
DRMi Form 1
Indicators of Risk Identification
Figure 1
Figure 2
Figure 3

34
Cross-Cutting Capacity Development Series
RI4: Vulnerability and risk assessment
12345
1985 1990 1995 2000 2005
Year
Qua
ntifi
catio
n V
alue
LGU 1
RI5: Public information and community participation
12345
1985 1990 1995 2000 2005
Year
Qua
ntifi
catio
n Va
lue
LGU 1
RI5: Public information and community participation
12345
1985 1990 1995 2000 2005
Year
Qua
ntifi
catio
n Va
lue
LGU 1
Figure 4
Figure 5
Figure 6
Risk Indicators Workshop
35
DRMi Form 2 Indicators of Risk Reduction
RR1: Risk consideration in land use and urban planning
12345
1985 1990 1995 2000 2005
Year
Qua
ntifi
catio
n Va
lue
LGU 1
RR2: Hydrographic basin intervention and environmental protection
12345
1985 1990 1995 2000 2005
Year
Qua
ntifi
catio
n Va
lue
LGU 1
RR3: Implementation of hazard event control and protection techniques
12345
1985 1990 1995 2000 2005
Year
Qua
ntifi
catio
n Va
lue
LGU 1
Figure 7
Figure 8
Figure 9

Cross-Cutting Capacity Development Series
36
RR4: Housing improvement and human settlement relocation from disaster prone-areas
12345
1985 1990 1995 2000 2005
Year
Qua
ntifi
catio
n Va
lue
LGU 1
RR5: Updating and enforcement of safety standards and construction codes
12345
1985 1990 1995 2000 2005
Year
Qua
ntifi
catio
n Va
lue
LGU 1
RR6: Reinforcement and retrofitting of public and private assets
12345
1985 1990 1995 2000 2005
Year
Qua
ntifi
catio
n Va
lue
LGU 1
Figure 10
Figure 11
Figure 12

Land Use Planning Workshop
37
DRMi Form 3 Indicators of Disaster Management
DM1: Organization and coordination of emergency operations
12345
1985 1990 1995 2000 2005
Year
Qua
ntifi
catio
n Va
lue
LGU 1
DM2: Emergency response planning and implementation of warning systems
12345
1985 1990 1995 2000 2005
Year
Qua
ntifi
catio
n Va
lue
LGU 1
DM3: Endowment of equipments, tools, and infrastructure
12345
1985 1990 1995 2000 2005
Year
Qua
ntifi
catio
n Va
lue
LGU 1
Figure 13
Figure 14
Figure 15

38
Cross-Cutting Capacity Development Series
DM4: Simulation, updating, and test of inter institutional response
12345
1985 1990 1995 2000 2005
Year
Qua
ntifi
catio
n Va
lue
LGU 1
DM5: Community preparedness and training
12345
1985 1990 1995 2000 2005
Year
Qua
ntifi
catio
n Va
lue
LGU 1
DM6: Rehabilitation and reconstruction planning
12345
1985 1990 1995 2000 2005
Year
Qua
ntifi
catio
n Va
lue
LGU 1
Figure 16
Figure 17
Figure 18
Risk Indicators Workshop
39
DRMi Form 4 Indicators of Governance and Financial Protection (loss transfer)
FP1: Interinstitutional, multisectoral, and decentralizing organization
12345
1985 1990 1995 2000 2005
Year
Qua
ntifi
catio
n Va
lue
LGU 1
FP2: Reserve funds for institutional strengthening
12345
1985 1990 1995 2000 2005
Year
Qua
ntifi
catio
n Va
lue
LGU 1
FP3: Budget allocation and mobilization
12345
1985 1990 1995 2000 2005
Year
Qua
ntifi
catio
n Va
lue
LGU 1
Figure 19
Figure 20
Figure 21

40
Cross-Cutting Capacity Development Series
FP4: Implementation of social safety nets and funds response
12345
1985 1990 1995 2000 2005
Year
Qua
ntifi
catio
n Va
lue
LGU 1
FP5: Insurance coverage and loss transfer strategies of public assets
12345
1985 1990 1995 2000 2005
Year
Qua
ntifi
catio
n Va
lue
LGU 1
FP6: Housing and private sector insurance and reinsurance coverage
12345
1985 1990 1995 2000 2005
Year
Qua
ntifi
catio
n Va
lue
LGU 1
Figure 22
Figure 23
Figure 24

Risk Indicators Workshop
41
1 2 3 4 5 6 7 8 9
RI1. Systematic disaster and loss
inventory
vs. X RI2. Hazard monitoring and forecasting X
RI1. Systematic disaster and loss
inventory
vs. X RI3. Hazard evaluation and mapping X
RI1. Systematic disaster and loss
inventory
vs. X RI4. Vulnerability and risk assessment X
RI1. Systematic disaster and loss
inventory
vs. X RI5. Public information and community
participation
X
RI1. Systematic disaster and loss
inventory
vs. X RI6. Training and education in risk
management
X
X RI2. Hazard monitoring and
forecasting
vs. X RI3. Hazard evaluation and mapping X
X RI2. Hazard monitoring and
forecasting
vs. RI4. Vulnerability and risk assessment X
RI2. Hazard monitoring and
forecasting
vs. RI5. Public information and community
participation
X
RI2. Hazard monitoring and
forecasting
vs. RI6. Training and education in risk
management
X
RI3. Hazard evaluation and map-
ping
vs. RI4. Vulnerability and risk assessment X
RI3. Hazard evaluation and map-
ping
vs. RI5. Public information and community
participation
X
RI3. Hazard evaluation and
mapping
vs. RI6. Training and education in risk
management
X
RI4. Vulnerability and risk
assessment
vs. RI5. Public information and community
participation
X
RI4. Vulnerability and risk
assessment
vs. RI6. Training and education in risk
management
X
RI5. Public information and
community participation
vs. RI6. Training and education in risk
management
X
DRMi Form 5 Importance factor allocation to indicators of risk identification (AHP)
LGU 1
42
Cross-Cutting Capacity Development Series
1 2 3 4 5 6 7 8 9
RR1. Risk consideration in land use
and urban planning
vs. RR2. Hydrographic basin intervention
and environmental protection
X
RR1. Risk consideration in land use
and urban planning
vs. RR3. Implementation of hazard-event
control & protection technique
X
RR1. Risk consideration in land use
and urban planning
vs. RR4. Housing improvement and
human settlement relocation
X
RR1. Risk consideration in land use
and urban planning
vs. RR5. Updating and enforcement of
safety standards & construction codes
X
RR1. Risk consideration in land use
and urban planning
vs. RR6. Reinforcement and retrofitting of
public and private assets
X
RR2. Hydrographic basin
intervention and environmental
protection
vs. RR3. Implementation of hazard-event
control & protection technique
X
RR2. Hydrographic basin
intervention and environmental
protection
vs. RR4. Housing improvement and
human settlement relocation
X
RR2. Hydrographic basin
intervention and environmental
protection
vs. RR5. Updating and enforcement of
safety standards & construction codes
X
RR2. Hydrographic basin
intervention and environmental
protection
vs. RR6. Reinforcement and retrofitting of
public and private assets
X
RR3. Implementation of hazard-
event control & protection technique
vs. RR4. Housing improvement and
human settlement relocation
X
RR3. Implementation of hazard-
event control & protection technique
vs. RR5. Updating and enforcement of
safety standards & construction codes
X
RR3. Implementation of hazard-
event control & protection technique
vs. RR6. Reinforcement and retrofitting of
public and private assets
X
RR4. Housing improvement and
human settlement relocation
vs. RR5. Updating and enforcement of
safety standards & construction codes
X
RR4. Housing improvement and
human settlement relocation
vs. RR6. Reinforcement and retrofitting of
public and private assets
X
RR5. Updating and enforcement of
safety standards & construction.
codes
vs. RR6. Reinforcement and retrofitting of
public and private assets
X
DRMi Form 6 Importance factor allocation to indicators of risk reduction (AHP)
LGU 1
Risk Indicators Workshop
43
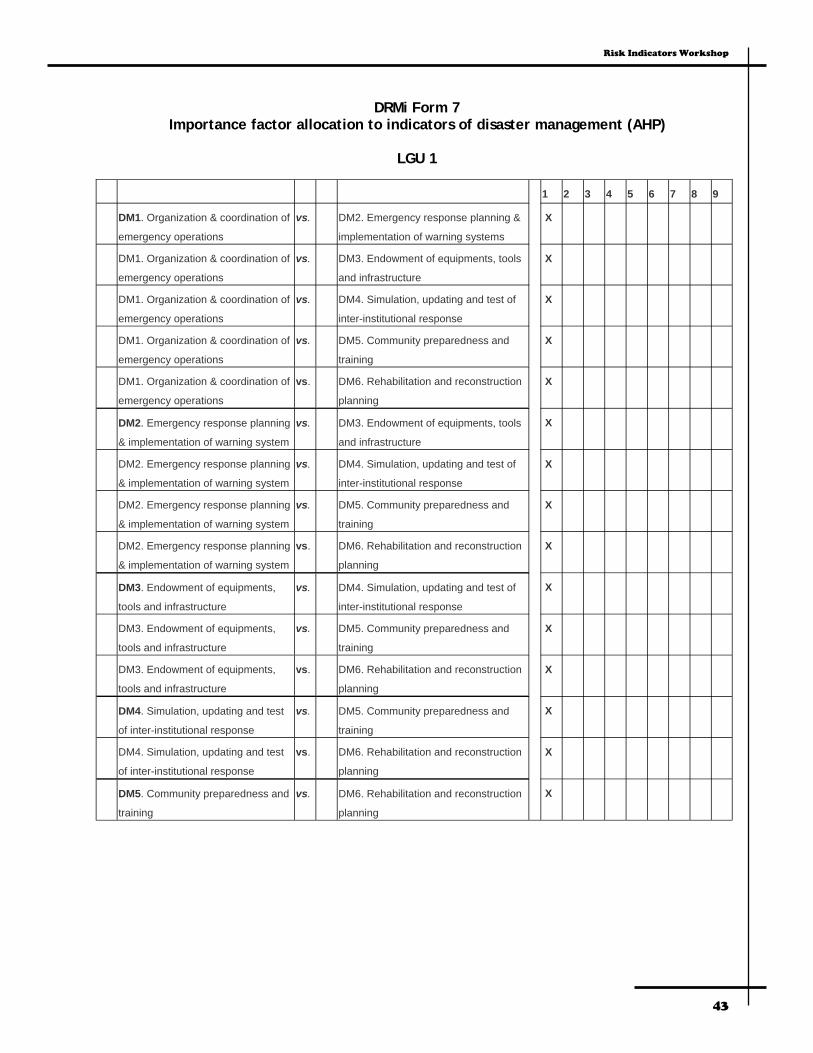
1 2 3 4 5 6 7 8 9
DM1. Organization & coordination of
emergency operations
vs. DM2. Emergency response planning &
implementation of warning systems
X
DM1. Organization & coordination of
emergency operations
vs. DM3. Endowment of equipments, tools
and infrastructure
X
DM1. Organization & coordination of
emergency operations
vs. DM4. Simulation, updating and test of
inter-institutional response
X
DM1. Organization & coordination of
emergency operations
vs. DM5. Community preparedness and
training
X
DM1. Organization & coordination of
emergency operations
vs. DM6. Rehabilitation and reconstruction
planning
X
DM2. Emergency response planning
& implementation of warning system
vs. DM3. Endowment of equipments, tools
and infrastructure
X
DM2. Emergency response planning
& implementation of warning system
vs. DM4. Simulation, updating and test of
inter-institutional response
X
DM2. Emergency response planning
& implementation of warning system
vs. DM5. Community preparedness and
training
X
DM2. Emergency response planning
& implementation of warning system
vs. DM6. Rehabilitation and reconstruction
planning
X
DM3. Endowment of equipments,
tools and infrastructure
vs. DM4. Simulation, updating and test of
inter-institutional response
X
DM3. Endowment of equipments,
tools and infrastructure
vs. DM5. Community preparedness and
training
X
DM3. Endowment of equipments,
tools and infrastructure
vs. DM6. Rehabilitation and reconstruction
planning
X
DM4. Simulation, updating and test
of inter-institutional response
vs. DM5. Community preparedness and
training
X
DM4. Simulation, updating and test
of inter-institutional response
vs. DM6. Rehabilitation and reconstruction
planning
X
DM5. Community preparedness and
training
vs. DM6. Rehabilitation and reconstruction
planning
X
DRMi Form 7 Importance factor allocation to indicators of disaster management (AHP)
LGU 1
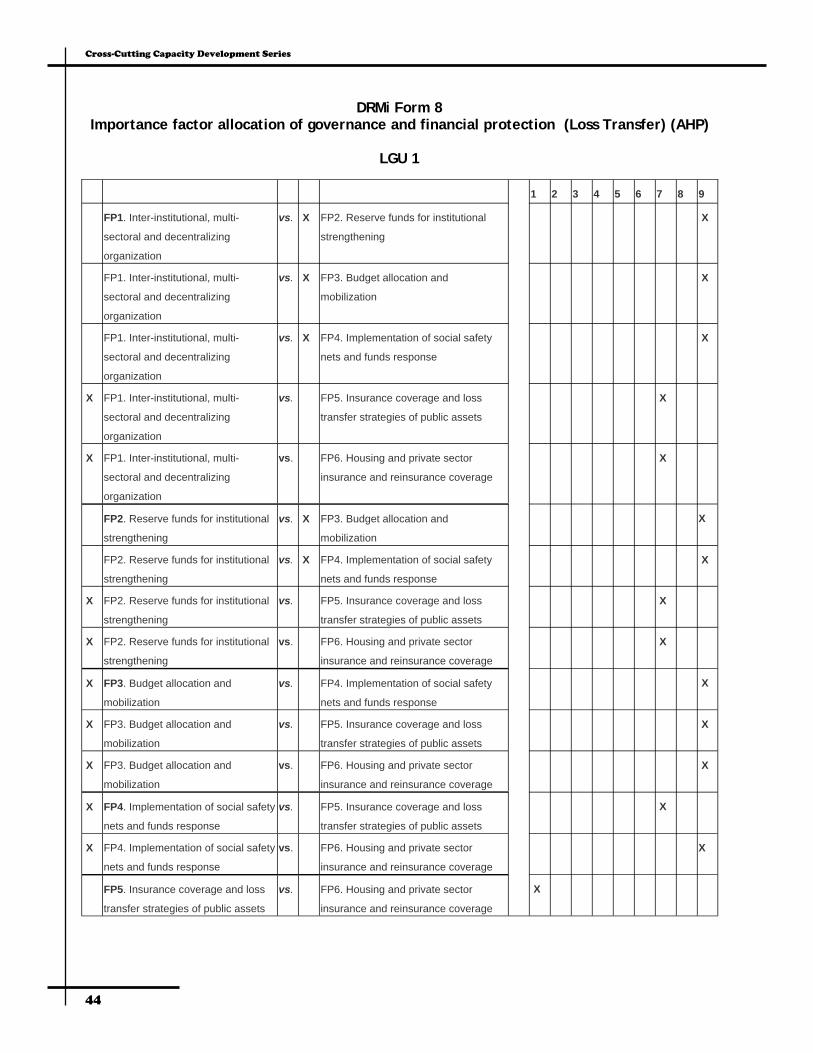
44
Cross-Cutting Capacity Development Series
1 2 3 4 5 6 7 8 9
FP1. Inter-institutional, multi-
sectoral and decentralizing
organization
vs. X FP2. Reserve funds for institutional
strengthening
X
FP1. Inter-institutional, multi-
sectoral and decentralizing
organization
vs. X FP3. Budget allocation and
mobilization
X
FP1. Inter-institutional, multi-
sectoral and decentralizing
organization
vs. X FP4. Implementation of social safety
nets and funds response
X
X FP1. Inter-institutional, multi-
sectoral and decentralizing
organization
vs. FP5. Insurance coverage and loss
transfer strategies of public assets
X
X FP1. Inter-institutional, multi-
sectoral and decentralizing
organization
vs. FP6. Housing and private sector
insurance and reinsurance coverage
X
FP2. Reserve funds for institutional
strengthening
vs. X FP3. Budget allocation and
mobilization
X
FP2. Reserve funds for institutional
strengthening
vs. X FP4. Implementation of social safety
nets and funds response
X
X FP2. Reserve funds for institutional
strengthening
vs. FP5. Insurance coverage and loss
transfer strategies of public assets
X
X FP2. Reserve funds for institutional
strengthening
vs. FP6. Housing and private sector
insurance and reinsurance coverage
X
X FP3. Budget allocation and
mobilization
vs. FP4. Implementation of social safety
nets and funds response
X
X FP3. Budget allocation and
mobilization
vs. FP5. Insurance coverage and loss
transfer strategies of public assets
X
X FP3. Budget allocation and
mobilization
vs. FP6. Housing and private sector
insurance and reinsurance coverage
X
X FP4. Implementation of social safety
nets and funds response
vs. FP5. Insurance coverage and loss
transfer strategies of public assets
X
X FP4. Implementation of social safety
nets and funds response
vs. FP6. Housing and private sector
insurance and reinsurance coverage
X
FP5. Insurance coverage and loss
transfer strategies of public assets
vs. FP6. Housing and private sector
insurance and reinsurance coverage
X
DRMi Form 8 Importance factor allocation of governance and financial protection (Loss Transfer) (AHP)
LGU 1
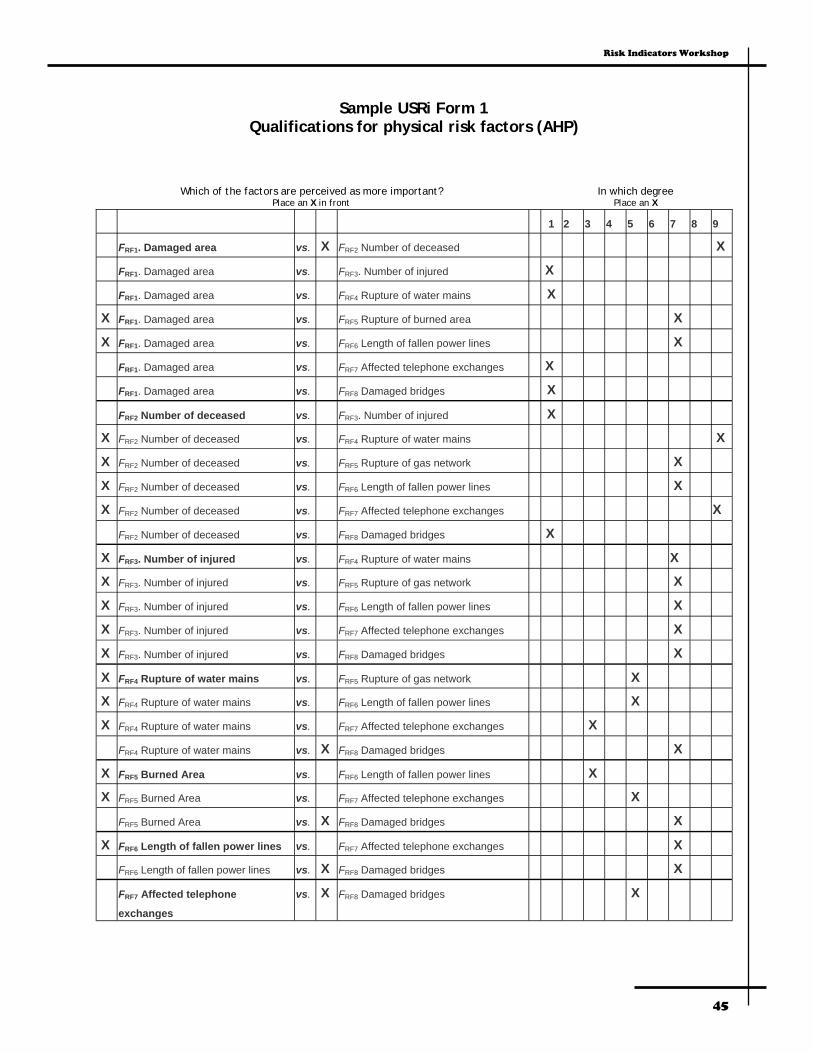
Risk Indicators Workshop
45
1 2 3 4 5 6 7 8 9
FRF1. Damaged area vs. X FRF2 Number of deceased X
FRF1. Damaged area vs. FRF3. Number of injured X
FRF1. Damaged area vs. FRF4 Rupture of water mains X
X FRF1. Damaged area vs. FRF5 Rupture of burned area X
X FRF1. Damaged area vs. FRF6 Length of fallen power lines X
FRF1. Damaged area vs. FRF7 Affected telephone exchanges X
FRF1. Damaged area vs. FRF8 Damaged bridges X
FRF2 Number of deceased vs. FRF3. Number of injured X
X FRF2 Number of deceased vs. FRF4 Rupture of water mains X
X FRF2 Number of deceased vs. FRF5 Rupture of gas network X
X FRF2 Number of deceased vs. FRF6 Length of fallen power lines X
X FRF2 Number of deceased vs. FRF7 Affected telephone exchanges X
FRF2 Number of deceased vs. FRF8 Damaged bridges X
X FRF3. Number of injured vs. FRF4 Rupture of water mains X
X FRF3. Number of injured vs. FRF5 Rupture of gas network X
X FRF3. Number of injured vs. FRF6 Length of fallen power lines X
X FRF3. Number of injured vs. FRF7 Affected telephone exchanges X
X FRF3. Number of injured vs. FRF8 Damaged bridges X
X FRF4 Rupture of water mains vs. FRF5 Rupture of gas network X
X FRF4 Rupture of water mains vs. FRF6 Length of fallen power lines X
X FRF4 Rupture of water mains vs. FRF7 Affected telephone exchanges X
FRF4 Rupture of water mains vs. X FRF8 Damaged bridges X
X FRF5 Burned Area vs. FRF6 Length of fallen power lines X
X FRF5 Burned Area vs. FRF7 Affected telephone exchanges X
FRF5 Burned Area vs. X FRF8 Damaged bridges X
X FRF6 Length of fallen power lines vs. FRF7 Affected telephone exchanges X
FRF6 Length of fallen power lines vs. X FRF8 Damaged bridges X
FRF7 Affected telephone
exchanges
vs. X FRF8 Damaged bridges X
Sample USRi Form 1 Qualifications for physical risk factors (AHP)
Which of the factors are perceived as more important? Place an X in front
In which degree Place an X
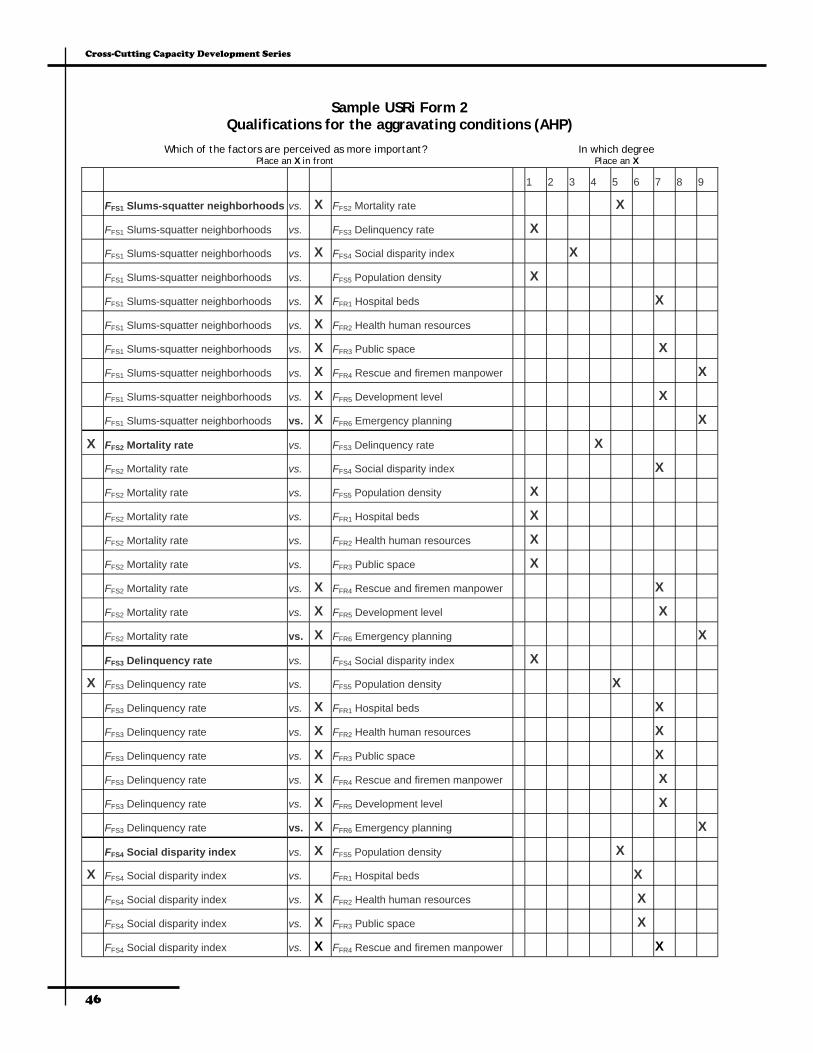
46
Cross-Cutting Capacity Development Series
1 2 3 4 5 6 7 8 9
FFS1 Slums-squatter neighborhoods vs. X FFS2 Mortality rate X
FFS1 Slums-squatter neighborhoods vs. FFS3 Delinquency rate X
FFS1 Slums-squatter neighborhoods vs. X FFS4 Social disparity index X
FFS1 Slums-squatter neighborhoods vs. FFS5 Population density X
FFS1 Slums-squatter neighborhoods vs. X FFR1 Hospital beds X
FFS1 Slums-squatter neighborhoods vs. X FFR2 Health human resources
FFS1 Slums-squatter neighborhoods vs. X FFR3 Public space X
FFS1 Slums-squatter neighborhoods vs. X FFR4 Rescue and firemen manpower X
FFS1 Slums-squatter neighborhoods vs. X FFR5 Development level X
FFS1 Slums-squatter neighborhoods vs. X FFR6 Emergency planning X
X FFS2 Mortality rate vs. FFS3 Delinquency rate X
FFS2 Mortality rate vs. FFS4 Social disparity index X
FFS2 Mortality rate vs. FFS5 Population density X
FFS2 Mortality rate vs. FFR1 Hospital beds X
FFS2 Mortality rate vs. FFR2 Health human resources X
FFS2 Mortality rate vs. FFR3 Public space X
FFS2 Mortality rate vs. X FFR4 Rescue and firemen manpower X
FFS2 Mortality rate vs. X FFR5 Development level X
FFS2 Mortality rate vs. X FFR6 Emergency planning X
FFS3 Delinquency rate vs. FFS4 Social disparity index X
X FFS3 Delinquency rate vs. FFS5 Population density X
FFS3 Delinquency rate vs. X FFR1 Hospital beds X
FFS3 Delinquency rate vs. X FFR2 Health human resources X
FFS3 Delinquency rate vs. X FFR3 Public space X
FFS3 Delinquency rate vs. X FFR4 Rescue and firemen manpower X
FFS3 Delinquency rate vs. X FFR5 Development level X
FFS3 Delinquency rate vs. X FFR6 Emergency planning X
FFS4 Social disparity index vs. X FFS5 Population density X
X FFS4 Social disparity index vs. FFR1 Hospital beds X
FFS4 Social disparity index vs. X FFR2 Health human resources X
FFS4 Social disparity index vs. X FFR3 Public space X
FFS4 Social disparity index vs. X FFR4 Rescue and firemen manpower X
Sample USRi Form 2 Qualifications for the aggravating conditions (AHP)
Which of the factors are perceived as more important? Place an X in front
In which degree Place an X

Risk Indicators Workshop
47
1 2 3 4 5 6 7 8 9
FFS5 Population density vs. FFR2 Health human resources X
FFS5 Population density vs. FFR3 Public space X
FFS5 Population density vs. X FFR4 Rescue and firemen manpower X
X FFS5 Population density vs. FFR5 Development level X
FFS5 Population density vs. X FFR6 Emergency planning X
FFR1 Hospital beds vs. FFR2 Health human resources X
FFR1 Hospital beds vs. X FFR3 Public space X
FFR1 Hospital beds vs. X FFR4 Rescue and firemen manpower X
FFR1 Hospital beds vs. X FFR5 Development level X
FFR1 Hospital beds vs. X FFR6 Emergency planning X
X FFR2 Health human resources vs. FFR3 Public space X
FFR2 Health human resources vs. X FFR4 Rescue and firemen manpower X
FFR2 Health human resources vs. X FFR5 Development level X
FFR2 Health human resources vs. X FFR6 Emergency planning X
FFR3 Public space vs. X FFR4 Rescue and firemen manpower X
FFR3 Public space vs. X FFR5 Development level X
FFR3 Public space vs. X FFR6 Emergency planning X
FFR4 Rescue and firemen
manpower
vs. X FFR5 Development level X
FFR4 Rescue and firemen manpower vs. X FFR6 Emergency planning X
FFR5 Development level vs. X FFR6 Emergency planning X
X FFS5 Population density vs. FFR1 Hospital beds X
FFS4 Social disparity index vs. X FFR6 Emergency planning X
FFS4 Social disparity index vs. FFR5 Development level X

49
Mainstreaming Disaster Risk Reduction in Land Use Planning Implementing the DRMMP in Metro Manila May 23, 2006 PHIVOLCS Auditorium Background On 5 December 2005, a seminar-workshop on Land Use and Urban Planning Tools for Disaster Risk Reduction was held and participated in by a majority of city planning and development officers and staff of Metro Manila together with land use and urban planners from various national government agencies. The purpose of the workshop was mainly to promote among local planners that the land use planning process and practice could be used as a tool to mitigate disasters and reduce risks. The activity likewise raised the participants’ level of appreciation of DRM principles through discussions on familiar planning tools that can be innovatively applied to modify the vulnerabilities of urban settlements as well as promote a culture of risk prevention in the planning community. This was the first significant step towards the eventual mainstreaming of DRR in land use planning in Metro Manila and in the country as well. Conducting this workshop on Mainstreaming Disaster Risk Reduction in Land Use Planning marked the continuing implementation of the Disaster Risk Management Master Plan (DRMMP) of Metro Manila under the aegis of the Cross-Cutting (3cd) Capacity Development Program of the Earthquakes and Megacities Initiative (EMI). The EMI, together with PHIVOLCS and the Metro Manila Development Authority, its partner institutions, Pacific Disaster Center, Kobe University, Earthquake Disaster Mitigation Research Center, and sponsor, the ProVention Consortium. The workshop sought to facilitate the mainstreaming process of disaster risk reduction (DRR) in the local land use planning process and practice in Metro Manila as part of the implementation of its DRMMP. The workshop aimed to:
• Provide a status update on the 3cd Program and the implementation of the DRMMP of Metro Manila as well as convey the importance of mainstreaming DRR in the functions and operations of government.
• Discuss the use of risk communication tools such as the MapViewer (MV), Megacity Disaster Risk Management Knowledge Base (KB) and Megacities Indicators System (MIS) that can be utilized for mainstreaming DRR in land use planning.
• Assess the current extent of institutional integration of DRR in the land use planning process of cities in Metro Manila as well as their needs in terms of mainstreaming tools applicable in the local planning context.
Cross-Cutting Capacity Development Series
50
Program of Activities Welcome Remarks Dr. Renato Solidum Phivolcs Director and 3cd Program Local Investigator The Cross-Cutting Capacity Development (3cd) Program in Metro Manila (see page 1) Prof. Jeannette Fernandez 3cd Program Component 1 Coordinator, EMI and Pacific Disaster Center Strategy for Mainstreaming Disaster Risk Reduction in Land Use Planning in Metro Manila Dr. Marqueza Reyes Urban Seismic Risk Reduction Specialist, EMI Integrating Risk Management in Land Use Planning Ms. Laurie Johnson, AICP Explanatory Remarks on the MMEIRS/MapViewer Map Book Dr. Renato Solidum Group Exercise and Discussion I. Tearfund Questionnaire on Institutional Mainstreaming of DRR II. Land Use Planning & Disaster Risk Reduction Presentation of Group Outputs Closing Remarks Dr. Antonio Fernandez Principal Scientist, EMI
Picture from www.treakearth.com taken by Geodino Carpio

Land Use Planning Workshop
51
Strategy for Mainstreaming Disaster Risk Reduction in Land Use Planning The 3cd Experience in Metro Manila
Marqueza L. Reyes, Dr.Eng’g.1
1. An Urban World Rapid global urbanization and rural-to-urban migration are two of the underlying forces behind the phenomenon of megacities. Whether due to international or internal migration, cities continue to burst at the seams and form complex urban regions. In addition to migration, rapid natural increase and the ensuing reclassification and integration of surrounding suburbs into these expanding conurbations propel urban growth. From 2000 to 2030, the world’s urban population is expected to increase by an average annual rate of 1.85 percent.
Over the course of 50 years, world population has changed its complexion from predominantly rural (70 percent ) in 1950 to halfway urban (50 percent) in 2005. This trend will appear to continue, according to the UN (2002). And by the year 2030, the world population will have become predominantly urban, with 60 percent of the human inhabitants of this planet preferring to live and work in urban areas (Figure 1) . Most of this urban growth will take place in the less developed countries (LDCs) of the world. In the LDCs, population in urban areas is projected to grow at 2.35 percent annually from 2000 to 2030, or a doubling time of 29 years.
2. The Debilitating Specter of Megacities The ongoing urban explosion has exposed millions of people living in cities to disaster risk. As millions of people continue to prefer to live in large complex urban areas, the physical densification of settlements, high concentration of business investments and economic assets, and the convergence of vital networks, together with critical facilities and transport infrastructures, all in a very confined area intensify the vulnerability of urban regions to disasters. Megacities raise the spectre of debilitating disasters. The existence of overcrowded slums on riverbanks, floodplains, and steeply sloping areas,
World Population, Urban and Rural
3,19 3,290,75
1,54
2,864,98
2,521,770123456789
1950 1975 2000 2030
Year
Pop
ulat
ion
(in b
illio
ns)
UrbanRural
Figure 1
Source: UN. 2002. World Urban Prospects. NY: UN
1 Assistant Professor, Dept. of Geography, University of the Philippines and licensed Environmental Planner; Urban Seismic Risk Reduction Specialist, EMI.

Cross-Cutting Capacity Development Series
52
and other hazardous locations expose people, their meager assets and livelihood to flash flooding, river flooding, and landslides. Unplanned use of land has resulted to urban sprawl and uncontrolled urban development pattern, making it more difficult to manage the megacity even during normal times. Hazardous industrial plants exist side by side, with congested informal settlements that lack basic utilities such as water supply and access roads. Informal construction gives rise to settlements made up of substandard self-built housing that is defenceless in the face of typhoons, floods, and earthquakes. Unregulated building practices result to shoddy structures built below code standards and a built environment susceptible to natural hazards. It is within this context that the Earthquakes and Megacities Initiative (EMI), an international non-stock, non-profit scientific organization, has embarked on a mission to help megacities and complex urban areas rise to the challenge of institutionalizing disaster risk reduction (DRR) in land use planning process and practice of local government units in metropolitan areas. EMI believes that in spite of megarisks in megacities, there are golden opportunities in megacities that can be harnessed to reduce disasters. That is what 3cd is trying to do in Metro Manila. 3. Strategy for Mainstreaming Disaster Risk Reduction in Metro Manila In the EMI’s model of mainstreaming (Figure 1, see Page 1), certain mechanisms are necessary in order to integrate DRR within an institution’s core functions, activities, and processes. This mainstreaming model is applied in the implementation of the Disaster Risk Management Master Plan (DRMMP) of Metro Manila in the Philippines as part of EMI’s Cross Cutting Capacity Development (3cd) Program. The DRMMP includes a 10-Point Action Plan for Institutional Building and integrates the development of disaster risk management (DRM) tools such as the Web-based Map Viewer of Metro Manila and the DRM Knowledge Base (KB) and the Megacity Indicators System (MIS). The DRMMP has provided a fertile ground for many lessons learned for a more effective mainstreaming of disaster risk reduction in land use and urban planning in a metropolitan setting. One lesson learned from the 3cd Program is that mainstreaming disaster risk reduction or DRR involves building broad alliances and partnerships among the different stakeholders in the megacity, as disaster reduction is a shared responsibility. Such coalitions then provide an institutional basis on which capacity building in disaster risk management can take place. A mainstreaming strategy in implementing the disaster risk management plan of Metro Manila is the use of focus groups. Five focus groups have been established in Metro Manila to analyze and explore the opportunities and needs of the following thematic areas for promoting DRR: (1) Use of information and communication technologies, (2) Land use and urban planning, (3) Training, (4) Role of civil society, and (5) Legal and institutional framework for DRM. Integrating Disaster Risk Reduction and Land Use Planning It is now internationally recognized that the power and system of land use planning as a standard practice logically lends planning as a process where disaster risk reduction can be mainstreamed and institutionalized in local government. Hence, Focus Group 2 or FG 2 explores the opportunities and options offered by the land use planning process, system, and authority to integrate disaster reduction objectives at the local level, where project and program implementation happen. In the tradition of the focus group method, FG 2 is a loosely structured group, with an average of about 10 to 12 participants per meeting, from an invitation pool of about 25 people who were purposively selected. It meets about once a month. It is a relatively homogenous group with common needs and agenda. It engages in flexible, open discussions, almost with a spontaneous quality but always focusing on local perspectives and experiences. As an inter-agency multi-level group, it benefits from the inputs of government representatives from the local (pilot cities of Makati, Marikina and Quezon in Metropolitan Manila), regional (Metro Manila Development Authority) and national (Housing and Land Use Regulatory Board, Philippine Institute of Volcanology and Seismology, Department of Public Works and Highways, and National Economic and Development Authority). It is also multi-sectoral, with

Land Use Planning Workshop
53
representatives from the academe (University of the Philippines), United Nations Development Programme Country Office, and civil society (Philippine Institute of Environmental Planners). Aside from conducting roundtable discussions on the clearly defined topic of disasters and land use planning, the focus group has become a valuable tool in program planning and decision-making. For instance, in the planning and development phase of a training course on risk-sensitive land use planning, a topic about which, little is known, Focus Group 2 has provided useful insights as to the felt needs of local planners and their individual capacities on disaster reduction. These inputs are necessary for the target group analysis for the development of the training course. In the future, the focus group may then also become a part of the routine program evaluation of 3cd. Further, FG 2 provides a venue for cross-organizational collaboration among the participants. For example, it was concluded by the group that their organizations had a need for training on pre– and post-disaster building inspection. The solution was to request two professional engineering societies (Philippine Institute of Civil Engineers and Association of Structural Engineers of the Philippines) to conduct their two-day Disaster Quick Response Program. This training is now being organized. More interesting is that members of FG 2 have become mainstreaming champions of DRR within their respective organizations, even extending to their external spheres of influence. As such, FG 2 has likewise become a means to raise disaster reduction awareness, appreciation and commitment, a mechanism to generate political will among decision-makers, and as a vehicle to sustain the mainstreaming momentum and eventually transfer the ownership of DRMMP to local governments. All these activities of FG 2 contribute to the achievement of the goals of the Disaster Risk Management Master Plan of Metro Manila. Next Steps Based on FG 2 discussions, a weak link in the mainstreaming of disaster risk reduction in land use planning is the local government units as risk reduction happens at the local. The following actions are recommended to further strengthen the links in the mainstreaming chain from the local to the metropolitan and national levels. • Gather support and cooperation from all the 17 cities and municipalities that constitute the whole
of Metro Manila, not only from the pilot cities. • Enhance the organizational and individual capacities of city planners and their planning office
through seminars, workshops and other modes of trainings. A web-based training (WBT) course on “Risk-Sensitive Land Use Planning: Integrating DRR in Land Use Planning” is now in the works to complement face-to-face workshops, as interest in this type of training course is very high.
• Produce guidelines on mainstreaming DRR in land use planning. 4. Final Comments Through mainstreaming, DRR becomes integrated into the land use planning and practices in the different levels of government, especially at the local, and does not remain as an isolated public policy objective. We need to continue implementing priority mainstreaming activities and identify further areas of cooperation as expressed by the stakeholders themselves. In this connection, participants from other cities in Metro Manila may be invited and ideas to transform FG 2 into a formal, sustainable mainstreaming tool may be discussed in future roundtable discussions. Lastly, mainstreaming recognizes that in spite of ever growing disaster risks in megacities, megacities offer substantial potentials for sustainable development and opportunities for safer, disaster-resilient societies.

Cross-Cutting Capacity Development Series
54
Integrating Risk Management in Land Use Planning
Laurie A. Johnson1
“Governments have the most to learn about risk. Without a better grasp of the costs
and benefits of the rules they create to control it, they can do more harm than good.” John Smutniak (The Economist, January 24, 2004)
1. What is Risk? “The combination of the chance of an event and its consequences.” (ISO, 2002) 2. What is Risk Management? Risk Management is a structured approach to evaluate holistically the range of potential impacts of events, and formally apply policies, processes, and practices to address those impacts. It creates a common valuation system that is generally financial. It is a valuation useful in quantifying, comparing, and making risk management decisions, which helps provide a broader set of decision options for handling risks. 3. Risk Management Process There are four steps in the Risk Management Process, namely:
Step 1: Identifying Risks • Where could an event occur? How often? What size or strength?
Step 2: Assessing and Quantifying Risks • Probabilistic analyses, scenario analyses, and vulnerability characterization
Step 3: Managing and Implementing Risk Management Decisions • Avoidance or elimination • Reduction or mitigation • Sharing or transfer • Retention
Step 4: Monitoring and Implementation Over Time • Continuous and ongoing • Means of checking and ensuring that decisions are working
1 Member, American Institute of Certified Planners
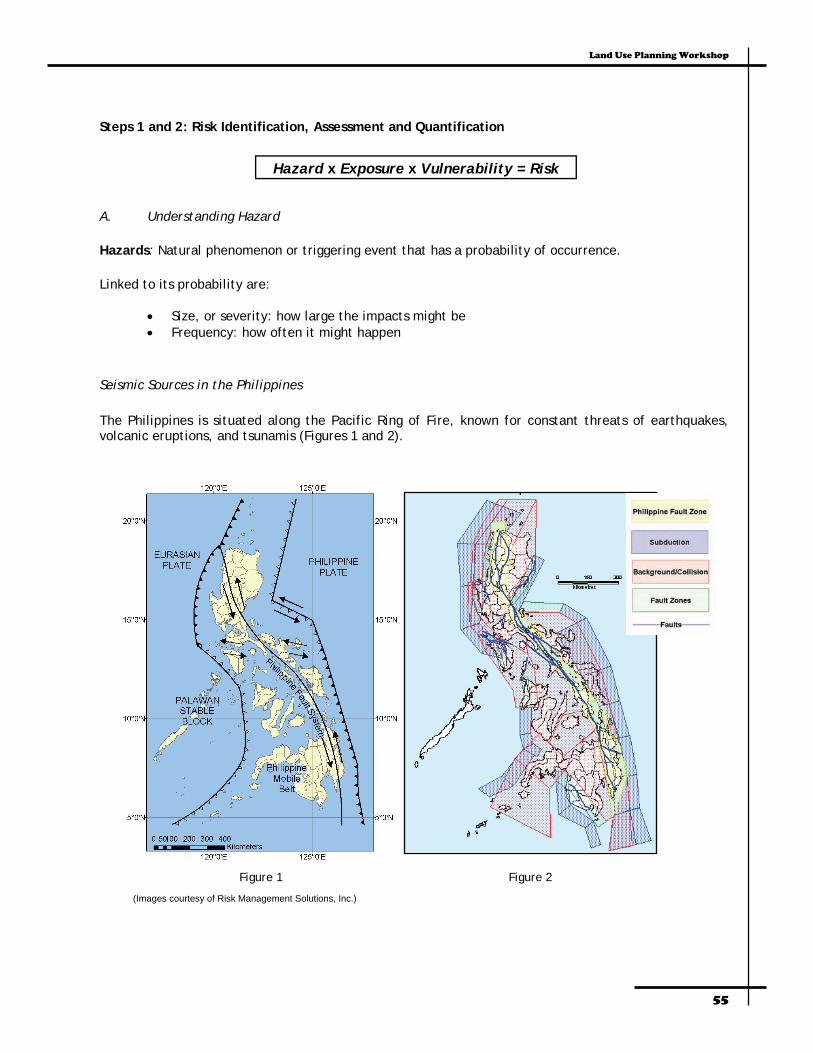
Land Use Planning Workshop
55
Steps 1 and 2: Risk Identification, Assessment and Quantification A. Understanding Hazard Hazards: Natural phenomenon or triggering event that has a probability of occurrence. Linked to its probability are:
• Size, or severity: how large the impacts might be • Frequency: how often it might happen
Seismic Sources in the Philippines The Philippines is situated along the Pacific Ring of Fire, known for constant threats of earthquakes, volcanic eruptions, and tsunamis (Figures 1 and 2).
(Images courtesy of Risk Management Solutions, Inc.)
Hazard x Exposure x Vulnerability = Risk
Figure 1 Figure 2

Cross-Cutting Capacity Development Series
56
B. Understanding Exposure Exposure: Elements (people, buildings, economic activity, finances, infrastructure, etc.) that can experience the hazards. Building Construction and Occupancies
• Construction Types
• Masonry ◊ Unreinforced Masonry ◊ Reinforced Masonry
• Reinforced Concrete (RC)
◊ RC Moment Resisting Frame (MRF) ◊ RC MRF with Un-reinforced Masonry Infill ◊ RC Shear Wall ◊ Steel & RC Composite Frame ◊ Precast MRF
• Steel
◊ Steel Frame ◊ Steel MRF with Un-reinforced Masonry Infill ◊ Steel Braced Frame ◊ Light Metal Frame
• Occupancy Types • Permanent Dwelling (single family housing) • Permanent Dwelling (multi family housing) • Commercial • General Industrial
Spatial Distribution and Concentrations
Example: Philippine Insurance Rating Association (PIRA) 2000 Exposure Data
Metro Manila Rest of country
Residential 11.5% 3.7%
Commercial 73.8% 35.5%
Industrial 14.7% 60.8%
(Data courtesy of Risk Management Solutions, Inc.)
Table 1 Exposure Data, Philippines
Forty-five percent of the country’s insurance exposure is within Metro Manila, 30% of which is in CRESTA Zone 2 (Makati City) while 60% of it is in Zone 5 (the rest of Metro Manila).
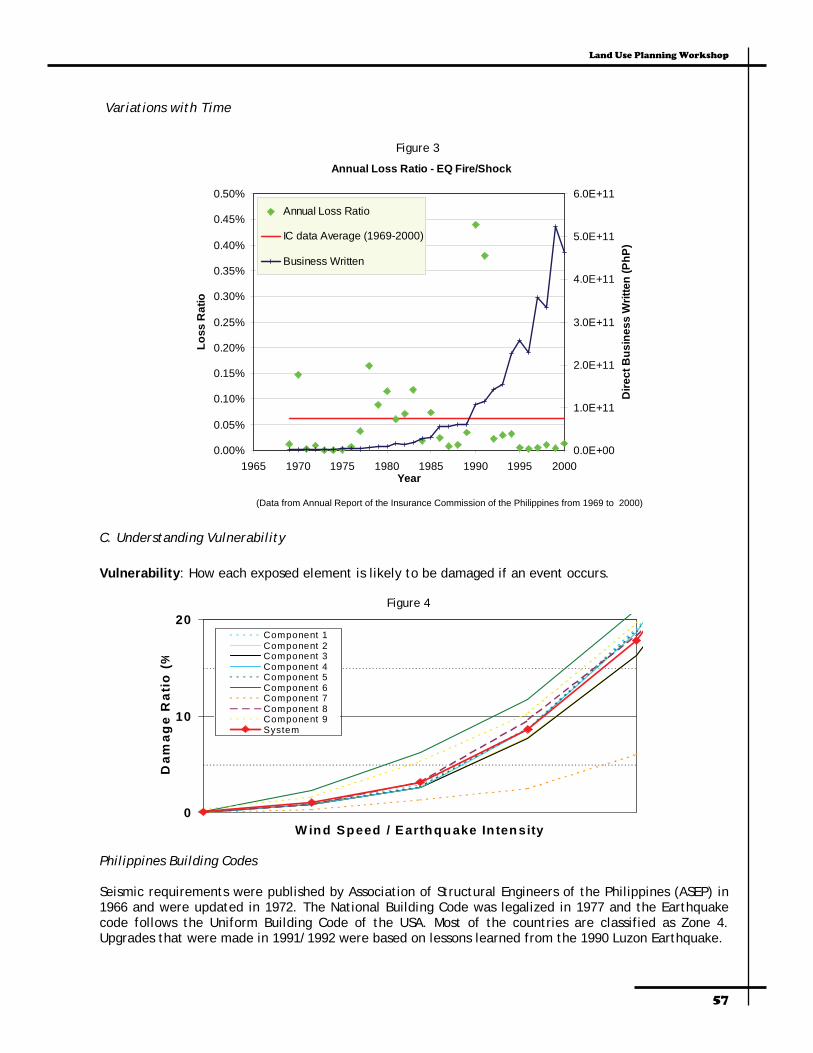
Land Use Planning Workshop
57
Variations with Time
Annual Loss Ratio - EQ Fire/Shock
0.00%
0.05%
0.10%
0.15%
0.20%
0.25%
0.30%
0.35%
0.40%
0.45%
0.50%
1965 1970 1975 1980 1985 1990 1995 2000Year
Loss
Rat
io
0.0E+00
1.0E+11
2.0E+11
3.0E+11
4.0E+11
5.0E+11
6.0E+11
Dire
ct B
usin
ess
Writ
ten
(PhP
)
Annual Loss Ratio
IC data Average (1969-2000)
Business Written
(Data from Annual Report of the Insurance Commission of the Philippines from 1969 to 2000)
Figure 3
C. Understanding Vulnerability Vulnerability: How each exposed element is likely to be damaged if an event occurs.
0
10
20
W ind Speed / Earthqu ake In tensity
Dam
age
Rat
io (
%
Component 1Component 2Component 3Component 4Component 5Component 6Component 7Component 8Component 9System
Philippines Building Codes Seismic requirements were published by Association of Structural Engineers of the Philippines (ASEP) in 1966 and were updated in 1972. The National Building Code was legalized in 1977 and the Earthquake code follows the Uniform Building Code of the USA. Most of the countries are classified as Zone 4. Upgrades that were made in 1991/1992 were based on lessons learned from the 1990 Luzon Earthquake.
Figure 4
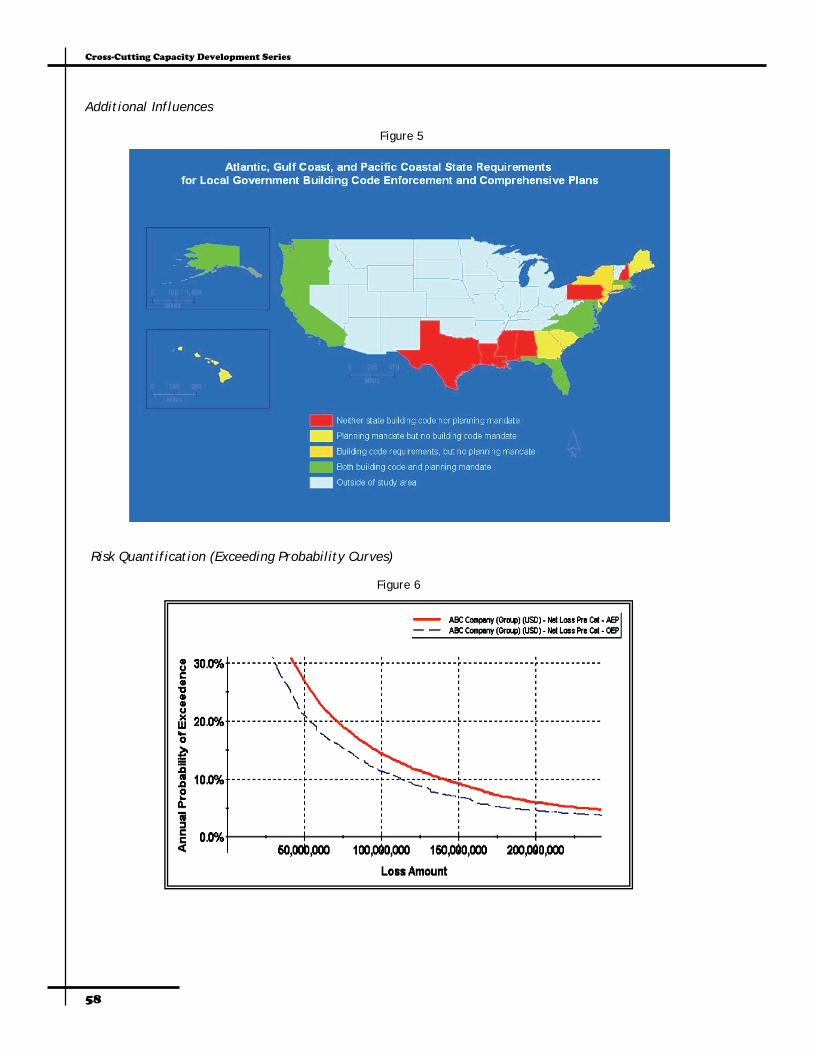
Cross-Cutting Capacity Development Series
58
Risk Quantification (Exceeding Probability Curves)
Additional Influences
Figure 5
Figure 6

Land Use Planning Workshop
59
Step 3: Risk Management Decisions There are four basic approaches to making Risk Management Decisions, namely:
• Avoid or eliminate – remove a risk trigger or deny a risk-creating project • Reduce or mitigate – reduce the frequency or the severity by changing physical
characteristics or operations • Share or transfer – shift the risk-bearing responsibility to another party • Retain – fund potential losses with own resources
Ultimately finding the best solution depends not only on the circumstances but also on the values and priorities of the decision makers. Risk Management Decision Tools
Figure 7 Risk Map
Making a cost-benefit analysis or plotting a risk map (Figure 8) are great tools in making risk management decisions. With a risk map, you can compare fre-quency and severity of risks. A third dimension can be added to the risk maps signifying predictability or understanding.
Risk Management Decision Tools: Planning Procedures & Regulations Planning Procedures and Regulations can be divided into two groups, namely:
• Strategic or policy-level: ◊ Comprehensive, general, and
land use plans ◊ Area, neighborhood, and
redevelopment plans ◊ Disaster (emergency)
management plan
• Tactical or project-level: ◊ Zoning regulations ◊ Land subdivision regulations ◊ Development standards/
guidelines ◊ Building codes ◊ Tax/development incentives
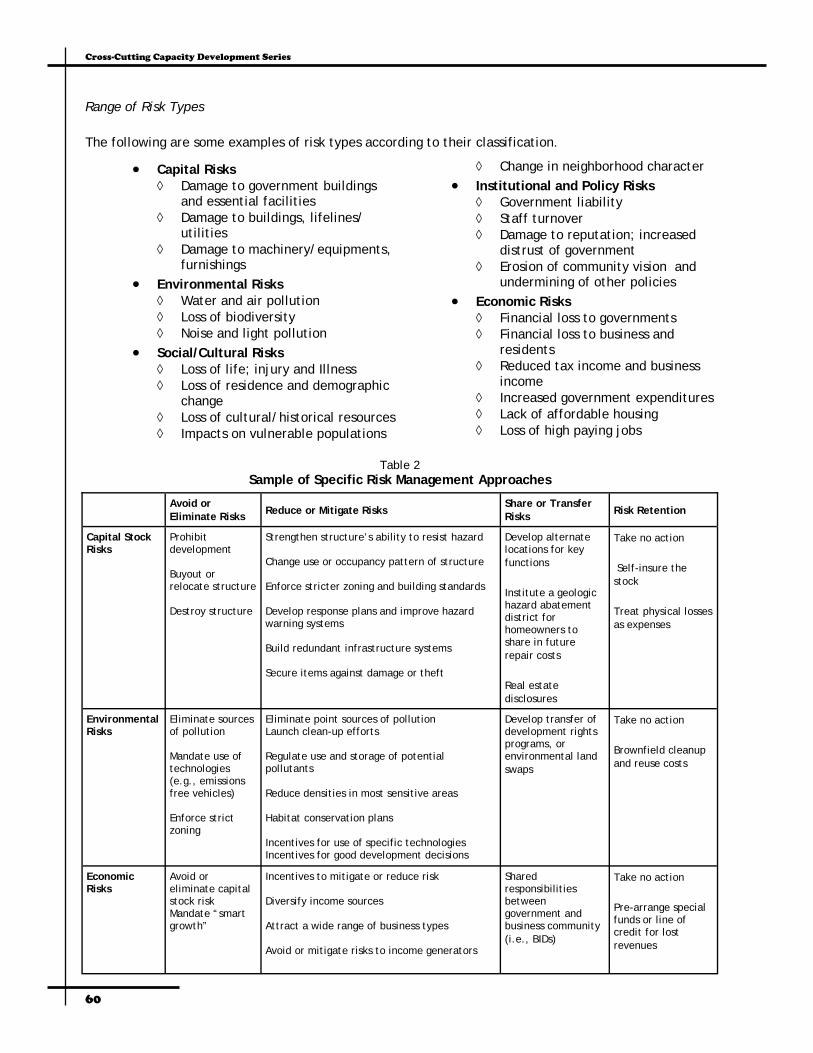
Cross-Cutting Capacity Development Series
60
• Capital Risks ◊ Damage to government buildings
and essential facilities ◊ Damage to buildings, lifelines/
utilities ◊ Damage to machinery/equipments,
furnishings • Environmental Risks
◊ Water and air pollution ◊ Loss of biodiversity ◊ Noise and light pollution
• Social/Cultural Risks ◊ Loss of life; injury and Illness ◊ Loss of residence and demographic
change ◊ Loss of cultural/historical resources ◊ Impacts on vulnerable populations
◊ Change in neighborhood character • Institutional and Policy Risks
◊ Government liability ◊ Staff turnover ◊ Damage to reputation; increased
distrust of government ◊ Erosion of community vision and
undermining of other policies • Economic Risks
◊ Financial loss to governments ◊ Financial loss to business and
residents ◊ Reduced tax income and business
income ◊ Increased government expenditures ◊ Lack of affordable housing ◊ Loss of high paying jobs
Avoid or Eliminate Risks Reduce or Mitigate Risks
Share or Transfer Risks Risk Retention
Capital Stock Risks
Prohibit development Buyout or relocate structure Destroy structure
Strengthen structure’s ability to resist hazard Change use or occupancy pattern of structure Enforce stricter zoning and building standards Develop response plans and improve hazard warning systems Build redundant infrastructure systems Secure items against damage or theft
Develop alternate locations for key functions
Institute a geologic hazard abatement district for homeowners to share in future repair costs
Real estate disclosures
Take no action
Self-insure the stock
Treat physical losses as expenses
Environmental Risks
Eliminate sources of pollution Mandate use of technologies (e.g., emissions free vehicles) Enforce strict zoning
Eliminate point sources of pollution Launch clean-up efforts Regulate use and storage of potential pollutants Reduce densities in most sensitive areas Habitat conservation plans Incentives for use of specific technologies Incentives for good development decisions
Develop transfer of development rights programs, or environmental land swaps
Take no action
Brownfield cleanup and reuse costs
Economic Risks
Avoid or eliminate capital stock risk Mandate “smart growth”
Incentives to mitigate or reduce risk Diversify income sources Attract a wide range of business types Avoid or mitigate risks to income generators
Shared responsibilities between government and business community (i.e., BIDs)
Take no action
Pre-arrange special funds or line of credit for lost revenues
Table 2 Sample of Specific Risk Management Approaches
Range of Risk Types The following are some examples of risk types according to their classification.
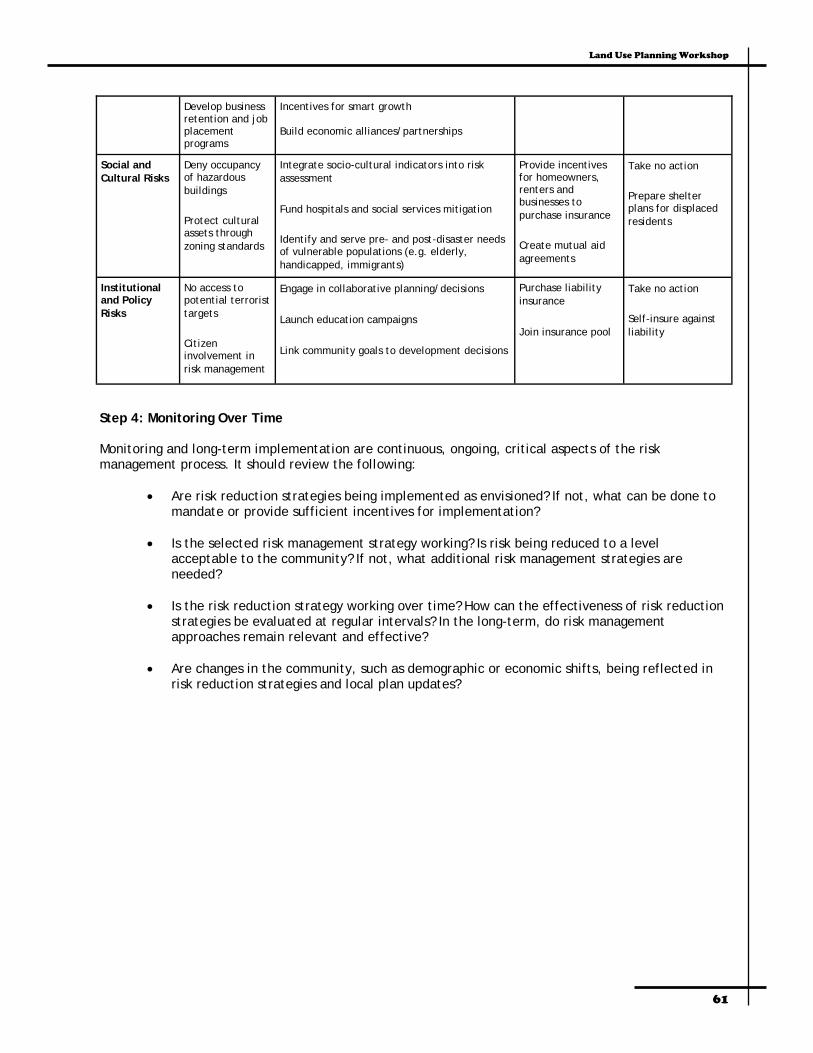
Land Use Planning Workshop
61
Social and Cultural Risks
Deny occupancy of hazardous buildings
Protect cultural assets through zoning standards
Integrate socio-cultural indicators into risk assessment
Fund hospitals and social services mitigation
Identify and serve pre- and post-disaster needs of vulnerable populations (e.g. elderly, handicapped, immigrants)
Provide incentives for homeowners, renters and businesses to purchase insurance
Create mutual aid agreements
Take no action
Prepare shelter plans for displaced residents
Institutional and Policy Risks
No access to potential terrorist targets
Citizen involvement in risk management
Engage in collaborative planning/decisions
Launch education campaigns
Link community goals to development decisions
Purchase liability insurance
Join insurance pool
Take no action
Self-insure against liability
Develop business retention and job placement programs
Incentives for smart growth Build economic alliances/partnerships
Step 4: Monitoring Over Time Monitoring and long-term implementation are continuous, ongoing, critical aspects of the risk management process. It should review the following:
• Are risk reduction strategies being implemented as envisioned? If not, what can be done to mandate or provide sufficient incentives for implementation?
• Is the selected risk management strategy working? Is risk being reduced to a level
acceptable to the community? If not, what additional risk management strategies are needed?
• Is the risk reduction strategy working over time? How can the effectiveness of risk reduction
strategies be evaluated at regular intervals? In the long-term, do risk management approaches remain relevant and effective?
• Are changes in the community, such as demographic or economic shifts, being reflected in
risk reduction strategies and local plan updates?
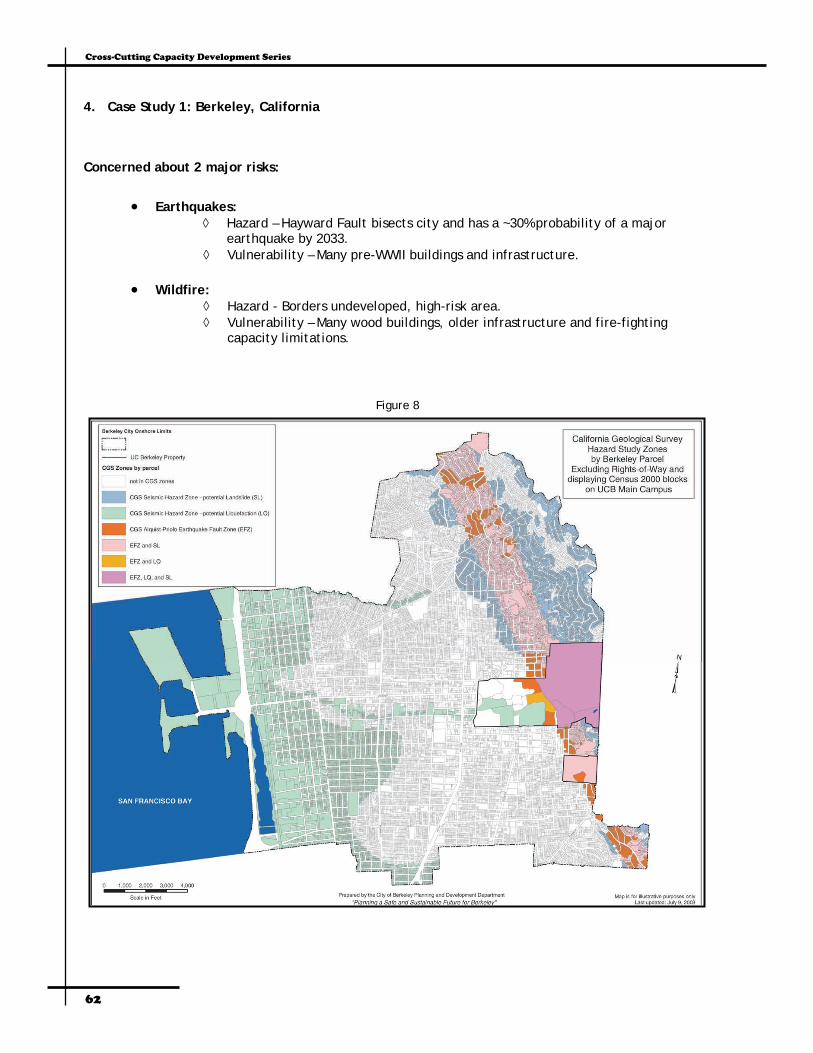
Cross-Cutting Capacity Development Series
62
Concerned about 2 major risks:
• Earthquakes: ◊ Hazard – Hayward Fault bisects city and has a ~30% probability of a major
earthquake by 2033. ◊ Vulnerability – Many pre-WWII buildings and infrastructure.
• Wildfire: ◊ Hazard - Borders undeveloped, high-risk area. ◊ Vulnerability – Many wood buildings, older infrastructure and fire-fighting
capacity limitations.
Figure 8
4. Case Study 1: Berkeley, California

Land Use Planning Workshop
63
Background Information
•Historic political and stakeholder support for disaster mitigation and preparedness. • But, handled programmatically and on project-by-project basis.
◊ Strengthening public buildings – fire stations and schools ◊ Strengthening private buildings – incentive to retrofit offset by partial refund of
city’s property transfer tax
• Opportunity to unite two comprehensive planning efforts: ◊ General Plan update (adopted 2003)
♦ California requires 7 plan elements (land use, circulation, housing, conservation, open-space, noise and safety).
♦ Planning and zoning consistency also required ◊ Local Hazard Mitigation Plan (LHMP) (adopted 2004).
♦ Disaster Mitigation Act of 2000 requires LHMP in order for city to be eligible for post-disaster funds.
• Combined citizen participation efforts. • LHMP added as appendix to General Plan (Figures 10 and 11). • Commitment to review plans every 2 years. • Key issue – provide affordable housing . • 5,000 housing units in collapse risk, ‘soft-story’ buildings (See Figures 12 and 13).
Figure 9
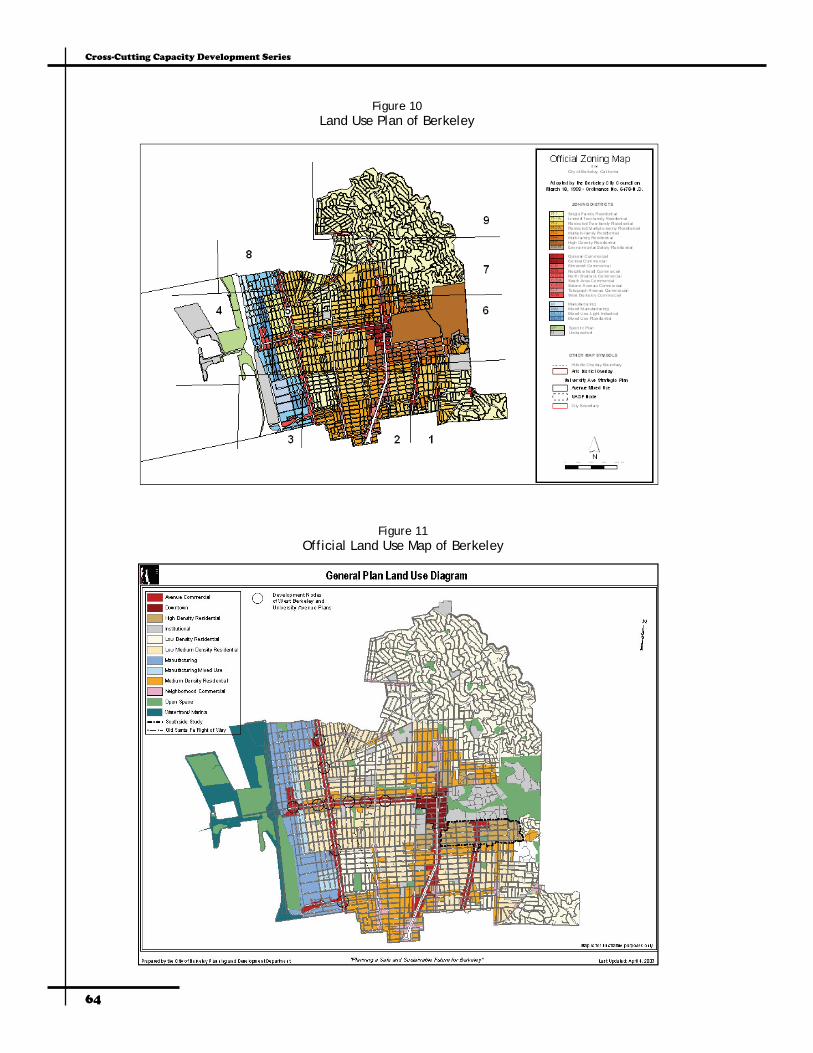
Cross-Cutting Capacity Development Series
64
Figure 10 Land Use Plan of Berkeley
Figure 11 Official Land Use Map of Berkeley
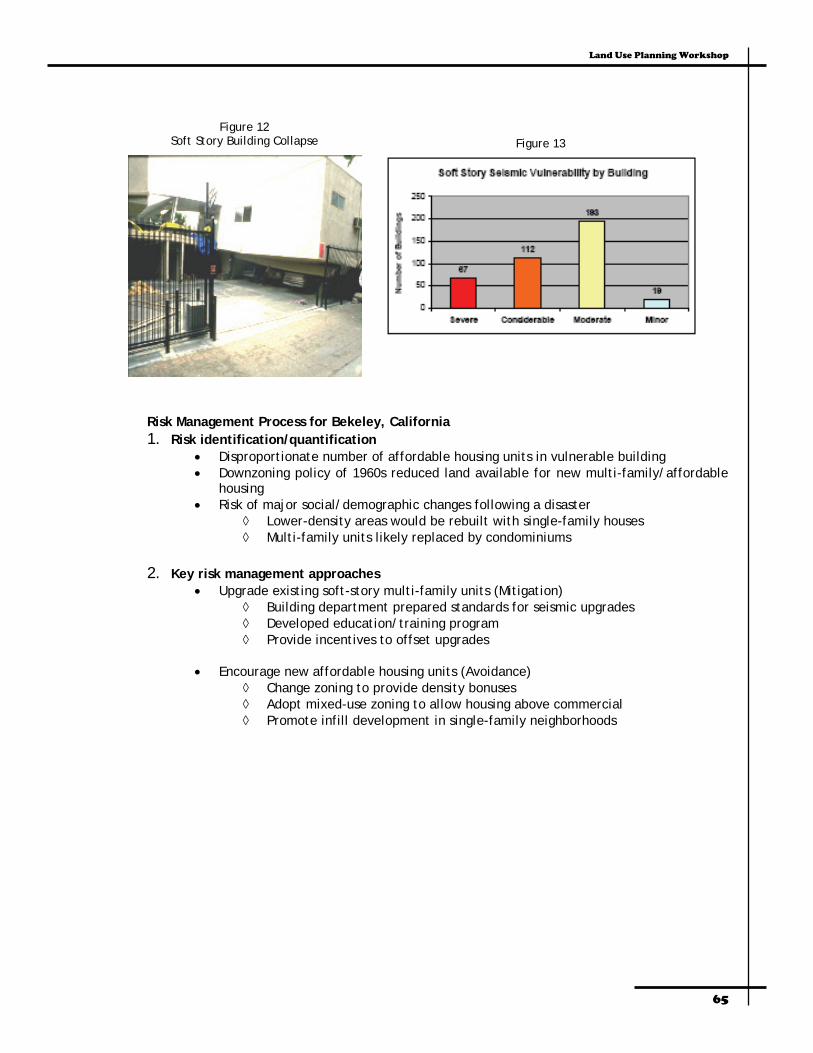
Land Use Planning Workshop
65
Risk Management Process for Bekeley, California 1. Risk identification/quantification
• Disproportionate number of affordable housing units in vulnerable building • Downzoning policy of 1960s reduced land available for new multi-family/affordable
housing • Risk of major social/demographic changes following a disaster
◊ Lower-density areas would be rebuilt with single-family houses ◊ Multi-family units likely replaced by condominiums
2. Key risk management approaches
• Upgrade existing soft-story multi-family units (Mitigation) ◊ Building department prepared standards for seismic upgrades ◊ Developed education/training program ◊ Provide incentives to offset upgrades
• Encourage new affordable housing units (Avoidance)
◊ Change zoning to provide density bonuses ◊ Adopt mixed-use zoning to allow housing above commercial ◊ Promote infill development in single-family neighborhoods
Figure 12 Soft Story Building Collapse Figure 13

Cross-Cutting Capacity Development Series
66
5. Case Study 2: New Orleans Flood Risk
Applying the four steps of the Risk Management Process to the Hurricane Katrina tragedy in New Orleans:
1. Risk Identification: Seasonal river flooding, hurricane storm surge, regional subsidence, low
elevation of valuable economic/built infrastructure, historic preservation. 2. Risk Quantification: Anticipated flood height for various return-period events. 3. Risk Decision: Mitigate with (Cat 3-level) flood protection, retain residual risk. 4. Monitoring: Maintenance by USACE and levee districts and City’s pumping facilities.
Impact of Hurricane Katrina
• Deaths: >1,300 • Households damaged and displaced
◊ >200,000 severely damaged or destroyed* ◊ 108,731 households with more than 4 feet of floodwater in New Orleans (50% of all
NOLA households) ◊ 1.7 million registrants for FEMA’s Individuals and Households programs
• Employment: >400,000 jobs lost • Total reconstruction: >$175 billion for hurricanes Katrina and Rita
(www.msnbc.msn.com)(www.msnbc.msn.com)

Land Use Planning Workshop
67
◊ >$100 billion in federal assistance now committed ◊ $17.4 billion in National Flood Insurance Program claims ◊ $53.7 billion in private insured claims paid for 2005 storms; $38.1 billion for Katrina
Disaster Recovery Elements/Costs
• Insured commercial properties (structure, contents and business interruption) ◊ Middle market (chains) ◊ Large commercial ◊ Large industrial ◊ Offshore and onshore energy ◊ Private utilities
• Insured residential (structure, contents and ALE) ◊ Standard homeowners policies ◊ National Flood Insurance Program
• Insured public facilities ◊ City, county and state buildings ◊ Universities, schools and hospitals ◊ Public utilities (usually structures)
• Response and recovery management costs • Debris removal and contamination clean-up • Infrastructure reconstruction
◊ Roads and utilities ◊ Levees
• Temporary housing • Permanent housing (primarily for uninsured owners and renters) • Uninsured commercial needs
◊ Small businesses and industries • Repair of uninsured public facilities
◊ Federal properties ◊ Other state, county and city facilities ◊ Utility lines and some structures
• Cost of deductibles, under-insurance Local Government Recovery Costs
• Response and recovery management costs • Major infrastructure reconstruction • Schools, hospitals, and other government facilities • Housing – Individual gaps, public housing needs • Businesses and industries – Resource gaps, local economic needs • Historical and cultural features • Environmental resource protection and restoration
Local Recovery Management Costs • Evacuation • Sheltering • Public protection • Debris removal • Contamination clean-up

Cross-Cutting Capacity Development Series
68
• Utility restoration and repairs • Road repairs • Permit processing • Staffing
Applying the Steps:
• Comprehensive risk identification and quantification? ◊ Consideration of the real costs of future development (location, building standards,
density). ◊ Appropriate valuation of capital stock, regional economic implications, especially
rebuilding. ◊ Consider the many institutional and operational risks (i.e. multi-jurisdictional
coordination, budget for maintenance). • Clear understanding and valuation of risk retained? • Monitoring over time?
6. Summary
• Risk is the combination of the chance of an event and its consequences. • Risk management is a structured, holistic approach to evaluate and address range of potential
impacts; it creates a common valuation system. • Four steps in the risk management process:
◊ Identification ◊ Quantification ◊ Decision making ◊ Monitoring
• Four general types of risk management strategies: ◊ Avoid or eliminate ◊ Reduce or mitigate ◊ Share or transfer ◊ Retain
• Many risk management tools are consistent with local planning and implementation procedures.
◊ Have both pre- and post-disaster strategies. ◊ Consider tools for both existing and new development.

Land Use Planning Workshop
69
Land Use Planning Workshop Outputs
The participants were clustered into four groups. The first part of the group discussions centered on the assessment of the current degree or extent of disaster risk reduction or DRR mainstreaming in institutional practices of the participating local government units. This was done through the use of Tearfund’s tool that seeks to help development organizations mainstream DRR into their development planning and programming (see Tearfund’s Mainstreaming Disaster Risk Reduction: A Tool for Development Organisations published in 2005). Local governments, as a development organization, can thus make use of the tool to assess, measure, and monitor their progress in integrating DRR in six key areas of institutional practice: Policy, Strategy, Geographical Planning (also termed as Land Use Planning here), Project Management Cycle, External Relations, and Institutional Capacity.
The self-assessment using the questionnaire aimed to help the participants to gauge their level of attainment in terms of institutionalizing DRR in regular operations and know where they stood. Some unexpected results came out of the activity, e.g. a few LGUs checked several levels in one key area of assessment when only one level describing the current state of mainstreaming should have been given. This could have been due to the quality of facilitation, misinterpretation of the instructions by some participants, or weakness of the questionnaire itself. Nevertheless, the results of this institutional assessment are still useful as an indicative benchmark or point of reference for the overall assessment of Metro Manila’s current state of DRR mainstreaming. Future evaluations and monitoring by the local government units (LGUs) may refer to this initial baseline self-assessment. Alternatively, LGUs or any development organization may wish to refine this self-assessment and have independent checks and balances by involving external facilitators (i.e. NGO, Committee, Task Force) to measure and then monitor their progress. The broad scope and levels of progression may, aside from being indicators, also be treated as performance targets and priority issues to be addressed by LGUs to help them integrate and expand disaster risk reduction initiatives in daily governance functions and develop a mainstreaming strategy over a period of time. The second part of the group discussions centered on brainstorming on planning tools, methods and techniques that can be used to integrate risk factors in local land use planning practice. A template was provided to the participants. The objective was to illustrate how planning tools, methods and techniques that were already familiar to local city planners could be used to integrate risk factors in the local land use planning and practices. Using a Workshop Guide, Facilitators and FG2 members moderated the discussions. Rapporteurs were selected by the participants from among themselves.

Cross-Cutting Capacity Development Series
70
AREA 1 Policy Level 1: The organization has little or no understanding of the relevance and importance of disaster risk reduction for its relief and development policy and practice. Level 2A: There is general awareness within the organization of the significance of disasters for its relief and development work, including the extent of the threat that disasters pose to the organization’s long-term development goals and objectives. Level 2B: The organization recognizes the need for relief and development to be linked in a coordinated approach to reducing disaster risks. Level 3A: The organization has a conceptual framework for disaster management which recognizes vulnerability as contributing to the risk of disasters. Level 3B: A wide cross-section of staff are engaged in a consultative process to either inform the development of a policy which commits the organization to mainstreaming disaster risk reduction within the organization’s relief and development operations, or incorporate risk reduction, mainstreaming into the organization’s existing policy structure. Level 4A: The organization has a ‘policy’ on disaster risk reduction with realistic, achievable goals for mainstreaming. This is understood and accepted across the organization. Level 4B: The organization’s risk reduction ‘policy’ commits it to addressing three critical issues: (1) ensuring that development programmes/projects supported by the organization are protected through disaster risk reduction elements; (2) ensuring that disaster relief and rehabilitation programmes/projects are managed in a developmental manner and (3) ensuring that development, relief and rehabilitation programmes/projects do not increase people’s vulnerability to disasters. Level 4C: The risk reduction ‘policy’ is fully endorsed by senior management. Level 4D: The risk reduction ‘policy’ is reflected in internal and external documents.
Level 1 Level 2A Level 2B Level 3A Level 3B Level 4A Level 4B Level 4C Level 4D
Caloocan
Makati Malabon Mandaluyong Manila Marikina Muntinlupa Navotas Pasay Pateros Quezon City Valenzuela
Las Piñas
Workshop Outputs Tabulated Results of the Tearfund Questionnaire
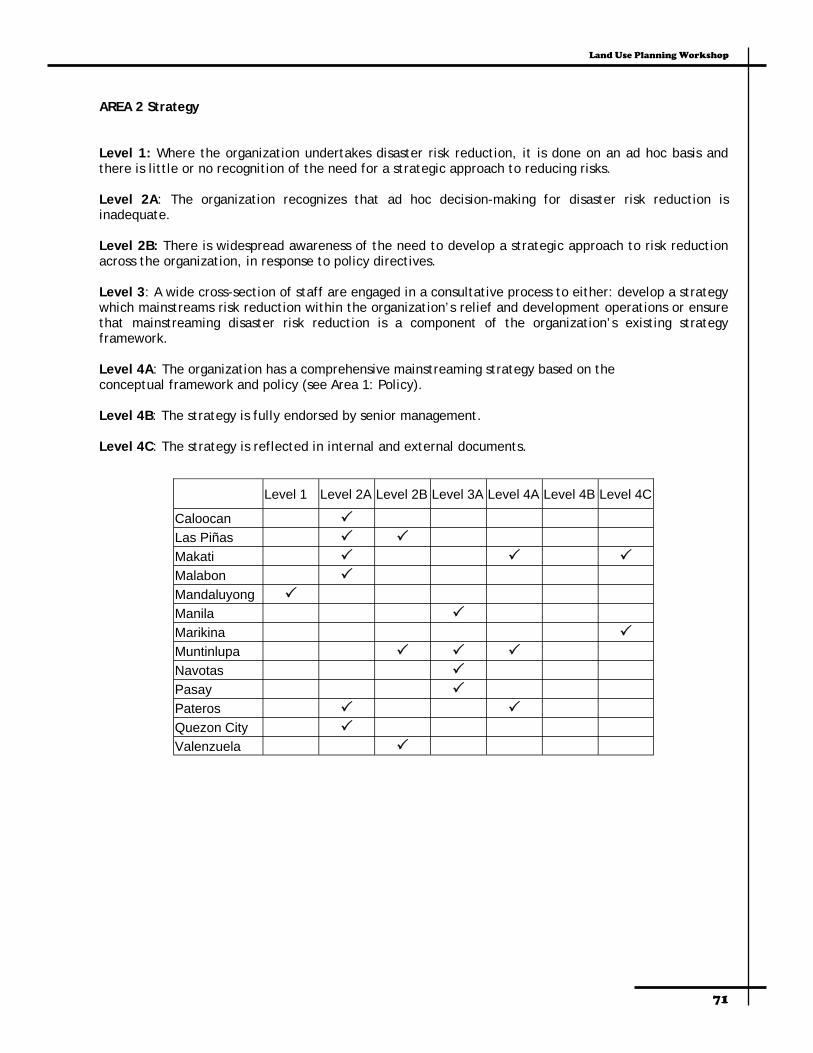
Land Use Planning Workshop
71
AREA 2 Strategy Level 1: Where the organization undertakes disaster risk reduction, it is done on an ad hoc basis and there is little or no recognition of the need for a strategic approach to reducing risks. Level 2A: The organization recognizes that ad hoc decision-making for disaster risk reduction is inadequate. Level 2B: There is widespread awareness of the need to develop a strategic approach to risk reduction across the organization, in response to policy directives. Level 3: A wide cross-section of staff are engaged in a consultative process to either: develop a strategy which mainstreams risk reduction within the organization’s relief and development operations or ensure that mainstreaming disaster risk reduction is a component of the organization’s existing strategy framework. Level 4A: The organization has a comprehensive mainstreaming strategy based on the conceptual framework and policy (see Area 1: Policy). Level 4B: The strategy is fully endorsed by senior management. Level 4C: The strategy is reflected in internal and external documents.
Level 1 Level 2A Level 2B Level 3A Level 4A Level 4B Level 4C
Caloocan
Makati Malabon Mandaluyong Manila Marikina Muntinlupa Navotas Pasay Pateros Quezon City Valenzuela
Las Piñas

Cross-Cutting Capacity Development Series
72
AREA 3 Land Use/Geographical planning Level 1: The organization has little or no awareness of the need to consider disaster risks within geographical planning. Level 2A: There is widespread understanding of the disaster-risk-vulnerability relationship at relevant geographical levels, and of the impact of disasters on the organization’s work in a given geographical area. Level 2B: There is widespread understanding of the need to apply policy commitment to risk reduction within geographical planning (including Direct Budgetary Support mechanisms). Level 2C: The organization is considering how existing geographical planning tools can be (re)designed to take account of hazards, risks and vulnerabilities. Level 3: The organization is developing a process to ensure that all planning frameworks include disaster risk reduction (in order that planning is undertaken as outlined in Level 4). Level 4A: There is ongoing analysis of the disaster environment in any given location,(i.e. assessment of hazards, disaster impact, vulnerabilities and risks). This analysis involves the perspectives of local communities, NGOs and other stakeholders. Level 4B: Appropriate risk reduction strategies are developed on the basis of the above, and integrated into new geographical plans as a matter of course. Level 4C: Where the organization focuses on Direct Budgetary Support, it seeks the inclusion of disaster risk assessment and risk reduction in the national planning frameworks of disaster-prone countries.
Level 1 Level 2A Level 2B Level 3 Level 4A Level 4B Level 4C
Caloocan
Makati Malabon Mandaluyong Manila Marikina Muntinlupa Navotas Pasay Pateros Quezon City Valenzuela
Level 2C
Las Piñas
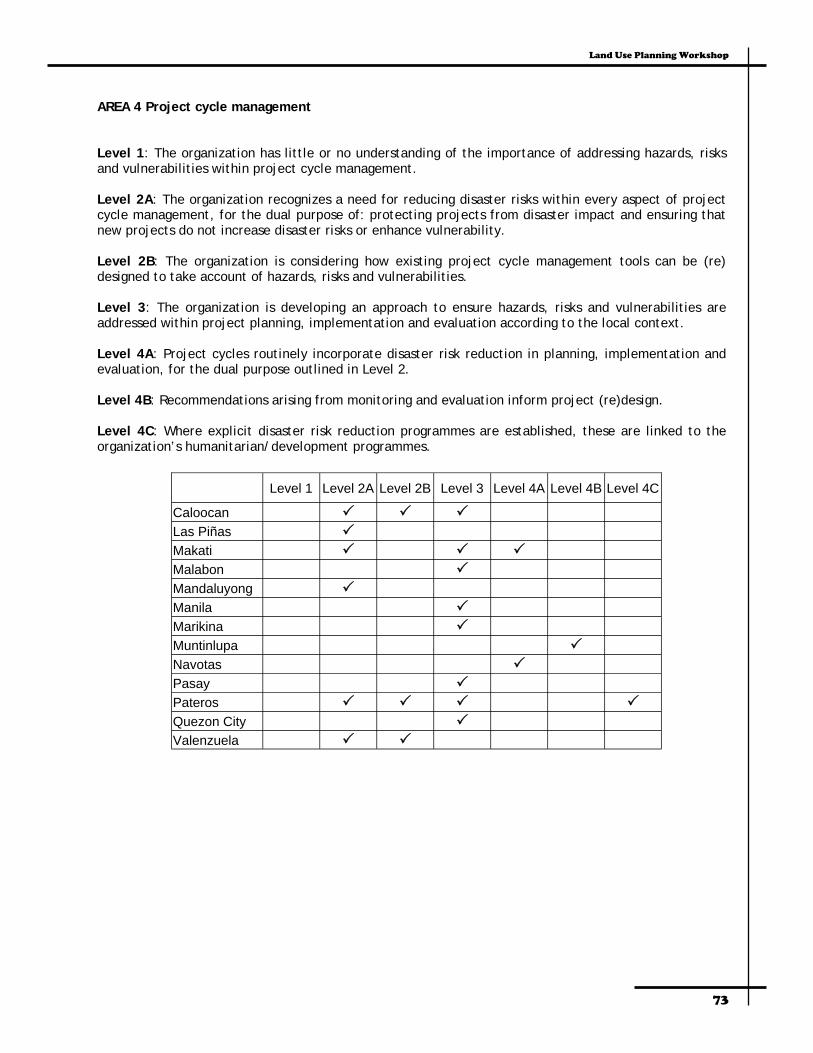
Land Use Planning Workshop
73
AREA 4 Project cycle management Level 1: The organization has little or no understanding of the importance of addressing hazards, risks and vulnerabilities within project cycle management. Level 2A: The organization recognizes a need for reducing disaster risks within every aspect of project cycle management, for the dual purpose of: protecting projects from disaster impact and ensuring that new projects do not increase disaster risks or enhance vulnerability. Level 2B: The organization is considering how existing project cycle management tools can be (re)designed to take account of hazards, risks and vulnerabilities. Level 3: The organization is developing an approach to ensure hazards, risks and vulnerabilities are addressed within project planning, implementation and evaluation according to the local context. Level 4A: Project cycles routinely incorporate disaster risk reduction in planning, implementation and evaluation, for the dual purpose outlined in Level 2. Level 4B: Recommendations arising from monitoring and evaluation inform project (re)design. Level 4C: Where explicit disaster risk reduction programmes are established, these are linked to the organization’s humanitarian/development programmes.
Level 1 Level 2A Level 2B Level 3 Level 4A Level 4B Level 4C
Caloocan
Makati Malabon Mandaluyong Manila Marikina Muntinlupa Navotas Pasay Pateros Quezon City Valenzuela
Las Piñas
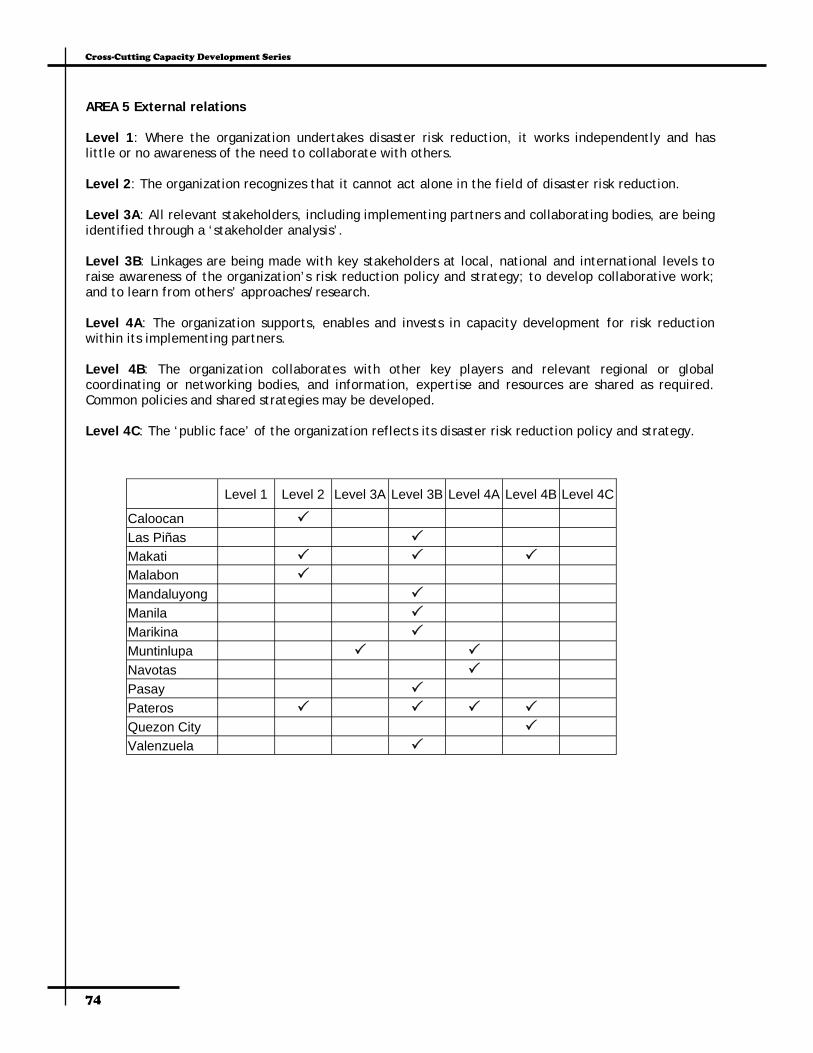
Cross-Cutting Capacity Development Series
74
AREA 5 External relations Level 1: Where the organization undertakes disaster risk reduction, it works independently and has little or no awareness of the need to collaborate with others. Level 2: The organization recognizes that it cannot act alone in the field of disaster risk reduction. Level 3A: All relevant stakeholders, including implementing partners and collaborating bodies, are being identified through a ‘stakeholder analysis’. Level 3B: Linkages are being made with key stakeholders at local, national and international levels to raise awareness of the organization’s risk reduction policy and strategy; to develop collaborative work; and to learn from others’ approaches/research. Level 4A: The organization supports, enables and invests in capacity development for risk reduction within its implementing partners. Level 4B: The organization collaborates with other key players and relevant regional or global coordinating or networking bodies, and information, expertise and resources are shared as required. Common policies and shared strategies may be developed. Level 4C: The ‘public face’ of the organization reflects its disaster risk reduction policy and strategy.
Level 1 Level 2 Level 3A Level 3B Level 4A Level 4B Level 4C
Caloocan
Makati Malabon Mandaluyong Manila Marikina Muntinlupa Navotas Pasay Pateros Quezon City Valenzuela
Las Piñas

Land Use Planning Workshop
75
AREA 6 Institutional capacity Level 1: The organization has little or no capacity to mainstream disaster risk reduction, and little or no recognition of the need to increase/develop its financial or human resources for this purpose. Level 2: The organization recognizes that it must develop appropriate capacity including sufficient resources to support the process of mainstreaming risk reduction. Level 3A: Plans are being made to develop a supportive institutional environment for mainstreaming disaster risk reduction. Level 3B: Tools are being developed to assess the organization’s progress with mainstreaming. Level 4A: Institutional capacity is sufficient to support all the processes outlined in Areas 1–5, i.e. financial resources, skills and knowledge (e.g., staff training and development, materials and appropriate technical support) and strong cross-organizational commitment and ownership of risk reduction policy and strategy at all levels. Level 4B: There are strong links between HQ and field staff, who have access to services and exchange of information. Level 4C: Tools are routinely used independently and comprehensively to assess the organization’s progress with mainstreaming.
Level 1 Level 2 Level 3A Level 3B Level 4A Level 4B Level 4C
Caloocan
Makati Malabon Mandaluyong Manila Marikina Muntinlupa Navotas Pasay Pateros Quezon City Valenzuela
Las Piñas
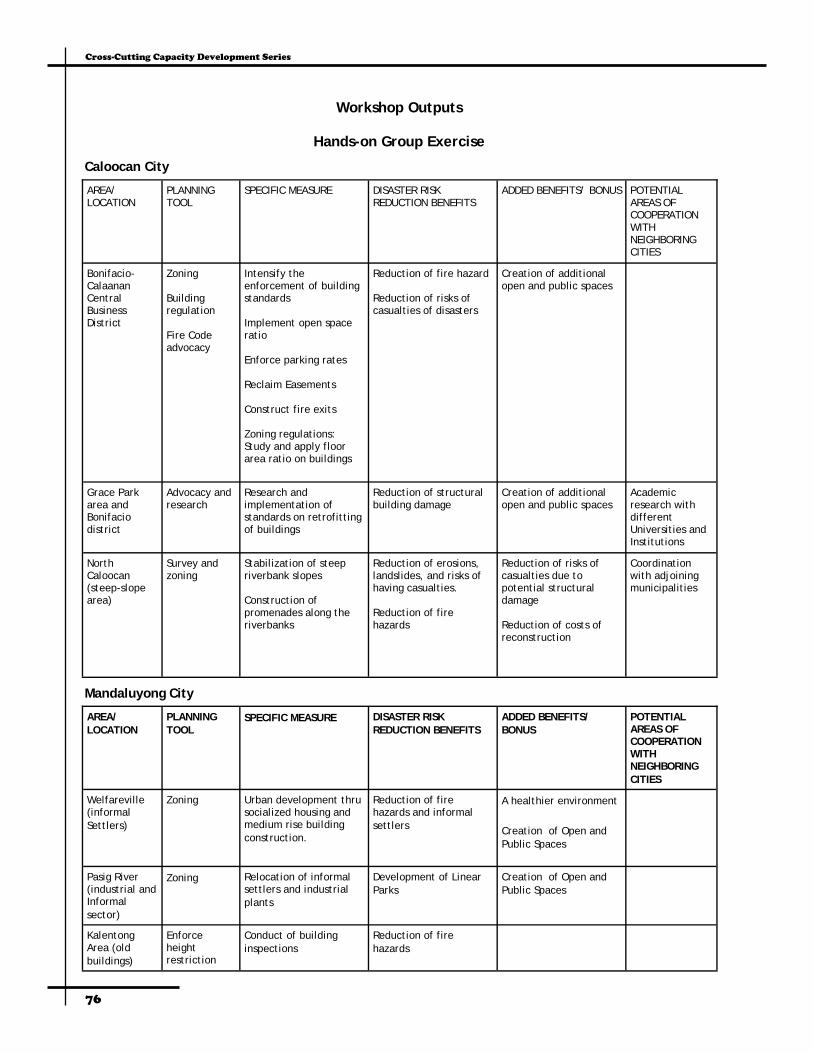
Cross-Cutting Capacity Development Series
76
Workshop Outputs
Hands-on Group Exercise
AREA/LOCATION
PLANNING TOOL
SPECIFIC MEASURE
DISASTER RISK REDUCTION BENEFITS
ADDED BENEFITS/ BONUS POTENTIAL AREAS OF COOPERATION WITH NEIGHBORING CITIES
Bonifacio-Calaanan Central Business District
Zoning Building regulation Fire Code advocacy
Intensify the enforcement of building standards Implement open space ratio Enforce parking rates Reclaim Easements Construct fire exits Zoning regulations: Study and apply floor area ratio on buildings
Reduction of fire hazard Reduction of risks of casualties of disasters
Creation of additional open and public spaces
North Caloocan (steep-slope area)
Survey and zoning
Stabilization of steep riverbank slopes Construction of promenades along the riverbanks
Reduction of erosions, landslides, and risks of having casualties. Reduction of fire hazards
Reduction of risks of casualties due to potential structural damage Reduction of costs of reconstruction
Coordination with adjoining municipalities
Grace Park area and Bonifacio district
Advocacy and research
Research and implementation of standards on retrofitting of buildings
Reduction of structural building damage
Creation of additional open and public spaces
Academic research with different Universities and Institutions
Caloocan City
AREA/LOCATION
PLANNING TOOL
SPECIFIC MEASURE
DISASTER RISK REDUCTION BENEFITS
ADDED BENEFITS/ BONUS
POTENTIAL AREAS OF COOPERATION WITH NEIGHBORING CITIES
Welfareville (informal Settlers)
Zoning Urban development thru socialized housing and medium rise building construction.
Reduction of fire hazards and informal settlers
A healthier environment
Creation of Open and Public Spaces
Pasig River (industrial and Informal sector)
Zoning Relocation of informal settlers and industrial plants
Development of Linear Parks
Creation of Open and Public Spaces
Kalentong Area (old buildings)
Enforce height restriction
Conduct of building inspections
Reduction of fire hazards
Mandaluyong City
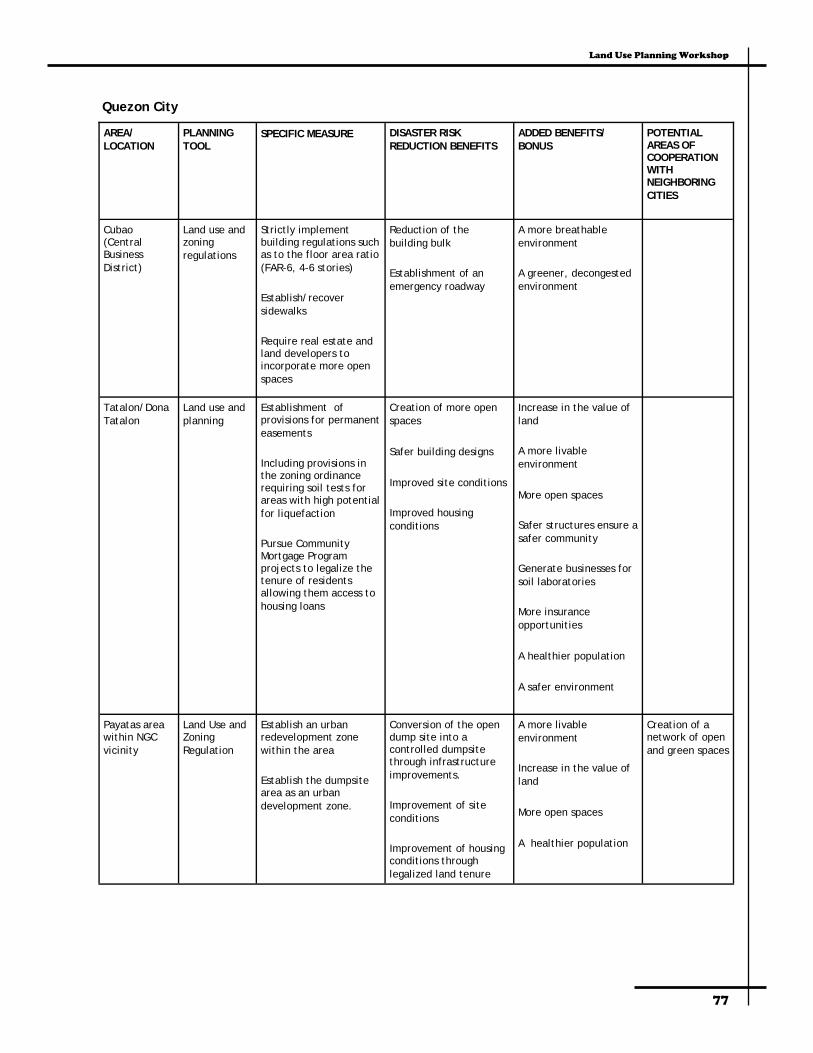
Land Use Planning Workshop
77
AREA/LOCATION
PLANNING TOOL
SPECIFIC MEASURE
DISASTER RISK REDUCTION BENEFITS
ADDED BENEFITS/ BONUS
POTENTIAL AREAS OF COOPERATION WITH NEIGHBORING CITIES
Cubao (Central Business District)
Land use and zoning regulations
Strictly implement building regulations such as to the floor area ratio (FAR-6, 4-6 stories)
Establish/recover sidewalks
Require real estate and land developers to incorporate more open spaces
Reduction of the building bulk
Establishment of an emergency roadway
A more breathable environment
A greener, decongested environment
Tatalon/Dona Tatalon
Land use and planning
Establishment of provisions for permanent easements
Including provisions in the zoning ordinance requiring soil tests for areas with high potential for liquefaction
Pursue Community Mortgage Program projects to legalize the tenure of residents allowing them access to housing loans
Creation of more open spaces
Safer building designs
Improved site conditions
Improved housing conditions
Increase in the value of land
A more livable environment
More open spaces
Safer structures ensure a safer community
Generate businesses for soil laboratories
More insurance opportunities
A healthier population
A safer environment
Payatas area within NGC vicinity
Land Use and Zoning Regulation
Establish an urban redevelopment zone within the area
Establish the dumpsite area as an urban development zone.
Conversion of the open dump site into a controlled dumpsite through infrastructure improvements.
Improvement of site conditions
Improvement of housing conditions through legalized land tenure
A more livable environment
Increase in the value of land
More open spaces
A healthier population
Creation of a network of open and green spaces
Quezon City

Cross-Cutting Capacity Development Series
78
AREA/LOCATION
PLANNING TOOL
SPECIFIC MEASURE
DISASTER RISK REDUCTION BENEFITS
ADDED BENEFITS/ BONUS
POTENTIAL AREAS OF COOPERATION WITH NEIGHBORING CITIES
Areas along Laguna Bay
Building regulations
Zoning
Restriction of the height of new structures to 2 stories
Restriction of zones to single-family with no industrial
Reduction of potential damage to property
Reduction of possible casualties
Relocation of informal dwellers
Creation of more open spaces
Opportunities for tourist attractions
Improvement of flood mitigation
Opportunity for continuous open spaces along the bay
Fault zones in 8 baranguays
Building regulations Zoning
Restrict height of buildings
Prohibit development
Minimize the possible loss of life
Reduction of damage to property
Creation of more open space
Establish a network of monitoring and data sharing with other LGUs
Marikina City
AREA/LOCATION
PLANNING TOOL
SPECIFIC MEASURE
DISASTER RISK REDUCTION BENEFITS
ADDED BENEFITS/ BONUS
POTENTIAL AREAS OF COOPERATION WITH NEIGHBORING CITIES
Areas within the fault line
Zoning and building regulation
Hazard mapping, GIS,
Foot survey fault line monitoring;
Use of standards (i.e. HLURB, NSCP, Fire and Building codes)
Set limits on building height
Create buffer zones/fire breaks within the fault area
Undertake land readjustment or relocate structures within the fault zone
Reduction of building collapse
Creation of open space which helps reduce urban fire spread
Reduction of economic loss
Minimization of casualties
A healthier environment with open spaces
Discouragement of the migration of informal dwellers into the buffer areas
Data sharing with neighboring cities
Creation of a disaster trust fund
Makati City
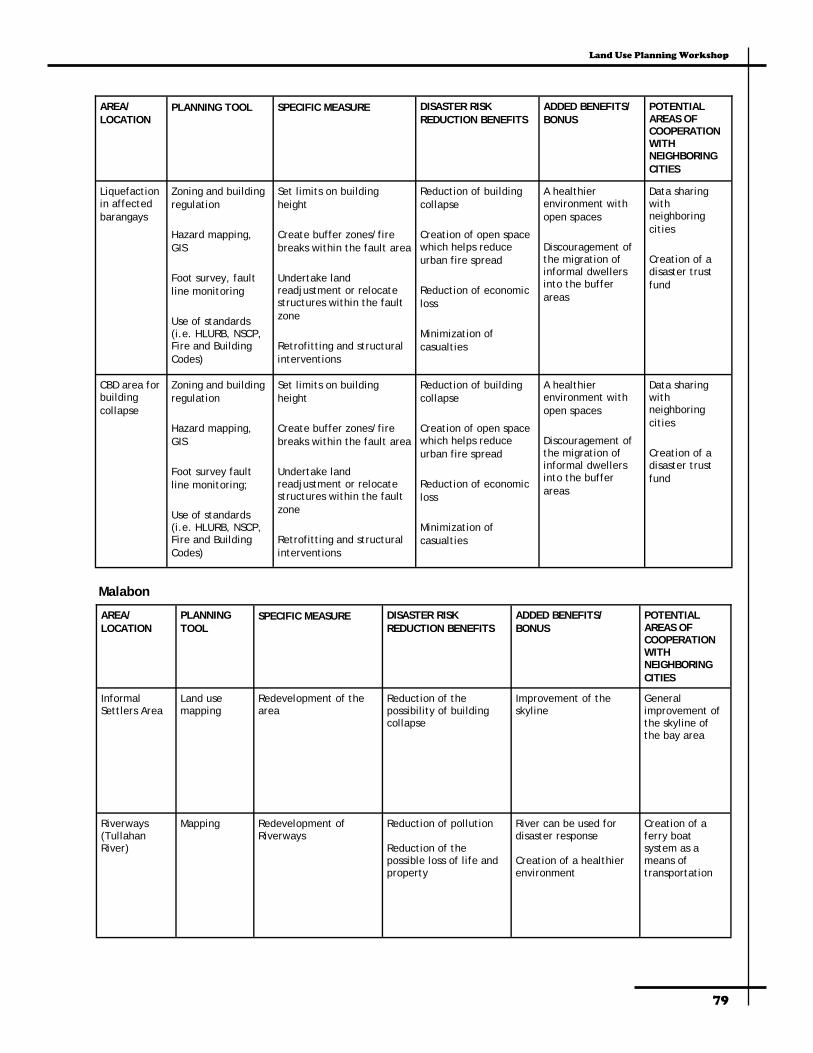
Land Use Planning Workshop
79
CBD area for building collapse
Zoning and building regulation
Hazard mapping, GIS
Foot survey fault line monitoring;
Use of standards (i.e. HLURB, NSCP, Fire and Building Codes)
Set limits on building height
Create buffer zones/fire breaks within the fault area
Undertake land readjustment or relocate structures within the fault zone
Retrofitting and structural interventions
Reduction of building collapse
Creation of open space which helps reduce urban fire spread
Reduction of economic loss
Minimization of casualties
A healthier environment with open spaces
Discouragement of the migration of informal dwellers into the buffer areas
Data sharing with neighboring cities
Creation of a disaster trust fund
Liquefaction in affected barangays
Zoning and building regulation
Hazard mapping, GIS
Foot survey, fault line monitoring
Use of standards (i.e. HLURB, NSCP, Fire and Building Codes)
Set limits on building height
Create buffer zones/fire breaks within the fault area
Undertake land readjustment or relocate structures within the fault zone
Retrofitting and structural interventions
Reduction of building collapse
Creation of open space which helps reduce urban fire spread
Reduction of economic loss
Minimization of casualties
A healthier environment with open spaces
Discouragement of the migration of informal dwellers into the buffer areas
Data sharing with neighboring cities
Creation of a disaster trust fund
AREA/LOCATION
PLANNING TOOL SPECIFIC MEASURE
DISASTER RISK REDUCTION BENEFITS
ADDED BENEFITS/ BONUS
POTENTIAL AREAS OF COOPERATION WITH NEIGHBORING CITIES
AREA/LOCATION
PLANNING TOOL
SPECIFIC MEASURE
DISASTER RISK REDUCTION BENEFITS
ADDED BENEFITS/ BONUS
POTENTIAL AREAS OF COOPERATION WITH NEIGHBORING CITIES
Informal Settlers Area
Land use mapping
Redevelopment of the area
Reduction of the possibility of building collapse
Improvement of the skyline
General improvement of the skyline of the bay area
Riverways (Tullahan River)
Mapping Redevelopment of Riverways
Reduction of pollution Reduction of the possible loss of life and property
River can be used for disaster response Creation of a healthier environment
Creation of a ferry boat system as a means of transportation
Malabon
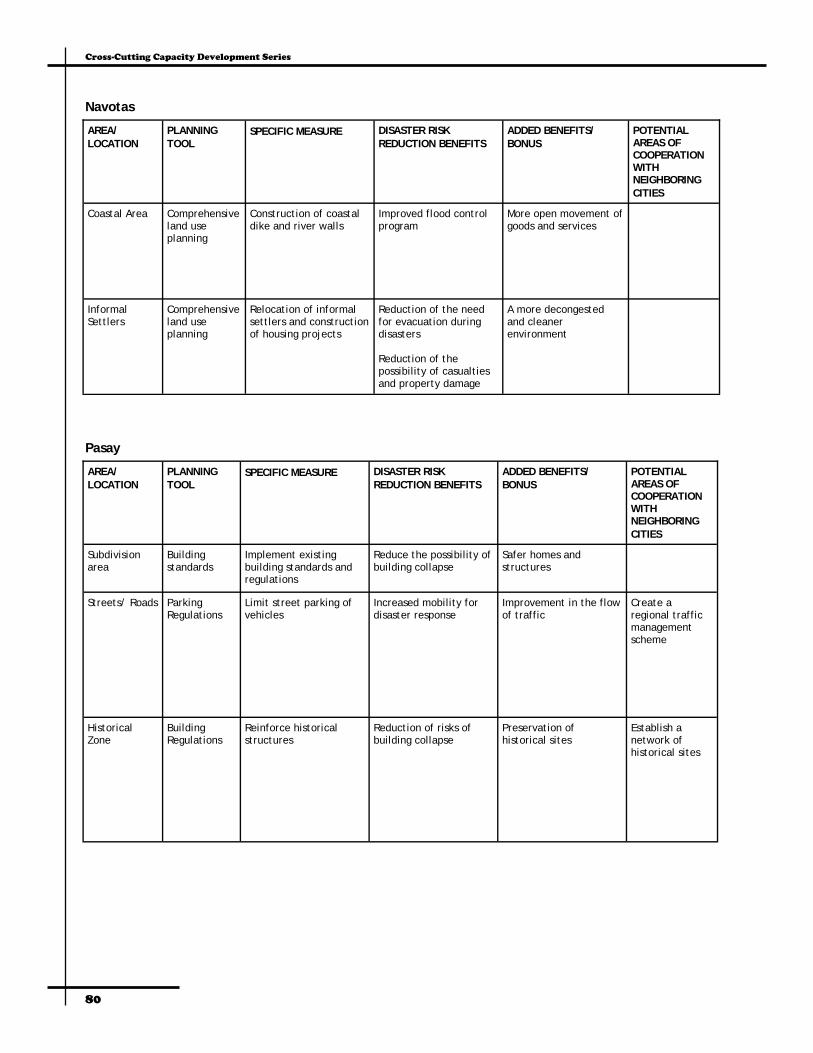
Cross-Cutting Capacity Development Series
80
AREA/LOCATION
PLANNING TOOL
SPECIFIC MEASURE
DISASTER RISK REDUCTION BENEFITS
ADDED BENEFITS/ BONUS
POTENTIAL AREAS OF COOPERATION WITH NEIGHBORING CITIES
Coastal Area Comprehensive land use planning
Construction of coastal dike and river walls
Improved flood control program
More open movement of goods and services
Informal Settlers
Comprehensive land use planning
Relocation of informal settlers and construction of housing projects
Reduction of the need for evacuation during disasters Reduction of the possibility of casualties and property damage
A more decongested and cleaner environment
Navotas
AREA/LOCATION
PLANNING TOOL
SPECIFIC MEASURE
DISASTER RISK REDUCTION BENEFITS
ADDED BENEFITS/ BONUS
POTENTIAL AREAS OF COOPERATION WITH NEIGHBORING CITIES
Subdivision area
Building standards
Implement existing building standards and regulations
Reduce the possibility of building collapse
Safer homes and structures
Streets/ Roads Parking Regulations
Limit street parking of vehicles
Increased mobility for disaster response
Improvement in the flow of traffic
Create a regional traffic management scheme
Historical Zone
Building Regulations
Reinforce historical structures
Reduction of risks of building collapse
Preservation of historical sites
Establish a network of historical sites
Pasay
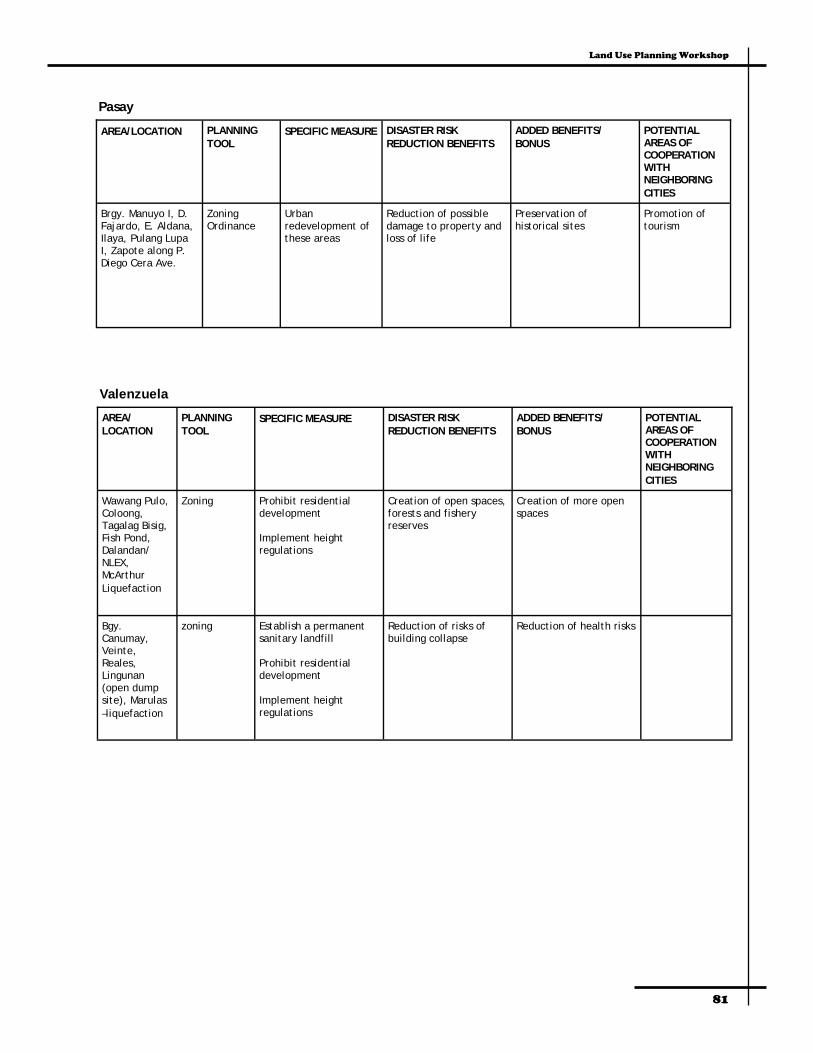
Land Use Planning Workshop
81
AREA/LOCATION PLANNING TOOL
SPECIFIC MEASURE
DISASTER RISK REDUCTION BENEFITS
ADDED BENEFITS/ BONUS
POTENTIAL AREAS OF COOPERATION WITH NEIGHBORING CITIES
Brgy. Manuyo I, D. Fajardo, E. Aldana, Ilaya, Pulang Lupa I, Zapote along P. Diego Cera Ave.
Zoning Ordinance
Urban redevelopment of these areas
Reduction of possible damage to property and loss of life
Preservation of historical sites
Promotion of tourism
Pasay
AREA/LOCATION
PLANNING TOOL
SPECIFIC MEASURE
DISASTER RISK REDUCTION BENEFITS
ADDED BENEFITS/ BONUS
POTENTIAL AREAS OF COOPERATION WITH NEIGHBORING CITIES
Wawang Pulo, Coloong, Tagalag Bisig, Fish Pond, Dalandan/NLEX, McArthur Liquefaction
Zoning Prohibit residential development Implement height regulations
Creation of open spaces, forests and fishery reserves
Creation of more open spaces
Bgy. Canumay, Veinte, Reales, Lingunan (open dump site), Marulas –liquefaction
zoning Establish a permanent sanitary landfill Prohibit residential development Implement height regulations
Reduction of risks of building collapse
Reduction of health risks
Valenzuela
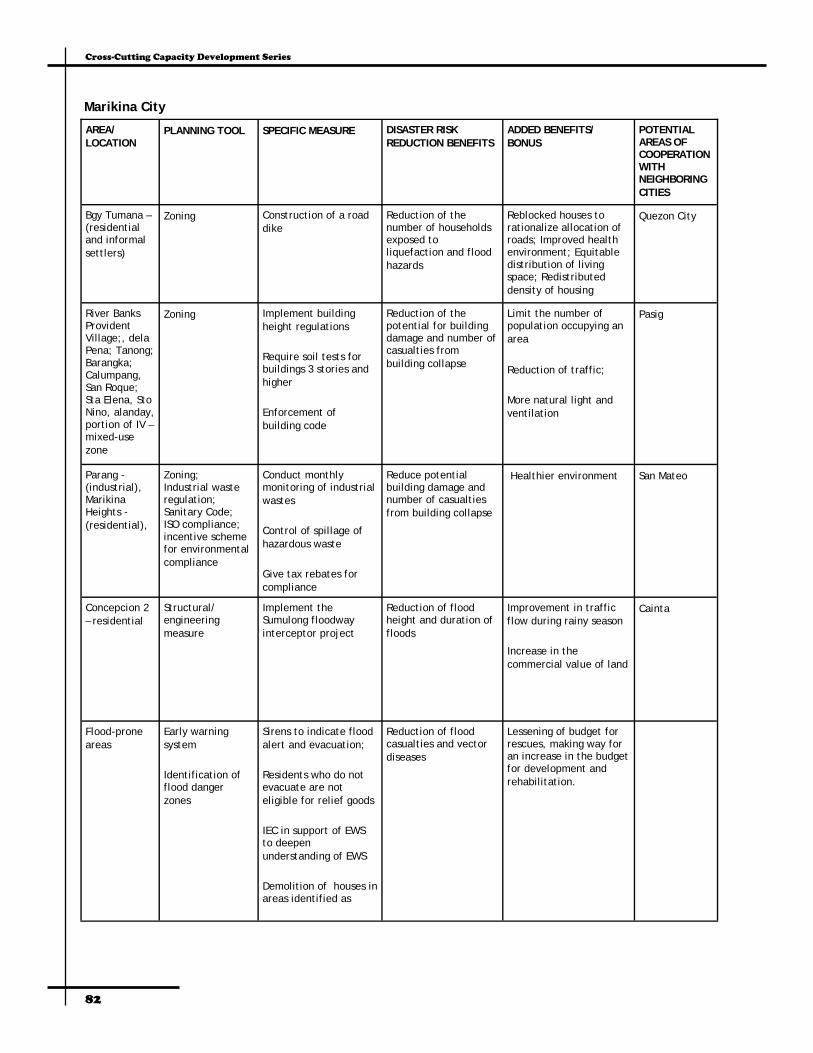
Cross-Cutting Capacity Development Series
82
AREA/LOCATION
PLANNING TOOL SPECIFIC MEASURE
DISASTER RISK REDUCTION BENEFITS
ADDED BENEFITS/ BONUS
POTENTIAL AREAS OF COOPERATION WITH NEIGHBORING CITIES
Bgy Tumana – (residential and informal settlers)
Zoning Construction of a road dike
Reduction of the number of households exposed to liquefaction and flood hazards
Reblocked houses to rationalize allocation of roads; Improved health environment; Equitable distribution of living space; Redistributed density of housing
Quezon City
River Banks Provident Village;, dela Pena; Tanong; Barangka; Calumpang, San Roque; Sta Elena, Sto Nino, alanday, portion of IV – mixed-use zone
Zoning
Implement building height regulations
Require soil tests for buildings 3 stories and higher
Enforcement of building code
Reduction of the potential for building damage and number of casualties from building collapse
Limit the number of population occupying an area
Reduction of traffic;
More natural light and ventilation
Pasig
Parang - (industrial), Marikina Heights - (residential),
Zoning; Industrial waste regulation; Sanitary Code; ISO compliance; incentive scheme for environmental compliance
Conduct monthly monitoring of industrial wastes
Control of spillage of hazardous waste
Give tax rebates for compliance
Reduce potential building damage and number of casualties from building collapse
Healthier environment San Mateo
Concepcion 2 – residential
Structural/ engineering measure
Implement the Sumulong floodway interceptor project
Reduction of flood height and duration of floods
Improvement in traffic flow during rainy season
Increase in the commercial value of land
Cainta
Flood-prone areas
Early warning system
Identification of flood danger zones
Sirens to indicate flood alert and evacuation;
Residents who do not evacuate are not eligible for relief goods
IEC in support of EWS to deepen understanding of EWS
Demolition of houses in areas identified as
Reduction of flood casualties and vector diseases
Lessening of budget for rescues, making way for an increase in the budget for development and rehabilitation.
Marikina City

Land Use Planning Workshop
83
AREA/LOCATION
PLANNING TOOL
SPECIFIC MEASURE
DISASTER RISK REDUCTION BENEFITS
ADDED BENEFITS/ BONUS POTENTIAL AREAS OF COOPERATION WITH NEIGHBORING CITIES
Subdivisions and Open spaces
Zoning Ordinance
PD 957 / BP 220
Implement a mandatory provision of open space as requirement of 30% of land area of a subdivision
Impose 100 sqm. as minimum lot area
Additional open spaces to serve as base for emergency operations and temporary shelters
Additional green space will provide for better absorption of run-off
Additional space for recreation
Improvement of the quality of air
A more decongested and healthy environment
Areas along the Valley Fault System
Zoning Impose a 5-meter buffer zone along both sides of the fault
Employ earthquake insurance for building owners
Reduction in the number of collapsed or damaged building due to ground rupture
Creation of more open spaces
AREA/LOCATION
PLANNING TOOL
SPECIFIC MEASURE
DISASTER RISK REDUCTION BENEFITS
ADDED BENEFITS/ BONUS
POTENTIAL AREAS OF COOPERATION WITH NEIGHBORING
High-population density along Pateros River near the fault line
Zoning GIS Building Code HLURB guidelines Hazard maps
Implement limits on building height and density
Limit the population affected by disasters
Creation of open space
Creation of pedestrian friendly spaces, Pateros River walk
More green spaces
A healthier environment
The Pateros river walk can be a part of the Pasig River rehabilitation program
Flood prone areas
Zoning GIS HLURB guidelines
Construction of a good drainage network system
Reduction in flooding A healthier environment
Pateros City
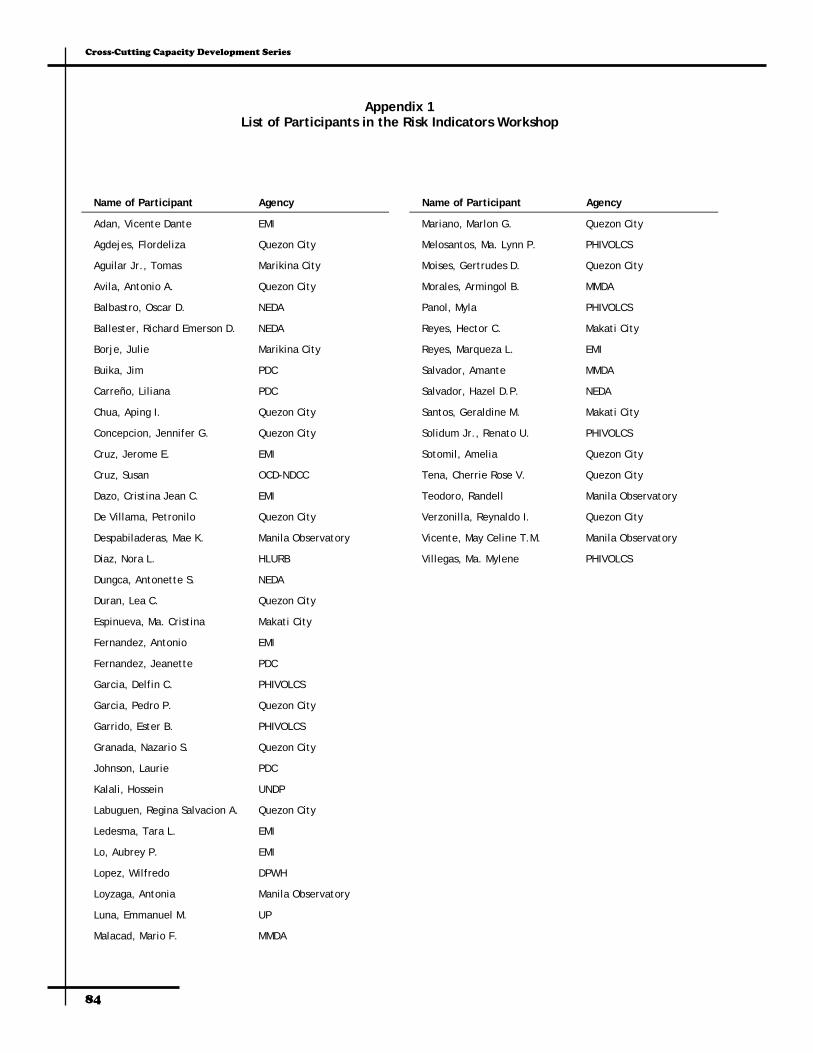
84
Cross-Cutting Capacity Development Series
Appendix 1 List of Participants in the Risk Indicators Workshop
Mariano, Marlon G. Quezon City
Melosantos, Ma. Lynn P. PHIVOLCS
Moises, Gertrudes D. Quezon City
Morales, Armingol B. MMDA
Panol, Myla PHIVOLCS
Reyes, Hector C. Makati City
Reyes, Marqueza L. EMI
Salvador, Amante MMDA
Salvador, Hazel D.P. NEDA
Name of Participant Agency
Santos, Geraldine M. Makati City
Solidum Jr., Renato U. PHIVOLCS
Sotomil, Amelia Quezon City
Tena, Cherrie Rose V. Quezon City
Teodoro, Randell Manila Observatory
Verzonilla, Reynaldo I. Quezon City
Vicente, May Celine T.M. Manila Observatory
Villegas, Ma. Mylene PHIVOLCS
Name of Participant Agency
Adan, Vicente Dante EMI
Agdejes, Flordeliza Quezon City
Aguilar Jr., Tomas Marikina City
Avila, Antonio A. Quezon City
Balbastro, Oscar D. NEDA
Ballester, Richard Emerson D. NEDA
Borje, Julie Marikina City
Buika, Jim PDC
Carreño, Liliana PDC
Chua, Aping I. Quezon City
Concepcion, Jennifer G. Quezon City
Cruz, Jerome E. EMI
Cruz, Susan OCD-NDCC
Dazo, Cristina Jean C. EMI
De Villama, Petronilo Quezon City
Despabiladeras, Mae K. Manila Observatory
Diaz, Nora L. HLURB
Dungca, Antonette S. NEDA
Duran, Lea C. Quezon City
Espinueva, Ma. Cristina Makati City
Fernandez, Antonio EMI
Fernandez, Jeanette PDC
Garcia, Delfin C. PHIVOLCS
Garcia, Pedro P. Quezon City
Garrido, Ester B. PHIVOLCS
Granada, Nazario S. Quezon City
Johnson, Laurie PDC
Kalali, Hossein UNDP
Labuguen, Regina Salvacion A. Quezon City
Ledesma, Tara L. EMI
Lo, Aubrey P. EMI
Lopez, Wilfredo DPWH
Loyzaga, Antonia Manila Observatory
Luna, Emmanuel M. UP
Malacad, Mario F. MMDA

85
3cd Program—DRMMP Implementation in Metro Manila
List of Participants in the Land Use Planning Workshop
Name of Participant Agency
Adan, Vicente EMI
Aguilar, Arman Las Piñas City
Alampay, Ma. Lourdes B. PIEP
Alegre, Lenie D. OCD-NDCC
Andaleon, Mildred P. Muntinlupa City
Angeles, Fortunato SJ. Valenzuela
Barnaby, John Michael L. Makati City
Campaner, Marlou B. Manila City
Castillo, Ma. Teresa Pasay City
Comandao, Arman Mandaluyong City
Concepcion, Rodolfo Pasig City
Concepcion, Jennifer S. Quezon City
Conda, Edna I. OCD-NDCC
Cordero, Rolando L. Caloocan City
Cruz, Jeanette E. PIEP
Cruz, Jerome E. EMI
Cruz, Nicasio A. Marikina City
Cruz, Tomasito L. Quezon City
Dazo, Cristina Jean C. EMI
De Guzman, Arnelord Caloocan City
De la Cruz, Ma. Cristina A. HLURB
Del Rosario, Marilou PHIVOLCS
Diaz, Nora L. HLURB
Encarnacion, Annie PHIVOLCS
Fernandez, Antonio EMI
Flores, Ronaldo A. Malabon City
Garrido, Ester B. PHIVOLCS
Gasilao, Susan S. Mandaluyong City
Himala, Jonathan T. Caloocan City
Jose, Susan Rachel G. NEDA
Lamela, Ruben PHIVOLCS
Lo, Aubrey P. EMI
Lopez, Wilfredo DPWH
Loyzaga, Antonia Manila Observatory
Lucas, Shereen Y. OCD-NDCC
Maghacot, Jr. Pacifico F. Quezon City
Mallorca, Rachel NEDA
Mamaradlo, Marivic Muntinlupa City
Mariano, Marlon G. Quezon City
Mateo, Felipe R. Navotas
Melosantos, Ma. Lynn P. PHIVOLCS
Moises, Gertrudes D. Quezon City
Ortiz, Arlene P. Pateros
Pagtalunan, Melcario PHIVOLCS
Panol, Myla PHIVOLCS
Pascual, Alfred E. Las Piñas City
Ponce, Angelus Pateros
Quijano, Ruel PHIVOLCS
Reyes, Hector C. Makati City
Reyes, Marqueza L. EMI
Robas, Homer C. Manila City
Roberto, Inenila S. Manila Observatory
Robiso, Achilles L. Pasay City
Salvador, Hazel D.P. NEDA
Santos, Geraldine Makati City
Sese, William NEDA
Sioson, Lloyd A. HLURB
Solidum, Jr., Renato U. PHIVOLCS
Tan, Marie Angelie P. Marikina City
Tena, Cherrie Rose V. Quezon City
Vicente, May Celine T.M. Manila Observatory
Villegas, Ma. Mylene PHIVOLCS
Name of Participant Agency
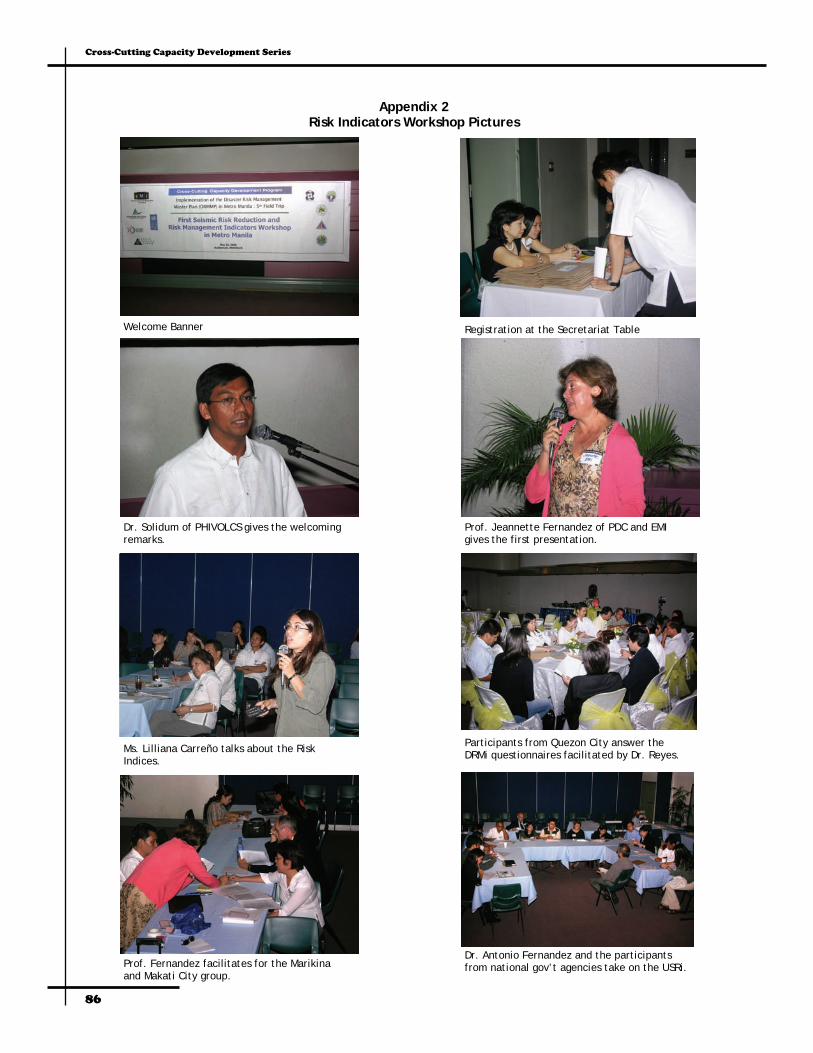
86
Cross-Cutting Capacity Development Series
Appendix 2 Risk Indicators Workshop Pictures
Registration at the Secretariat Table
Dr. Solidum of PHIVOLCS gives the welcoming remarks.
Prof. Jeannette Fernandez of PDC and EMI gives the first presentation.
Ms. Lilliana Carreño talks about the Risk Indices.
Participants from Quezon City answer the DRMi questionnaires facilitated by Dr. Reyes.
Prof. Fernandez facilitates for the Marikina and Makati City group.
Dr. Antonio Fernandez and the participants from national gov’t agencies take on the USRi.
Welcome Banner

87
3cd Program—DRMMP Implementation in Metro Manila
Land Use Planning Workshop Pictures
Dr. Marqueza Reyes talking about the Focus Group 2. Ms. Laurie Johnson giving her presentation on Land Use Planning
Participants break into groups to work on their institutional assessments.
Participants from Makati, Pateros, and Muntinlupa busy with the workshop.
Ms. Malou Alampay of SURP and PIEP presenting the workshop results of Marikina.
Ms. Jeanette Cruz of PIEP show the products of QC, Caloocan, Mandaluyong, and Valenzuela.
Ms. Tess Castillo of Pasay present their workshop output.
Ms. Cherrie Tena of QC taking part in the Q&A session.

88
Cross-Cutting Capacity Development Series
Participants of the Land Use Planning Workshop.
Guests and Speakers (from left): Dr. Antonio Fernandez (EMI), Prof. Jeannette Fernandez (EMI & PDC), Ms. Liliana Carreño (CIMNE-Technical University of Catalonia), Dr. Renato Solidum (PHIVOLCS & EMI), Mr. Hossein Kalali (UNDP), Ms. Laurie Johnson (AICP), Dr. Marqueza Reyes (EMI), and Mr. Jim Buika (PDC).
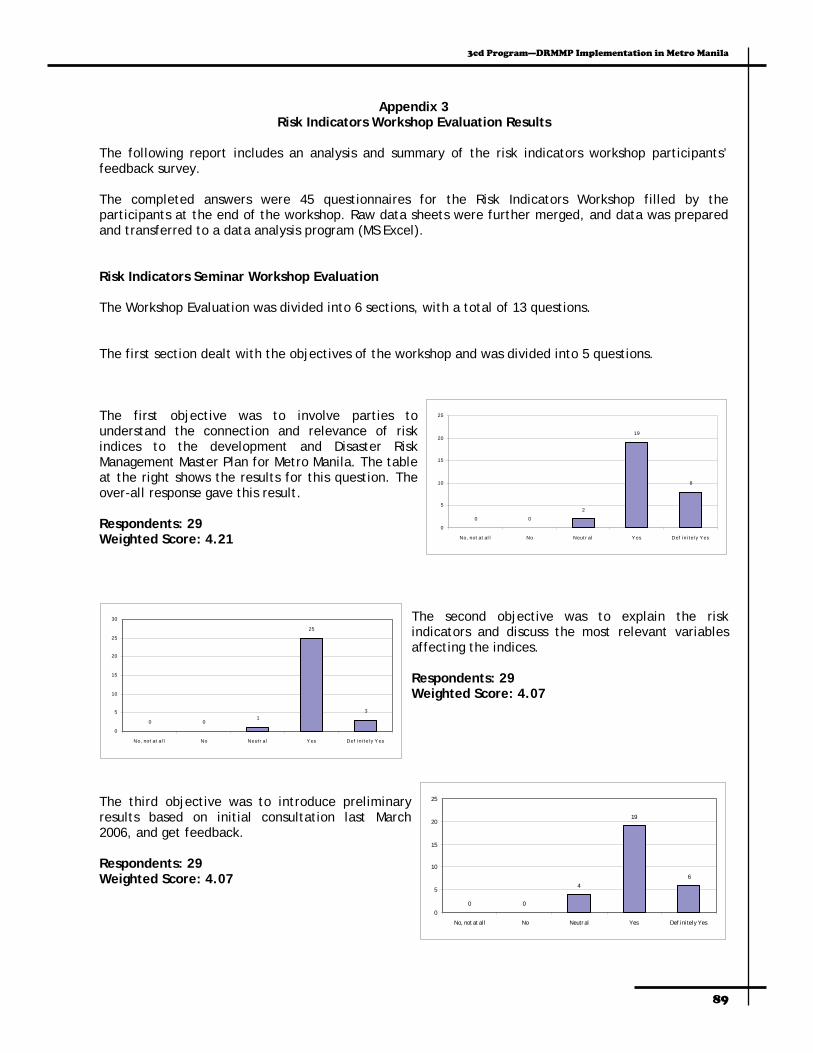
89
3cd Program—DRMMP Implementation in Metro Manila
Appendix 3 Risk Indicators Workshop Evaluation Results
The following report includes an analysis and summary of the risk indicators workshop participants’ feedback survey. The completed answers were 45 questionnaires for the Risk Indicators Workshop filled by the participants at the end of the workshop. Raw data sheets were further merged, and data was prepared and transferred to a data analysis program (MS Excel). Risk Indicators Seminar Workshop Evaluation The Workshop Evaluation was divided into 6 sections, with a total of 13 questions. The first section dealt with the objectives of the workshop and was divided into 5 questions. The first objective was to involve parties to understand the connection and relevance of risk indices to the development and Disaster Risk Management Master Plan for Metro Manila. The table at the right shows the results for this question. The over-all response gave this result. Respondents: 29 Weighted Score: 4.21
The second objective was to explain the risk indicators and discuss the most relevant variables affecting the indices. Respondents: 29 Weighted Score: 4.07
The third objective was to introduce preliminary results based on initial consultation last March 2006, and get feedback. Respondents: 29 Weighted Score: 4.07
0 0
2
19
8
0
5
10
15
20
25
No, not at al l No Neut r al Yes Def i ni tel y Yes
0 01
25
3
0
5
10
15
20
25
30
No, not at al l No Neut r al Yes Def i ni tel y Yes
0 0
4
19
6
0
5
10
15
20
25
No, not at al l No Neutr al Yes Def ini tely Yes

90
Cross-Cutting Capacity Development Series
The fourth objective was to gain additional input for missing information and proxy indicators. Respondents: 29 Weighted Score: 3.86
The fifth and last objective was to engage the pilot cities of Makati, Marikina, and Quezon City in an independent evaluation of their own disaster risk management. Respondents: 29 Weighted Score: 4.28
The next area for evaluation was whether the objectives of the seminar were clear and realistic. Respondents: 29 Weighted Score: 4.17
The next subject of evaluation was whether the participants were satisfied with the presentations. Respondents: 29 Weighted Score: 4.00
The next part of the evaluation asked the participants if they were satisfied with the small group discussions. Respondents: 29 Weighted Score: 4.28
0 0
4
13 12
0
5
10
15
20
25
No, not at al l No Neutr al Yes Def ini tely Yes
0 02
20
7
0
5
10
15
20
25
No, not at al l No Neutr al Yes Def ini tely Yes
0 0
5
19
5
0
5
10
15
20
25
No, not at al l No Neutr al Yes Def ini tely Yes
0 02
17
10
0
5
10
15
20
25
No, not at al l No Neutr al Yes Def ini tely Yes
0 0
7
19
3
0
5
10
15
20
25
No, not at all No Neutral Yes Definitely Yes

91
3cd Program—DRMMP Implementation in Metro Manila
The subsequent item shows the results of the participants’ response to the question: Were the duration and scheduling of the different activities satisfactory? Respondents: 29 Weighted Score: 4.17
The Sixth part of the evaluation was divided into four questions. The first inquiry asked the participants if their participation was worthwhile for them personally. Respondents: 28 Weighted Score: 4.50
The next question dealt with whether the participants’ involvement in the workshop was worthwhile for their respective institutions. Respondents: 28 Weighted Score: 4.54
They were next asked if the seminar-workshop was relevant to their respective line of work. Respondents: 28 Weighted Score: 4.36
The last question asked the participants whether they would plan to work together towards the adoption and use of risk indices. Respondents: 28 Weighted Score: 4.32
0 02
20
7
0
5
10
15
20
25
No, not at al l No Neutr al Yes Def ini tely Yes
0 0 0
14 14
0
5
10
15
20
25
No, not at al l No Neutr al Yes Def ini tely Yes
0 0 0
1315
0
5
10
15
20
25
No, not at al l No Neutr al Yes Def ini tely Yes
0 01
16
11
0
5
10
15
20
25
No, not at al l No Neutr al Yes Def ini tely Yes
0 01
17
10
0
5
10
15
20
25
No, not at al l No Neutr al Yes Def ini tely Yes

92
Cross-Cutting Capacity Development Series
The following statements were comments made by the participants and specific topics they suggested that could be discussed. Comments • Excellent education and training tool. • A much more holistic approach than U.S. focus on hazard mitigation. • I hope (for) follow-up activities to process and integrate the information gathered today to further
enhance the capability and capacity of all disaster risk management related agencies and LGUs. • Personally inform the participants in advance the schedule of your activities for participation. • Request for copies of powerpoint presentation. Kindly send by email if possible. • Hoping to give me a report or preliminary reports from the workshop/seminar. • Please send 3cd program and MIS presentation of Prof. Jeannette Fernandez through email. • I would like to have a copy of the methodology. For future reference. Specific Topics • Mainstreaming of DRM in land use planning. It is very relevant to my function as planning officer. • On the rehabilitation (???) specially the lifelines. Very important to facilitate recovery of areas
affected. • Other related studies and concerns on risk management. The seminar workshop was well organized,
congratulations. • Seismic Risk, seismology or other risks involved with earthquakes. Primary interest in seismic
hazards and risks involved (earthquakes, tsunamis, etc.) • Some report of mention of buy-in or acceptance of partner pilot LGU. To give some sense that
something is accomplished in terms of acceptance. • USRi, because I’m very interested in seismic topics. • The Risk Management Plans completed by QC, Marikina, and Makati using DRMi Techniques. They can
possibly (be) replicated in the urban areas of the Provinces of Pampanga and Bulacan.

93
3cd Program—DRMMP Implementation in Metro Manila
Land Use Planning Workshop Evaluation Results
A total of 22 participants answered the evaluation forms of the land use planning workshop. These were encoded and analyzed through a data analysis program (MS Excel). The following graphs give a visual representation of the response of the participants towards the workshop.
The participants were first asked if the objectives of the workshop were clear and realistic. Respondents: 22 Weighted Score: 4.36
They were then asked if they were satisfied with the presentations of the speakers. Respondents:22 Weighted Score: 4.32
With the next question, of whether they were satisfied with the small group discussions, the participants gave this reply. Respondents: 22 Weighted Score: 4.27
Were the duration and scheduling of different activities satisfactory to the preference of the participants? Respondents: 22 Weighted Score:4.05
1
12
9
0
5
10
15
20
25
Not at al l No Neutr al Yes Def ini tely Yes
0 01
13
8
0
5
10
15
20
25
Not at al l No Neutr al Yes Def ini tely Yes
0 0
3
109
0
5
10
15
20
25
Not at al l No Neutr al Yes Def ini tely Yes
0 0
5
11
6
0
5
10
15
20
25
Not at al l No Neutr al Yes Def ini tely Yes

94
Cross-Cutting Capacity Development Series
The next part of the evaluation was divided into four questions dealing with the participants’ overall conclusion on the workshop. My participation in the seminar-workshop was worthwhile for me, personally. Respondents: 22 Weighted Score: 4.41
My participation in the seminar-workshop was worthwhile for my institution. Respondents: 22 Weighted Score: 4.41
This seminar-workshop was relevant to my work. Respondents: 22 Weighted Score: 4.36
Lastly, they were asked if they would plan to work together towards the adoption and use of risk reduction. Respondents: 21 Weighted Score: 4.57
0 0 0
13
9
0
5
10
15
20
25
Not at al l No Neutr al Yes Def ini tely Yes
0 0 1
12
9
0
5
10
15
20
25
Not at al l No Neutr al Yes Def ini tely Yes
0 0 0
9
12
0
5
10
15
2 0
2 5
Not at all No Neut r al Yes Def in it ely Yes
0 0
13
9
0
5
10
15
20
25
Not at al l No Neutr al Yes Def ini tely Yes


About the 3cd Program
The Cross-Cutting Capacity Development (3cd) Program is EMI’s long-term, interdisciplinary program aimed at assisting cities to implement sound practices for disaster risk management. It is a collaborative effort that involves shifting the current disaster management processes of local governments in developing countries from a response orientation to one of mitigation by influencing government policies to favor disaster reduction and by enhancing the capacity of local stakeholders in implementing sustainable risk management policies and actions.