copyright © 2011 pearson prentice hall. all rights reserved. chapter 6 common stocks
TRANSCRIPT

Copyright © 2011 Pearson Prentice Hall. All rights reserved.
Chapter 6
Common Stocks

Copyright © 2011 Pearson Prentice Hall. All rights reserved.6-2
Common Stocks
• Learning Goals
1. Explain the investment appeal of common stocks and why individuals like to invest in them.
2. Describe stock returns from a historical perspective and understand how current returns measure up to historical standards of performance.
3. Discuss the basic features of common stocks, including issue characteristics, stock quotations, and transaction costs.

Copyright © 2011 Pearson Prentice Hall. All rights reserved.6-3
Common Stocks
• Learning Goals (cont’d)
4. Understand the different kinds of common stock values.
5. Discuss common stock dividends, types of dividends, and dividend reinvestment plans.
6. Describe various types of common stocks, including foreign stocks, and note how stocks can be used as investment vehicles.

Copyright © 2011 Pearson Prentice Hall. All rights reserved.6-4
The Appeal of Common Stocks
• Residual Owners: stockholders of a firm are the owners, who are entitled to dividend income and a prorated share of the firm’s earnings only after all the firm’s other obligations have been met
– Stocks allow investors to tailor investments to meet individual needs and preferences
– Stocks may provide a steady stream of current income through dividends
– Stocks may increase in value over time through capital gains

Copyright © 2011 Pearson Prentice Hall. All rights reserved.6-5
Sometimes You Win, Sometimes You Lose: Five years of the S&P 500 Index and the Nasdaq Composite
FIGURE 6.1 A Snapshot of U.S. Stock and Housing Indexes (mid-2003 through mid-2009)

Copyright © 2011 Pearson Prentice Hall. All rights reserved.6-6
Table 6.1 Historical Returns on the S&P 500 Index (1950-2008)

Copyright © 2011 Pearson Prentice Hall. All rights reserved.6-7
From Stock Prices to Stock Returns
• Stock Returns: take into account both price changes and dividend income
– Returns from capital gains range from an average of 15.3% during the 1990s to -5.3% from 2000–2008
– Returns from dividends vary too, but not nearly as much, ranging from 5.4% in the 1950s to 1.7% since 2000
– The big returns (or losses) come from capital gains

Copyright © 2011 Pearson Prentice Hall. All rights reserved.6-8
From Stock Prices to Stock Returns (cont’d)
– Stocks generally earn positive returns over long periods of time.
– From 1950–2000, the average total return on the S&P 500 was 13.7% per year
– Investing in stocks is clearly not without risk
– From 2000–2008, the U.S. stock market lost 3.6% per year

Copyright © 2011 Pearson Prentice Hall. All rights reserved.6-9
What is a Bear Market?
• Routine Decline: a drop of 5% or more in one of the major market indexes, like the Dow Jones Industrial Average (DJIA)
• Correction: a drop of 10% or more in one of the major market indexes
• Bear Market: a drop of 20% or more in one of the major market indexes

Copyright © 2011 Pearson Prentice Hall. All rights reserved.6-10
Advantages of Stock Ownership
• Provide opportunity for higher returns than other investments
• Over past 100 years, stocks earned annual returns that we roughly double the returns provided by corporate bonds
• Good inflation hedge since returns typically exceed the rate of inflation
• Easy to buy and sell stocks• Price and market information is easy to find in financial
media• Unit cost per share of stock is low enough to encourage
ownership

Copyright © 2011 Pearson Prentice Hall. All rights reserved.6-11
Disadvantages of Stock Ownership
• Stocks are subject to many different kinds of risk:– Business risk– Financial risk– Purchasing power risk– Market risk– Event risk
• Hard to predict which stocks will go up in value due to wide swings in profits and general stock market performance
• Low current income compared to other investment alternatives

Copyright © 2011 Pearson Prentice Hall. All rights reserved.6-12
Figure 6.2 The Current Income of Stocks and Bonds

Copyright © 2011 Pearson Prentice Hall. All rights reserved.6-13
Basic Characteristics of Common Stock
• Equity Capital: evidence of ownership position in a firm, in the form of shares of common stock. This is why stocks are sometimes called “equities”. Common stocks has no maturity date- it remains outstanding indefinitely
• Publicly Traded Issues: shares of stock that are readily available to the general market and are bought and sold in the open market
• Public Offering: an offering to sell to the investing public a set number of shares of a firm’s stock at a specified price

Copyright © 2011 Pearson Prentice Hall. All rights reserved.6-14
Figure 6.3 An Announcement of a New Stock Issue

Copyright © 2011 Pearson Prentice Hall. All rights reserved.6-15
Basic Characteristics of Common Stock (cont’d)
• Rights Offering: an offering of a new issue of stock to existing stockholders, who may purchase new shares in proportion to their current ownership
• Stock Spin-Off: conversion of one of a firm’s subsidiaries to a stand-alone company by distribution of stock in the new company to existing shareholders
• Companies execute spin off if they believe the subsidiary is no longer a good fit or if they feel that they became so diversified and want to focus more on their core products.

Copyright © 2011 Pearson Prentice Hall. All rights reserved.6-16
Basic Characteristics of Common Stock (cont’d)
• Stock Split: when a company increases the number of shares outstanding by exchanging a specified number of new shares of stock for each outstanding share– Usually done to lower the stock price to make it more
attractive to investors– Stockholders end up with more shares of stock that
sells for a lower price– Investor with 200 shares in a 2-for-1 stock split would
have 400 shares after the stock split– If the stock price was $100 before the split, the price
would be near $50 after the split

Copyright © 2011 Pearson Prentice Hall. All rights reserved.6-17
Basic Characteristics of Common Stock (cont’d)
• Treasury Stock: shares of stock that were originally sold by the company and have been repurchased by the company. Share repurchases are often called “buybacks.”– Reduces the number of shares outstanding to public
– Companies buyback when they believe stock is undervalued and a good buy
– Companies may try to raise undervalued stock price or prop up overvalued stock price
– May be used for mergers, acquisitions or employee stock option plans

Copyright © 2011 Pearson Prentice Hall. All rights reserved.6-18
Basic Characteristics of Common Stock (cont’d)
• Classified Common Stock: common stock issued in different classes, each of which offers different privileges and benefits to its holders
– Different shares may have different voting rights
– Often used to allow a relatively small group to control the voting of a publicly-trade company
– Ford family owns “B” shares and other investors own “A” shares; Ford family controls 40% of Ford Motor Company
– May have different dividend payout schedules

Copyright © 2011 Pearson Prentice Hall. All rights reserved.6-19
Figure 6.4 Stock Quotations

Copyright © 2011 Pearson Prentice Hall. All rights reserved.6-20
Watch Those Transaction Costs
• Round-Lot: buying 100 shares of stock or multiples of 100 shares
• Odd-Lot: buying less than 100 shares of stock– Buying odd lots or small numbers of shares can result
in higher costs to buy and sell shares– Frequent trading can increase transactions
costs substantially , higher fees are connected with the purchase or sale of odd lot, which requires a specialist known as odd-lot leader.

Copyright © 2011 Pearson Prentice Hall. All rights reserved.6-21
Common Stock Values
• Par Value: the stated, or face, value of a stock– Mainly an accounting term and not very useful to investors
• Book Value: the amount of stockholders’ equity– The difference between the company’s assets minus the
company’s liabilities and preferred stock
• Market Value: the current price of the stock in the stock market

Copyright © 2011 Pearson Prentice Hall. All rights reserved.6-22
Common Stock Values
• Market Capitalization: the overall current value of the company in the stock market – Total number of shares outstanding multiplied by the market
value per share
• Investment Value: the amount that investors believe the stock should be trading for, or what they think it’s worth– Probably the most important measure for a stockholder

Copyright © 2011 Pearson Prentice Hall. All rights reserved.6-23
Dividends
• Dividend income is one of the two basic sources of return to investors
• Dividend income is more predictable than capital gains, so preferred by investors seeking lower risk
• Dividends are taxed at maximum 15% tax rate, same as capital gains
• Dividends tend to increase over time as companies’ earnings grow; average annual increase around 3% to 5%
• Dividends represent the return of part of the profit of the company to the owners, the stockholders

Copyright © 2011 Pearson Prentice Hall. All rights reserved.6-24
The dividend decision• By paying dividends, companies share with their
stockholders some of the profits they have earned.• A firm board of directors decide how much to pay in
dividends.• The directors evaluate the firm’s operating results
and financial conditions to determine whether dividends should be paid and if so , what amount..
• They consider whether the firm should distribute some of its cash to investors by paying a dividend or by buying back

Copyright © 2011 Pearson Prentice Hall. All rights reserved.6-25
Corporate versus market factors
• When the board of directors assembles to consider the question of paying dividends, it weights a variety of factors.
• The directors look at the firm’s earnings. Even though a company doesn’t have to show a profit to pay dividends, profits are still considered a vital link in the dividend decision

Copyright © 2011 Pearson Prentice Hall. All rights reserved.6-26
Dividends and Earnings Per Share
• Earnings Per Share: the amount of annual earnings available to common stockholders, stated on a per-share basis– Earnings are important to stock price– Earnings help determine dividend payouts

Copyright © 2011 Pearson Prentice Hall. All rights reserved.6-27
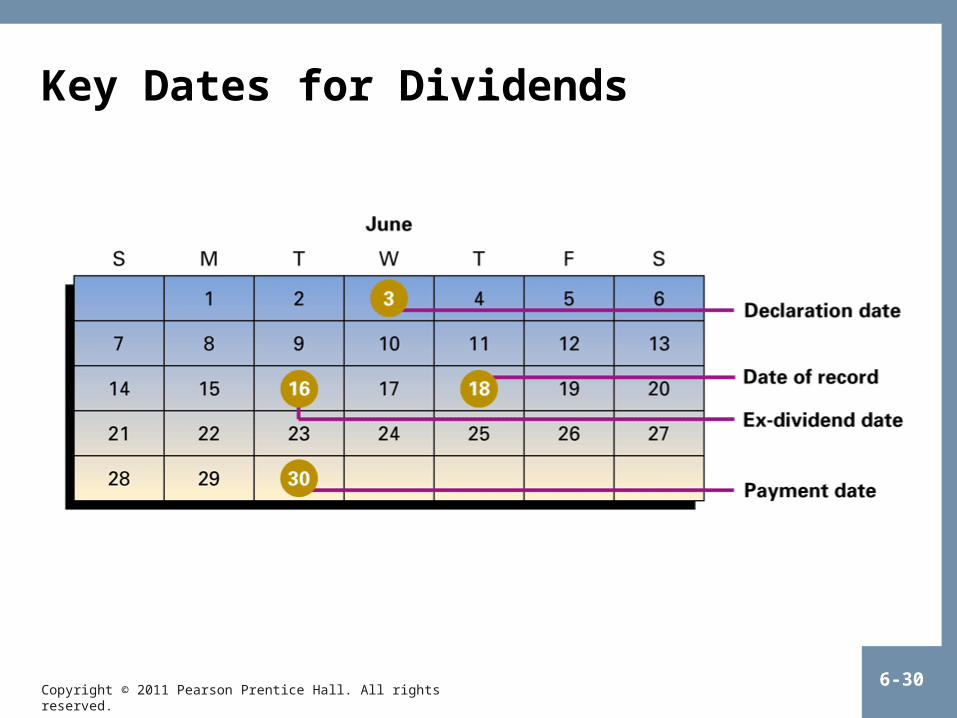
Some important dates• Lets assume the directors decide to declare a
dividend• Once that’s done, they must indicate the date of
payment and other important dates• Three dates are particularly important to the
stockholder• Date of record, payment date, and ex-dividend
date• The date of record: is the date on which the
investor must be a registered shareholder of the firm to be entitled to a dividend

Copyright © 2011 Pearson Prentice Hall. All rights reserved.6-28
Some important dates
• All investors who are official stockholders as of the close of business on that day will receive the dividends that have just been declared.
• These stockholders are often referred to as holders of record.
• The payment date: also set by the board of directors, follows the date of record by a week or two. It’s the actual date on which the company will mail dividend checks to holders of record ( and is also known as the payable date)

Copyright © 2011 Pearson Prentice Hall. All rights reserved.6-29
Some important dates• Because of the time needed to make bookkeeping
entries after the stock is traded. The stock will sell without dividends for three business days up to and including the date of record.
• The reason is that the buyer of the stock wont have held the stock on the date of record. Instead you ( the seller) will still be the holder of the record.
• The opposite will occur if you sell the stock before the ex-dividend date, the new shareholders will receive the dividend because he will be the holder of record
Copyright © 2011 Pearson Prentice Hall. All rights reserved.6-30
Key Dates for Dividends

Copyright © 2011 Pearson Prentice Hall. All rights reserved.6-31
Dividends and Dividend Yield
• Dividend Yield: a measure to relate dividends to share price on a percentage basis– Indicates the rate of current income earned on the investment
dollar– Convenient method to compare income return to other
investment alternatives

Copyright © 2011 Pearson Prentice Hall. All rights reserved.6-32
Dividends and Dividend Payout Ratio
• Dividend Payout Ratio: the portion of earnings per share (EPS) that a firm pays out as dividends– Companies are not required to pay dividends– Some companies have high EPS, but reinvest all
money back into company

Copyright © 2011 Pearson Prentice Hall. All rights reserved.6-33
Other Dividend Characteristics
• Stock Dividend: payment of a dividend in the form of additional shares of stock
• Dividend Reinvestment Plans (DRIPs): plans where cash dividends are automatically reinvested into additional shares of the firm’s common stock– Over 1,000 companies offer DRIPs– Usually have no brokerage fees– Uses dollar-cost averaging
Copyright © 2011 Pearson Prentice Hall. All rights reserved.6-34
Types of Stock
• Blue Chip Stocks: financially strong, high-quality stocks with long and stable records of earnings and dividends– Companies are leaders in their industries– Relatively lower risk due to financial stability
of company– Popular with investing public looking for steady growth
potential, perhaps dividend income– Provide shelter during unsettled markets– Examples: AT&T, Chevron, Johnson & Johnson,
McDonald’s, Pfizer

Copyright © 2011 Pearson Prentice Hall. All rights reserved.6-35
Figure 6.5 A Blue-Chip Stock

Copyright © 2011 Pearson Prentice Hall. All rights reserved.6-36
Types of Stock (cont’d)
• Income Stocks: stocks with long and sustained records of paying higher-than average dividends– Good for investors looking for relatively safe and high level of
current income– Dividends tend to increase over time (unlike interest payments on
bonds)– Some companies pay high dividends because they offer limited
growth potential– More subject to interest rate risk– Examples: Duke Energy, Conagra Foods, Sara Lee, Altria Group

Copyright © 2011 Pearson Prentice Hall. All rights reserved.6-37
Types of Stock (cont’d)
• Growth Stocks: stocks that experience high rates of growth in operations and earnings– Have sustained rate of growth in earnings above general
market– Investors expect higher price appreciation due to increasing
earnings– Riskier investment because price may fall if earnings growth
cannot be maintained– May include blue chip stocks as well as
speculative stocks– Typically pay little or no dividends– Examples: Netflix, eBay, Research in Motion, Berkshire Hathaway,
Starbucks

Copyright © 2011 Pearson Prentice Hall. All rights reserved.6-38
Types of Stock (cont’d)
• Tech Stocks: stocks representing the technology sector of the market– Range from speculative stocks of small companies that have
never shown a profit to blue chip stocks of large companies that are growth-oriented
– Potential for attractive returns
– Considerable risk and volatility
– Difficult to put value on due to erratic or no earnings
– Examples: Microsoft, Cisco Systems, Yahoo!, NVIDIA, SanDisk, Electronic Arts

Copyright © 2011 Pearson Prentice Hall. All rights reserved.6-39
Figure 6.6 A Tech Stock

Copyright © 2011 Pearson Prentice Hall. All rights reserved.6-40
Types of Stock (cont’d)
• Speculative Stocks: stocks that offer potential for substantial price appreciation, usually due to some special situation such as a new product– Companies lack sustained track record of business and financial
success– Earnings may be uncertain or highly unstable– Potential for substantial price appreciation– Stock price subject to wide swings up and down in value– Examples: Sirius XM Radio, Dreamworks Animation, Liberty Media,
NitroMed, Under Armour

Copyright © 2011 Pearson Prentice Hall. All rights reserved.6-41
Types of Stock (cont’d)
• Cyclical Stocks: stocks whose earnings and overall market performance are closely linked to the general state of the economy– Stock price tends to move up and down with the
business cycle– Tend to do well when economy is growing, especially in
early stages of economic recovery– Tend to do poorly in slowing economy– Best for investors willing to move in and out of market
as economy changes– Examples: Alcoa, Caterpillar, Genuine Parts, Lennar,
Brunswick, Timken

Copyright © 2011 Pearson Prentice Hall. All rights reserved.6-42
Types of Stock (cont’d)
• Defensive Stocks: stocks that tend to hold their value, and even do well, when the economy starts to falter– Stock price remains stable or increases when general economy is
slowing– Products are staples that people use in good times and bad times,
such as electricity, beverages, foods and drugs– Gold stocks are a form of defensive stock– Best for aggressive investors looking for “parking place” during
slow economy– Examples: Walmart, Checkpoint Systems, WD-40

Copyright © 2011 Pearson Prentice Hall. All rights reserved.6-43
Market Capitalization
• U.S. stock market segments based on stock market capitalization:
– Small-Cap Stocks: less than $2 billion
– Mid-Cap Stocks: $2 billion to $10 billion
– Large-Cap Stocks: more than $10 billion

Copyright © 2011 Pearson Prentice Hall. All rights reserved.6-44
Types of Stock (cont’d)
• Large-Cap Stocks: large companies with market capitalizations over $10 billion– Number of companies is smaller, but account for 80% to 90% of
the total market value of all U.S. equities
– Bigger is not necessarily better
– Tend to lag behind small-cap and mid-cap stocks, but typically have less volatility
– Examples: Walmart, Home Depot, Comcast, Microsoft

Copyright © 2011 Pearson Prentice Hall. All rights reserved.6-45
Types of Stock (cont’d)
• Mid-Cap Stocks: medium-sized companies with market capitalizations between $2 billion and $10 billion– Provide opportunity for greater capital appreciation than Large-
Cap stocks, but less price volatility than Small-Cap stocks– Usually have long-term track records for profits and stock
valuation– “Baby Blues” offer same characteristics of Blue Chip stocks
except size– Examples: Abercrombie & Fitch, Dollar Tree, Hasbro, Nordstrom,
Whole Foods

Copyright © 2011 Pearson Prentice Hall. All rights reserved.6-46
Types of Stock (cont’d)
• Small-Cap Stocks: small companies with market capitalizations less than $2 billion– Provide opportunity for above-average returns
(or losses)
– Usually do not have a financial track record
– Earnings tend to grow in spurts and can have dramatic impact on stock price
– Usually not widely-traded; liquidity is an issue
– “Initial Public Offerings” (IPOs)
– Examples: Callaway Golf, California Pizza Kitchen, Winn-Dixie Stores, Shoe Carnival

Copyright © 2011 Pearson Prentice Hall. All rights reserved.6-47
Investing in Foreign Stocks
• Globalization of financial markets is growing
– U.S. equity market represents roughly 35% of world equity markets
– Six countries make up 80% of world equity market
– U.S. market remains largest equity market in world with a total value of about $12 trillion
– Some of the returns in non-U.S. markets are due to currency exchange rates, and not just markets themselves

Copyright © 2011 Pearson Prentice Hall. All rights reserved.6-48
Going Global
• Buying Shares Directly in Foreign Markets– Most adventuresome approach– Logistical problems: fluctuating currency rates, different
regulatory and accounting standards, tax problems, “red tape”
• Buying American Depositary Shares (ADSs)– Simpler approach– Bought and sold on U.S. markets just like stocks in
U.S. companies– Transactions are in U.S. dollars
• Buying International Mutual Funds

Copyright © 2011 Pearson Prentice Hall. All rights reserved.6-49
Going Global
• International investing is more complex and riskier than domestic investing
• International investing requires investors to be right on more factors:– Must pick right stock– Must pick right market– Must pick correct direction for currency exchange rate
fluctuations

Copyright © 2011 Pearson Prentice Hall. All rights reserved.6-50
Returns on International Investments
• Stronger U.S. dollar has negative impact on foreign investments
• Weaker U.S. dollar has positive impact on foreign investments

Copyright © 2011 Pearson Prentice Hall. All rights reserved.6-51
Alternative Investment Strategies
• Storehouse of Value– Safety of investment is primary goal– Investors use high-quality blue chip and non-speculative stocks
• To Accumulate Capital– Growth of investment is primary goal– Investors use growth-oriented stocks to generate capital gains
• Source of Income– Current income is primary goal– Investors use stocks with dependable flow of dividends

Copyright © 2011 Pearson Prentice Hall. All rights reserved.6-52
Stock Investment Strategies
• Buy-and-Hold– Investors buy high-quality stocks and hold them for extended
time periods
– Goal may be current income and/or capital gains
– Investors often add to existing stocks over time
– Very conservative approach; value-oriented

Copyright © 2011 Pearson Prentice Hall. All rights reserved.6-53
Stock Investment Strategies (cont’d)
• Current Income
– Investors buy stocks that have high dividend yields
– Safety of principal and stability of income are primary goals
– May be preferable to bonds because dividends levels tend to increase over time
– Often used to provide to supplement other income, such as in retirement

Copyright © 2011 Pearson Prentice Hall. All rights reserved.6-54
Stock Investment Strategies (cont’d)
• Quality Long-Term Growth
– Investors buy high-quality growth stocks, mid-cap stocks and tech stocks
– Capital gains are primary goal
– Higher level of risk due to emphasis on capital gains
– Significant trading of stocks may occur over time
– Diversification is used to spread risk
– “Total Return Approach” is version that emphasizes both capital gains and high income

Copyright © 2011 Pearson Prentice Hall. All rights reserved.6-55
Stock Investment Strategies (cont’d)
• Aggressive Stock Management
– Investors buy high-quality growth stocks, blue chip stocks, mid-cap stocks, tech stocks and cyclical stocks
– Capital gains are primary goal
– High level of risk due to emphasis on capital gains
– Investors aggressively trade in and out of stocks, often holding for short periods
– Timing the market is key element
– Time consuming to manage

Copyright © 2011 Pearson Prentice Hall. All rights reserved.6-56
Stock Investment Strategies (cont’d)
• Speculation and Short-Term Trading– Also called “day trading” – Investors buy speculative stocks, small-cap stocks and
tech stocks– Capital gains are primary goal– Highest level of risk due to emphasis on capital gains in
short time period– Investors aggressively trade in and out of stocks, often
holding for extremely short periods– Looking for “big score” on unknown stock– Time consuming & high trading costs

Copyright © 2011 Pearson Prentice Hall. All rights reserved.6-57
Chapter 6 Review
• Learning Goals
1. Explain the investment appeal of common stocks and why individuals like to invest in them.
2. Describe stock returns from a historical perspective and understand how current returns measure up to historical standards of performance.
3. Discuss the basic features of common stocks, including issue characteristics, stock quotations, and transaction costs.
Copyright © 2011 Pearson Prentice Hall. All rights reserved.6-58
Chapter 6 Review (cont’d)
• Learning Goals (cont’d)
4. Understand the different kinds of common stock values.
5. Discuss common stock dividends, types of dividends, and dividend reinvestment plans.
6. Describe various types of common stocks, including foreign stocks, and note how stocks can be used as investment vehicles.

Copyright © 2011 Pearson Prentice Hall. All rights reserved.
Chapter 6
Additional Chapter Art

Copyright © 2011 Pearson Prentice Hall. All rights reserved.6-60
Table 6.2 Cash or Reinvested Dividends?

Copyright © 2011 Pearson Prentice Hall. All rights reserved.6-61
Table 6.3 Comparative Annual Returns in the World’s Major Equity Markets, 1984–2008