copyright © 2013 pearson education, inc. publishing as prentice hall o p.i.i.m.t o american...
TRANSCRIPT

Copyright © 2013 Pearson Education, Inc. Publishing as Prentice Hall
o P.I.I.M.To American University of Leadership
Ahmed Hanane, MBA, Eng, CMA, Partneremail: [email protected]

Chapter 8
Cost Estimation and Budgeting
08-02

Chapter 8 Learning ObjectivesAfter completing this chapter, students will be able to: Understand the various types of common
project costs. Recognize the difference between various
forms of project costs. Apply common forms of cost estimation for
project work, including ballpark estimates and definitive estimates.
Understand the advantages of parametric cost estimation and the application of learning curve models in cost estimation.
08-03

Chapter 8 Learning Objectives
After completing this chapter, students will be able to: Discern the various reasons why project
cost estimation is often done poorly. Apply both top-down and bottom-up
budgeting procedures for cost management.
Understand the uses of activity-based budgeting and time-phased budgets for cost estimation and control.
Recognize the appropriateness of applying contingency funds for cost estimation.
08-04

FIGURE 8.1 James Webb Space Telescope 08-05Copyright 2013 © Pearson Education Inc., Publishing as Prentice Hall

Cost Managemento Cost management has been
defined to encompass data collection, cost accounting, and cost control.
o Cost accounting and cost control serve as the chief mechanisms for identifying and maintaining control over project costs.
o Cost estimation processes create a reasonable budget baseline for the project.
08-06

Common Sources of Project Cost
Labor
Materials
Subcontractors
Equipment & facilities
Travel
08-07
Types of Costs
Direct Vs. Indirect
Recurring Vs. Nonrecurring
Fixed Vs. Variable
Normal Vs. Expedited
08-08

Cost Classifications
Direct Labor X X X X
Building Lease X X X X
Expedite X X X X
Material X X X X
Non
-recu
rrin
g
Dir
ec
t Ind
irect
Fixe
d
Recu
rrin
g Vari
abl
e Norm
al
Exp
ed
ite
dCosts
08-09
Copyright © 2013 Pearson Education, Inc. Publishing as Prentice Hall

Cost Estimation
Ballpark (order of magnitude) ±30%
Comparative ±15%
Feasibility ±10%
Definitive ±5%
08-010
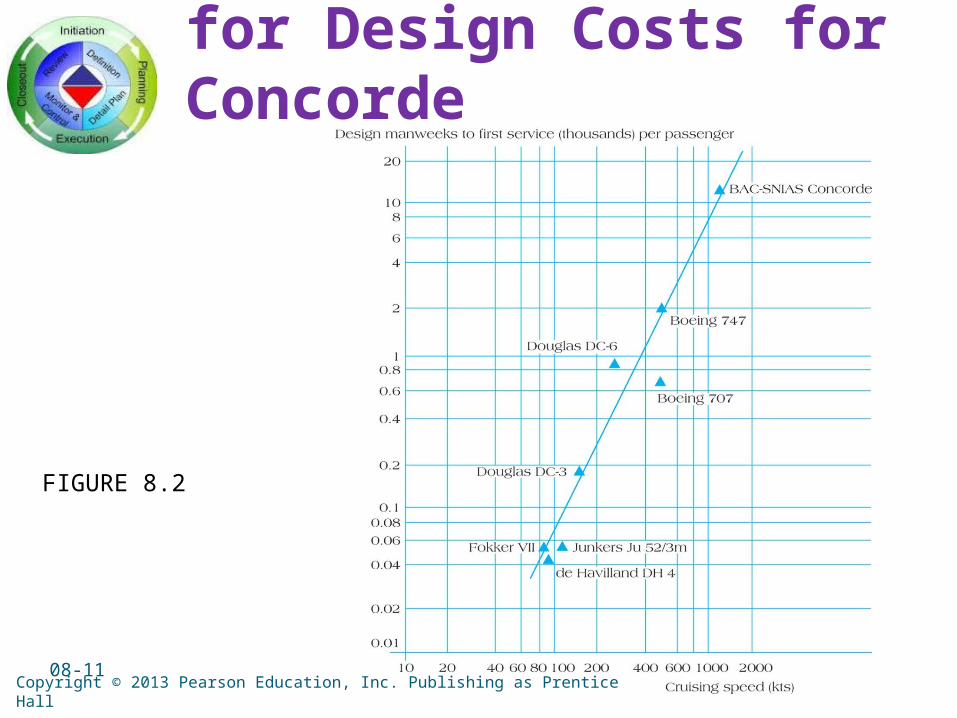
FIGURE 8.2
Parametric Estimate for Design Costs for Concorde
08-11
Copyright © 2013 Pearson Education, Inc. Publishing as Prentice Hall

Learning Curves
Each doubling of output results in a reduction in time to perform the last iteration.
x
:
Y = time required for the x unit of output
a = time required for the initial unit of output
X = the number of units to be produced
b = learning curve slope = log(learning %)/log(2)
bxY aX
Where
08-12

FIGURE 8.4
Unit Learning Curve Log-Linear Model
08-13
Copyright © 2013 Pearson Education, Inc. Publishing as Prentice Hall

Software Project Estimation – Function Points
o Function Point Analysis is a system for estimating the size of software projects based on what the software does.
o Function points are a standard unit of measure that represents the functional size of a software application.
08-14

FIGURE 8.5
Software Project Development Activities as a Function of Size
08-15
Copyright © 2013 Pearson Education, Inc. Publishing as Prentice Hall

Complexity Weighting Table for Function Point Analysis
08-16
Complexity Weighting
Function Low Medium High Total
Number of Inputs 2 x _____ = 4 x _____ = 6 x _____ =
Number of Outputs 4 x _____ = 6 x _____ = 10 x _____ =
Number of Interfaces 3 x _____ = 7 x _____ = 12 x _____ =
Number of Queries 5 x _____ = 10 x _____ = 15 x _____ =
Number of Files 2 x _____ = 4 x _____ = 8 x _____ =
Copyright © 2013 Pearson Education, Inc. Publishing as Prentice Hall

Function Point Calculations for Restaurant Reorder System
08-17
Complexity Weighting
Function Low Medium High Total
Number of Inputs 4 x 15 = 60
Number of Outputs 10 x 20 = 200
Number of Interfaces 3 x 3 = 9
Number of Queries 10 x 6 = 60
Number of Files 2 x 40 = 80
Total 409
Copyright © 2013 Pearson Education, Inc. Publishing as Prentice Hall

Problems with Cost Estimation
Low initial estimates
Unexpected technical difficulties
Lack of definition
Specification changes
External factors
08-18
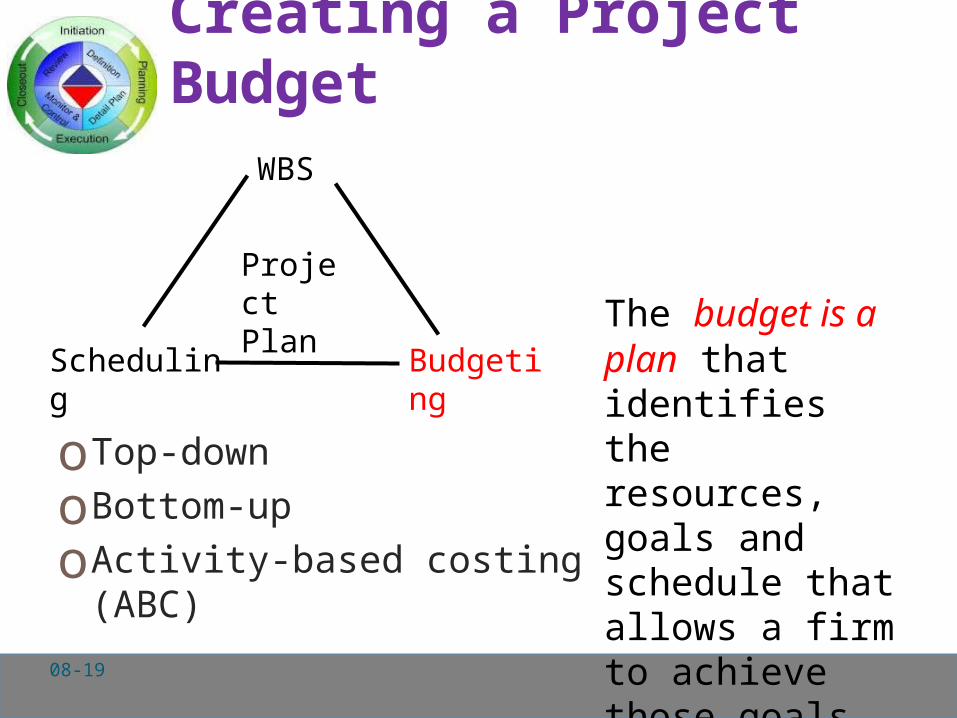
Creating a Project Budget
oTop-downoBottom-upoActivity-based costing
(ABC)
Project Plan
WBS
Scheduling
Budgeting
The budget is a plan that identifies the resources, goals and schedule that allows a firm to achieve those goals08-19

Activity-Based Costing
Projects use activities & activities use resources
1. Assign costs to activities that use resources
2. Identify cost drivers associated with this activity
3. Compute a cost rate per cost driver unit or transaction
4. Multiply the cost driver rate times the volume of cost driver units used by the project
08-20
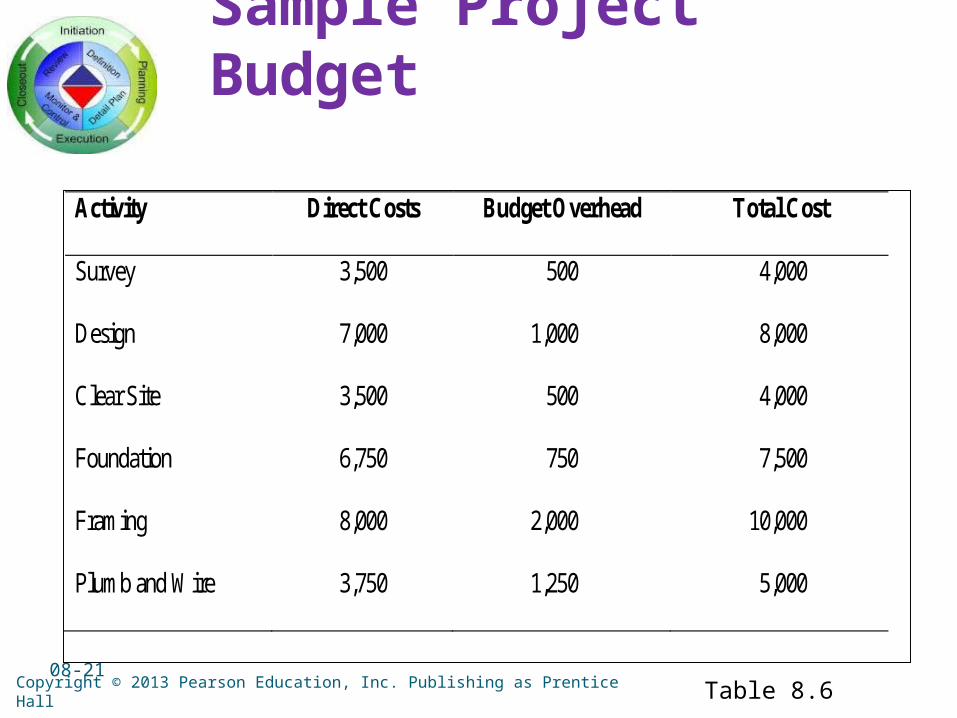
Sample Project Budget
08-21
Activity Direct Costs Budget Overhead Total Cost
Survey 3,500 500 4,000
Design 7,000 1,000 8,000
Clear Site 3,500 500 4,000
Foundation 6,750 750 7,500
Framing 8,000 2,000 10,000
Plumb and Wire 3,750 1,250 5,000
Copyright © 2013 Pearson Education, Inc. Publishing as Prentice Hall Table 8.6

Sample Budget Tracking Planned and Actual Activity Costs
08-22
Activity Planned Budget Actual Variance
Survey 4,000 4,250 250
Design 8,000 8,000 - 0 -
Clear Site 4,000 3,500 (500)
Foundation 7,500 8,500 1,000
Framing 10,000 11,250 1,250
Plumb and Wire 5,000 5,150 150
Total 38,500 40,650 2,150
Copyright © 2013 Pearson Education, Inc. Publishing as Prentice Hall Table 8.7

Example of a Time-Phased Budget
08-23
Months
Activity January February March April May
Total by
Activity
Survey 4,000 4,000
Design 5,000 3,000 8,000
Clear Site 4,000 4,000
Foundation 7,500 7,500
Framing 8,000 2,000 10,000
Plumb and Wire 1,000 4,000 5,000
Monthly Planned 4,000 9,000 10,500 9,000 6,000
Cumulative 4,000 13,000 23,500 32,500 38,500 38,500
Copyright © 2013 Pearson Education, Inc. Publishing as Prentice Hall Table 8.8

Cumulative Budgeted Cost of the Project
Figure 8.7
08-24
Copyright © 2013 Pearson Education, Inc. Publishing as Prentice Hall

Budget Contingencies
The allocation of extra funds to cover uncertainties and improve the chance of finishing on time.
Contingencies are needed becauseo Project scope may changeo Murphy’s Law is presento Cost estimation must anticipate
interaction costso Normal conditions are rarely encountered
08-25

Summary
1. Understand the various types of common project costs.
2. Recognize the difference between various forms of project costs.
3. Apply common forms of cost estimation for project work, including ballpark estimates and definitive estimates.
4. Understand the advantages of parametric cost estimation and the application of learning curve models in cost estimation.
08-26

Summary5. Discern the various reasons why project
cost estimation is often done poorly.6. Apply both top-down and bottom-up
budgeting procedures for cost management.
7. Understand the uses of activity-based budgeting and time-phased budgets for cost estimation and control.
8. Recognize the appropriateness of applying contingency funds for cost estimation.
08-27