copyright © 2014 the authorseprints.gla.ac.uk/94043/1/94043.pdf · postgraduate institute memory...
TRANSCRIPT

Krishnadas, R., Ramanathan, S., Wong, E., Nayak, A., and Moore, B. (2014) Residual negative symptoms differentiate cognitive performance in clinically stable patients with schizophrenia and bipolar disorder. Schizophrenia Research and Treatment, 2014 . p. 785310. ISSN 2090-2085 Copyright © 2014 The Authors http://eprints.gla.ac.uk/94043/
Deposited on: 10 November 2014
Enlighten – Research publications by members of the University of Glasgow
http://eprints.gla.ac.uk

Research ArticleResidual Negative Symptoms DifferentiateCognitive Performance in Clinically Stable Patients withSchizophrenia and Bipolar Disorder
Rajeev Krishnadas,1 Seethalakshmi Ramanathan,2 Eugene Wong,3
Ajita Nayak,4 and Brian Moore5
1 Sackler Institute of Psychobiological Research, Southern General Hospital, Room 25, University Corridor, Ground Floor,Neurology Building, Glasgow G51 4TF, UK
2Hutchings Psychiatric Center, NYS Office of Mental Health, Syracuse, NY 13210, USA3Gartnavel Royal Hospital, Glasgow G12 0XH, UK4Department of Psychiatry, KEM Hospital, Mumbai 400012, India5 Newcastle General Hospital, 1st Floor, Building 15, Westgate Road, Newcastle upon Tyne NE4 6BE, UK
Correspondence should be addressed to Rajeev Krishnadas; [email protected]
Received 21 February 2014; Accepted 23 May 2014; Published 12 June 2014
Academic Editor: Luis San
Copyright © 2014 Rajeev Krishnadas et al. This is an open access article distributed under the Creative Commons AttributionLicense, which permits unrestricted use, distribution, and reproduction in any medium, provided the original work is properlycited.
Cognitive deficits in various domains have been shown in patients with bipolar disorder and schizophrenia. The purpose of thepresent study was to examine if residual psychopathology explained the difference in cognitive function between clinically stablepatients with schizophrenia and bipolar disorder. We compared the performance on tests of attention, visual and verbal memory,and executive function of 25 patients with schizophrenia in remission and 25 euthymic bipolar disorder patients with that of25 healthy controls. Mediation analysis was used to see if residual psychopathology could explain the difference in cognitivefunction between the patient groups. Both patient groups performed significantly worse than healthy controls on most cognitivetests. Patients with bipolar disorder displayed cognitive deficits that were milder but qualitatively similar to those of patients withschizophrenia. Residual negative symptoms mediated the difference in performance on cognitive tests between the two groups.Neither residual general psychotic symptoms nor greater antipsychotic doses explained this relationship. The shared varianceexplained by the residual negative and cognitive deficits that the difference between patient groups may be explained by greaterfrontal cortical neurophysiological deficits in patients with schizophrenia, compared to bipolar disorder. Further longitudinal workmay provide insight into pathophysiological mechanisms that underlie these deficits.
1. Introduction
Cognitive deficits represent stable traits in both schizophre-nia and bipolar disorder [1]. Studies that have directlycompared the two groups show qualitatively similar deficits,but quantitatively, milder deficits in bipolar disorder [2–4]. More recently, it has been postulated that this quanti-tative difference may depend on the presence or severityof psychotic symptoms [5, 6]. For example, Simonsen et al.found that as compared to those without psychosis, subjectswith a history of psychosis, irrespective of the diagnosis,showed poorer performance on neurocognitivemeasures [5].
Additionally, depressive and negative symptoms have alsobeen associated with cognitive deficits [7, 8]. However, veryfew studies have tried to address these issues during symp-tomatic remission. It is not clear if residual/subthresholdpsychopathology during periods of remission would explainthe trait difference between the two groups. In other words,do patients with schizophrenia perform poorer on cognitivetests than patients with bipolar disorder, due to the presenceof residual/subthreshold psychotic/negative symptoms?
In this study, we aimed to compare cognitive functionin patients with euthymic bipolar disorder with those withschizophrenia in remission. Our second aim was to examine
Hindawi Publishing CorporationSchizophrenia Research and TreatmentVolume 2014, Article ID 785310, 6 pageshttp://dx.doi.org/10.1155/2014/785310

2 Schizophrenia Research and Treatment
if differences in residual symptoms (psychotic/negativesymptoms) between the patient groups could explain (medi-ate) the difference in cognitive dysfunction between thegroups. In other words, the question we are attemptingto answer is whether the presence of residual symptoms,including psychotic and specifically negative symptoms, inschizophrenia explains the poorer cognitive performancein schizophrenia? We hypothesise that the difference incognitive performance could be explained by the presence ofresidual symptoms.
2. Materials and Methods
The study received ethical approval from the institutionalethics review board, and all subjects gave written informedconsent. Twenty-five 18–60 year-old subjects were recruitedinto each group. Both the patient groups were recruited fromthe outpatients’ clinics of BYL Nair Hospital. Those in thebipolar disorder group (BD), fulfilled the DSM IV criteriafor bipolar I disorder—most recent episode manic—severewithout psychotic features (with no life-time history of apsychotic episode confirmed using MINI 5.0). Those in theschizophrenia group (SZ), fulfilled the DSM IV criteria forschizophrenia [10, 11]. Euthymia was ascertained using a cut-off score of less than 8 on Hamilton Depression Rating Scale(HRSD) and Young Mania Rating Scale (YMRS) [12, 13].Remission in schizophrenia was confirmed using a cut-offscore of 8 with a score of less than 2 on individual itemson the Brief Psychiatric Rating Scale (BPRS) and Scale forthe Assessment of Negative Symptoms (SANS) [9, 14, 15].Antipsychotic doses were measured using the defined dailydose (DDD) method described by WHO [16]. The controlgroup consisted of 25 healthy subjects who had no pastor family history of major psychiatric illness in a first-degree relative. Subjects with comorbid Axis I (includingsubstance use disorder—except nicotine use based on MINI5.0 screening) and Axis II diagnoses, those with medicalcomorbidity, and those who had received ECT in the last 6months were excluded.
2.1. Cognitive Assessment
2.1.1. Verbal and Visual Memory. Memory was assessed usingPostgraduate Institute Memory Scale (PGIMS), an Indianadaptation of Wechsler memory scale and Boston memoryscale that takes into account the language, educational level,and norms standardized for the Indian population [17].Dysfunction scores adjusted for education level are scored0, 2, or 3, with higher scores suggesting greater dysfunction.We used the total dysfunction score as well as the raw scoreson digit span tests. The Rey-Osterrieth complex figure testwith copy component (ROCFT1) and a 30-minute recallcomponent (ROCFT2) was used to evaluate visual attention(copy component), visuoconstructional ability, and delayedvisual memory [18].
2.1.2. Trail-Making Test (TMT). TMT A and B have beencommonly used and validated in the Indian population [19].
2.1.3. Verbal Fluency. Based on previous studies of verbal flu-ency, one Hindi phoneme (denoted in English as /p/[“pa:”])was used in this task and participants were asked to generatewords that started with the sounds associated with theseletters in the 60 s time limit. The total number of words inthe trial, after excluding proper nouns, numbers, andmultipleforms of the same root word, was taken as the verbal fluencyscore [20].
2.1.4. Go-No Go Task. Sensitivity to interference andinhibitory control was tested using a two-step go-no go task,as described in the frontal assessment battery [21]. In the firsttask, the subject was asked to provide an opposite responseto the examiner’s alternating signal. Thus, the subject shouldobey the initial verbal command and refrain following whatthey see. On the second task, the subject must inhibit aresponse that was previously given to the same stimulus. Atotal of the correct responses on the two tests were taken asthe total score.
3. Statistical Analysis
Firstly, we examined zero-order correlation between demo-graphic/clinical variables and cognition (b path on medi-ation). To address our first aim, we compared cognitivefunction between groups using MANCOVA, with cognitivefunctions as dependent variable, diagnosis as the fixed factor,and those variables that correlated with cognitive function(dependent variable), but not diagnostic group (independentvariable), as covariates [22]. We correlated the effect sizes ofcognitive deficits between the two diagnostic groups to lookat the similarity of cognitive deficits, as previously done bySchretlen et al. [3].
Finally, to address our second aim, we conducted amediation analysis to see if variables, SANS, BPRS, and DDD(mediators), that differed significantly between diagnosticgroups mediated the relationship between group mem-bership (independent variable: IV) and cognitive function(dependent variable: DV) in each domain. The analysis teststhe hypothesis that the diagnostic category (IV) accounts forvariance in the mediator and in turn, this variance in themediator accounts for a proportion of the variance of thecognitive deficits (DV) (Figure 1). “The adjustable param-eters of the model represent the unidirectional influencebetween pairs of variable in the model. The best fittingvalues of the parameters are estimated by using the GeneralLinear Model to solve the linear equations that describethe relationships within the model. This analysis differsfrom multiple regression which estimates the proportion ofvariance in the dependent variable accounted for by each ofseveral independent predictor variableswhile allowing for thevariance accounted for by the other predictors in the model.In other words, themediation analysis partitions the varianceexplained by the predictor into a part that is independent ofthe mediating variable and a part that is accounted for via themediating variable” [23]. In classic mediation analysis, causalmodels are tested using longitudinal data; such an assumptionwas not made here. The purpose of this analysis was to

Schizophrenia Research and Treatment 3
Table 1: Demographic and illness characteristics.
BP SZ HC Test statistic 𝑃 BP versus SZFemale, 𝑛 (%) 7 (28) 9 (36) 7 (28) Chi square = 0.502 0.778Age, years :mean (s.d.) 35.44 (11.18) 40.16 (8.153) 35.48 (5.49) 𝐹 = 2.49
b 0.09Years in education 10.08 (2.08) 9.08 (1.47) 9.92 (1.03) 𝐹 = 2.86
b 0.064Unemployed 3 6 0 2.7𝐸 − 09
a<0.001 NS
YMRS, mean (s.d.) 2.28 (1.1) 2.04 (1.02) 0 𝐹 = 52.32b<0.001 NS
HRSD, mean (s.d.) 1.52 (0.58) 1.36 (0.95) 0 𝐹 = 41.85b<0.001 NS
BPRS, mean (s.d.) 0.56 (0.65) 3.68 (1.24) 0 𝐹 = 148.67b<0.001 𝑡 = −11.07; 𝑃 < 0.001
SANS, mean (s.d.) 0.32 (0.55) 2.68 (0.69) 0 𝐹 = 204.2b<0.001 𝑡 = −13.3; 𝑃 < 0.001
IDEAS, mean (s.d.) 1.52 (2.00) 2.16 (2.26) — 𝐹 = 1.12b 0.295
Number of manic episodes, mean (s.d.) 2.88 (1.45) — —Number of depressive episodes, mean (s.d.) 1.08 (1.57) — —Duration of illness, mean (s.d.) 8.48 (6.61) 11.32 (5.81) — 𝐹 = 2.6
b 0.113MedicationDDD 0.72 (0.50) 1.68 (0.62) 𝑡 = −5.94; <0.001Lithium, 𝑛 (%) 7 (28) — —Valproate, 𝑛 (%) 6 (24) — —Carbamazepine, 𝑛 (%) 6 (24) — —Lithium + carbamazepine, 𝑛 (%) 6 (24) — —Antipsychotics, 𝑛 (%) 18 (72) 25 (100) —Benzodiazepine, 𝑛 (%) 5 (20) 8 (32) —Anticholinergics, 𝑛 (%) 8 (32) 24 (96) —Antidepressant, 𝑛 (%) 3 (12) 3 (12) —aFisher’s exact test for rXc tables; bANOVA IDEAS: Indian Disability Evaluation and Assessment Scale; DDD: defined daily dose of antipsychotics; BP: bipolardisorder; SZ: schizophrenia; HC: healthy control; BPRS: Brief Psychiatric Rating Scale (measured on a scale of 0–6 as in [9]); HDRS: Hamilton DepressionRating Scale; YMRS: Young Mania Rating Scale; SANS: Scale for the Assessment of Negative Symptoms.
identify overlapping variance in cognitive function, explainedby the diagnostic groups and mediator variables. This typeof approach has been taken previously to examine thecontribution ofMRI surface basedmeasures to volume-basedmeasures measured using VBM [19]. We used the bootstrapmethod of Preacher and Hayes to estimate the indirect effectand bias-corrected 95% confidence interval (CI) for eachmediator based on 20,000 bootstrap samples using an SPSSmacro [24]. This analysis requires no assumption regardingthe underlying distributions since the statistical significancelevel is determined nonparametrically.
4. Results
Demographic and illness variables are shown in Table 1. Thetwo patient groups did not differ on most of the variables.Notably, BPRS, SANS scores, and defined daily dose (DDD)of antipsychotics were greater in the schizophrenia groupcompared to the bipolar group.
The results of the correlation are shown in Table 2.Age showed a significant association with performance ontrail-making test. HDRS scores were associated with mem-ory dysfunction. DDD of medication was associated withpoorer performance on digit forward trail-making test B andROCFT. There was also a significant association betweenBPRS and SANS across a number of domains.
Diagnosis (independent)
Cognitive function
(dependent)
SANS, BPRS, DDD (mediator)
Direct effect
Total effect
Indirect effect
a b
Figure 1: Mediation analysis. The figure depicts the relationshipbetween the independent, mediator, and dependent variables.The mediation analysis partitions the total variance (total effect)explained by the predictor into a part that is independent of themediating variable (direct effect) and a part that is accounted for viathe mediating variable (indirect effect). a represents the “a” path andb represents the “b” path.
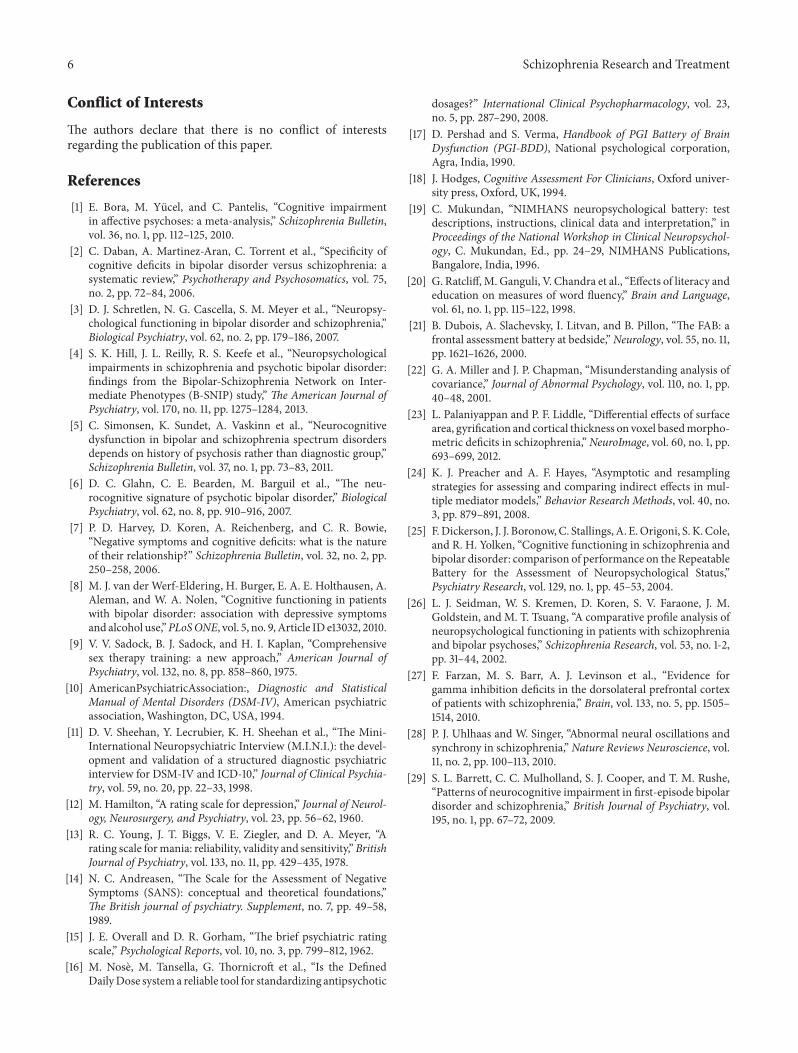
Mean effect size of cognitive deficits was 𝜂2𝑝= −0.56 in
bipolar disorder and 𝜂2𝑝= −0.72 in schizophrenia. Figure 2
shows the relationship between the effect sizes of cognitivefunction in both groups. As can be seen, patients performedworse than controls on all tests, after controlling for gender,age, and number of years in education. Performing a Pearson’scorrelation of effect sizes between groups tested the similarityof cognitive deficits. This was found to be 𝑟 = 0.88.

4 Schizophrenia Research and Treatment
Table 2: Spearman’s correlation between clinical and demographic variables and performance on cognitive tests.
Digitforward
Digitbackward
Trail makingA
Trail makingB
Verbalfluency Go-no go ROCFT1 ROCFT2 PGIMS
Age −0.164 −0.032 −0.313∗ 0.263 −0.247 −0.183 0.075 −0.187 0.191Number of years ineducation 0.119 0.069 −0.045 −0.156 0.235 0.031 0.127 0.268 0.066
Duration of illness inyears −0.082 0.256 −0.079 0.096 −0.122 −0.132 0.123 −0.215 0.047
DDD −0.362∗∗ −0.186 0.146 0.433∗∗ −0.245 −0.160 −0.016 −0.500∗∗ 0.483∗∗
YMRS 0.137 0.191 −0.175 −0.151 0.154 0.169 −0.052 0.040 −0.056HDRS 0.213 −0.010 0.244 −0.126 −0.186 −0.154 0.094 0.170 −0.300∗
BPRS −0.617∗∗ −0.282∗ 0.172 0.575∗∗ −0.478∗∗ −0.298∗ 0.097 −0.589∗∗ 0.558∗∗
SANS −0.526∗∗ −0.239 0.157 0.466∗∗ −0.488∗∗ −0.511∗∗ 0.120 −0.530∗∗ 0.526∗∗
Total IDEAS −0.374∗∗ −0.416∗∗ −0.048 0.131 −0.119 −0.331∗ 0.054 −0.117 0.434∗∗∗𝑃 < 0.05; ∗∗𝑃 < 0.01; DDD: defined daily dose of antipsychotics; BPRS: Brief Psychiatric Rating Scale; HDRS: Hamilton Depression Rating Scale; YMRS:
Young Mania Rating Scale; SANS: Scale for the Assessment of Negative Symptoms; IDEAS: Indian Disability Evaluation and Assessment Scale.
1.0
0.9
0.8
0.7
0.6
0.5
0.4
0.3
0.2
0.0
0.1
Part
ial e
ta sq
uare
d
Bipolar
Schizophrenia
FDS
0.477
0.837
RDS
0.588
0.749
TMT A
0.561
0.661
TMT B
0.629
0.863
Verbalfluency0.233
0.339
Go-no go
0.171
0.419
ROCFT1
0.709
0.725
ROCFT2
0.879
0.900
TotalPGIMS0.772
0.951
Figure 2: Comparison of effect sizes of differences between cases and controls. Partial eta squared represents the size of the relationshipbetween diagnosis and cognitive function. Greater values represent greater cognitive deficits. Covariates appearing in themodel are evaluatedat the following values: gender = 0.3067, number of years in education = 9.69, and age = 37.03. FDS: forward digit span; RDS: reverse digitspan; TMT A: trail-making test A; TMT B: trail-making test B; ROCFT-ROCFT: Rey Osterreith Complex figure test; PGIMS: PGI memoryscale.
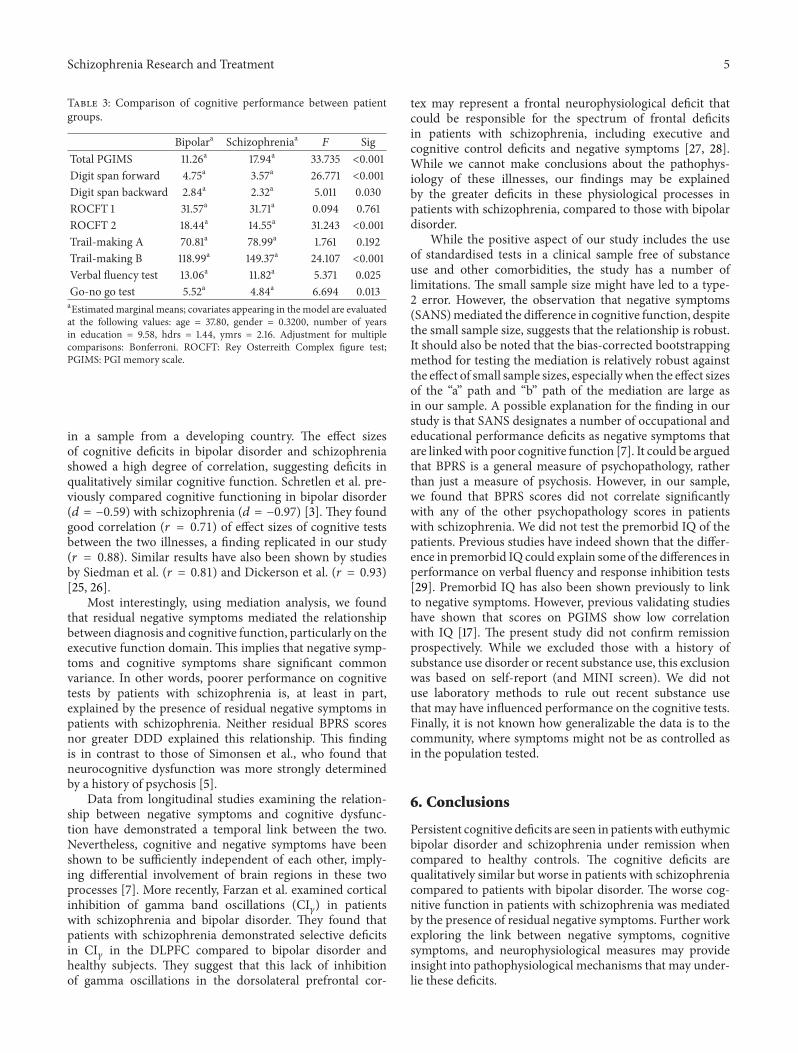
Results of MANCOVA comparing the patient groupsare shown in Table 3. Diagnosis was significantly associatedwith cognitive performance [Pillai’s trace = 0.73; 𝐹(9, 35) =10.41; 𝑃 < 0.001; 𝜂2
𝑝= 0.73]. SANS, BPRS, and DDD
were not included as covariates in the above model, as theydiffered significantly between the patient groups. They wereconsidered as potential mediators.
Onmediation analysis, we found that SANSmediated thedifference in performance between the two groups on trail-makingB (Beta =−30.46;𝑍 = −3.07; 95%CI=−49.67–−6.52),verbal fluency (Beta = −2.24; 𝑍 = −2.65; 95%CI = −4.16–−0.18), go-no go test (Beta = −1.59; 𝑍 = −3.97; 95%CI =−2.615–−0.61), and ROCFT2 (Beta = 2.45;𝑍 = 2.09; 95%CI =0.17–4.89). BPRS and DDD showed no mediation effects.
5. Discussion
Wehave shown that clinically stable patientswith schizophre-nia and bipolar disorder have qualitatively similar cognitivedeficits. These deficits are quantitatively greater in patientswith schizophrenia. This difference in performance betweenthe patients groups was at least in part mediated by residualnegative symptoms.
Recent review of meta-analyses of cognitive function inpatients with remitted bipolar disorder and schizophreniashowed a weighted effect size in the range of 0.6 and 0.8–1 forletter fluency; 0.7 and 0.9 on trail-making tests; 0.7 and 0.9on digit span backwards; 0.8 and 1.3 on verbal learning andrecall, respectively [1]. Findings of our study confirm the largeeffect sizes observed by the aforementioned investigators
Schizophrenia Research and Treatment 5
Table 3: Comparison of cognitive performance between patientgroups.
Bipolara Schizophreniaa 𝐹 SigTotal PGIMS 11.26a 17.94a 33.735 <0.001Digit span forward 4.75a 3.57a 26.771 <0.001Digit span backward 2.84a 2.32a 5.011 0.030ROCFT 1 31.57a 31.71a 0.094 0.761ROCFT 2 18.44a 14.55a 31.243 <0.001Trail-making A 70.81a 78.99a 1.761 0.192Trail-making B 118.99a 149.37a 24.107 <0.001Verbal fluency test 13.06a 11.82a 5.371 0.025Go-no go test 5.52a 4.84a 6.694 0.013aEstimated marginal means; covariates appearing in the model are evaluatedat the following values: age = 37.80, gender = 0.3200, number of yearsin education = 9.58, hdrs = 1.44, ymrs = 2.16. Adjustment for multiplecomparisons: Bonferroni. ROCFT: Rey Osterreith Complex figure test;PGIMS: PGI memory scale.
in a sample from a developing country. The effect sizesof cognitive deficits in bipolar disorder and schizophreniashowed a high degree of correlation, suggesting deficits inqualitatively similar cognitive function. Schretlen et al. pre-viously compared cognitive functioning in bipolar disorder(𝑑 = −0.59) with schizophrenia (𝑑 = −0.97) [3]. They foundgood correlation (𝑟 = 0.71) of effect sizes of cognitive testsbetween the two illnesses, a finding replicated in our study(𝑟 = 0.88). Similar results have also been shown by studiesby Siedman et al. (𝑟 = 0.81) and Dickerson et al. (𝑟 = 0.93)[25, 26].
Most interestingly, using mediation analysis, we foundthat residual negative symptoms mediated the relationshipbetween diagnosis and cognitive function, particularly on theexecutive function domain. This implies that negative symp-toms and cognitive symptoms share significant commonvariance. In other words, poorer performance on cognitivetests by patients with schizophrenia is, at least in part,explained by the presence of residual negative symptoms inpatients with schizophrenia. Neither residual BPRS scoresnor greater DDD explained this relationship. This findingis in contrast to those of Simonsen et al., who found thatneurocognitive dysfunction was more strongly determinedby a history of psychosis [5].
Data from longitudinal studies examining the relation-ship between negative symptoms and cognitive dysfunc-tion have demonstrated a temporal link between the two.Nevertheless, cognitive and negative symptoms have beenshown to be sufficiently independent of each other, imply-ing differential involvement of brain regions in these twoprocesses [7]. More recently, Farzan et al. examined corticalinhibition of gamma band oscillations (CI
𝛾) in patients
with schizophrenia and bipolar disorder. They found thatpatients with schizophrenia demonstrated selective deficitsin CI
𝛾in the DLPFC compared to bipolar disorder and
healthy subjects. They suggest that this lack of inhibitionof gamma oscillations in the dorsolateral prefrontal cor-
tex may represent a frontal neurophysiological deficit thatcould be responsible for the spectrum of frontal deficitsin patients with schizophrenia, including executive andcognitive control deficits and negative symptoms [27, 28].While we cannot make conclusions about the pathophys-iology of these illnesses, our findings may be explainedby the greater deficits in these physiological processes inpatients with schizophrenia, compared to those with bipolardisorder.
While the positive aspect of our study includes the useof standardised tests in a clinical sample free of substanceuse and other comorbidities, the study has a number oflimitations. The small sample size might have led to a type-2 error. However, the observation that negative symptoms(SANS)mediated the difference in cognitive function, despitethe small sample size, suggests that the relationship is robust.It should also be noted that the bias-corrected bootstrappingmethod for testing the mediation is relatively robust againstthe effect of small sample sizes, especially when the effect sizesof the “a” path and “b” path of the mediation are large asin our sample. A possible explanation for the finding in ourstudy is that SANS designates a number of occupational andeducational performance deficits as negative symptoms thatare linkedwith poor cognitive function [7]. It could be arguedthat BPRS is a general measure of psychopathology, ratherthan just a measure of psychosis. However, in our sample,we found that BPRS scores did not correlate significantlywith any of the other psychopathology scores in patientswith schizophrenia. We did not test the premorbid IQ of thepatients. Previous studies have indeed shown that the differ-ence in premorbid IQ could explain some of the differences inperformance on verbal fluency and response inhibition tests[29]. Premorbid IQ has also been shown previously to linkto negative symptoms. However, previous validating studieshave shown that scores on PGIMS show low correlationwith IQ [17]. The present study did not confirm remissionprospectively. While we excluded those with a history ofsubstance use disorder or recent substance use, this exclusionwas based on self-report (and MINI screen). We did notuse laboratory methods to rule out recent substance usethat may have influenced performance on the cognitive tests.Finally, it is not known how generalizable the data is to thecommunity, where symptoms might not be as controlled asin the population tested.
6. Conclusions
Persistent cognitive deficits are seen in patientswith euthymicbipolar disorder and schizophrenia under remission whencompared to healthy controls. The cognitive deficits arequalitatively similar but worse in patients with schizophreniacompared to patients with bipolar disorder. The worse cog-nitive function in patients with schizophrenia was mediatedby the presence of residual negative symptoms. Further workexploring the link between negative symptoms, cognitivesymptoms, and neurophysiological measures may provideinsight into pathophysiological mechanisms that may under-lie these deficits.
6 Schizophrenia Research and Treatment
Conflict of Interests
The authors declare that there is no conflict of interestsregarding the publication of this paper.
References
[1] E. Bora, M. Yucel, and C. Pantelis, “Cognitive impairmentin affective psychoses: a meta-analysis,” Schizophrenia Bulletin,vol. 36, no. 1, pp. 112–125, 2010.
[2] C. Daban, A. Martinez-Aran, C. Torrent et al., “Specificity ofcognitive deficits in bipolar disorder versus schizophrenia: asystematic review,” Psychotherapy and Psychosomatics, vol. 75,no. 2, pp. 72–84, 2006.
[3] D. J. Schretlen, N. G. Cascella, S. M. Meyer et al., “Neuropsy-chological functioning in bipolar disorder and schizophrenia,”Biological Psychiatry, vol. 62, no. 2, pp. 179–186, 2007.
[4] S. K. Hill, J. L. Reilly, R. S. Keefe et al., “Neuropsychologicalimpairments in schizophrenia and psychotic bipolar disorder:findings from the Bipolar-Schizophrenia Network on Inter-mediate Phenotypes (B-SNIP) study,” The American Journal ofPsychiatry, vol. 170, no. 11, pp. 1275–1284, 2013.
[5] C. Simonsen, K. Sundet, A. Vaskinn et al., “Neurocognitivedysfunction in bipolar and schizophrenia spectrum disordersdepends on history of psychosis rather than diagnostic group,”Schizophrenia Bulletin, vol. 37, no. 1, pp. 73–83, 2011.
[6] D. C. Glahn, C. E. Bearden, M. Barguil et al., “The neu-rocognitive signature of psychotic bipolar disorder,” BiologicalPsychiatry, vol. 62, no. 8, pp. 910–916, 2007.
[7] P. D. Harvey, D. Koren, A. Reichenberg, and C. R. Bowie,“Negative symptoms and cognitive deficits: what is the natureof their relationship?” Schizophrenia Bulletin, vol. 32, no. 2, pp.250–258, 2006.
[8] M. J. van der Werf-Eldering, H. Burger, E. A. E. Holthausen, A.Aleman, and W. A. Nolen, “Cognitive functioning in patientswith bipolar disorder: association with depressive symptomsand alcohol use,”PLoSONE, vol. 5, no. 9, Article ID e13032, 2010.
[9] V. V. Sadock, B. J. Sadock, and H. I. Kaplan, “Comprehensivesex therapy training: a new approach,” American Journal ofPsychiatry, vol. 132, no. 8, pp. 858–860, 1975.
[10] AmericanPsychiatricAssociation:, Diagnostic and StatisticalManual of Mental Disorders (DSM-IV), American psychiatricassociation, Washington, DC, USA, 1994.
[11] D. V. Sheehan, Y. Lecrubier, K. H. Sheehan et al., “The Mini-International Neuropsychiatric Interview (M.I.N.I.): the devel-opment and validation of a structured diagnostic psychiatricinterview for DSM-IV and ICD-10,” Journal of Clinical Psychia-try, vol. 59, no. 20, pp. 22–33, 1998.
[12] M. Hamilton, “A rating scale for depression,” Journal of Neurol-ogy, Neurosurgery, and Psychiatry, vol. 23, pp. 56–62, 1960.
[13] R. C. Young, J. T. Biggs, V. E. Ziegler, and D. A. Meyer, “Arating scale formania: reliability, validity and sensitivity,”BritishJournal of Psychiatry, vol. 133, no. 11, pp. 429–435, 1978.
[14] N. C. Andreasen, “The Scale for the Assessment of NegativeSymptoms (SANS): conceptual and theoretical foundations,”The British journal of psychiatry. Supplement, no. 7, pp. 49–58,1989.
[15] J. E. Overall and D. R. Gorham, “The brief psychiatric ratingscale,” Psychological Reports, vol. 10, no. 3, pp. 799–812, 1962.
[16] M. Nose, M. Tansella, G. Thornicroft et al., “Is the DefinedDailyDose systema reliable tool for standardizing antipsychotic
dosages?” International Clinical Psychopharmacology, vol. 23,no. 5, pp. 287–290, 2008.
[17] D. Pershad and S. Verma, Handbook of PGI Battery of BrainDysfunction (PGI-BDD), National psychological corporation,Agra, India, 1990.
[18] J. Hodges, Cognitive Assessment For Clinicians, Oxford univer-sity press, Oxford, UK, 1994.
[19] C. Mukundan, “NIMHANS neuropsychological battery: testdescriptions, instructions, clinical data and interpretation,” inProceedings of the National Workshop in Clinical Neuropsychol-ogy, C. Mukundan, Ed., pp. 24–29, NIMHANS Publications,Bangalore, India, 1996.
[20] G. Ratcliff,M. Ganguli, V. Chandra et al., “Effects of literacy andeducation on measures of word fluency,” Brain and Language,vol. 61, no. 1, pp. 115–122, 1998.
[21] B. Dubois, A. Slachevsky, I. Litvan, and B. Pillon, “The FAB: afrontal assessment battery at bedside,”Neurology, vol. 55, no. 11,pp. 1621–1626, 2000.
[22] G. A. Miller and J. P. Chapman, “Misunderstanding analysis ofcovariance,” Journal of Abnormal Psychology, vol. 110, no. 1, pp.40–48, 2001.
[23] L. Palaniyappan and P. F. Liddle, “Differential effects of surfacearea, gyrification and cortical thickness on voxel basedmorpho-metric deficits in schizophrenia,” NeuroImage, vol. 60, no. 1, pp.693–699, 2012.
[24] K. J. Preacher and A. F. Hayes, “Asymptotic and resamplingstrategies for assessing and comparing indirect effects in mul-tiple mediator models,” Behavior Research Methods, vol. 40, no.3, pp. 879–891, 2008.
[25] F.Dickerson, J. J. Boronow,C. Stallings, A. E.Origoni, S. K. Cole,and R. H. Yolken, “Cognitive functioning in schizophrenia andbipolar disorder: comparison of performance on the RepeatableBattery for the Assessment of Neuropsychological Status,”Psychiatry Research, vol. 129, no. 1, pp. 45–53, 2004.
[26] L. J. Seidman, W. S. Kremen, D. Koren, S. V. Faraone, J. M.Goldstein, and M. T. Tsuang, “A comparative profile analysis ofneuropsychological functioning in patients with schizophreniaand bipolar psychoses,” Schizophrenia Research, vol. 53, no. 1-2,pp. 31–44, 2002.
[27] F. Farzan, M. S. Barr, A. J. Levinson et al., “Evidence forgamma inhibition deficits in the dorsolateral prefrontal cortexof patients with schizophrenia,” Brain, vol. 133, no. 5, pp. 1505–1514, 2010.
[28] P. J. Uhlhaas and W. Singer, “Abnormal neural oscillations andsynchrony in schizophrenia,” Nature Reviews Neuroscience, vol.11, no. 2, pp. 100–113, 2010.
[29] S. L. Barrett, C. C. Mulholland, S. J. Cooper, and T. M. Rushe,“Patterns of neurocognitive impairment in first-episode bipolardisorder and schizophrenia,” British Journal of Psychiatry, vol.195, no. 1, pp. 67–72, 2009.

Submit your manuscripts athttp://www.hindawi.com
Stem CellsInternational
Hindawi Publishing Corporationhttp://www.hindawi.com Volume 2014
Hindawi Publishing Corporationhttp://www.hindawi.com Volume 2014
MEDIATORSINFLAMMATION
of
Hindawi Publishing Corporationhttp://www.hindawi.com Volume 2014
Behavioural Neurology
EndocrinologyInternational Journal of
Hindawi Publishing Corporationhttp://www.hindawi.com Volume 2014
Hindawi Publishing Corporationhttp://www.hindawi.com Volume 2014
Disease Markers
Hindawi Publishing Corporationhttp://www.hindawi.com Volume 2014
BioMed Research International
OncologyJournal of
Hindawi Publishing Corporationhttp://www.hindawi.com Volume 2014
Hindawi Publishing Corporationhttp://www.hindawi.com Volume 2014
Oxidative Medicine and Cellular Longevity
Hindawi Publishing Corporationhttp://www.hindawi.com Volume 2014
PPAR Research
The Scientific World JournalHindawi Publishing Corporation http://www.hindawi.com Volume 2014
Immunology ResearchHindawi Publishing Corporationhttp://www.hindawi.com Volume 2014
Journal of
ObesityJournal of
Hindawi Publishing Corporationhttp://www.hindawi.com Volume 2014
Hindawi Publishing Corporationhttp://www.hindawi.com Volume 2014
Computational and Mathematical Methods in Medicine
OphthalmologyJournal of
Hindawi Publishing Corporationhttp://www.hindawi.com Volume 2014
Diabetes ResearchJournal of
Hindawi Publishing Corporationhttp://www.hindawi.com Volume 2014
Hindawi Publishing Corporationhttp://www.hindawi.com Volume 2014
Research and TreatmentAIDS
Hindawi Publishing Corporationhttp://www.hindawi.com Volume 2014
Gastroenterology Research and Practice
Hindawi Publishing Corporationhttp://www.hindawi.com Volume 2014
Parkinson’s Disease
Evidence-Based Complementary and Alternative Medicine
Volume 2014Hindawi Publishing Corporationhttp://www.hindawi.com