copyright 2020, mark d. mayo
TRANSCRIPT
Estimating Cotton Yield in Breeder Plots Using Unmanned Aerial Vehicle (UAV)
Imagery
by
Mark Douglas Mayo, B.S.
A Thesis
In
Plant and Soil Science
Submitted to the Graduate Faculty
of Texas Tech University in
Partial Fulfillment of
the Requirements for
the Degree of
MASTER OF SCIENCE
Approved
Dr. Glen Ritchie
Chair of Committee
Dr. Carlos Portillo-Quintero
Dr. Wenxuan Guo
Mark Sheridan
Dean of the Graduate School
December, 2020

Copyright 2020, Mark D. Mayo

Texas Tech University, Mark D. Mayo, December 2020
ii
ACKNOWLEDGEMENTS
I would like to thank Dr. Glen Ritchie, as a non-traditional student, graduate
school has been quite challenging. Dr. Ritchie has guided me through this process and
made it as straightforward as it can be. I would also like to thank the other members of
my committee, Dr. Carlos Portillo-Quintero, and Dr. Wenxuan Guo.
I would like to acknowledge Jay Pendergrass, Corey Thompson, Will Dodge,
Ryan Gregory, Tanner Drake, Jared White, and Kendall Boyd, for their assistance. I
would also like to thank my parents Darrell and Nancy Mayo, my mother-in-law Sue
Ward, for their support and encouragement along this path. Also, my daughter Dr.
Lindsay Mayo-Fincher without her inspiration, I might not have committed myself to
this task. I would like to say a special “Thank You” to my wife Rhonda for her endless
love and support.
Lastly, I would like to thank BASF for the financial support and allowing me
to continue my education.

Texas Tech University, Mark D. Mayo, December 2020
iii
TABLE OF CONTENTS
ACKNOWLEDGEMENTS .............................................................................. ii
ABSTRACT ....................................................................................................... iv
LIST OF TABLES ............................................................................................. v
LIST OF FIGURES .......................................................................................... vi
CHAPTER I ....................................................................................................... 1
LITERATURE REVIEW ................................................................................. 1
CHAPTER II ...................................................................................................... 7
ESTIMATING COTTON YIELD USING UAV IMAGERY ....................... 7
2.1 Introduction .......................................................................................................... 7
2.2 Materials and Methods ......................................................................................... 9
2.2.1 Field Data Locations ..................................................................................... 9
2.2.2 Hardware ..................................................................................................... 16
2.2.3 Image Analysis ............................................................................................ 16
2.2.4 Evaluation of Nursery Material ................................................................... 19
2.3 Results and Discussion ....................................................................................... 19
2.4 Conclusions ........................................................................................................ 26
REFERENCES ................................................................................................. 41

Texas Tech University, Mark D. Mayo, December 2020
iv
ABSTRACT
Traditionally, cotton breeding programs have depended on mechanical harvest
of small breeding plots to evaluate cultivars for lint yield. The primary limiting factor
in testing of breeding lines is the time and equipment costs associated with harvest;
large increases in a testing programs plot-load are not possible without additional
investment. UAVs may provide a method to evaluate early-generation progeny rows
and increase the overall volume of material evaluated without additional investment in
harvest equipment. Unmanned Aerial Vehicles (UAVs) are commonly used for high-
resolution imagery and have become popular for cotton (Gossypium hirsutum L.)
phenotyping. Advancements in UAV imagery and image analysis may enable cotton
researchers to advance cultivars based on UAV imagery yield estimates. This study
was designed to evaluate methods of cotton lint yield estimation using UAV imagery
collected before mechanical harvest. This study was conducted using data from three
cotton breeding regions, Coastal Bend, High Plains, and Rolling Plains. Images were
classified for pixel counts of lint, and boll counts were acquired by counting each
contiguous group of lint pixels. Boll counts were found to be more closely correlated
with harvested yield and visual ratings, suggesting that UAV boll counting methods
may be appropriate for large-scale field breeding trials. UAV yield estimates were
further enhanced when data was limited to analysis within pedigrees, suggesting that
aerial imagery can be useful for advancement of early-generation cultivars as an
alternative to traditional mechanical plot harvest.
Texas Tech University, Mark D. Mayo, December 2020
v
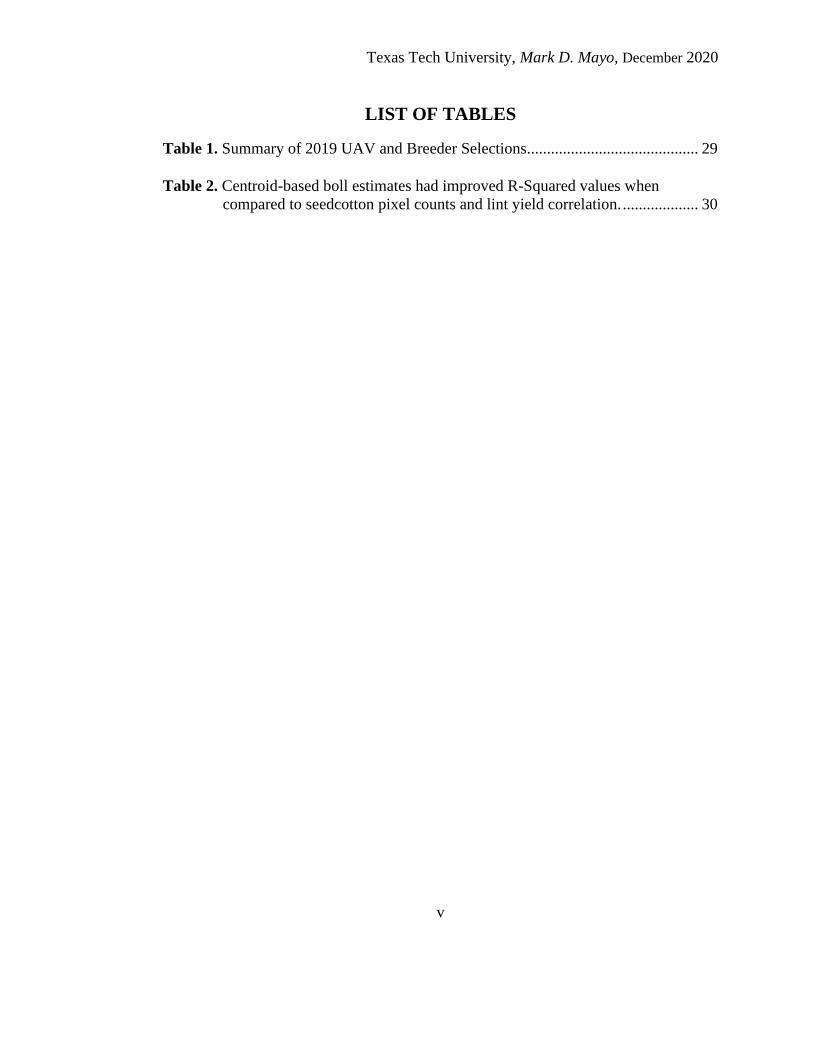
LIST OF TABLES
Table 1. Summary of 2019 UAV and Breeder Selections........................................... 29
Table 2. Centroid-based boll estimates had improved R-Squared values when
compared to seedcotton pixel counts and lint yield correlation. ................... 30

Texas Tech University, Mark D. Mayo, December 2020
vi
LIST OF FIGURES
Figure 1. Stages of Image Classification...................................................................... 31
Figure 2. Distribution of progeny row selections by method and filtered by
pedigree (germplasm_2) and (germplasm_3). .............................................. 32
Figure 3. Variable Yield and Similar Pixel counts: A (1477 kg ha-1, 23536
pixels), B (1974 kg ha-1, 23645 pixels). ........................................................ 33
Figure 4. Variable Pixel Counts and Similar Yield: A (1491 kg ha-1, 24123-
pixels), B (1452 kg ha-1, 45645-pixels). ........................................................ 34
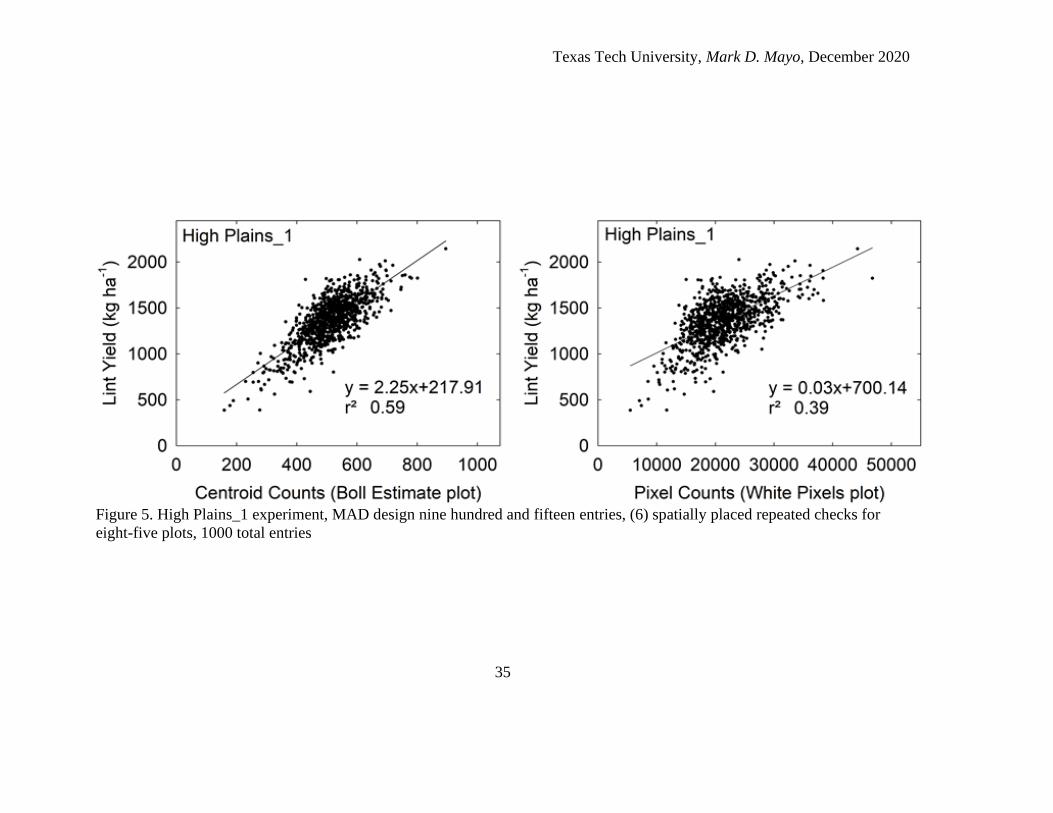
Figure 5. High Plains_1 experiment, MAD design nine hundred and fifteen
entries, (6) spatially placed repeated checks for eight-five plots, 1000
total entries .................................................................................................... 35
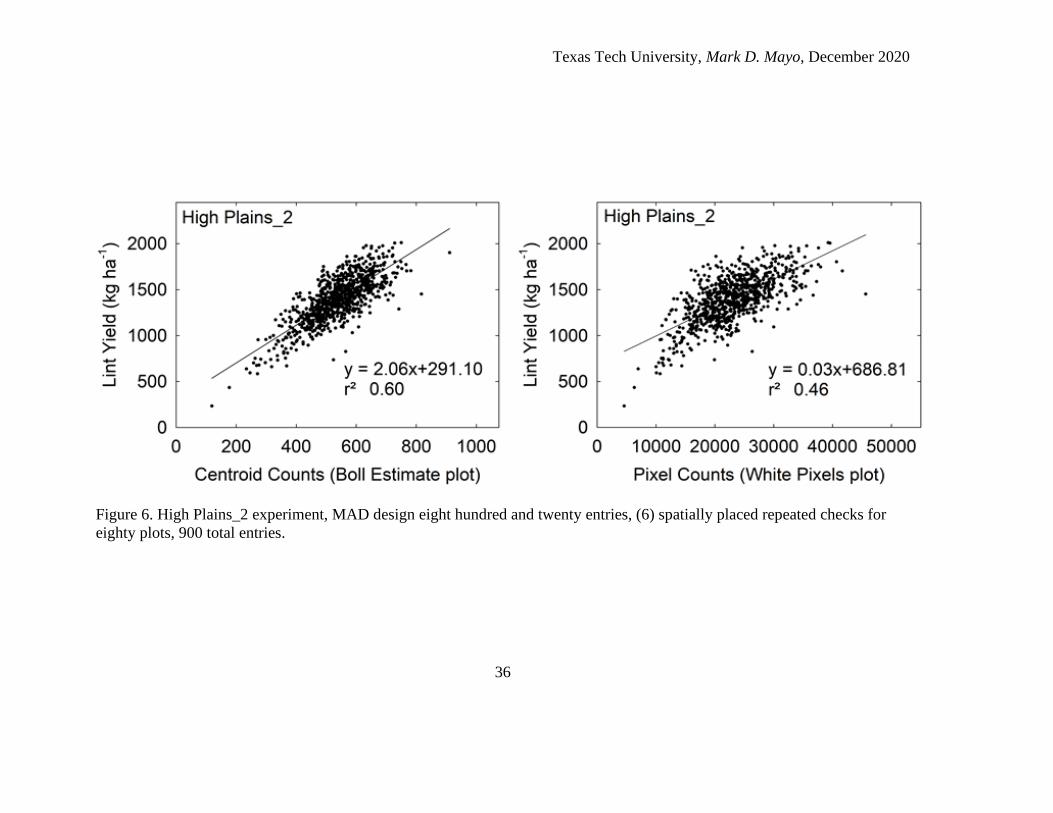
Figure 6. High Plains_2 experiment, MAD design eight hundred and twenty
entries, (6) spatially placed repeated checks for eighty plots, 900 total
entries. ........................................................................................................... 36
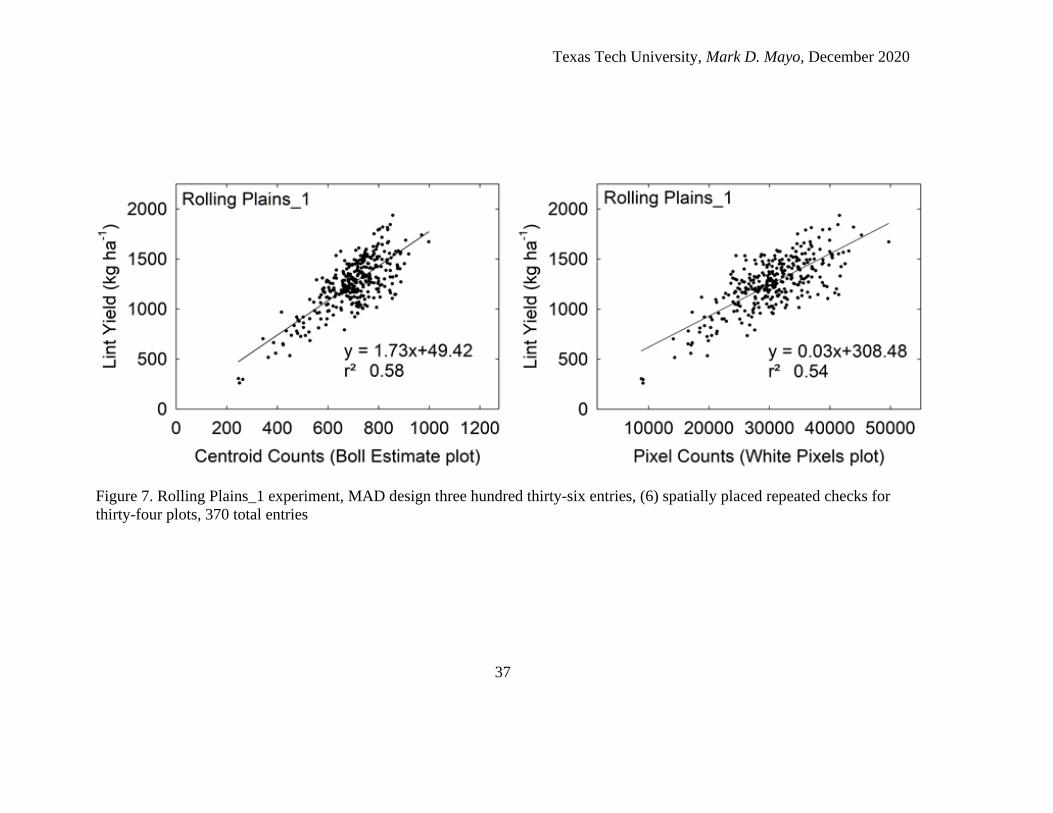
Figure 7. Rolling Plains_1 experiment, MAD design three hundred thirty-six
entries, (6) spatially placed repeated checks for thirty-four plots, 370
total entries .................................................................................................... 37
Figure 8. Coastal Bend_1 experiment, RCBD design, three replications, forty-
two entries, 126 total plots. ........................................................................... 38
Figure 9. Coastal Bend_2 experiment, RCBD design, three replications, forty-
two entries, 126 total plots. ........................................................................... 39
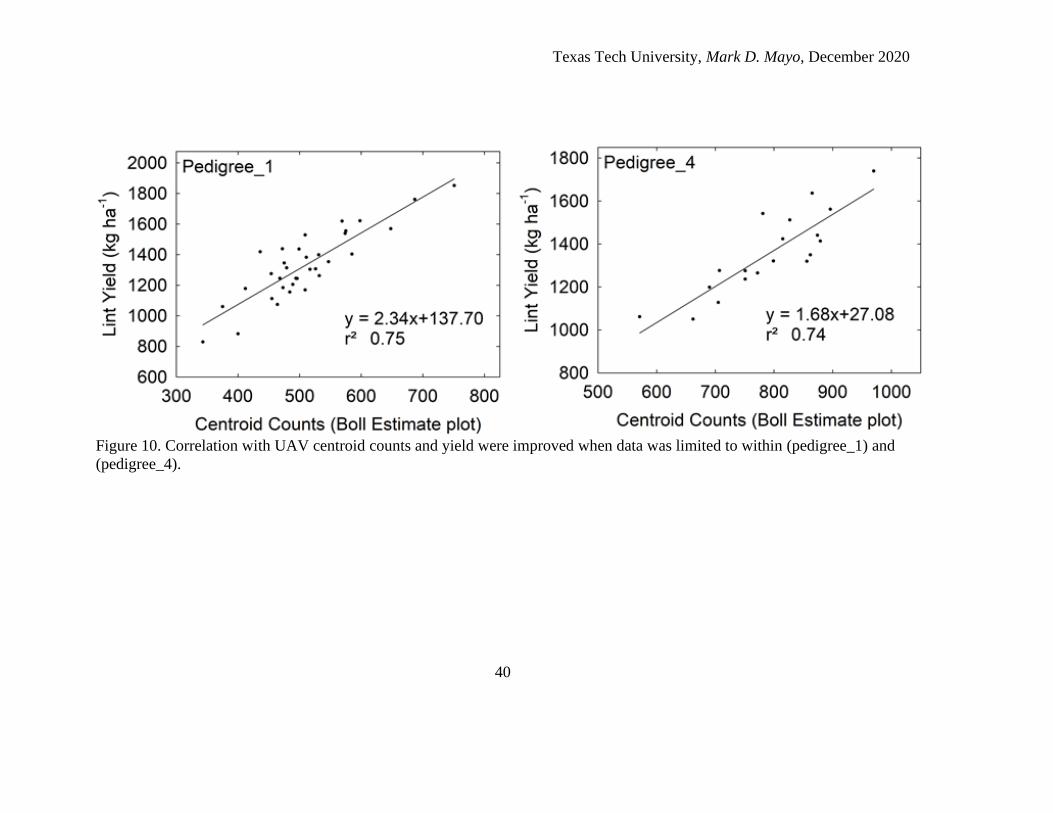
Figure 10. Correlation with UAV centroid counts and yield were improved
when data was limited to within (pedigree_1) and (pedigree_4). ................. 40

Texas Tech University, Mark D. Mayo, December 2020
1
CHAPTER I
LITERATURE REVIEW
Yield has been the primary selection factor for row crops, including upland
cotton (Gossypium hirsutum L.). However, cotton breeding programs were relatively
small until the 1990s, because producers retained and processed cottonseed from the
previous harvest, a practice that provided “farmer-caught” or “brown-bag” seed. This
process was protected under the Plant Variety Protection Act (Act 1970). Commercial
delinting companies provided bulk fuzzy seed transportation, acid delinting, seed
cleaning, seed treating, and finished bag storage. The seed production system kept
producer seed costs low, but it also discouraged investment in seed technology from
larger corporate partners (Alston and Venner 2002).
The seed companies with breeding programs in the Texas High Plains were
restricted in scope due to the limitations of the Texas High Plains seed sales market,
and cotton breeding programs included nursery plots and yield trials with limited
numbers of testing lines. The primary method of cultivar selection for advancement
was visual observation. Genetic lines were subjected to multi-location yield trials later
in the advancement process to test yield stability over a variety of environments, but
the volume of yield plots was limited by several factors, including yield evaluation
cost per-plot, available personnel, and harvest equipment. Because the Texas High
Plains was the center of cotton production in the United States, minimal resources

Texas Tech University, Mark D. Mayo, December 2020
2
were focused on other cotton-growing regions, including the Rolling Plains,
Blacklands, and Coastal Bend regions of Texas.
The introduction of transgenic cotton in the Texas High Plains was popular
among producers, allowing the use of new herbicides and decreasing insect pressure.
In 1998, cotton growers on the Texas High Plains planted approximately 1.4 million
acres of Roundup Ready® cotton (White, Jones et al. 2000). The success of the
original transgenic technologies in the High Plains market increased corporate
investment in cotton research. Cotton breeding programs were expanded as well as
cotton yield testing programs (Rochester and Constable 2015). However, a new
limitation emerged with larger testing programs: the time-consuming process of plot
harvests in cotton limited how many plots could be grown and harvested.
Because cotton cultivars, or genotypes interact with diverse growing
environments in various ways, a reliable testing program is required in order to
evaluate the G x E interaction (Bednarz, Nichols et al. 2006). The testing program
would evaluate the available genetic material across locations, within the regions of
interest, and over multiple years. The stability of testing locations, year to year, would
deliver data reliability, which would provide breeders with the best information
available to make germplasm advancement decisions.
Modern cotton breeding programs consist of companion counter season
nursery increase programs that create tens of thousands of cultivars for each regional
breeding program each year. This germplasm must be evaluated each year, and
advancement decisions must be made. Approximately eighty percent of this material

Texas Tech University, Mark D. Mayo, December 2020
3
will be discarded. Currently, field observations by plant breeders are used to evaluate
early generation nursery material, which can be a subjective approach to germplasm
selection. Advancement decisions should be made with quantitative, not qualitative
data.
The advanced germplasm will move into the testing program to be evaluated
for yield using mechanical harvest during the next stage of yield testing. The testing
program’s capacity for mechanical yield evaluation is limited by the amount of
investment in harvest equipment. Commercial harvest equipment is modified to
temporarily interrupt the flow of seedcotton and obtain a plot weight (Maja, Campbell
et al. 2016). This process is repeated thousands of times each season. Support
equipment such as cotton module builders and boll buggies are required to maintain
harvest efficiency. The seasonal output of an efficient harvest team should be
approximately fifteen-thousand plots per-cotton-harvester. Large increases in the
amount of germplasm to be evaluated will not be possible without the additional
acquisition of harvest equipment and personnel to operate. Each harvest crew has daily
limitations on production based on harvest capacity and potential problems: weather,
mechanical breakdowns, delays due to transportation of equipment.
To eliminate the restrictions of mechanical yield evaluation, the possibilities
for yield estimation with remote sensing should be evaluated. Remote sensing in
cotton has been conducted for many years. Advancements in platforms and instrument
technology have had direct effects on the usage and accuracy of remote sensing. Early
studies focused on solar reflectance measurements using stationary modular systems

Texas Tech University, Mark D. Mayo, December 2020
4
built to support multimodular radiometer (MMR) used to separate light into its
component wavelengths (Huete and Jackson 1988). Satellite and airplanes have been
utilized as platforms to estimate ground cover fraction (GCF) (Maas and Rajan 2008,
Rajan and Maas 2009). A tethered blimp was utilized to collect aerial imagery to
estimate GCF in cotton using Normalized Difference Vegetative Index (NDVI)
(Ritchie, Sullivan et al. 2010). Previous studies were performed to evaluate off-the-
shelf cameras for determining visible and near-infrared (NIR) radiation (Ritchie,
Sullivan et al. 2008) also using a tethered blimp for a platform. Stationary towers have
also been used for remote sensing in crops, Smartfield™ FIT System allows for
precise data capture throughout the season. Canopy temperature can be obtained on
hundreds of individual plots. Mobile phenotyping platforms have been designed to
facilitate the simultaneous use of multiple sensors to collect phenotyping data such as
plant height, canopy temperature, and NDVI measurements, using the Global
Positioning System (GPS) for plot location identification. The Lee Agra 3218-GM
open rider sprayer (Lee Spider, Lubbock, TX, US) has been a popular mobile platform
(Enciso, Maeda et al. 2017, Thompson, Guo et al. 2019). Aerial-based platforms for
remote sensing are fixed-wing and rotary-wing. Fixed-wing UAVs are not commonly
used for small plot data but have greater application for commercial farm-to-crop
analysis. Rotary wing UAVs have become the most used platform for small plot data.
Rotary wing UAVs can self-land, and flight plans can be created with downloadable
applications that can control height, speed, and overlap (Pabuayon, Sun et al. 2019).

Texas Tech University, Mark D. Mayo, December 2020
5
They have limited payload capacity and flight times up to 30 minutes per battery
charge, flight times can be extended with the use of multiple batteries.
Vegetation indices (VI) are derived from reflectance data and can be utilized to
estimate the growth stage of the cotton crop such as leaf area index or ground cover
fraction. VI measurements taken early in the crop growth cycle can provide
quantitative data for key traits of interest like seedling emergence, and seedling vigor.
Cultivars with improved emergence and seedling vigor have increased marketability in
a wider range of growing regions (Pendergrass 2019). VI measurements can be used to
estimate yield, increased plant height has been shown to correlate with increased lint
yield (Bechere, Zeng et al. 2014) in limited irrigation environments. When VI ratings
begin to decline these measurements may be used to estimate maturity or
susceptibility to disease.
High Throughput Phenotyping (HTP) has also been the focus of UAV imagery
in cotton. Frequent flights during peak bloom can provide estimates of physiological
maturity between cultivars, based on peak bloom counts. Thermal imagery can be
used to estimate canopy temperature, and this information might be a predictor of
drought response (Drake 2019).
The next logical step for UAV imagery should include mapping end-of-season
phenotypic traits and estimating yield (Ball and Konzak 1993). The low cost of UAV
imagery when compared to mechanical harvest methods creates an advantage for
UAV technology (Schirrmann, Giebel et al. 2016). Technological improvements are
increasing rapidly for UAVs and UAV sensor capability (Pabuayon, Sun et al. 2019).
Texas Tech University, Mark D. Mayo, December 2020
6
UAV imagery is non-destructive, UAV yield estimates can be verified by utilizing
mechanical harvest data from breeder plots. Cotton breeding programs should not
limit germplasm evaluation based on the current restrictions of mechanical plot
harvest limitations.

Texas Tech University, Mark D. Mayo, December 2020
7
CHAPTER II
ESTIMATING COTTON YIELD USING UAV IMAGERY
2.1 Introduction
Yield is the primary selection factor for cultivar advancement in upland cotton
(Gossypium hirsutum L.). The Texas High Plains can be a difficult environment for
cotton breeding due to the limited amount of harvest days each season. The expansion
of cotton breeding programs has steadily increased the volume of germplasm to be
mechanically evaluated for lint yield. An annual total of fifteen thousand plots-per-
harvester should be considered a reasonable output in a testing program. Mechanical
difficulties and weather conditions can create challenges in daily productivity. Cost-
per-plot is another factor to consider while planning trial locations, although cost
analysis is dependent upon many factors and can be difficult to measure. Long-term
investment in equipment and personnel is critical for stability in a testing program.
Volumetric increases of germplasm to be mechanically evaluated will require
additional harvest equipment and personnel.
Remote sensing has been used in cotton for many years and measurements
based on vegetation indices have been a staple of biomass estimation. Advancements
in platforms and instrument technology have had direct affects on the increased usage
and accuracy of remote sensing. The next logical step for UAV imagery should
include mapping end-of-season phenotypic traits and estimating yield. Two methods
of yield estimation were used in this study; pixel counts of lint, and centroid-based

Texas Tech University, Mark D. Mayo, December 2020
8
boll estimates derived from contiguous groups of lint pixels, both methods had
positive linear relationships with lint yield.
The low cost of data acquisition and analysis is an advantage for UAV
technology when compared to the mechanical harvest of breeder plots. UAV imagery
is non-destructive, and verification of data can be proven prior to large-scale use.
Cotton breeding programs should not limit the volume of germplasm due to
mechanical plot harvest limitations. Breeding programs develop thousands of unique
lines, or cultivars for evaluation each breeding cycle. These cultivars must be
evaluated and either advanced to the next level of testing or discarded to make room
for the next group of germplasm. Early generation yield trials are focused on the
identification and elimination of poor performing cultivars, not necessarily
establishing a linear performance ranking of the germplasm.
UAV yield estimates can be used to advance cultivars to the next stage of
evaluation. Visual observation has long been the accepted method of germplasm
advancement in breeding nurseries. UAV yield estimates can be used to identify
superior cultivars with the same or similar pedigree lineage. Remote sensing yield
estimates can provide alternative solutions to the limitations of mechanical plot
harvest and minimize errors in germplasm advancement using visual advancement.
This study had the following objectives:
1. Compare lint pixel counts with centroid-based boll identification methods
to determine the more robust method of estimating yield in multiple cotton
breeding pedigrees.
Texas Tech University, Mark D. Mayo, December 2020
9
2. Determine the effect of pedigree on the boll estimate-yield relationship.
3. Test the relationship among locations to determine what adjustments might
be necessary based on the growth habits of the crop.
2.2 Materials and Methods
2.2.1 Field Data Locations
To evaluate the repeatability and precision across variable environments, UAV
imagery was collected before the mechanical harvest of small breeding plots, in three
cotton breeding regions, Coastal Bend, High Plains, and Rolling Plains. Each region
utilizes agronomic practices that affect the growth pattern of the crop. Irrigation
accessibility and rainfall will encourage high yielding locations, or in some cases, lack
of access to irrigation or rainfall will result in low-to-moderate yielding locations. This
variability should be identified to determine if UAV yield estimates can be used across
cotton-growing regions.
The Coastal Bend testing sites were in Nueces County, one near Corpus Christi
(27.675° Latitude, -97.454° Longitude, Elevation 7 m asl), with the other location
being near the community of Chapman Ranch (27.622° Latitude, -97.552° Longitude,
Elevation 12 m). The Coastal Bend locations were rainfed and were within 20 miles of
each other. The soil type at Corpus and Chapman was a Southern Blackland Victoria
Clay with 0 to1 percent slopes (Fine, smectitic, hyperthermic Sodic Haplusterts)
(USDA 2008). Plot dimensions at both locations were 2.0 m wide by 9.1 m in length,
with 1.0 m row spacing. The alley width between plots was 1.5 m. The Corpus site
Texas Tech University, Mark D. Mayo, December 2020
10
was planted on March 22, 2019, and the Chapman site was planted on March 26,
2019. Both locations had a seeding rate of 105,000 seed ha-1, and adequate soil
moisture that produced uniform stands across all experiments. Conventional tillage
and herbicides were utilized for weed control and as-needed hand weeding was
performed to maintain weed-free plots. The Coastal Bend locations received greater
than average soil moisture during early-season planting and stand establishment
period. Plant growth regulators (PGR) were utilized to control vegetative growth, two
applications of mepiquat chloride (Pix by Arysta LifeScience) were made at a rate of
0.58 L ha−1, the first at pin-head square, and the second at first bloom. However, dry
conditions during the boll-filling period limited the crop to average yields across the
area. PGR applications along with limited soil moisture, reduced the vegetative growth
of the crop, creating excellent conditions for UAV yield estimates. Corpus and
Chapman locations received harvest aid treatments. Complete defoliation required two
spray applications, the first treatment was on August 3, 2019, a tank mix application of
ethephon and cyclanilide (Finish 6 Pro by Bayer CropScience) at a rate of 1.75 L ha−1
and thidiazuron and diuron (Ginstar by Bayer CropScience) at a rate of 0.58 L ha−1,
and a final burndown application of paraquat (Gramoxone 3SL by Syngenta) at a rate
of 1.75 L ha−1 was made on August 10, 2019. The UAV data collection was conducted
nine days after the initial defoliation application at both testing locations. Mechanical
plot harvest was completed at the Corpus and Chapman locations on August 14, 2019,
and August 18, 2019, respectively.
Texas Tech University, Mark D. Mayo, December 2020
11
UAV imagery was collected on a component line trial, this experiment was
comprised of twenty-seven sister-lines derived-from a common pedigree and fifteen
commercial lines as checks. The experiment design was Randomized Complete Block
(RCB) it contained forty-two entries and was replicated three times at each location.
The Corpus site was named Coastal Bend_1, and the Chapman site was named Coastal
Bend_2. The mean yield of Coastal Bend_1 was 1266 kg ha-1 and the mean yield of
Coastal Bend_2 was 1341 kg ha-1. The similarities among the Coastal Bend locations
such as, agronomic practices, soil type, crop height and stature, crop harvest
conditioning and defoliation method, proximity to each other, and solar radiation at
the time of UAV flight, resulted in UAV imagery data analysis that was very
repeatable across both locations and experiments.
The cotton-growing region across the High Plains in the 2019 crop year
experienced a multitude of environmental conditions. Cool soils with ample moisture
created difficulties obtaining uniform stand establishment across field experiments.
Severe weather conditions in the form of high winds and damaging hailstorms
decimated thousands of acres of cotton across the High Plains growing region. And
lastly, the early-spring severe weather pattern was followed by drought conditions
which lasted for more than ninety days without measurable precipitation.
The Floydada testing site was located in Floyd County (33.920° Latitude, -
101.361° Longitude, Elevation 965 m). The soil type was Olton Clay Loam with 0 to 1
percent slopes, (Fine, mixed, superactive, thermic Aridic Paleustolls) (USDA 2016).
Plot dimensions were 2.0 m wide by 7.6 m in length, with 1.0 m row spacing. The

Texas Tech University, Mark D. Mayo, December 2020
12
alley width between plots was 1.5 m. Supplemental Irrigation was applied using sub-
surface drip tape, the drip tape was installed on 102-centimeter centers. The initial
planting date for the experiment was May 14, 2019 however, severe weather
comprised of hail and high winds destroyed the location on May 21, 2019. The trial
was re-planted on May 30, 2019, with a seeding rate of 109,000 seed ha-1. Adequate
soil moisture and warm soils produced uniform stands across all experiments.
Conventional tillage and herbicides were utilized for weed control and as-needed hand
weeding was performed to maintain weed-free plots. The irrigation and soil fertility
were managed for moderate yield. PGRs were utilized to control vegetative growth,
application of cyclanilide and mepiquat chloride (Stance by Bayer CropScience) was
made at a rate of 109 mL ha−1 at pin-head square. Crop maturity reached (4) nodes
above cracked boll (NACB) and harvest aid applications were made on October 10,
2019. A tank mix application of ethephon and cyclanilide (Finish 6 Pro by Bayer
CropScience) at a rate of 1.75 L ha−1 and thidiazuron and diuron (Ginstar by Bayer
CropScience) at a rate of 0.58 L ha−1. The location received a light frost on October
16, 2019, at Floydada. The UAV imagery was collected sixteen days after the initial
defoliation on October 26, 2019. The mechanical plot harvest was completed at the
Floydada location on November 1, 2019.
UAV imagery was collected on (2) preliminary level yield trials. Both trials
used an experimental design called Modified Augmented Design (MAD). This
experimental design consists of entries that are randomized and non-replicated, along
with replicated control cultivars (Schaalje, Lynch et al. 1987). The experiment named

Texas Tech University, Mark D. Mayo, December 2020
13
High Plains_1 consisted of 915 experimental cultivars and six spatially placed
repeating checks for a total of 1,000 entries. The experiment named High Plains_2
consisted of 820 experimental cultivars and six spatially placed repeating checks for a
total of 900 entries. The mean lint yield for High Plains_1 was 1368 kg ha-1 and 1394
kg ha-1 for High Plains_2. The UAV imagery was collected before any weather-related
event. The genetic material within these yield experiments contained variability for all
qualitative and quantitative traits e.g., boll type and lint yield.
An additional testing site was placed at Southland, Texas, located in Garza
County (33.362° Latitude, -101.538° Longitude, Elevation 921 m). The soil type at
this location was Acuff Loam with 0 to 1 percent slopes (Fine-loamy, mixed,
superactive, thermic Aridic Paleustolls) (USDA 2016). Plot dimensions were 1.02 m
wide by 3.05 m in length, with 1.02 m row spacing. The alley width between plots was
1.5 m. Supplemental irrigation was applied using sub-surface drip tape. The drip tape
was installed on 204-centimeter centers. This location was critical to the breeding
program’s success due to the sensitive nature of breeding nurseries and limited seed
quantities of cultivars, there was only enough seed on hand for (1) planting, no re-
plant seed was available. The planting date for this location was extended to the last
week of May to avoid severe weather, this is a common practice for this location. The
planting date for the breeding nursery was May 28, 2019. The seeding rate was 76,000
seed ha-1, adequate soil moisture and warm soils produced uniform stands across the
breeding nursery. On June 18, 2019, severe weather, comprised of hail and high
winds, damaged the breeding nursery, some plants were eliminated, and others were

Texas Tech University, Mark D. Mayo, December 2020
14
delayed in maturity. Conventional tillage and herbicides were utilized for weed control
and as-needed hand weeding was performed to maintain weed-free plots. The
irrigation and soil fertility were managed for moderate yield. PGRs were not utilized
due to the damaged condition of the breeding plots. Crop maturity reached (4) nodes
above cracked boll (NACB) and harvest aid applications were made on October 8,
2019. A tank mix application of ethephon and cyclanilide (Finish 6 Pro by Bayer
CropScience) at a rate of 1.75 L ha−1 and thidiazuron and diuron (Ginstar by Bayer
CropScience) at a rate of 0.58 L ha−1. The location received a light frost to further
condition the crop for harvest on October 13, 2019. The UAV imagery was collected
sixteen days after the initial defoliation on October 24, 2019. The Southland nursery
plots were commercially harvested mid-November after all visual phenotypic notes
were taken and advancement decisions were completed.
UAV imagery was collected on the breeding nursery. The nursery was planted
in a serpentine pattern, organized by pedigree with repeating checks for visual
comparisons of phenotypic traits. It consisted of six-thousand and ninety-two unique
cultivars and (5) spatially placed repeating checks for a total of six-thousand and
ninety-five entries. The UAV imagery was collected before any weather-related event.
The genetic material within the breeding nursery contained variability for all
qualitative and quantitative traits e.g., boll type and lint yield.
The Rolling Plains testing site was placed near Wall, Texas, located in Tom
Green County (31.382° Latitude, -100.266° Longitude, Elevation 566 m). The soil
type at this location was Angelo clay Loam, 0 to 1 percent slopes (Fine-silty, mixed,

Texas Tech University, Mark D. Mayo, December 2020
15
superactive, thermic Aridic Calciustolls) (USDA 2013). Plot dimensions were 1.98 m
wide by 7.62 m in length, with 0.99 m row spacing. The alley width between plots was
1.5 m. Supplemental Irrigation was applied using sub-surface drip tape, the drip tape
was installed on 0.99-centimeter centers. The location received pre-plant irrigation and
had adequate soil moisture for stand establishment. The location was planted on May
31, 2019. The location survived a severe weather event on June 1, 2019. This storm
contained winds over 112 km/h and the location received 16.5 cm of rain. The location
produced uniform stands across all experiments. The irrigation and soil fertility were
managed for moderate yield. PGRs were utilized to control vegetative growth, the
application of cyclanilide and mepiquat chloride (Stance by Bayer CropScience) was
made at a rate of 109 mL ha−1 at pin-head square, and again at peak bloom. The
location grew off well and developed uniform test plots. Conventional tillage and
herbicides were utilized for weed control and as-needed hand weeding was performed
to maintain weed-free plots. Crop maturity reached (4) nodes above cracked boll
(NACB) and harvest aid applications were made on October 18, 2019. A tank mix
application of ethephon and cyclanilide (Finish 6 Pro by Bayer CropScience) at a rate
of 1.75 L ha−1 and thidiazuron and diuron (Ginstar by Bayer CropScience) at a rate of
0.58 L ha−1. A final burndown application of paraquat (Gramoxone 3SL by Syngenta)
at a rate of 1.75 L ha−1 was made on October 25, 2019.
UAV imagery was taken ten days after the initial defoliation application on
October 28, 2019. UAV imagery was collected on (1) preliminary level yield trial. The
Rolling Plains_1 experiment design was MAD design, randomized, and non-

Texas Tech University, Mark D. Mayo, December 2020
16
replicated, consisting of 336 experimental cultivars and six spatially placed repeating
checks for a total of 370 entries. The Rolling Plains_1 experiment was comprised of
F2 generation cultivars, it contained one entry per pedigree, the purpose of this trial is
to assist breeders when evaluating the F4 derived F5 progeny rows. The mean lint
yield for Rolling Plains_1 was 1257 kg ha-1. The UAV imagery was collected before
any weather-related event. The genetic material within the breeding nursery contained
variability for all qualitative and quantitative traits e.g., boll type and lint yield.
2.2.2 Hardware
The UAV flight plans were implemented using DroneDeploy version 4.10
(DroneDeploy, Inc., San Francisco, CA). The UAV consisted of a DJI Inspire II fitted
with a Zenmuse X5S camera. Image resolution was defined using the ground sample
distance (GSD) of 0.64cm2/pixel. Flight altitude was 36.5m, and flight speed was
20.9km/h. Forward and side overlap was set to seventy-five percent. The UAV took
between five hundred to seven hundred-fifty images per location, these images were
stitched together to create an Orthomosaic map (Cardoso Arango and Louhaichi
2019). Agisoft Metashape was used to stitch images from the UAV (Agisoft LLC, St
Petersburg, Russia).
2.2.3 Image Analysis
GIS applications and image analysis were conducted using QGIS version 3.8
Zanzibar (QGIS 2018). Images were mapped to the WGS84 coordinate system, and
boundaries were constructed in QGIS around the rectangular plots using the vector

Texas Tech University, Mark D. Mayo, December 2020
17
create grid feature. After spatial and image analysis, datasets were exported to
Microsoft Excel.
Image analysis on harvest-ready cotton is unique, due to the contrast between
desired and undesired pixel color, cotton lint is white and can be easily identified. The
normal color image, as shown in Figure 1, consisting of red, green, and blue (RGB)
pixels is simply converted to a grayscale image. Next, the desired range of white
pixels is identified also in Figure 1. Then the values are set to a binary scale, undesired
pixels such as soil, shadows, or crop residue will be defined with a value = 0, desired
pixels such as cotton lint will be defined with a value = 1. Binary thresholding as a
system to classify UAV images is commonly used to differentiate between desired and
undesired pixels (Dodge 2019, Young, Mahan et al. 2020) The user must provide a
thresholding value that acts to determine whether a pixel will either be thresholded to
0 or 255 depending on whether the pixel intensity is either above or below the
threshold.
Thresholding identifies pixels based on brightness values, ranging from 0 to
255 for 8-bit images. The threshold brightness values were compared to determine a
threshold level that corresponded with a minimum of false positives (other material
classified as lint pixels) and false negatives (lint pixels that were not identified within
the threshold). Threshold values varied by location but were usually centered around a
brightness value of 195 in band 3 (blue). Visual verification was completed by using
the thresholded image as a mask to test for the over-or-under estimation of lint pixels.
The desired range of white pixels varies at each field data location. Environmental

Texas Tech University, Mark D. Mayo, December 2020
18
conditions at each location will influence the amount of solar reflectance that is
present at the time of data collection. The maturity level of the cotton crop will also
determine the level of brightness for lint classification. This process of image analysis
could be defined as “image classification using a determined binary threshold range”.
Lint pixel counts (value = 1) can now be extracted from the classified image.
Boll estimates are created by converting the classified grayscale raster (image)
to a vector (shape) file. Data filtering was performed before shapefile creation to
remove small clusters of lint pixels. These small groups of pixels may only represent a
single locule of seedcotton however, if they are not removed, they will be counted as a
complete boll. This modification was applied uniformly across the raster layer.
Next, the classified grayscale image was transformed, raster-to-vector. Small polygons
were created from each cluster of lint pixels, and larger polygons were created from
clusters of lint pixels that represented areas of overlapping bolls. To reduce errors in
the data, these large polygons were broken into smaller segments. Polygon
segmentation was applied uniformly across the vector layer, see segmentation in
Figure 1.
Polygon centroids were created to identify the center of each polygon, or
shape. A point or centroid was placed in each polygon. The centroid can be visually
identified and counted. Each centroid represents a complete cotton boll. To obtain a
boll estimate for each plot, centroid counts were extracted from the vector layer.
Visual verification of centroid-to-boll is shown in Figure 1. The centroid layer is
overlaid on the original RGB image for visual comparison.

Texas Tech University, Mark D. Mayo, December 2020
19
2.2.4 Evaluation of Nursery Material
The final stage of the breeding nursery contains F4 derived F5 progeny rows,
which provide the largest group of cultivars within each pedigree. This large group of
material will include over ten thousand cultivars and will be eliminated by up to eighty
percent. UAV imagery and analysis using centroid-based boll estimates were
compared with breeder advancements, based on visual observation, in the 2019
breeding nursery. The UAV progeny row selections were made independently of
breeder selections. In this study, the UAV advancement standards required cultivars to
contain a boll estimate of (+1 standard deviation) or greater than the population mean
(Figure 2) this threshold could be adjusted to obtain the desired level of advanced
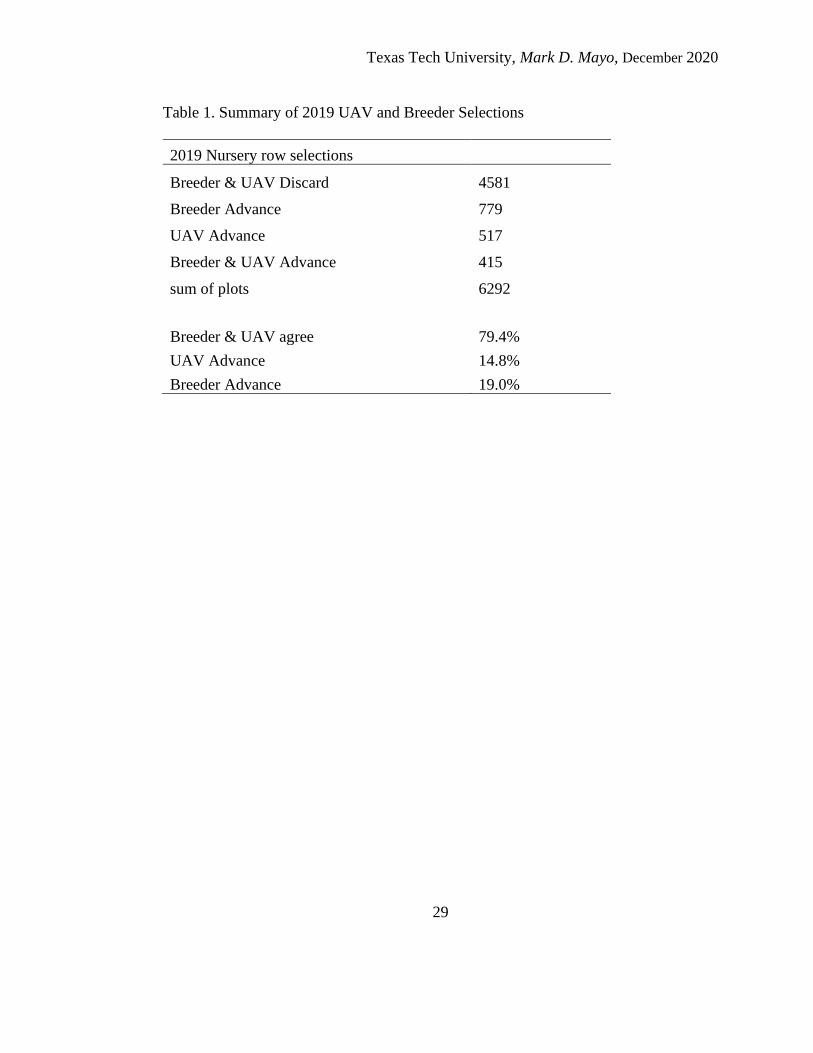
cultivars. UAV imagery and Breeder selections concurred on 79.4% of cultivars. UAV
imagery advanced only 14.8% of cultivars while breeders advanced 18.9% of
cultivars. Professional judgment by breeders allowed cultivars to be advanced based
on qualitative factors and perceived performance. The breeder’s selections required
two people and several weeks to complete, whereas the UAV imagery selections
required one person less than one day to complete. UAV imagery selections were
simply based on quantitative values. UAV imagery was more efficient than Breeder
selections and advanced cultivars without bias (Table 1).
2.3 Results and Discussion
Aerial imagery is susceptible to errors associated with both sensing and
identifying plant structures. These differences have been attributed to within-sensor

Texas Tech University, Mark D. Mayo, December 2020
20
noise, spatial sampling techniques, and the observation footprints of the sensors
(Weiss, Jacob et al. 2020), but also due to the ability of remote sensors to detect and
identify structures that are obscured within a scene. Cultivars with compact fruiting
patterns and stormproof bolls will contain cotton that is obscured by branches and
other plant structures, while cultivars with more open bolls or bolls on exterior fruiting
positions will be more visible to the sensors, resulting in relatively higher yield
estimation.
The examples are shown in Figure 3 and Figure 4 demonstrate the errors that
can occur with measurements of lint pixel counts to estimate cotton yield. An example
of this divergence between pixel counts and yield is shown from images acquired from
the combined High Plains_1 and High Plains_2 experiments. By combining the data
from both experiments the variability was increased for qualitative traits that affect
sensor visibility, like plant structure and boll type. Additionally, the variability was
increased for quantitative traits that affect lint yield such as, boll weight, seed weight,
and lint turnout.
The plots in Figure 3 had similar scaled white pixel counts, ranging from
23536 to 23645 pixels per plot, but Figure 3a had a yield of 1477 kg ha-1, and Figure
3b had a yield of 1974 kg ha-1. The cultivar represented in 3a appears to have open
type canopy, as well as an open boll type. The plot has a gap approximately three feet
in length and some variability for plant density. The cultivar represented in 3b has a
compact plant canopy, with a stormproof boll type. Also, plant uniformity is good
throughout the plot, this is a very productive plot.
Texas Tech University, Mark D. Mayo, December 2020
21
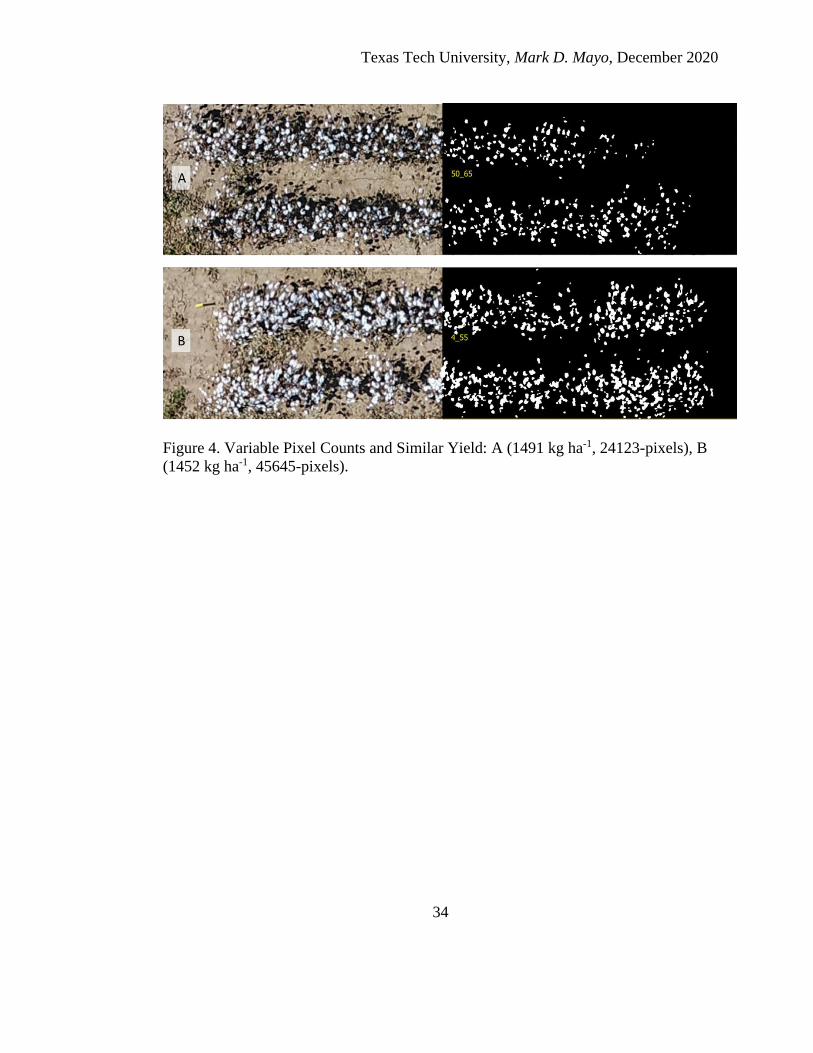
The plots in Figure 4 had similar scaled values for lint yield, ranging from
1452 to 1491 kg ha-1 with highly variable pixel counts. If we use the example shown
in 4a as a baseline at 24123 pixels-per-plot, 4b had almost twice the number of pixels
with 45645 pixels-per-plot. yet similar yields were recorded. The cultivar in 4a had an
open canopy, along with an open boll type. Some alley effect is apparent (Holman and
Bednarz 2001), as well as a missing portion of one row approximately three feet in
length. This cultivar had a value of 0.43 percent lint. The cultivar represented in figure
4b is an open plant structure, with an open boll type. Lint string-out is visibly inflating
the amount of pixels-per-boll. The fruiting pattern for this cultivar seems to be
accentuated to the exterior of the canopy. Plant density per-plot is marginal, with some
small gaps. This cultivar had a value of 0.41 percent lint, this lower value would
reduce lint yield. Percent lint is an important contributor to lint yield. (Meredith Jr and
Bridge 1973).
This type of visualization error also occurs when cotton breeders attempt to
select cultivars based solely on visual appearance (Bowman, Bourland et al. 2004).
The correlation of Centroid-based boll counts to lint yield had improved r2 values
when compared to lint pixel counts to lint yield correlation. This was consistent across
all experiments and locations (Table 2). Previous research on the yield components of
cotton has established that the volume of bolls per square meter to be a consistent
indicator of lint yield (Worley, Culp et al. 1974, Worley, Ramey et al. 1976, Jenkins,
McCarty et al. 1990, Bednarz, Bridges et al. 2000, Feng, Bufon et al. 2010, Jones, Joy
et al. 2014, Sharma, Mills et al. 2015).
Texas Tech University, Mark D. Mayo, December 2020
22
Findings from the High Plains_1 experiment are shown in Figure 5. The
scatterplot on the left shows the relationship between centroid-based boll estimates
and lint yield, and the scatterplot on the right shows the correlation of lint pixel counts
and lint yield. Both methods of UAV yield estimates are linear and are positively
correlated. However, centroid-based boll estimates have a stronger association with
lint yield than lint pixel counts. Boll estimates resulted in regression line with a greater
r2 value and fewer outliers when compared to pixel counts. The High Plains_1
experiment had an r2 value of 0.59 when boll estimates were compared to lint yield
and an r2 value of 0.39 when lint pixel counts were correlated to lint yield. Similar
results were found when analyzing the High Plains_2 experiment. Boll estimates and
lint yield were compared resulting in an r2 value of 0.60 and lint pixel counts were
compared with lint yield resulting in an r2 value of 0.46. The cultivars contained in the
experiments, High Plains_1 and High Plains_2 were advanced to preliminary stage
testing from the progeny row nursery in 2018, using visual selection, or professional
judgment. The genetic material within these yield experiments contained variability
for qualitative traits that will affect sensor visibility and increase within-sensor noise.
Also, these cultivars contained variability for quantitative traits that are correlated with
lint yield but cannot be identified with UAV imagery e.g., boll weight, lint percent
(Meredith Jr and Bridge 1973). Lint yield was highly variable for both experiments,
High Plains_1 ranged from (387 to 2144 kg ha-1) with a mean yield of 1367 kg ha-1,
and High Plains_2 ranged from (233 to 2011 kg ha-1) with a mean yield of 1394 kg ha-
1.

Texas Tech University, Mark D. Mayo, December 2020
23
Using the same configuration of scatterplots as in previous examples, the
Rolling Plains_1 experiment is shown in Figure 7. The scatterplot on the left
visualizes the relationship between centroid-based boll estimates and lint yield, and
the graph on the right shows the correlation of lint pixel counts to lint yield. Centroid-
based boll estimates and lint pixel counts correlated well with lint yield. Both methods
of UAV yield estimates were linear, with positively correlated associations and have
strong relationships with lint yield. Both methods of UAV yield estimates produced
acceptable results, boll estimates correlated with lint yield resulted in r2 value of 0.58,
lint pixels were compared to lint yield resulting in an r2 value of 0.54. Lint yield was
highly variable, Rolling Plains_1 ranged from (260 to 1937 kg ha-1) with a mean yield
of 1257 kg ha-1. This experiment was comprised of F2 generation cultivars and
contained one entry per pedigree. The purpose of this trial was to provide breeders
with quantitative yield data by specific pedigree for use when visually assessing these
same pedigrees as F4 derived F5 progeny rows (Tang, Jenkins et al. 1993).
Data from the Coastal Bend provided the strongest relationships for UAV
imagery. Centroid-based boll estimates, and lint pixel counts resulted in strong,
positive linear relationships when compared to mechanically harvested lint yield.
These results remained consistent for both Coastal Bend locations. The Coastal
Bend_1 experiment is shown in Figure 8. Both methods of UAV yield estimates
produced strong results, boll estimates correlated with lint yield resulted in r2 value of
0.88, and lint pixels were compared to lint yield resulting in an r2 value of 0.85. Lint
Texas Tech University, Mark D. Mayo, December 2020
24
yield was highly variable, Coastal Bend_1 ranged from (375 to 1849 kg ha-1) with a
mean yield of 1266 kg ha-1.
The Coastal Bend_2 experiment is shown in Figure 9. This location provided
similar observations between Coastal Bend_1 and Coastal Bend_2. The scatterplot on
the right visualizes the correlation of lint pixel counts to lint yield, resulting in an r2
value of 0.75. The scatterplot on the left represents the relationship between centroid-
based boll estimates and lint yield. This comparison resulted in an r2 value of 0.80.
Both methods of lint yield estimation provided strong, positive linear relationships
with mechanically harvested lint yield. Lint yield was highly variable, Coastal Bend_2
ranged from (400 to 2175 kg ha-1) with a mean yield of 1341 kg ha-1.
The consistent results obtained from the Coastal Bend locations could be
explained by the germplasm that made-up the experiments. The experiment was
comprised of twenty-seven sister-lines derived-from a common pedigree and fifteen
commercial lines as checks. The experiment design was Randomized Complete Block
(RCB) it contained forty-two entries and was replicated three times at each location.
UAV yield estimates had improved correlation with lint yield when the data was
limited to cultivars within the same or similar genetic backgrounds, or pedigrees.
Phenotypic traits that have a direct correlation with lint yields such as boll weight,
seed weight, and lint turnout are similar within these small genetic groups. Errors in
Aerial imagery due to within-sensor noise and identification of plant structures are
minimized when the data is limited to similar cultivars originating from a common
pedigree.

Texas Tech University, Mark D. Mayo, December 2020
25
The High Plains_1 experiment, was comprised of numerous cultivars from the
same or similar pedigrees. The number of cultivars derived-from a unique pedigree
within the experiment can range from as few as one to thirty or more lines. The
number of cultivars from each pedigree was not constant due to advancement
decisions based on qualitative traits and quantitative traits. To minimize field error, the
entries were randomized within the experiment. The correlation of boll estimates and
lint yield had an r2 value of 0.59 as shown in Figure 5. The limitations of aerial
imagery and UAV yield estimates can be minimized by limiting data analysis to
cultivars by germplasm type. The examples shown in (Figure 10) demonstrate
improved r2 values by germplasm, 0.75 for pedigree_1, and 0.74 for pedigree_4. The
scatterplots represent strong, positive linear relationships for boll estimates and lint
yield. The data points for Pedigree_1 were arranged in a linear pattern with some
points grouped ranging from 480 to 600 bolls, and lint yield of 1025 to 1575 kg ha-1.
Lint yield was highly variable for Pedigree_1, lint yields ranged from (829 to 1852 kg
ha-1) with a mean yield of 1331 kg ha-1. The data points for Pedigree_4 were arranged
in a linear pattern along the length of the regression line, a few outliers are apparent,
lint yield ranged from (1050 to 1740 kg ha-1) with a mean yield of 1355 kg ha-1. To
utilize the strengths of UAV imagery, the limitations of UAV imagery must be
defined. Data analysis, within germplasm categories, increases the accuracy of UAV
yield estimates.

Texas Tech University, Mark D. Mayo, December 2020
26
2.4 Conclusions
The first objective of this study was to determine if UAV imagery could be
used to estimate yield in small breeder plots, and determine which method was more
robust, boll estimates, or pixel counts. Centroid-based boll counts had improved r2
values when compared to lint pixel counts and lint yield correlation. This was
consistent across all regions and experiments.
The second objective was to determine the effect of pedigree on the boll
estimate-yield relationship. Pedigree has a significant effect on the correlation of
centroid and pixel counts with lint yield. Both centroid-based boll estimates, and lint
pixel counts had improved correlation with mechanically harvested yield, when the
data was limited to cultivars within the same or similar pedigrees. Phenotypic traits
that have a direct correlation with lint yields such as boll weight, seed weight, and lint
turnout are similar within these related genetic groups. Errors in aerial imagery due to
within-sensor noise and identification of plant structures are minimized when the data
is limited to similar cultivars originating from a common pedigree.
The final objective of this study was to test the relationship among locations to
determine what adjustments might be necessary based on the growth habits of the
crop. The environmental conditions throughout the growing season influence the
precision of UAV imagery. Field selection and agronomic practices should be in place
to encourage phenotypic uniformity across the experiment and the location. Plot
replication and blocking should be used to reduce field error across elevation changes,
soil types, or irrigation differences. The use of plant growth regulators should be
Texas Tech University, Mark D. Mayo, December 2020
27
utilized to encourage a compact fruiting pattern along with Integrated Pest
Management (IPM) program to minimize fruiting damage from insects. Also, an
Irrigation scheduling program to maintain plant health and boll set, without causing
excessive vegetative growth is suggested.
For optimum data accuracy, the UAV flight should be completed as soon as
possible after complete defoliation. Remaining plant tissue such as leaves, or small
branches will inhibit the visibility of the UAV imagery. Environmental factors such as
excessive wind, or rain can cause fragile lint to be shaken and pulled from the bolls
(Quisenberry, Dilbeck et al. 1980). UAV yield estimates are sensitive to these factors,
whereas mechanical harvesters, within limits, are not. Boll estimates were obtained
from shapefiles created from areas of lint pixels, open boll cultivars have larger areas
of lint and the image analysis will increase the number of perceived bolls per plot,
increasing the error in UAV yield estimates.
UAV yield estimates should be used as a complementary tool that is available
to researchers. Yield estimates may be useful for analysis of location statistics before
harvest. This may allow the prioritization of mechanical harvest by location, bringing
in the best data first, or elimination of a location, due to poor heritability across
experiments.
Mechanical plot harvest is reliant on the weather conditions of the day. Cotton
lint must be dry to enable the material to flow through the harvest equipment. A heavy
dew during the early morning hours can delay harvest up to two hours or more. Windy
conditions, which are common on the High Plains, will affect harvest weight accuracy

Texas Tech University, Mark D. Mayo, December 2020
28
and slow down weight stabilization and acquisition per plot. As the sun sets, relative
humidity increases, excessive humidity will cause inaccurate plot weights and
blockages of seedcotton. UAV imagery is also susceptible to the environment, but it
only requires a brief flight time per location for success.
UAV imagery should be used as a tool to assist breeders when advancing
progeny rows to preliminary yield trials. Timeliness of progeny row selection with
UAV analysis may allow more breeding plots to be planted. Advancement decisions
of progeny rows are based on quantitative values, increasing the mean yield of
cultivars in preliminary experiments, which may ultimately improve the breeding
programs' genetic gain (Schwartz and Smith 2008).
Remote sensing yield estimates could reduce the harvest area in an offsite
location to a calibration area. This data could be used to calibrate UAV imagery and
verify the data accuracy. Resulting in an overall reduction in the volume of material to
be mechanically harvested and increasing the overall volume of genetic material to be
evaluated by the breeding program. The improvement in germplasm selection and
increase in germplasm volume should increase the breeding programs’ genetic gain.
Texas Tech University, Mark D. Mayo, December 2020
29
Table 1. Summary of 2019 UAV and Breeder Selections
2019 Nursery row selections
Breeder & UAV Discard 4581
Breeder Advance 779
UAV Advance 517
Breeder & UAV Advance 415
sum of plots 6292
Breeder & UAV agree 79.4%
UAV Advance 14.8%
Breeder Advance 19.0%

Texas Tech University, Mark D. Mayo, December 2020
30
Table 2. Centroid-based boll estimates had improved R-Squared values when
compared to seedcotton pixel counts and lint yield correlation.
Region and Experiment Lint Yield / Centroid
Counts r2
Lint Yield / Pixel
Counts r2
High Plains_1
High Plains_2
Rolling Plains_1
Coastal Bend_1
Coastal Bend_2
0.59
0.60
0.58
0.88
0.80
0.39
0.46
0.54
0.85
0.75

Texas Tech University, Mark D. Mayo, December 2020
31
Figure 1. Stages of Image Classification

Texas Tech University, Mark D. Mayo, December 2020
32
Figure 2. Distribution of progeny row selections by method and filtered by pedigree (germplasm_2) and (germplasm_3).

Texas Tech University, Mark D. Mayo, December 2020
33
Figure 3. Variable Yield and Similar Pixel counts: A (1477 kg ha-1, 23536 pixels), B
(1974 kg ha-1, 23645 pixels).
Texas Tech University, Mark D. Mayo, December 2020
34
Figure 4. Variable Pixel Counts and Similar Yield: A (1491 kg ha-1, 24123-pixels), B
(1452 kg ha-1, 45645-pixels).
Texas Tech University, Mark D. Mayo, December 2020
35
Figure 5. High Plains_1 experiment, MAD design nine hundred and fifteen entries, (6) spatially placed repeated checks for
eight-five plots, 1000 total entries
Texas Tech University, Mark D. Mayo, December 2020
36
Figure 6. High Plains_2 experiment, MAD design eight hundred and twenty entries, (6) spatially placed repeated checks for
eighty plots, 900 total entries.
Texas Tech University, Mark D. Mayo, December 2020
37
Figure 7. Rolling Plains_1 experiment, MAD design three hundred thirty-six entries, (6) spatially placed repeated checks for
thirty-four plots, 370 total entries

Texas Tech University, Mark D. Mayo, December 2020
38
Figure 8. Coastal Bend_1 experiment, RCBD design, three replications, forty-two entries, 126 total plots.

Texas Tech University, Mark D. Mayo, December 2020
39
Figure 9. Coastal Bend_2 experiment, RCBD design, three replications, forty-two entries, 126 total plots.
Texas Tech University, Mark D. Mayo, December 2020
40
Figure 10. Correlation with UAV centroid counts and yield were improved when data was limited to within (pedigree_1) and
(pedigree_4).
Texas Tech University, Mark D. Mayo, December 2020
41
REFERENCES
Act, P. V. P. (1970). "US Code, vol. 7 (1970)." Statutes at Large 84.
Alston, J. M. and R. J. Venner (2002). "The effects of the US Plant Variety Protection
Act on wheat genetic improvement." Research Policy 31(4): 527-542.
Bednarz, C., et al. (2006). "Plant Density Modifications of Cotton Within-Boll Yield
Components." Crop Science 46(5): 2076-2080.
Bednarz, C. W., et al. (2000). "Analysis of cotton yield stability across population
densities." Agronomy Journal 92(1): 128-135.
Bowman, D. T., et al. (2004). "Visual selection for yield in cotton breeding programs."
J. Cotton Sci 8(2): 62-68.
Cardoso Arango, J. A. and M. Louhaichi (2019). Protocol for data collection and
processing from UAVs imagery using OpenDroneMap, International Center for
Tropical Agriculture.
Dodge, W. G. (2019). Image Based Yield Estimation in Cotton Using UAS.
Drake, T. S. (2019). Effects of Cultivar and Irrigation on In-Season Fruit
Accumulation and Retention.
Enciso, J., et al. (2017). "A ground based platform for high throughput phenotyping."
Computers and Electronics in Agriculture 141: 286-291.
Feng, L., et al. (2010). "Effects of Irrigation and Plant Density on Cotton Within-Boll
Yield Components." Agronomy Journal 102(3): 1032-1036.
Holman, E. M. and C. W. Bednarz (2001). "Alley effect on several cotton cultivars in
small plot research." Communications in soil science and plant analysis 32(1-2):
119-126.
Texas Tech University, Mark D. Mayo, December 2020
42
Huete, A. and R. Jackson (1988). "Soil and atmosphere influences on the spectra of
partial canopies." Remote Sensing of Environment 25(1): 89-105.
Jenkins, J. N., et al. (1990). Fruiting efficiency in cotton: Boll size and boll set
percentage. Crop Science, Crop Science. 30: 857-860.
Jones, W., et al. (2014). "Within-Boll Yield Components and Fiber Traits of Upland
Cotton." Crop Science: 1057-1061.
Maas, S. J. and N. Rajan (2008). "Estimating ground cover of field crops using
medium‐resolution multispectral satellite imagery." Agronomy Journal 100(2):
320-327.
Maja, J. M. J., et al. (2016). Predicting cotton yield of small field plots in a cotton
breeding program using UAV imagery data. Autonomous Air and Ground
Sensing Systems for Agricultural Optimization and Phenotyping, International
Society for Optics and Photonics.
Meredith Jr, W. R. and R. Bridge (1973). "Recurrent Selection for Lint Percent within
a Cultivar of Cotton (Gossypium hirsutum L.) 1." Crop Science 13(6): 698-701.
Pabuayon, I. L. B., et al. (2019). High-throughput phenotyping in cotton: a review.
Journal of Cotton Research, Journal of Cotton Research.
QGIS (2018). "QGIS-A Free and Open Source Geographic Information System."
Version 3.8. 0, Computer software.
Quisenberry, J., et al. (1980). "Stormproof Boll in Upland Cotton. II. Heritability and
Agronomic Relationships 1." Crop Science 20(3): 387-389.
Rajan, N. and S. J. Maas (2009). "Mapping crop ground cover using airborne
multispectral digital imagery." Precision agriculture 10(4): 304-318.
Ritchie, G., et al. (2008). "Preparation of a low-cost digital camera system for remote
sensing." Applied engineering in agriculture 24(6): 885-894.
Texas Tech University, Mark D. Mayo, December 2020
43
Ritchie, G., et al. (2010). "Sensitivities of normalized difference vegetation index and
a green/red ratio index to cotton ground cover fraction." Crop Science 50(3):
1000-1010.
Rochester, I. and G. Constable (2015). "Improvements in nutrient uptake and nutrient
use-efficiency in cotton cultivars released between 1973 and 2006." Field Crops
Research 173: 14-21.
Schaalje, G., et al. (1987). "Field evaluation of a modified augmented design for early
stage selection involving a large number of test lines without replication."
Potato research 30(1): 35-45.
Schwartz, B. M. and C. Smith (2008). "Genetic gain in yield potential of upland cotton
under varying plant densities." Crop Science 48(2): 601-605.
Sharma, B., et al. (2015). "Contribution of boll mass and boll number to irrigated
cotton yield." Agronomy Journal 107(5): 1845-1853.
Tang, B., et al. (1993). "F2 hybrids of host plant germplasm and cotton cultivars: I.
Heterosis and combining ability for lint yield and yield components." Crop
Science 33(4): 700-705.
Thompson, C. N., et al. (2019). "Using normalized difference red edge index to assess
maturity in cotton." Crop Science 59(5): 2167-2177.
USDA, N. (2008). Victoria Series.
USDA, N. (2013). "Angelo Series."
USDA, N. (2016). "Acuff Series."
USDA, N. (2016). "Olton Series."
Weiss, M., et al. (2020). "Remote sensing for agricultural applications: A meta-
review." Remote Sensing of Environment 236: 111402.
Texas Tech University, Mark D. Mayo, December 2020
44
Worley, S., et al. (1974). "The relative contributions of yield components to lint yield
of upland cotton, Gossypium hirsutum L." International Journal of Plant
Breeding 23(2): 399-403.
Worley, S., et al. (1976). "Ontogenetic model of cotton yield." Crop Science 16(1):
30-34.
Young, A., et al. (2020). "BLOB-Based AOMs: A Method for the Extraction of Crop
Data from Aerial Images of Cotton." Agriculture 10(1): 19.