copyright by wenping lin 2014
TRANSCRIPT

Copyright
by
Wenping Lin
2014

The Thesis Committee for Wenping Lin
Certifies that this is the approved version of the following thesis:
Determination of Distance Ease at Crotch Curve for Customized Jeans
APPROVED BY
SUPERVISING COMMITTEE:
Bugao Xu
Julia Ann Reed
Supervisor:

Determination of Distance Ease at Crotch Curve for Customized Jeans
by
Wenping Lin, B.E.
Thesis
Presented to the Faculty of the Graduate School of
The University of Texas at Austin
in Partial Fulfillment
of the Requirements
for the Degree of
Master of Science in Textile and Apparel Technology
The University of Texas at Austin
May, 2014

iv
Acknowledgements
My deepest and sincere gratitude goes to my supervisor, Dr. Bugao Xu, who
consistently checked my thesis research progress and inspired me to go the extra miles
during the past two years. I have been appreciative for his efforts to train me to be a
qualified academic researcher. I am so grateful for Dr. Julia Ann Reed for being a reader
of my thesis committee, who dedicatedly guided me to write my thesis in a more
professional manner.
I specially would like to thank Mrs. Ockhee Bego, an excellent fashion designer
and pattern making expert, who has been my mentor and motivator throughout my
master’s program, guiding me to be a better person and giving me advices without any
reservation on my thesis research and study. It has been one of my best memories to work
with her, and I appreciate her love and care, guidance and suggestions for the past two
years. I am warmly grateful for Dr. Juqiang Su, an associate professor in China and a
previous visiting scholar at UT, for his constant support and advice for my thesis
research. This thesis would not have been possible without his suggestions.
Most of all, I would like to express my profound gratitude to my family for their
constant love and support. Specially, my heartfelt thanks go to my dear sister for her
constant support, encouragement, and guidance in becoming a positive thinker.

v
Abstract
Determination of Distance Ease at Crotch Curve for Customized Jeans
Wenping Lin, M.S.T.A.T
The University of Texas at Austin, 2014
Supervisor: Bugao Xu
In the apparel industry, pattern making and alterations are expensive and time
consuming, because they require iterative fitting and adjustment to develop garment
patterns that fit their target consumers. The goal of this paper is to accelerate the pattern
making process for jeans customization, which incorporates proper ease distribution at
crotch curve in a 3D jeans design and pattern alteration by developing ease distribution
models.
In this research, four female jeans with different crotch ease allowances were
developed. The patterns were drafted using flat patterning methods. The fitting process
was conducted and evaluated according to standard fitting criteria. Furthermore, the size
8 mannequin, and then the jeans with the mannequin inside were scanned by the Kinect
Body Image System. The crotch curves of the mannequin and the jeans were obtained,
and were then extracted to the Accumark CAD system where the radial distance eases of
the crotch curves were defined and measured. Correlation analysis between the distance
ease and crotch ease allowance was conducted, and regression analysis was used to

vi
develop ease distribution models. The applications of the regression models in 3D jeans
design and jeans pattern alterations were discussed.
This research enhances the understanding of the ease distribution at the jeans
crotch area. The results of this research provide essential ease distribution information for
the jeans pattern alterations and jeans construction on a 3D model.

vii
Table of Contents
List of Tables ......................................................................................................... ix
List of Figures ..........................................................................................................x
Chapter 1 Introduction ............................................................................................1
1.1 Research Background ............................................................................1
1.1.1 Crtoch Curve .................................................................................1
1.1.2 Body-to-pattern Relationship at Crotch Curve .............................2
1.1.3 Traditional Pants Pattern Making and Design ..............................3
1.1.4 Computer Aided Pattern Making and Design ...............................5
1.2 Thesis Overview ....................................................................................9
Chapter 2 Systematic Analysis of Existing Austomatic Pattern Making Methods ..
.......................................................................................................................10
2.1 Automatic Pattern Making Methods for Garment Customization in 2D
CAD System ........................................................................................10
2.1.1 Pattern Altering Based on Grading Rules ...................................11
2.1.2 Pattern Auto-making Based on Parametric Design Method .......12
2.1.3 Pattern Generationi Based on Artificial Intelligent ....................15
2.2 Automatic Pattern Flattening Methods Based on a 3D Apparel Model ..
..............................................................................................................16
2.2.1 Physical Flattening Methods .......................................................17
2.2.2 Geometric Flattening Methods ...................................................19
2.2.3 Mathematical Flattening Methods ..............................................21
2.2.4 Pattern Flattening Using Developable Surface ...........................22
2.3 Ease Allowance and Distance Ease Distribution .................................25
2.4 Summary ..............................................................................................39

viii
Chapter 3 Methodology ........................................................................................31
Chapter 4 Experimental Results............................................................................36
4.1 Fitting Issues ........................................................................................36
4.2 Data Processing ....................................................................................38
4.3 Mannequin Models Generation............................................................38
4.4 Distance Ease Distribution of the Crotch Curves ................................39
4.5 Correlation Analysis ............................................................................43
4.6 Regression Analysis .............................................................................43
4.7 Applications in 3D Jeans Construction and Pattern Alteration ...........46
Chapter 5 Conclusion and Future Studies .............................................................49
5.1 Introduction ..........................................................................................49
5.2 Limitations of This Study ....................................................................51
5.3 Recommendatioins for Future Study ...................................................52
Bibliography ..........................................................................................................54

ix
List of Tables
Table 3.1: Jeans number and the corresponding ease allowance .......................33
Table 4.1: Correlation analysis between distance ease and ease allowance ....44
Table 4.2: Regression models between distance ease and ease allowance at angles
...........................................................................................................46

x
List of Figures
Figure 2.1: The pattern alteration process in MTM CAD system .......................11
Figure 2.2: The principle of the parametric design for pattern making...............14
Figure 2.3: Scheme in physical flattening methods.............................................18
Figure 2.4: Illustration of physical flattening method .........................................18
Figure 2.5: Basic garment generation method .....................................................19
Figure 2.6: Transformation from 3D surface to 2D surface using piecewise linear
functions ............................................................................................20
Figure 2.7: Surface parameterization: (a) Segmentation of the surface; and (b) the
results of the surface flattening .........................................................20
Figure 2.8: The transformation of a 3D garment curve on to a surface r ............22
Figure 2.9: 3D-to-2D transformation and lengths comparisons ..........................22
Figure 2.10: The principle of developable surface flattening through rotating triangles
...........................................................................................................24
Figure 2.11: Linking developable patches using curves .......................................24
Figure 2.12: The resulting pattern .........................................................................24
Figure 2.13: The radial distance at bust line..........................................................27
Figure 2.14: The normal distance at waistline.......................................................27
Figure 2.15: The longitudinal distance at hip line .................................................27
Figure 2.16: Conceptualized model for distance ease calculation ........................29
Figure 2.17: Distance eases at sampling points .....................................................29
Figure 2.18: The alteration of pants pattern ..........................................................29
Figure 3.1: Schematic illustration of the Kinect body image system setup ........31
xi
Figure 3.2: The landmarks and dimensions extracted by the 3D body image system
...........................................................................................................32
Figure 3.3: Distance ease of the crotch curves at different angles on the coordinates
...........................................................................................................35
Figure 4.1: Jeans #1 before fitting .......................................................................37
Figure 4.2: Jeans #1 after fitting ..........................................................................37
Figure 4.3: Unclothed mannequin .......................................................................39
Figure 4.4: Dressed mannequin ...........................................................................39
Figure 4.5: Distance Ease Distributions on Different Crotch Length Ease Allowance
...........................................................................................................41
Figure 4.6: Jeans and body crotch curves and the corresponding distance eases at
angles ................................................................................................42
Figure 4.7: Ease allowance line fit plot at points with low correlation ...............45
Figure 4.8 Ease allowance line fit plot at points with high correlation ..............45
Figure 4.9: Distance ease distribution at crotch curve and jeans sloper with hipline
as a slash line. ...................................................................................48
Figure 4.10: Altered jeans pattern with ease .........................................................48

1
Chapter 1: Introduction
1.1 RESEARCH BACKGROUND
In the apparel industry, the fit of clothing is an integral part of garment quality,
and significantly affects consumers’ satisfaction (Song & Ashdown, 2012). Yet,
according to a report conducted by Kurt Salmon Associates, consumer dissatisfaction rate
with ready-to-wear fit has reached 50% in females and 62% in males (Song & Ashdown,
2011; Ashdown & Dunne, 2006; Satam et al., 2011). In terms of fit satisfaction, pants
were recognized as the least satisfactory clothing item in ready-to-wear and one of the
most difficult clothing to fit because it involves the crotch area (Henson, 1991;
McKinney, 2007). The crotch area is the major cause of pants fit problems because it
relates to the complicated anatomical structure and body movements (Henson, 1991).
1.1.1 Crotch Curve
Pants crotch curve is defined as the seam line that intersects with the inseam line,
connecting the front and the back center lower waist (Henson, 1991). Specifically, the
contour line of the crotch shape close to the crotch point is relatively flat (Henson, 1991).
It is widely recognized that the design of pants’ crotch curves is critical for the pants fit,
because it involves the inseam and connects the front to back body (Henson, 1991).
However, it is difficult to take accurate measurement of the crotch area (including
crotch shape) manually, because it is obscured between the legs and on the genitals point
which would make people feel uncomfortable to have their crotch area measured (Henson,
1991). Henson (1991) used a device called flexible curve (flexicurve), which was usually

2
used in pattern making and architecture, to capture the crotch shape, and she used a
plumb line attached to the flexicurve to determine the position of crotch point. However,
this method was confronted with the difficulty of determining the orientation of the
crotch curve. In addition, the subjects would feel uncomfortable to be measured at their
crotch area.
With the 3D body scanner, these problems can be resolved by extracting the
crotch curves from the scanning system, and it only takes several seconds to scan a
human body without touching it. Current scanners are unable to capture the point clouds
of crotch curve between legs; therefore, the curve of that area is estimated by connecting
the front and the back center crotch curves. Thus, the accuracy of the crotch shape and
measurements has not been clearly defined and therefore it should be carefully evaluated.
1.1.2 Body-to-pattern Relationship at Crotch Curve
Since crotch curve has been the major reason for the misfit of pants, it is essential
to develop a scientific relationship between body crotch curve and pattern crotch curves,
which will reflect individual body dimension information on the pattern measurements
and shape. A few research studies have been done to investigate the body-to-pattern
crotch relationship for the best fit of pants. Henson (1991) developed a method to
analyze the relationship between body crotch shape and pants crotch shape by comparing
the average male crotch seam curve to the pant pattern crotch curves. She built a
regression model to determine the best fit shape of the male pants crotch curve. However,
due to a lack of integrating ease and style features (darts and pleats) into the crotch seam

3
shape, the comparison was considered to be meaningless. In addition, little body-to-
pattern relationship at the crotch area was found.
Moreover, assuming that width and silhouette of the body crotch curve can be
directly applied to the pattern crotch width and silhouette, McKinney (2007) copied the
body crotch curve to the pattern, and found that the pants generated were too loose at the
abdomen and buttock areas. She concluded in her later experiment that the pattern crotch
width should be 0.33 inches narrower at abdomen level, and 2.37 inches at hip/buttock
level, than the body crotch width. In this study, however, no straight relationship between
body crotch shape and pattern crotch shape was found by simply comparing the body
crotch measurement/shape and pattern crotch measurement/shape,.
A scientific method is needed to determine the relationship between the
silhouettes of the body crotch and pattern crotch curves and lengths, which will help to
predict the pattern crotch silhouette for various body shapes. However, the body-to-
pattern relationship at the crotch area is complicated, because the single crotch curve
involves a variety of body shapes, including the buttock shape, abdomen prominence, the
proportion of front and back body and so on.
1.1.3 Traditional Pants Pattern Making and Design
Before exploring the relationship between body crotch curve and pants crotch
curve, it is important to understand how to draft the pants pattern in a conventional
method based on the body measurements. In the apparel industry, patternmaking is
essential in transferring the fashion design to real garments, because proper
patternmaking ensures a good fit to the target consumers. In traditional apparel design,

4
there are two major approaches for pattern development: draping and flat patterning
technique. Draping, a method to produce patterns by conforming a fabric to the silhouette
of a mannequin or human body and then marking, cutting and flattening prototype,
ensures the style and the fit of garments. Flat patterning technique, a method of drafting
patterns using formulas based on several body measurements (i.e., height, waist girth, hip
girth), is widely used in industry due to its efficiency and speed (Huang, 2011).
However, both methods have three major common drawbacks. First, both of them
cannot produce consistent patterns. Using the draping method, different people would
generate different basic blocks even on the same mannequin (Huang, 2011); and in the
flat patterning method, different pattern making experts (Armstrong, 2006; McKinney,
2007; Minott, 1978), according to their own experience, would establish their own
formulas and ease allowances in drafting patterns for the same body form. This means
that the patterns drafted for the same subject would be different by following different
pattern making books. And most of all, those drafting methods cannot guarantee the right
fit for all people with various body shapes. It is, therefore, vital to establish a more
systematic approach for developing patterns that fit consumers of various sizes and body
shapes (Huang, 2011).
Second, both methods are laborious, expensive and time consuming. It takes a
long time and many fabrics to drape a design style, especially a complex style, because it
goes through styling, marking, cutting the prototype, mock up, cutting the real fabrics and
sewing. The flat patterning method requires iterative trial-and-error on paid fit models in
5
order to make sure the patterns fit their target consumers before production (Huang,
2011).
Third, both methods require experienced pattern makers in order to design proper
patterns. As pattern makers, they are required to be equipped with sufficient knowledge,
skills and experiences of apparel design, garment construction and manufacturing, but
usually it would take years of training to obtain those skills and knowledge (Istook, 2002;
Huang, 2011).
1.1.4 Computer Aided Pattern Making and Design
All the problems of conventional patternmaking methods can resolved by the new
technology--Made-to-Measure (MTM), which automates the apparel pattern making
processes based on 3D body scanning measurements (Satam, et al 2011). This technology
has been considered as the alternative solution to solve the misfit ready-to-wear situation
(Ashdown & Dunne, 2006). Currently, the world-known commercial MTM systems
include Gerber MTM Accumark CAD, Lectra FitNet custom patternmaking software,
made-to-measure of Assyst Bullmer and Optitex Modulate Made-to-Measure software
(Istook, 2002). Based on their principles, they are sorted into two groups.
In the first method, the size of a basic pattern (also called block or sloper) is
automatically chosen, according to the individual’s body measurements, by the system
from a graded pattern set; and then based on the differences between the standard pattern
dimensions and the individual body dimension, multiple alterations are made on the
standard pattern pieces; Finally, by merging all the alterations, the customized-fit pattern
pieces are generated (Song & Ashdown, 2012). However, the current commercial MTM

6
systems not only require operators to be equipped with professional practical pattern
design knowledge and experiences, but also need to manually create various charts,
including size chart, alteration chart by manually inputting data (Istook 2002, Song &
Ashdown 2012).
The second method, which is applied in Optitex Modulate Made-to-Measure
software, is an interactive 3D garment and 2D pattern system. It uses a set of dimensions
or modules (e.g., bust, shoulder, hip, etc.) to parametrically define each pattern. As the
dimension or arc is modified on the pattern, the garment on the 3D virtual model can be
immediately changed and visualized. Compared to the first method, this method does not
need to create rule table sets or sizing definitions (Istook, 2002; Song & Ashdown, 2012;
Optitex Modulate MTM, 2014).
Although current commercial MTM systems have these alteration and grading
functions, it remains challenging to produce custom-fitted clothes that fit well, because
their drafting methods are almost based on passed down experience, rather than scientific
knowledge of body-pattern relationship (McKinney, 2007). Therefore, fitting process
seems to be needed for made-to-measure in order to make sure the garment produced is
perfectly fit for the target customers. Moreover, even the most experienced pattern
making experts can barely produce pants that are fit for any individual, let alone the fact
that many experienced patternmakers are not good at using computer software to draft
patterns.
That’s why the MTM has not been widely applied in apparel industry--the current
commercial automated patternmaking systems are unable to develop customized

7
garments with perfect fit for all customers. In 2004, Land’s End, QVC, JCPenney, and
indiDenim were reported to be successful in online MTM program (Song & Ashdown,
2012). They adopted a MTM system established by Archetype Technology. In this
system, consumers typed in their key body measurements (e.g., weight and height, the
proportions of thighs and hips), according to which apparel patterns were swiftly drafted
by using Gerber’s7 PDF 20008 and made-to-measure programs, and the patterns were
laid out by Nester9 software and cut by Gerber’s automatic single-ply DCS 3500 cutters
10. However, for unknown reason, those companies all discontinued their online mass
customization programs (Song & Ashdown, 2012; Ives & Piccoli, 2003). It was guessed
that the main cause was due to the relatively high rate of returning products resulting
from fit issues (Song & Ashdown, 2012). In short, although CAD patternmaking systems
can design and alter patterns easily, faster, and in low cost, the quality of CAD
patternmaking still highly relies on the expertise of the patternmaker and the expensive
fitting process (McKinsey 2012).
Based on the above situation, more and more researchers have been involved in
developing better approaches to improve the fit of garments. So far, in academia, there
are two major approaches for automatic pattern development: (1) automatic pattern
development based on 2D CAD systems; (2) automatic pattern development based on
flattening methods on a 3D model (Yang et al., 2007; Satam et al., 2011).
In the first approach, there are three methods in achieving automatic pattern
generation in 2D CAD systems: (1) pattern alteration by grading rules; (2) automatic
pattern development based on parametric design; and (3) pattern automation using

8
artificial intelligence (Yang et al., 2007). The second approach, also called 3D-to-2D
technique, is the process of designing the 3D garment on the 3D individual virtual model,
and then generating the patterns by flattening the 3D garment surface (Yang, et al., 2007;
Huang, 2011). In this approach, the ease distribution is important to ensure excellent fit
of the garment (Huang, 2011). There have been several studies using distance eases,
defined as the distances between the garment and the body surfaces, to describe the ease
distributions of breast, waist, hip, knee and so on (Xu et al., 2008; Xu & Zhang, 2009;
Wang et al., 2006; Zhang et al., 2012; Su et al., 2014). However, it remains unclear about
how the ease is distributed at the crotch area, which is an integral part of customized-fit
pants design.
Therefore, it is attractive to use 3D body scanner to study the distance ease
distribution at crotch area, and to find out the relationship between distance ease and ease
allowance at crotch length, so that once given the ease allowance of crotch length, the
distribution of distance ease at this area can be predicted automatically. The results of this
study can be applied in the 3D customized-fit jeans design to improve the fit of jeans, as
well as in jeans pattern alterations.
1.2 THESIS OVERVIEW
Hence, the scopes of this study are to 1) systematically review and analyze the
state-of-art methods of automatic customized pattern development, and to 2) determine
the relationship between the crotch length ease allowance and the distance ease
distribution.
9
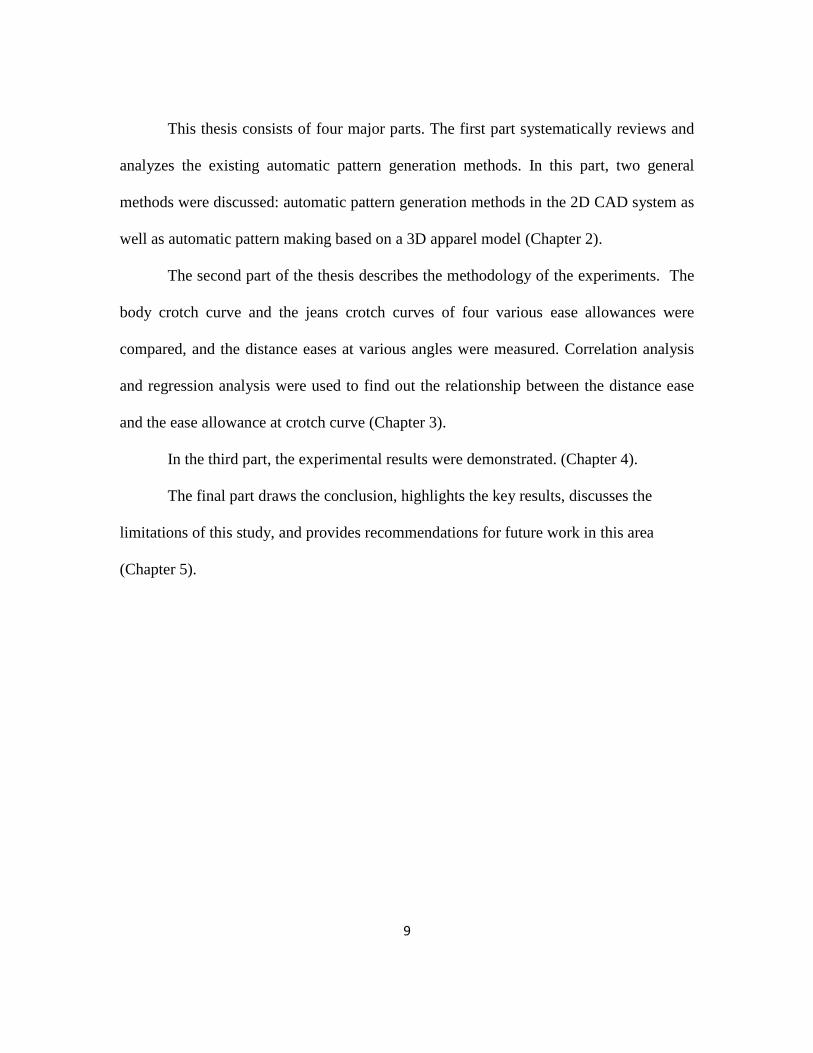
This thesis consists of four major parts. The first part systematically reviews and
analyzes the existing automatic pattern generation methods. In this part, two general
methods were discussed: automatic pattern generation methods in the 2D CAD system as
well as automatic pattern making based on a 3D apparel model (Chapter 2).
The second part of the thesis describes the methodology of the experiments. The
body crotch curve and the jeans crotch curves of four various ease allowances were
compared, and the distance eases at various angles were measured. Correlation analysis
and regression analysis were used to find out the relationship between the distance ease
and the ease allowance at crotch curve (Chapter 3).
In the third part, the experimental results were demonstrated. (Chapter 4).
The final part draws the conclusion, highlights the key results, discusses the
limitations of this study, and provides recommendations for future work in this area
(Chapter 5).

10
Chapter 2: Systematic Analysis of Existing Automatic Pattern Making
Methods and Distance Ease Distribution
The fit of clothes is a fundamental element to earn consumers’ trust of the brand.
In order to bring their consumers back, JCPenny’s 2014 spring slogan was “When it fits,
you feel it”, which showed that JCP’s main focus was to fit their target consumers (JCP
“when it fits, you feel it” commercial). The nature of fit is the relationship between body
variations and pattern shapes for specific size (Gazzuolo, 1985). As the conventional
pattern making process requires iterative fitting and adjusting, which is expensive and
laborious, the automatic patternmaking systems have attracted a lot of researchers’
interests to achieve the automation of customized fit garments pattern making (Huang,
2011).
In general, there are two main paths to automatic garment development process
for mass customization. One path is based on the 2D flat pattern design using commercial
CAD system, which involves the relationships between garment topography, body scan
data, and apparel pattern design; and the second path produces pattern directly from 3D
individual models by flattening technology (Satam et al., 2011; Yang et al., 2007; Carrere,
et al, 2000).
2.1 AUTOMATIC PATTERNMAKING METHODS FOR GARMENT
CUSTOMIZATION IN 2D CAD SYSTEM
2D pattern drafting methods are still widely used in computer aided pattern design
systems. In this path, there are three methods under development: (1) pattern alteration by

11
grading rules; (2) automatic pattern development based on parametric design; and (3)
pattern automation using artificial intelligence (Yang et al., 2007).
2.1.1 Pattern Alterations by Grading Rules
In the apparel industry, standard blocks of different sizes are usually drafted by
hand, and digitized and stored in the CAD systems. Customized garment patterns are
generally created directly based on individual body measurements or are from the
alterations of the standard blocks for specific size (Lim & Istook, 2012; Istook, 2002;
Turner and Bond, 1999). There are two approaches to conduct pattern alterations in CAD
systems. The first approach uses algebraic formula to modify the basic patterns based on
the standard size charts and the proportions of the body dimensions; and the second
approach grades the patterns using sizing, grading and alteration tables based on
individual body measurements (Turner & Bond, 1999; Istook, 2002; Yang et al., 2007).
Figure 2.1 The patter n alteration process in MTM CAD system (Yang et al., 2007)
12
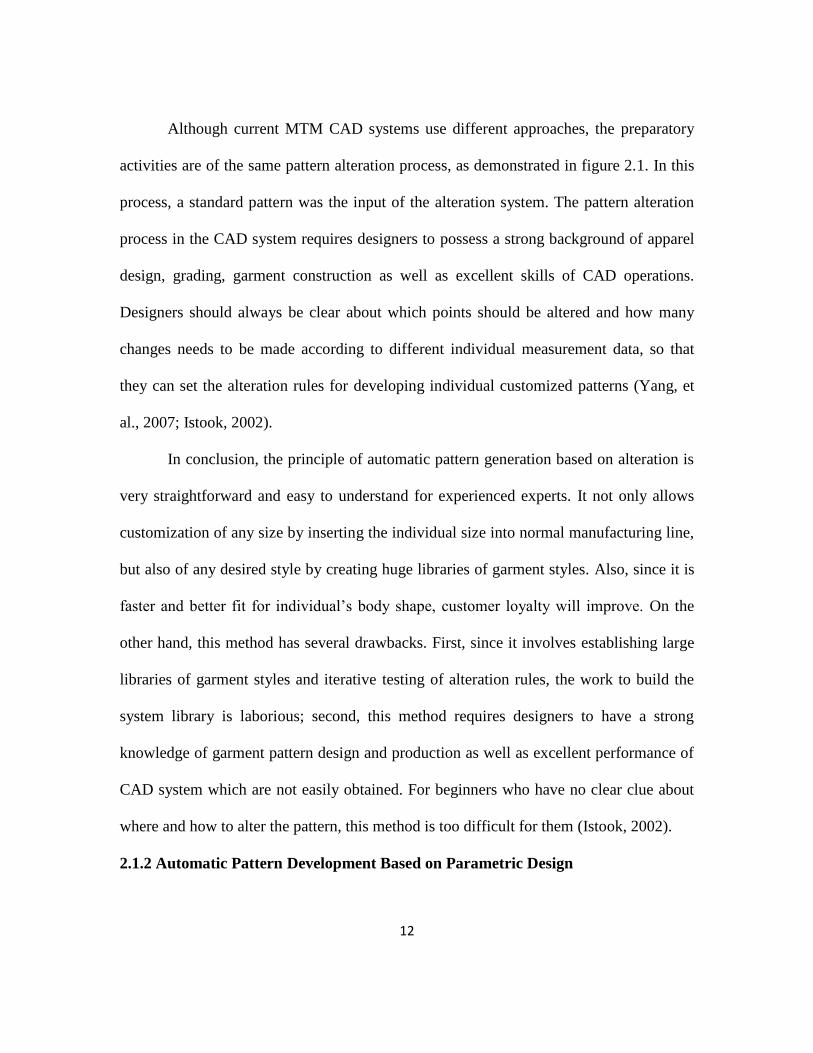
Although current MTM CAD systems use different approaches, the preparatory
activities are of the same pattern alteration process, as demonstrated in figure 2.1. In this
process, a standard pattern was the input of the alteration system. The pattern alteration
process in the CAD system requires designers to possess a strong background of apparel
design, grading, garment construction as well as excellent skills of CAD operations.
Designers should always be clear about which points should be altered and how many
changes needs to be made according to different individual measurement data, so that
they can set the alteration rules for developing individual customized patterns (Yang, et
al., 2007; Istook, 2002).
In conclusion, the principle of automatic pattern generation based on alteration is
very straightforward and easy to understand for experienced experts. It not only allows
customization of any size by inserting the individual size into normal manufacturing line,
but also of any desired style by creating huge libraries of garment styles. Also, since it is
faster and better fit for individual’s body shape, customer loyalty will improve. On the
other hand, this method has several drawbacks. First, since it involves establishing large
libraries of garment styles and iterative testing of alteration rules, the work to build the
system library is laborious; second, this method requires designers to have a strong
knowledge of garment pattern design and production as well as excellent performance of
CAD system which are not easily obtained. For beginners who have no clear clue about
where and how to alter the pattern, this method is too difficult for them (Istook, 2002).
2.1.2 Automatic Pattern Development Based on Parametric Design

13
In this approach, apparel pattern can be considered a combination of a set of
geometric elements (point, arc, line, and curve, etc.). Each pattern is defined and
designed according to the constraint condition and topology structure. The pattern
dimension is automatically modified as the input of individual measurement data updates.
The nature of the parametric pattern design is that the pattern making production process
is stored into the computer program by using a set of parameters that control the structure
and size of a specific individual pattern. When the parameters are assigned by different
values, the existing pattern pieces are transformed into new patterns (Yang et al., 2007).
Since garment pattern design involves a lot of experience values, the introduction
of an expert knowledge database, which “absorbs” skilled pattern makers’ experiences
and learns the way in which they analyze and alter patterns, is the key to guarantee the fit
of garments. In order to tell the computer how to design the patterns, the patterns are
graphically described by topology structure, geometric parameters and structure
parameters. The topology structure means the pattern rules; the geometric parameters are
used to indicate the geometric information (i.e., coordinate location) of the pattern; and
the structure parameters involves the relationship between topology structure and
geometric parameters (Yang et al., 2007).
Among three of them, the structure parameters of garment pattern can be
classified into four categories: measurement parameters, design parameters, graphical
parameters, and compound parameters. Measurement parameters are related to the critical
measurements of body and clothes; design parameters, such as the ease amount and pleat
value, often depends on the design style and consumers fit preference; graphical

14
parameters, such as back hip width, are geometric variables (length of a curve or line)
that decide other geometric values (i.e., crotch extension); Compound parameters, the
combination of the above three parameters by a formula, are usually defined by
experienced pattern makers (Yang et al., 2007).
Figure 2.2 The principle of the parametric design for pattern making (Yang et al., 2007)
As indicated in figure 2.2, there are three main steps in the process of automatic
pattern making in applying parametric design. First, the pattern development process is
documented and the pattern template is defined by graphical structure. Second, the
pattern template is constrained by all the parameters mentioned above. Last, with the
input of individual measurement data, the parameter values are updated and new patterns
are created automatically (Yang et al., 2007).
By recording the patternmaking process into computer, it becomes faster to
develop patterns by using parametric design method. However, apparel design relies on
pattern makers’ experience and involves a lot of factors, including fabric properties, body

15
shape analysis, manufacturing capability, it is critical to establish knowledge database to
guide the drafting and alterations of pattern making, which is a laborious process. But
once the database is established, the CAD system is ready to produce customized
garments. Currently, pattern development systems based on parametric design are
normally applied in the customization of garments with certain styles, such as suit, shirt,
jeans and jacket (Yang et al., 2007).
2.1.3 Pattern Automation Using Artificial Intelligence
Another approach to automatically generating customized patterns is based on
artificial intelligence (AI). The advantage of AI over the two approaches above is that it
does not rely on a pattern maker’s experiences to build the expert knowledge database.
Two techniques of AI have been applied in apparel pattern design: one is Artificial
Neural Network (ANN), the other one is Fuzzy Logic (Yang et al., 2007). For example,
Chen et al. (2003) applied AI to predict shirt patterns by body measurement, fabric
properties and fitting preferences. Zhu (2004) designed a men’s wear MTM system by
using fuzzy clustering pattern recognition theory through AutoCAD and VB
programming. Although the method of AI reduces reliance on experienced pattern
makers, it requires a number of experiments to evaluate whether the patterns are fit or not.
Also, in order to apply AI in MTM, more work needs to be done for generating garments
with different styles by applying more AI technique (Yang et al., 2007).
Although these methods provide a better fit of pants as well as accelerate pattern
making process, still, the fit satisfaction rate remains relatively low. McKinney (2007)

16
pointed out that it remained a challenge to develop custom-fitted clothes that fit well
because the scientific knowledge of a body-pattern relationship, including ease values,
remained unclear. Therefore, in order to design and produce customized jeans, it is
necessary to study the relationship between body and pattern crotch curves with ease
distribution incorporated, so that the front/back pattern crotch shape and lengths can be
directly predicted from the corresponding body crotch shape and lengths.
2.2 AUTOMATIC PATTERN FLATTENING METHODS BASED ON 3D
MODELS
Different from flat patterning and alterations in 2D CAD system, automatic
pattern making method based on a 3D apparel model (also called 3D to 2D technique) is
a method in which a 3D customized garment is constructed and draped on the individual
virtual model and then the 3D garment surfaces are flattened into a 2D flat surface
(Huang, 2011).
The process of using this approach is stated as follows: first of all, the individual
is scanned by a 3D body scanner, point cloud data is obtained, a triangular human mesh
model is created, and a torso model is established and represented by B-spline. Second,
the key feature points and structure lines are identified, and the feature-aligned and ease-
incorporated garment wireframe is represented by a set of B-spline curves. Third, ease
allowances at various body positions were distributed around the human body to create
an ease incorporated wireframe. Fourth, a 3D garment model is generated based on the
ease incorporated wireframe; multi-resolution mesh generation. Finally, surface flattening

17
technique is used to flatten three-dimensional garment surface into a 2D flat surface.
(Huang, 2011; Kim & Kang, 2003).
In the past decades, there has been considerable interest in using 3D-to-2D
flattening method to produce 2D blocks from 3D virtual clothes (Huang, 2011). There are
generally four methods to flatten the garment surface: (1) physical flattening methods; (2)
geometric flattening methods; (3) mathematical flattening methods; (4) pattern flattening
using developable surface.
2.2.1 Physical Flattening Methods
The physical flattening technique uses triangles to represent each model with
defined energy equilibrium (Liu et al., 2010; Huang, 2011; Yang, et al., 2007). Each
triangular grid is simulated as an elastic spring-mass model with predefined energy model
of system forces, masses, and elastic distortion (Huang, 2011; Yang et al., 2007). During
the surface flattening process, the 2D pattern is mapped from all the 3D triangular grids
with well-defined constraints, and the final pattern silhouette is determined when the
system distortion energy diffusion reaches the minimum (Yang et al., 2007). The
overlapping error might happen frequently, and it can be avoided by applying the penalty
function which allows the vertices to move to the reverse direction (Wang et al., 2002).
In the study by Kim & Park (2007), the 3D garments were represented by
triangular meshes. The patterns were modelled by inducing strain models. For every two
vertices on each edge, the total strain can be calculated by the scheme in figure 2.3:

18
Figure 2.3 Scheme in physical flattening methods used by Kim & Park (2007)
By iterative correction and equalization of each corresponding edge (figure 2.4),
the flat patterns were roughly determined. Pattern outlines for different fabrics were
obtained by incorporating fabrics’ physical properties, including “maximum elastic
allowance and maximum shear angle allowance during the strain reduction, even the
optimum shapes of patterns for different fabric material” (Kim & Park, 2007, p14). When
the total strain deformation rate reached a predefined threshold rate, the final flats were
acquired.
Corresponding
edges
(a) 3D pattern (b) 2D patter
Figure 2.4 Illustration of physical flattening method by Kim & Park (2007)

19
However, the physical flattening methods were considered inappropriate to be
applied in pattern generation for the following reasons: first, even with the adoption of
more constraints to define the model, distortions during the flattening process are
inevitable, which results in considerable inaccuracy (Yang et al., 2007); second, as the
definitions of the preliminary constraints and boundary conditions are significantly
influential, and reliability of the system is not guaranteed (Huang, 2011).
2.2.2 Geometric flattening method
Surface parameterization, referring to “a one-to-one mapping from the surface to
a suitable parameter domain” (Floater & Hormann, 2005, p157), is widely applied in
geometric modelling (Sheffer et al., 2005; Shimada & Tada, 1991). The surfaces are
characterized by triangular meshes and the mappings are achieved by piecewise linear
functions, as shown in figure 2.6 (Floater & Hormann, 2005, p167). The model is
segmented into several parts, and the surface is parameterized, and then combined on one
surface, as indicated in figure 2.7 (Lévy et al., 2002). However, distortions in angle or
areas usually occur from parameterizations, and the flattened surface silhouettes are
usually irregular (Floater & Hormann, 2005). The major issue for geometric modelling is
to preserve the shape when mapping (Huang, 2011). Several researches (Floater &
Hormann, 2005; Sheffer et al., 2005; Shimada & Tada, 1991) proposed approaches, such
as fixed (convex) boundary technique and Angle Based Flattening (ABF), to maintain the
least distortion during mapping, however, the distortion remained unavoidable. In
addition, without incorporating fabrics’ properties and manufacturing limitations,

20
geometric flattening techniques were considered not appropriate to be applied in apparel
pattern flattening (Huang, 2011; Yang et al., 2007).
Figure 2.6 Transformation from 3D surface to 2D surface using piecewise linear
functions (Floater & Hormann, 2005)
Figure 2.7 Surface parameterization: (a) Segmentation of the surface; and (b) the results
of the surface flattening (Lévy et al., 2002)
(a) (b)

21
2.2.3 Mathematical Flattening Methods
The mapping of the 3D garment curves to the predefined plane can also be
achieved by using mathematical flattening methods (Petrak et al., 2006). Three methods
were proposed by Petrak et al. (2006) to transform 3D curves into 2D patches:
1) Projecting a 3D curve to the surface defined by three points;
2) Projecting a 3D curve to the surface defined by Gaussian method of least squares;
3) Projecting a 3D curve to the surface defined by Gaussian method of least squares
and related “function extreme”.
Before using these methods, the 3D pattern silhouette should be defined by
conducting the first two steps:
1) Three 3D curve k is partitioned into m parts: k1, k2,…kj, …km, and each segment
can be considered approximately as a straight line.
2) Each segment is then defined by n points.
The second approach, the Gaussian method of least squares, was introduced
specifically by Petrak et al. (2006). This method involves finding, from planes parallel to
plane j, a plane where the sum of the squares of the distances between the spatial points
Tk and the projected points Tk` reaches the minimum (figure 2.10 and figure 2.11). The
equation for calculating the sum of the squares is shown below:
∑
∑
where, p is the distance between the plane p and the plane rj, the cosines of the
angles α, β, is to express the coordinate axes x, y and z (Petrak et al., 2006).

22
Before using this method to flatten the 3D garment dummy, ease distribution
might need to be defined in advance for a comfortable fit for an individual body. This
mathematical method, however, hardly can be widely applied in fashion industry for at
least two reasons. First of all, simply by projecting the edge curve of each panel, it seems
to be impossible to create darts or gussets which are the important shaping devices of
patterns. Secondly, regardless of the fabric’s physical and mechanical traits, the accuracy
of flattened pattern silhouette is hard to guarantee.
2.2.4 Pattern Flattening from Developable Surface
Developable surface is a surface which can be unfolded into a plane without
distortion (Huang, 2011; Liu et al., 2007). A lot of research has been done on the
approximation of developable surfaces (Pottmann & Wallner, 1999; Wang et al., 2004;
Figure 2.8 The transformation of a 3D
garment curve on to a surface r (Petrak
et al., 2006).
Figure 2.9 3D-to-2D transformation and
lengths comparisons (Petrak et al., 2006)

23
Decaudin et al., 2006; Huang 2011). Wang et al (2004) developed a method to improve
the developability of non-uniform rational B-spline (NURBS) surface patches by
minimizing Gaussian curvature. Decaudin et al. (2006) proposed a novel technique for
approximation of developable surfaces. First, each piece is represented by a triangle
developable surface which is approximated best locally. Second, each triangle is
adjusted/rotated onto a plane with the minimum deformation of vertex position. The
application of developable surface has been very popular in virtual garment construction
and pattern flattening technologies (Huang, 2011; Decaudin et al., 2006).
Another flattening technique using developable surface is proposed by Huang
(2011). First, the garment surface is segmented into 3D developable surface patches by
applying a boundary triangulation method based on definition of closed region. Second,
each developable patch is represented by successive triangles. It is assume that the shared
angle between two triangles is θ. By rotating one triangular surface by angle θ, the two
triangles become coplanar. This process repeats until all the triangles in the patch are on
the same surface (figure 2.12). Third, after all the patches are flattened, they are not on
one plane, and instead, they are positioned randomly in the air. A co-planarization
algorithm is applied to position the patches onto a flat surface. Fourth, each patch is
viewed as a vertice and the adjacent patches are linked by a curve (figure 2.13); based on
the angle between the related edges and the Euclidean distance between the midpoints of
two neighboring edges, the linking relationship between the patches is decided to be kept
or removed. Those remaining linked patches are glued together as one group. Finally, the

24
resulting patterns are created with the darts without fabric tearing or stretching (figure
2.14).
Figure 2.10 The principle of developable surface flattening through rotating triangles: (a)
rotating the two triangles into co-planar by angle θ; (b) all the triangles of the developable
pieces were unfolded (Huang, 2011)
Figure 2.11 Linking developable patches
using curves (Huang, 2011)
Figure 2.12 The resulting pattern
(Huang, 2011)

25
Different from physical flattening method which uses spring-mass model to
represent different fabric properties, this method puts textile properties into consideration
by adjusting the ease distribution of the garment. When the ease amount reaches 20% of
the original measurements, a fabric’s physical and mechanical constraints need to be
considered in pattern construction (Huang, 2011). In the apparel industry, various factors,
such as fabric properties and garment construction, should be considered cautiously when
designing the ease distribution (Huang, 2011). For example, when using stretchy fabrics,
such as knits, ease amount tends to be zero or even be negative, while the ease
distributions for non-stretchy woven fabrics are usually positive. Another example is
pants. Depending on fashion trends, jeans tend to fit body tightly, while trousers are
much looser (Armstrong, 2006).
This method (Huang, 2011) has advantages. First, since developable surface is
utilized, the patterns generated from 3D garments are not distorted, which guarantees the
accuracy of the pattern fit. Second, the textile constraints are incorporated into the ease
distributions. However, the ease distributions are complicated and inconclusive because it
is related to multiple factors, including the textiles constraints, wearers’ fit preference,
and body structure and so on. Therefore, it is important to conduct large scale
experiments to summarize the ease amount on different fabrics.
2.3 EASE ALLOWANCE AND DISTANCE EASE DISTRIBUTION
Ease, “the dimensional difference between body and garment surfaces”, is crucial
for allowing wearers to move and breathe comfortably (Huang, 2011, P37). The ease
26
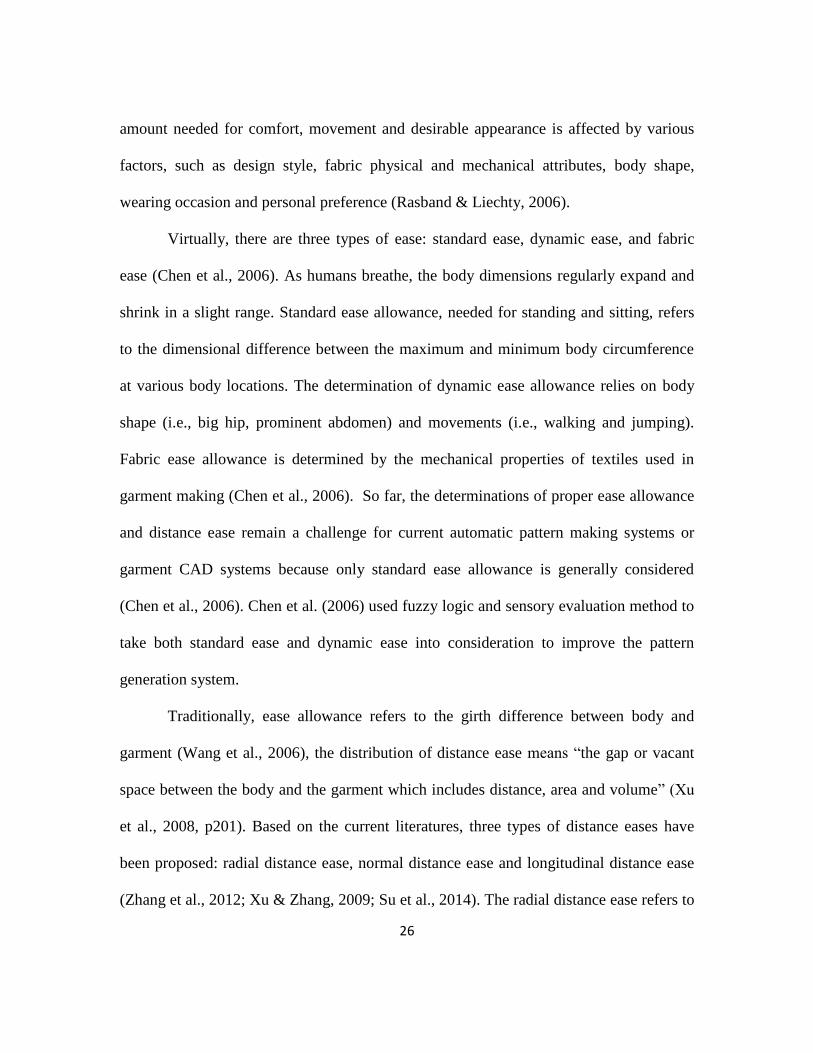
amount needed for comfort, movement and desirable appearance is affected by various
factors, such as design style, fabric physical and mechanical attributes, body shape,
wearing occasion and personal preference (Rasband & Liechty, 2006).
Virtually, there are three types of ease: standard ease, dynamic ease, and fabric
ease (Chen et al., 2006). As humans breathe, the body dimensions regularly expand and
shrink in a slight range. Standard ease allowance, needed for standing and sitting, refers
to the dimensional difference between the maximum and minimum body circumference
at various body locations. The determination of dynamic ease allowance relies on body
shape (i.e., big hip, prominent abdomen) and movements (i.e., walking and jumping).
Fabric ease allowance is determined by the mechanical properties of textiles used in
garment making (Chen et al., 2006). So far, the determinations of proper ease allowance
and distance ease remain a challenge for current automatic pattern making systems or
garment CAD systems because only standard ease allowance is generally considered
(Chen et al., 2006). Chen et al. (2006) used fuzzy logic and sensory evaluation method to
take both standard ease and dynamic ease into consideration to improve the pattern
generation system.
Traditionally, ease allowance refers to the girth difference between body and
garment (Wang et al., 2006), the distribution of distance ease means “the gap or vacant
space between the body and the garment which includes distance, area and volume” (Xu
et al., 2008, p201). Based on the current literatures, three types of distance eases have
been proposed: radial distance ease, normal distance ease and longitudinal distance ease
(Zhang et al., 2012; Xu & Zhang, 2009; Su et al., 2014). The radial distance ease refers to

27
the radial distance between garment and body, as shown figure 2.15 (Zhang, et al., 2012).
The normal distance ease, given in figure 2.16, is the length of the normal lines between
body and garment surfaces (Xu & Zhang, 2009). It is reported that normal lines are more
reasonable than radial distance ease in defining the vacant space between body and
garment, because they are shorter and perpendicular to both garment and body surfaces
(Xu, et al., 2009). The third type of distance ease is defined by a different way. Rather
than a distance on a radial line, the longitudinal distance is the vertical distance between
the garment and the body, as shown in figure 2.17 (Su et al., 2014).
The study of ease distribution using 3D body scanning data has attracted a lot of
attention for the past decade. Xu et al. (2008) found that fabric material attributes have a
significant effect on the distance ease amount. Xu & Zhang (2009) estimated the
distribution of normal distance ease. Wang et al. (2006) developed a mathematical model
of ease distribution using surface fitting method. Zhang et al., (2012) investigated the
correlation between the distance ease and the average ease allowance, and developed
Figure 2.13 The radial
distance at bust line
(Zhang, et al., 2012)
Figure 2.14 The normal
distance at waistline
(Xu & Zhang, 2009)
Figure 2.15 The
longitudinal distance at hip
line (Su et al., 2014)
28
mathematical models of ease distribution using regression analysis. These methods could
be applied in the construction of 3D customized-fit virtual garment.
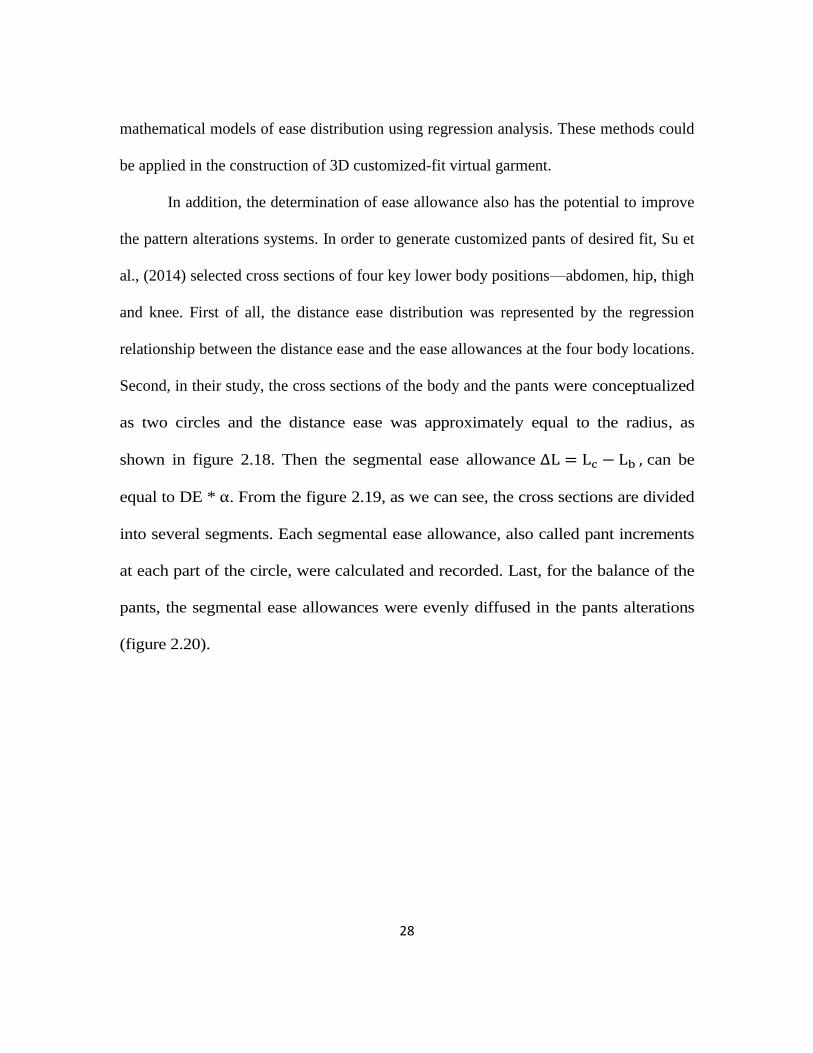
In addition, the determination of ease allowance also has the potential to improve
the pattern alterations systems. In order to generate customized pants of desired fit, Su et
al., (2014) selected cross sections of four key lower body positions—abdomen, hip, thigh
and knee. First of all, the distance ease distribution was represented by the regression
relationship between the distance ease and the ease allowances at the four body locations.
Second, in their study, the cross sections of the body and the pants were conceptualized
as two circles and the distance ease was approximately equal to the radius, as
shown in figure 2.18. Then the segmental ease allowance can be
equal to DE * . From the figure 2.19, as we can see, the cross sections are divided
into several segments. Each segmental ease allowance, also called pant increments
at each part of the circle, were calculated and recorded. Last, for the balance of the
pants, the segmental ease allowances were evenly diffused in the pants alterations
(figure 2.20).

29
The ease distribution has been studied on jackets (Xu et al., 2008; Xu & Zhang,
2009; Wang et al., 2006), shirts (Zhang et al., 2012), and pants (Su et al., 2014). The
studies mostly focused on the ease distribution of the cross-sections of bust line, waistline,
hipline, abdomen, thigh and knee. However, to the best of our knowledge, there is little
study conducting research on the ease distribution of crotch curve.
2.4 SUMMARY
After reviewing the studies on the automatic pattern making methods, it can be
concluded:
Figure 2.16 Conceptualized model for
distance ease calculation (Su et al., 2014)
Figure 2.17 Distance eases at
sampling points (Su et al., 2014)
Figure 2.18 The alteration of
pants pattern using distance ease
(Su et al., 2014)

30
(1) Although 2D pattern making methods are widely applied due to its being
straightforward and efficient, however, most of the methods rely on pattern
making experts’ experience and knowledge; and for pattern automation using
artificial intelligent, it requires a large scale experiments to create libraries for
different sizes and styles.
(2) In terms of the 3D-to-2D techniques, the procedures were described and the
four surface flattening techniques were reviewed. It was found that physical,
geometrical and mathematical methods were not appropriate for apparel
pattern making. In contrast, the pattern flattening using developable surfaces
seemed to be the best technique so far because no distortion occurred.
(3) Distance ease distribution models have been widely studied, but little research
so far has investigated the distance ease distribution at the crotch curve using
3D body scanning body measurement data. Therefore, it is critical to study the
ease distribution of the crotch curve for the application of the 2D pants pattern
automatic alterations as well as for the 3D jeans pattern design.

31
Chapter 3: Methodology
The aim of this study is to determine the distance ease at crotch curve, and to
develop regression models between distance ease of the crotch curve. The experimental
results will be useful in building up the 3D female pants for jeans model in the 3D-to-2D
automatic pattern generation system, and in shaping the crotch silhouette of pants
patterns.
In the study of ease distribution, a mannequin is often used in order to prevent the
impact of respiration and unconscious movements of the human body (Xu & Zhang, 2009;
Zhang et al., 2012; Xu et al., 2008). In this study, a size 8 mannequin was selected as the
model for our customized fit jeans.
The mannequin was scanned by the Kinect Body Image system (KBI) at Gearing
Hall (GEA) 207, the Human Dimension Research Laboratory at the University of Texas
at Austin. The Kinect body imaging system is made of four Microsoft Kinect sensors,
1.5 m
Figure 3.1: Schematic illustration of the Kinect body image system setup
(Human Dimension Research Laboratory, School of Human Ecology at the
University of Texas at Austin)
32
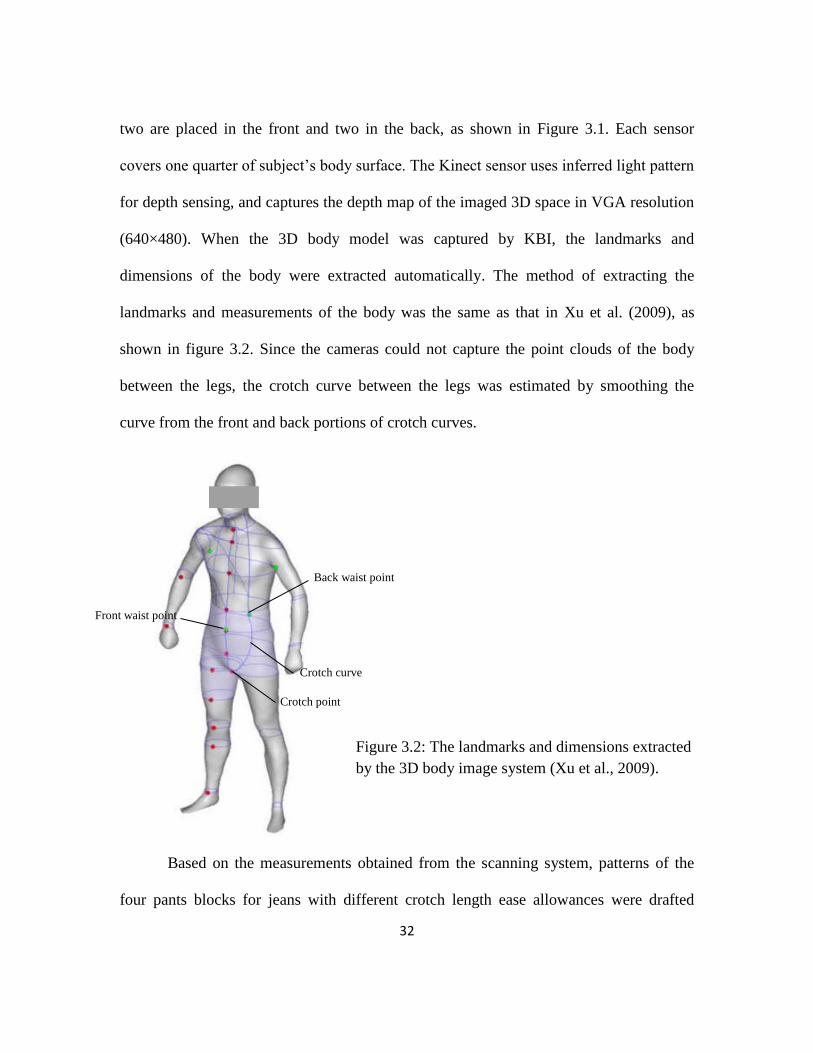
two are placed in the front and two in the back, as shown in Figure 3.1. Each sensor
covers one quarter of subject’s body surface. The Kinect sensor uses inferred light pattern
for depth sensing, and captures the depth map of the imaged 3D space in VGA resolution
(640×480). When the 3D body model was captured by KBI, the landmarks and
dimensions of the body were extracted automatically. The method of extracting the
landmarks and measurements of the body was the same as that in Xu et al. (2009), as
shown in figure 3.2. Since the cameras could not capture the point clouds of the body
between the legs, the crotch curve between the legs was estimated by smoothing the
curve from the front and back portions of crotch curves.
Based on the measurements obtained from the scanning system, patterns of the
four pants blocks for jeans with different crotch length ease allowances were drafted
Figure 3.2: The landmarks and dimensions extracted
by the 3D body image system (Xu et al., 2009).
Front waist point
Back waist point
Crotch point
Crotch curve

33
using Accumark CAD by following the jeans drafting method by Armstrong (2006).
Since the focus of this study is crotch curve, only the foundations, the portion above the
thigh line, of the pants block were developed. The ease allowances at the crotch curve
lengths for four jeans are displayed in table 3.1.
Table 3.1: Jeans number and the corresponding ease allowance
Muslin was chosen because its fiber contents and weave structure were similar to
denim. After the jeans samples were made, they were placed on the mannequin for fitting.
In the fitting process, the fitting problems were analyzed, and pattern alterations were
made accordingly. According to Erwin (1954) and Song & Ashdown (2012), there are
five most important fitting elements to be considered: ease, line, grain, set and balance.
The principles for pants fit judging taken by Song & Ashdown (2012) and Henson (1991)
are as follows: a sufficient ease allowance for body movement, lines of pants conforming
to the body form, and the grain line being parallel to the front and back center of the
pants; pants that fit well should follow the silhouette of the front and back crotch curves,
waist, and buttocks without wrinkles or looseness, and no fabrics are pulled or folded in
these areas.
Four new jeans shorts were made after the patterns were adjusted for proper fit.
The jeans were placed on the mannequin again to re-evaluate the fit. The unclothed
Jeans subjects Measured Ease Allowance (mm) Designed Ease Allowance (mm)
Jeans #1 12.77 12.7
Jeans #2 26.07 25.4
Jeans #3 52.01 50.8
Jeans #4 78.14 76.2

34
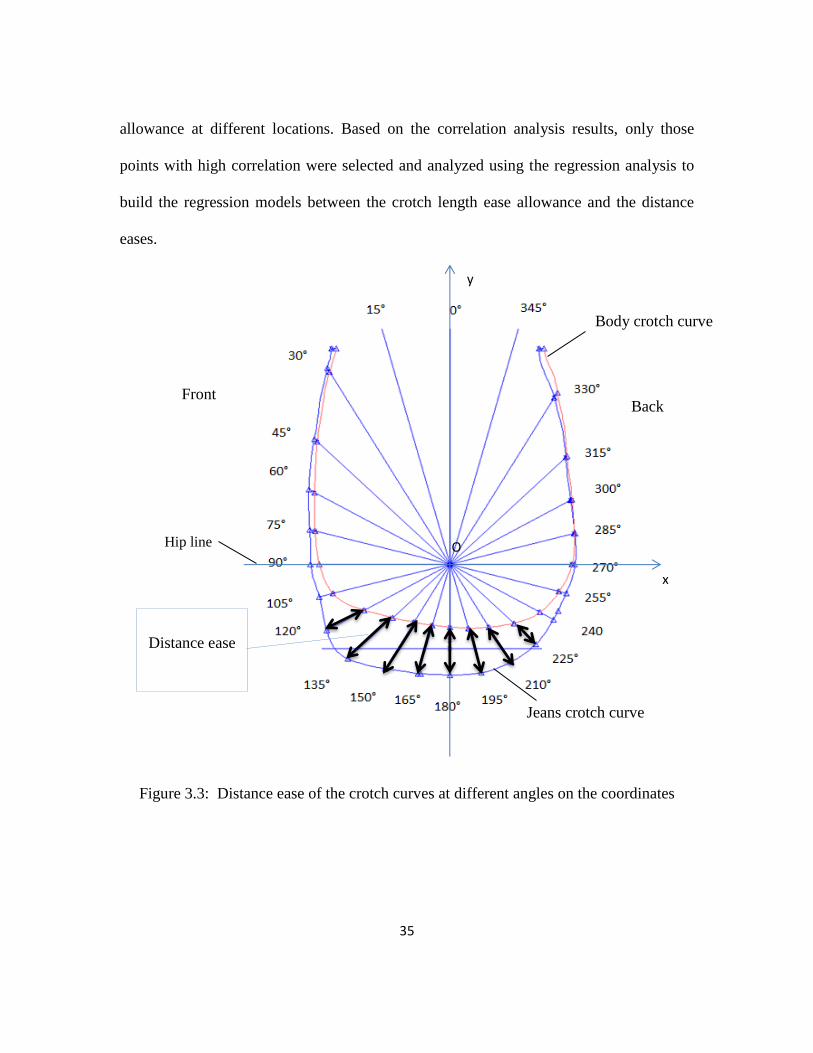
mannequin and mannequins wearing the four jeans were scanned. The virtual models
were generated, and the body measurements were obtained. The crotch curves coordinate
points of all the unclothed mannequins and dressed mannequins were extracted from the
image system. By inputting the coordinate point data and then connecting the related
coordinate points, the crotch curves were regenerated in the Accumark CAD system, as
shown in figure 3.3. The red line stands for the unclothed mannequin crotch curve, and
the blue line represents the crotch curve of the mannequin in jeans #4.
In this coordinate system, the hipline is set as the x-axis, while the y-axis,
perpendicular to the x-axis, is a line passing through the crotch point. From the origin of
the coordinates, point O, radials were drawn every 15°. The distance eases (DEs) were
defined as the space distance between the jeans and the body, as described by the
following equation:
DE = dj - db
where, dj stands for the distance from point O to any location of the jeans crotch
curve, and db stands for the distance from point O to any location of the body crotch
curve.
Since the front and back waist points are the start and end points of the crotch
curve, we added additional distance eases of these two points into the system. The
distance eases at the front and back waist points were obtained by connecting the points
of mannequin waist and jeans waist, and the lines were horizontal.
With all the distance eases at the various angles obtained, correlation analysis was
used to determine the relationship significance between the distance ease and ease
35
Front
x
Hip line
y
Distance ease
O
Back
x
Jeans crotch curve
allowance at different locations. Based on the correlation analysis results, only those
points with high correlation were selected and analyzed using the regression analysis to
build the regression models between the crotch length ease allowance and the distance
eases.
Figure 3.3: Distance ease of the crotch curves at different angles on the coordinates
Body crotch curve

36
Chapter 4: Experimental Results
4.1 FITTING ISSUES
For the size 8 mannequin, we found that the patterns made from instructions from
the book (Armstrong, 2006) do not properly fit under the buttock, as shown in figure 4.1.
Although the parts above the hipline fitted perfectly, the fabric under the buttock was
pulled while extra fabric were folded at the hipline; furthermore, the jeans waistline was
½ inch (12.7 mm) lower than the mannequin waistline.
With the help of a pattern making expert, the problems were analyzed: First, the
fabric was pulled at the area under the buttocks because the crotch extension was too
short. Second, there was extra fabric folded at the hipline, because the book (Armstrong,
2006) suggested opening a wedge on the back piece to supplement the total crotch length,
which turned out to be inappropriate for the mannequin body shape—low and flat hip.
Third, the jeans waistline was ½ inch (12.7 mm) lower, which means the ease of crotch
depth was not sufficient.
Based on the problems we found, the patterns were properly altered: (1) the
wedge on the back piece was closed; (2) the crotch points were extended horizontally by
¾ inch (19.05 mm) for the back piece, and ½ inch (12.7 mm) for the front piece for
crotch length augmentation; (3) the waistline was ½ inch (12.7 mm) evenly offset from
the original place, which indicates the crotch depth is ½ inch (12.7 mm) higher; (4) the
triangle value for the back piece is lengthened by ¼ inch (6.35 mm); (5) the crotch curve
was finally blended. The resulting jeans placing on the mannequin are shown in figure
4.2.

37
(a)
Figure 4.1: Jeans #1 before fitting, (a) Front; (b) Back.
(b)
Figure 4.2: Jeans #1 after fitting, (a) Front; (b) Back.
(a) (b)

38
4.2 DATA PROCESSING
The waistlines for the five scanned mannequins were supposed to be at the same
horizontal level; however, the resulting data showed that the waistlines of the four
dressed mannequins were generally higher than that of the unclothed mannequin. After
analysis, it was found that the waistline of the unclothed mannequin was ½ inch wide,
and during the scanning experiments, the jeans waistlines could be between the lower
edge and the upper edge of waistline, while the image system considered the lower edge
of the waistline was the waistline, which would cause the waistlines to be unmatched.
Therefore, we deleted those extra points beyond the natural waistline to ensure the waist
points of all the crotch curves were at the same horizontal level as the waistline of the
unclothed mannequin.
4.3 MANNEQUIN MODELS GENERATION
The front and back view of the unclothed mannequin and the dressed mannequin
wearing jeans #1 are illustrated in figure 4.3 and figure 4.4.

39
4.4 DISTANCE EASE DISTRIBUTION OF THE CROTCH CURVES
The crotch curves of the unclothed mannequin and the dressed mannequins were
regenerated in Accumark CAD system, as shown in figure 9. From figure 9 (a) (b) (d),
we can see that, above the back high hip area, the body crotch curves were wider than the
jeans crotch curves. Since the angle of the mannequin affect the capture of the crotch
curve, even though we tried our best to keep the mannequin from moving, it was
Figure 4.3: Unclothed mannequin
(a) Front; (b) Back.
(a) (b) (b)
Figure 4.4: Dressed mannequin
Wearing jeans #1 (a) Front; (b) Back.
(a) Front; (b) Back
(a)

40
sometimes unavoidable and possibly undetectable to slightly change the angle of the
mannequin when the jeans were taken on and off the mannequin, because the scanned
mannequin was hanging in the air and was not fixed. Therefore, it would be possible that
angles of the mannequins were slightly different when they were scanned.
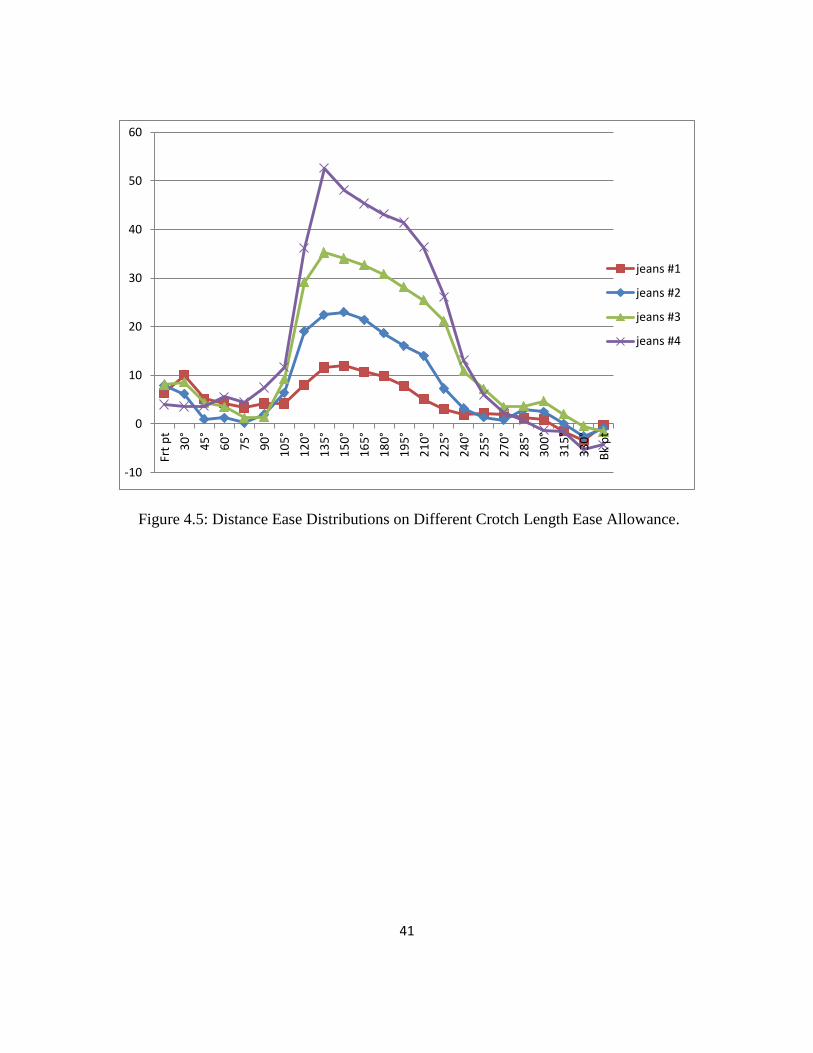
The distance eases of the four jeans with different ease allowances were measured
at various angles, as illustrated in figure 4.5 (in the x-axis, the “frt pt” is short for “front
waist point”, and the “bk pt” is short for “back waist point”). The DE distributions at
different angles are illustrated in figure 4.6. According to the DE distribution in figure 8,
four conclusions can be made: 1) the DEs from the front waist point ~ 105° and from 240°
~ back waist point were the smallest. This was because the mannequin’s abdomen and
hip shapes were both flat which makes the fabrics following the front and back body
silhouettes, resulting in little significant DE variance within these two ranges. 2) As the
point at 105° was the turning point of the body crotch curve, it was the turning point of
the distance eases distributions as well, because after 105°, the distance ease value
increased significantly for the four jeans. 3) The DEs at angles, from 120° ~ 225°, ranged
significantly higher than the rest area of the crotch curve; and for jeans #1 and jeans #2,
the DEs reached the highest at 135°; and for jeans #3 and jeans #4, the DEs reached the
peak at 150°. 4) The DE variance increases as the ease allowance grows. Among the four
jeans, the jeans #4 had the largest DE variance, ranging from -5.32 mm ~ 52.61 mm, and
the jeans #1 had smallest DE variance, ranging from -3.34 mm ~ 11.97 mm.
41
-10
0
10
20
30
40
50
60
Frt
pt
30
°
45
°
60
°
75
°
90
°
10
5°
12
0°
13
5°
15
0°
16
5°
18
0°
19
5°
21
0°
22
5°
24
0°
25
5°
27
0°
28
5°
30
0°
31
5°
33
0°
Bk
pt
jeans #1
jeans #2
jeans #3
jeans #4
Figure 4.5: Distance Ease Distributions on Different Crotch Length Ease Allowance.

42
(a) Jeans #1 and the body
crotch curves;
Figure 4.6: Jeans and body crotch curves and the corresponding distance eases at angles.
(b) Jeans #2 and the body
crotch curves;
(c) Jeans #3 and the body
crotch curves;
(d) Jeans #4 and the body
crotch curves;

43
4.5 CORRELATION ANALYSIS
The correlations between distance eases and ease allowances were analyzed using
Excel. The results are displayed in table 4.1. As we can see from the table 4.1, the
correlations at the back waist point and within 105° ~ 240° were significant at 95% or 99%
significance level, and their corresponding R2
were all larger than 0.9. Additionally, the
correlations at front waist point, within 30° ~ 90°, and 255° ~ 330° were poor, because
the jeans usually conform to the front and back body silhouettes, where little distance
ease variance occurs, no matter how the ease allowance at the crotch curve changes. This
explanation is the same as in section 4.4, which indicates the correlation analysis results
were reliable.
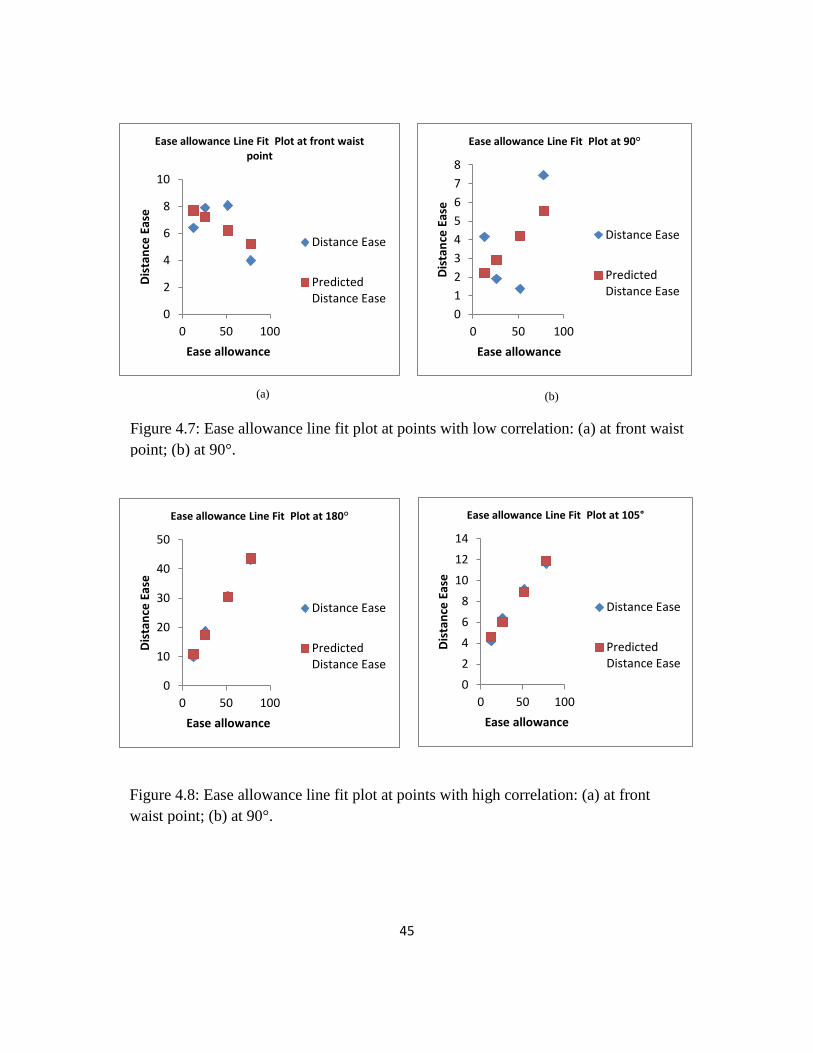
4.6 REGRESSION ANALYSIS
Regression analysis was used in Excel to build regression models between
distance eases and ease allowances. The ease allowance line fit plots are important tool to
examine the fit of models. In the Excel results, the plots were all displayed, but for
illustration, only take some sample points with low correlation (i.e., front waist point,
point at 90°) and those with high correlations for illustration, as displayed respectively in
figure 4.6 and figure 4.7. From the plots, we can see that the models of points with poor
correlations (i.e., at front waist, at 90°) lack significant fit, while higher correlation
corresponds to better fit (i.e., at 180° and at 105°). Therefore, it is meaningless to create
models for the points with low correlation.

44
Based on the correlation results and the fit plots, only those points with high
correlation were selected for building regression equations. The points were the ones at
angles 105°, 120°, 135°, 150°, 165°, 180°, 195°, 210°, 225°, 240°, and back waist center.
The dependent variable y is defined as the distance ease at a certain angle, and the
independent variable x is defined as the ease allowance of the crotch length. The
regression equations are displayed in table 4.2.
Degree R2 Significance F
Front waist point 0.336 0.421
30° 0.553 0.256
45° 0.001 0.975
60° 0.319 0.435
75° 0.172 0.586
90° 0.281 0.47
105° 0.988 0.006**
120° 0.95 0.025*
135° 0.994 0.003**
150° 0.988 0.006**
165° 0.988 0.006**
180° 0.996 0.002**
195° 0.998 0.001**
210° 0.991 0.004**
225° 0.961 0.019*
240° 0.946 0.028*
255° 0.652 0.193
270° 0.244 0.506
285° 0.034 0.815
300° 0.095 0.691
315° 0.002 0.956
330° 0.097 0.688
back waist point 0.912 0.045*
Table 4.1: Correlation analysis between distance ease and ease allowance
Note: * means the correlation is significant at 95% significance level,
and ** means the correlation is significant at 99% significance level.
45
0
10
20
30
40
50
0 50 100
Dis
tan
ce E
ase
Ease allowance
Ease allowance Line Fit Plot at 180°
Distance Ease
PredictedDistance Ease
0
2
4
6
8
10
12
14
0 50 100
Dis
tan
ce E
ase
Ease allowance
Ease allowance Line Fit Plot at 105°
Distance Ease
PredictedDistance Ease
Figure 4.8: Ease allowance line fit plot at points with high correlation: (a) at front
waist point; (b) at 90°.
0
2
4
6
8
10
0 50 100
Dis
tan
ce E
ase
Ease allowance
Ease allowance Line Fit Plot at front waist point
Distance Ease
PredictedDistance Ease
0
1
2
3
4
5
6
7
8
0 50 100
Dis
tan
ce E
ase
Ease allowance
Ease allowance Line Fit Plot at 90°
Distance Ease
PredictedDistance Ease
(a) (b)
Figure 4.7: Ease allowance line fit plot at points with low correlation: (a) at front waist
point; (b) at 90°.

46
Table 4.2: Regression models between distance ease and ease allowance at angles.
4.7 APPLICATIONS IN 3D FEMALE JEANS CONSTRUCTION AND PATTERN
ALTERATIONS
The result of this study can be applied in 3D female jeans construction. Proper
ease distributions at key body locations are an integral part of the 3D garment wireframe
construction in the automatic pattern customization based on 3D model. To the best of
our knowledge, little research has been done on the ease distribution at crotch curve. The
ease distribution models established in this study can be used to predict the distance ease
of the crotch curve at every 15° when the ease allowance at crotch curve and the body
crotch curve shape/measurement are presented. Based on the distance ease at each angle,
the estimated jeans crotch curve will be generated by connecting the points using B-
spline curves.
Degree R2 Regression equations
105° 0.988 y = 3.143 + 0.111x
120° 0.95 y = 5.683 + 0.412x
135° 0.994 y = 4.788 + 0.608x
150° 0.988 y= 6.873 + 0.53x
165° 0.988 y=5.955+0.511x
180° 0.996 y=4.472+0.5x
195° 0.998 y=2.021+0.506x
210° 0.991 y=0.397+0.469x
225° 0.961 y=-1.351+0.373x
240° 0.946 y=-0.613+0.186x
back waist point 0.912 y=0.693-0.058x

47
In addition, the ease distribution models developed in this study can also be
applied in pattern alterations for jeans customization. Conventionally, jeans pattern
alteration can be achieved by two methods—the slash and spread method and the seam
method (Wang, 2008). The slash and spread method can be used when extra length or
fabric is needed. For example, when the back crotch length is not sufficient, the hipline
would be slashed and spread to complement the difference. This method is usually
employed when an individual’s hip is much more prominent than “ideal” hip shape. In
seam method, the edge is altered based on the dimensional differences (Wang, 2008).
These two methods can be better implemented with the consideration of ease
distribution at key body locations. As the ease distribution model of the crotch curve for
customized jeans was established, the distance ease at every 15° angle can be estimated
when the body crotch length and its ease allowance are provided, as shown in figure 4.9
(a). Meanwhile, the jeans blocks of specific size, displayed in figure 4.9 (b), are selected
based on the individual body measurements. In order to alter the pattern for better fit, the
crotch curve is divided into four parts: (1) front waist to front hipline, (2) front hipline to
crotch point, (3) crotch point to back hipline, and (4) back hipline to back waist point.
The jeans pattern alterations are implemented by adjusting the four parts of curves
consecutively. For example, when the estimated distance between the front waist point to
front hipline of the jeans crotch curve is 12.7 mm longer than that of the standard block
crotch, the hipline would be slashed, and the pattern above the hipline would be rotated in
count clock wise direction until the distance reaches certain length (figure 4.10).
Moreover, given in figure 4.9 (a), the crotch depth is 18.66 mm lower than the body

48
crotch level, the crotch line of the standard pattern would be moved downward by that
amount. Furthermore, when the distance between the front hipline and the crotch point of
jeans is 25.4 mm longer than that of the block, the front crotch point is extended by 25.4
mm, and the new curve of this part is generated by extending the original curve to the
new front crotch point, as shown in the front piece in figure 4.10. The final crotch curve
is determined by blending the two curves. The same concept can be applied on the back
jeans pattern (figure 4.10).
Figure 4.9: (a) Distance ease distribution at crotch curve. (b) Jeans sloper with hipline
as a slash line.
Figure 4.10: Altered jeans pattern with ease
hipline Crotch point
hipline hipline
Crotch
point
Crotch line Crotch line
(a) (b)
Front Back
Front Back
12.7
18.66
25.4
18.66
49
Chapter 5: Conclusion and Recommendations for Future Work
5.1 Introduction
The purpose of this study is to analyze the existing automatic pattern development
methods and to examine the distance ease distribution of jeans crotch curves. In this
study, a systematic analysis of the existing automatic pattern development methods has
been conducted. There are two main approaches for achieving automatic pattern making
based on the 3D body scanning data: (1) two-dimensional patternmaking in 2D CAD
systems, and (2) 3D-to-2D techniques. In the first approach, experience and expertise in
pattern development are the key to ensure excellent fit. In the second approach, the ease
distributions at various locations are essential in drafting customized-fit garment patterns;
and yet, the distance ease distributions at the crotch curve remained unclear.
In order to fill the gap, in the second part, an experiment was conducted to
investigate the relationship between the distance ease and the given crotch length ease
allowance. Based on the scanning measurements of a size 8 mannequin, jeans patterns
with four different crotch ease allowances were drafted in Accumark CAD, and were
printed in full scale using an HP printer. The patterns were cut on muslin fabric, and four
jeans were produced. Fitting process was conducted and patterns were adjusted to
produce the best fit jeans. Further, the unclothed mannequin and the corresponding
dressed mannequins were scanned again by the Kinect Body Image System. Then, the
crotch curves were regenerated in Accumark CAD system, and the distance eases were
50
measured every 15°. Correlation analysis and regression analysis were used to analyze
the relationship between the distance ease and ease allowance.
The key experimental results of this study are summarized as below:
1) In terms of crotch curve, distance eases are mainly distributed between the legs.
2) There exists big difference of correlations, from different angles, between
distance ease and crotch length ease allowance. The distance eases at back waist
point and from the angle 105° to 240° were significantly affected by the ease
allowance, while no correlation was found at front waist point, 30° ~ 90° and 255°
~ 330°.
3) The regression models between distance ease and ease allowance at key angles
were generated, which can be further applied in prediction of distance ease
distribution given by any crotch length ease allowance.
4) Better correlation between ease allowance and distance eases contributed to better
model fit.
In order to obtain the accurate crotch curve data, it is critical to keep the
mannequin facing the front cameras at right angle, and to prevent it from moving,
because once the mannequin’s angle changes even slightly, the crotch curve captured by
the system could be slightly or sometimes quite wider/narrower from the real crotch
curve. That’s why sometimes the mannequin crotch width was slightly wider than the
jeans crotch width. Therefore, it might be a challenge if the subject is human instead of a
mannequin, because we cannot guarantee that human body will not to move during
scanning.

51
A similar methodology has been utilized in horizontal cross sections of breast
girth (Zhang et al, 2012), hip girth, abdomen girth, and knee girth (Su, 2014). And yet,
very few studies have been done to study the distance ease of crotch curve, which is
essential in the fit of pants/jeans. Nevertheless, the conclusion that better correlation
resulted in better fit of regression model is the same as the conclusion made by Zhang et
al. (2012); and the distance ease distributions at the front center and back are similar to
the findings of McKinney (2007). On the other hand, the findings of the distance ease
distributions under the crotch curve and between the legs were never found before, and
the new findings can be applied in 3D jeans design and pattern alterations, which would
improve the fit of jeans.
5.2 Limitations of this study
Since the focus of the present study is the ease distribution of the crotch curve,
this study is limited to the jeans block foundation for females; the foundation refers to the
portion of jeans above the crotch line. Another limitation of this study is that the sample
size of jeans ease allowances was too small. In this study, only four jeans with various
ease allowances (12.7 mm, 25.4 mm, 50.8 mm, and 76.2 mm) were developed and
studied. It would be better if the more detailed classification of ease allowances (i.e., 0
mm, 12.7 mm, 25.4 mm, 38.1 mm, 50.8 mm, 63.5 mm, 76.2 mm … etc.) were studied.
In addition, since a mannequin is usually used in the study of ease distribution to
avoid the effect of respiration, breath and unconscious body movements of the human
body, and that the concept of ease distribution in 3D garment is a relatively novel concept,

52
this study is limited in using a female mannequin instead of human body. It would be
ideal if a larger scale of experiments can be conducted to analyze the ease distribution of
female/male human bodies of various sizes and body shapes using 3D body scanners and
reverse engineering technology.
Moreover, since the focus of this study is the DE at crotch curve, other variables,
such as the DEs of hip girth, waist girth, thigh girth, and knee girth were not considered
in the research. Further research is needed to integrate the all the DEs into consideration
to design jeans that fit the best.
Furthermore, muslin is commonly used in the sample making of garments, and it
is widely used in the studies of pants making. However, it is still necessary to use denim
to test the ease distributions.
Notwithstanding the limitation of this study, the results provide strong support for
3D female jeans constructions and for female jeans pattern alterations, which would
improve the fit of jeans.
5.3 Recommendations on future study
The ease distribution of crotch curves for female jeans has been studied on the
female mannequin of size 8 in this research. The recommendations on future study are
stated below:
(1) Male or children’s jeans block patterns should be studied using the proposed
method.

53
(2) A software which incorporates all the processes of this study should be developed
to speed up the 3D jeans design and patternmaking.
(3) A large scale and comprehensive investigation which covers different age groups,
body shapes and sizes should be conducted for establishing more robust models
between crotch ease allowances and distance eases.
(4) Subjective and objective fitting evaluations should be conducted on human bodies
to test the comfort of the crotch curves on real humans.
(5) The ease distribution in the cross sections of hipline, high hip line, waistline, knee
line, and crotch curve should be fully considered in designing customized jeans.

54
Bibliography
Apeagyei, P. R., & Otieno, R. (2007). Usability of pattern customising technology in the
achievement and testing of fit for mass customisation. Journal of Fashion
Marketing and Management, 11(3), 349-365.
Armstrong, H. J., Carpenter, M., Sweigart, M., Randock, S., & Venecia, J.
(2006). Patternmaking for fashion design. Upper Saddle River, NJ: Pearson
Prentice Hall.
Ashdown, S. P., & Dunne, L. (2006). A study of automated custom fit: Readiness of the
technology for the apparel industry. Clothing and Textiles Research
Journal, 24(2), 121-136.
Carrere, C., Istook, C., Little, T., Hong, H., & Plumlee, T. (2000). Automated garment
development from body scan data. National Textile Center Annual Report I.
Chen, A., Fan, J. and Yu, W. (2003). A Study of Shirt Pattern Drafting Methods, Part 2:
Prediction of Shirt Patterns using Human Body Anthropometrical Data. Sen-I
Gakkaishi, Vol. 59 No.8, ISSN 0037-9875, pp.328-33.
Chen, Y., Happiette, M., Bruniaux, P., Ng, R., & Yu, W. (2006). Estimation of ease
allowance of a garment using fuzzy logic. In Fuzzy Applications in Industrial
Engineering (pp. 367-379). Springer Berlin Heidelberg.
Decaudin, P., Julius, D., Wither, J., Boissieux, L., Sheffer, A., & Cani, M. P. (2006,
September). Virtual garments: A fully geometric approach for clothing design.
In Computer Graphics Forum (Vol. 25, No. 3, pp. 625-634). Blackwell
Publishing, Inc.
Floater, M. S., & Hormann, K. (2005). Surface parameterization: a tutorial and survey. In
Advances in multiresolution for geometric modelling (pp. 157-186). Springer
Berlin Heidelberg.
Gazzuolo, E. B. (1985). A theoretical framework for describing body form variation
relative to pattern shape (Doctoral dissertation, University of Minnesota).

55
Henson, S. K. (1991). The development of a method for determining the best-fit shape for
the crotch seam of men's pants.
Hongjun T. (2005). Computer Aided Suit Pattern Parametric Design. Dalian University
of Technology.
Huang, H. (2011). Development of 2D block patterns from fit feature-aligned flattenable
3D garments.
Istook, C. L. (2002). Enabling mass customization: computer-driven alteration
methods. International Journal of Clothing Science and Technology, 14(1), 61-76.
Ives, B., & Piccoli, G. (2003). CUSTOM MADE APPAREL AND INDIVIDUALIZED
SERVICE AT LANDS'END. Communications of the Association for Information
Systems, 11.
JCPenney “when it fits, you feel it” commercial: http://www.marketmenot.com/jcpenney-
you-feel-it-when-it-fits-so-well-commercial/
Kim, S. M., & Kang, T. J. (2003). Garment pattern generation from body scan
data. Computer-Aided Design, 35(7), 611-618.
Kim, S., & Park, C. K. (2007). Basic garment pattern generation using geometric
modeling method. International Journal of Clothing Science and Technology,
19(1), 7-17.
Lévy, B., Petitjean, S., Ray, N., & Maillot, J. (2002, July). Least squares conformal maps
for automatic texture atlas generation. In ACM Transactions on Graphics (TOG)
(Vol. 21, No. 3, pp. 362-371). ACM.
Lim, H., & Istook, C. L. (2012). Automatic Pattern Generation Process for Made-to-
Measure. Journal of Textile and Apparel, Technology and Management, 7(4).
Liu, Y. J., Lai, Y. K., & Hu, S. M. (2007, October). Developable Strip Approximation of
Parametric Surfaces with Global Error Bounds. In Computer Graphics and
Applications, 2007. PG'07. 15th Pacific Conference on (pp. 441-444). IEEE.
Liu, Y. J., Zhang, D. L., & Yuen, M. M. F. (2010). A survey on CAD methods in 3D
garment design. Computers in Industry, 61(6), 576-593.

56
McKinney, E. C. (2007). Towards a three-dimensional theory of pattern drafting:
Relationship of body measurements and shapes to pattern measurements and
shapes (Doctoral dissertation, UNIVERSITY OF MINNESOTA).
McKinney, E. C., Bye, E., & LaBat, K. (2012). Building patternmaking theory: a case
study of published patternmaking practices for pants. International Journal of
Fashion Design, Technology and Education, 5(3), 153-167.
Minott, J. (1978). Fitting commercial patterns: The Minott method. Burgess Publishing
Company.
Ng, R. (2004), “Garment pattern design with artificial neural network and fuzzy logic”,
paper presented at International Fashion Culture Festival, Shanghai. Jingjing N.
(2005). Suit PDS Intelligent Expert Knowledge Study. Beijing Institute of
Fashion Technology.
Optitex Modulate MTM, 2014: http://www.optitex.com/zh-hans/node/36.
Petrak, S., Rogale, D., & Mandekic-Botteri, V. (2006). Systematic representation and
application of a 3D computer-aided garment construction method: Part II: spatial
transformation of 3D garment cut segments. International Journal of Clothing
Science and Technology, 18(3), 188-199.
Pottmann, H., & Wallner, J. (1999). Approximation algorithms for developable
surfaces. Computer Aided Geometric Design, 16(6), 539-556.
Rasband, J. and Liechty, E.G. (2006), Fabulous Fit: Speed Fitting and Alteration,
Fairchild Publications, Inc, New York, NY.
Satam, D., Liu, Y., & Lee, H. J. (2011). Intelligent design systems for apparel mass
customization. The Journal of The Textile Institute, 102(4), 353-365.
Sheffer, A., Lévy, B., Mogilnitsky, M., & Bogomyakov, A. (2005). ABF++: fast and
robust angle based flattening. ACM Transactions on Graphics (TOG), 24(2), 311-
330. (CITED BY 201)
Shimada, T., & Tada, Y. (1991). Approximate transformation of an arbitrary curved
surface into a plane using dynamic programming. Computer-Aided Design, 23(2),
153-159.

57
Song, H. K., & Ashdown, S. P. (2011). Categorization of lower body shapes for adult
females based on multiple view analysis. Textile Research Journal, 81(9), 914-
931.
Song, H. K., & Ashdown, S. P. (2012). Development of Automated Custom-Made Pants
Driven by Body Shape. Clothing and Textiles Research Journal, 30(4), 315-329.
Su, J.Q., Gu, B. F., Liu, G.L. and Xu, B. (2014), Determination and Application of
Distance Ease of Pants Using 3D Scanning Data, International Journal of
Clothing Science and Technology, in press.
Turner, J. P., & Bond, T. (1999). Made-to-measure garments for ladies–catering for wide
ranging stature and length measurements for standard and outsize ladies.
International Journal of Clothing Science and Technology, 11(4), 216-225
Wang, C. C., Smith, S. S., & Yuen, M. M. (2002). Surface flattening based on energy
model. Computer-Aided Design, 34(11), 823-833.
Wang, C. C., Wang, Y., & Yuen, M. M. (2004). On increasing the developability of a
trimmed NURBS surface. Engineering with Computers, 20(1), 54-64.
Wang, Z., Newton, E., Ng, R., & Zhang, W. (2006). Ease distribution in relation to the X-
line style jacket. Part 1: Development of a mathematical model. Journal of the
Textile Institute, 97(3), 247-256.
Wang, Z. (2008). A study of ease distribution in relation to jacket pattern alteration.
Xin L. (2005).The Apparel Design System Based on the Figure of the Middle-Aged and
Elderly People’s Prototype. Published mater thesis
Xiuying J. (2007). Research on Intelligent Programming of Men’s Casual Garment
Making. Beijing Institute of Fashion Technology.
Xu, B., Pepper, M. R., Freeland-Graves, J. H., Yu, W., & Yao, M. (2009). Three-
dimensional surface imaging system for assessing human obesity. Optical
Engineering, 48(10), 107204-107204.
Xu, J., Zhang, W., & Xiao, P. (2008, November). A study on impact factors of the
distance eases between body and garment. In Computer-Aided Industrial Design

58
and Conceptual Design, 2008. CAID/CD 2008. 9th International Conference on
(pp. 201-205). IEEE.
Xu, J., & Zhang, W. (2009, May). The Vacant Distance Ease Relation between Body and
Garment. In Information and Computing Science, 2009. ICIC'09. Second
International Conference on (Vol. 4, pp. 38-41). IEEE.
Yan L., Zhaofeng G. & Xiaogang L. (2003). Intelligent Clothing Design System.
Donghua University Journal (Natural Science version), p67-70.
Yang, Y., Zhang, W., & Shan, C. (2007). Investigating the development of digital
patterns for customized apparel. International Journal of Clothing Science and
Technology, 19(3/4), 167-177.
Zhang A., Wang Y., Yao Y. (2012). Study on relationships between garment's distance
ease distributions at bust section. Journal of Textile Research, vol. 33, No. 6.
Zhu Q. (2004). Fast Generation of Men’s apparel pattern for MTM. Donghua University.