copyright (c) 2013 by asme heat dissipation mechanism at
TRANSCRIPT

Acce
pted
Man
uscr
ipt N
ot C
opye
dite
d
Corresponding author: Satish Kumar Paper No. HT-12-1637 1
Heat Dissipation Mechanism at Carbon Nanotube Junctions on Silicon Oxide Substrate
Liang Chen
e-mail: [email protected]
Satish Kumar
e-mail: [email protected]
G.W. Woodruff School of Mechanical Engineering
Georgia Institute of Technology, Atlanta, Georgia, 30332, USA
ABSTRACT
This study investigates heat dissipation at carbon nanotube (CNT) junctions supported on silicon dioxide
substrate using molecular dynamics simulations. The temperature rise in a CNT (~top CNT) not making
direct contact with the oxide substrate but only supported by other CNTs (~bottom CNT) is observed to
be hundreds of degree higher compared to the CNTs well-contacted with the substrate at similar power
densities. The analysis of spectral temperature decay of CNT-oxide system shows very fast intra-tube
energy transfer in a CNT from high frequency band to intermediate frequency bands. The low frequency
phonon band (0-5 THz) of top CNT shows two-stage energy relaxation which results from the efficient
coupling of low frequency phonons in the CNT-oxide system and the blocking of direct transport of high
and intermediate frequency phonons of top CNT to the oxide substrate by bottom CNT.
KEYWORDS: carbon nanotube network, molecular dynamics, phonons, interfacial thermal transport
1 INTRODUCTION
Due to the exceptional electronic, thermal, and mechanical properties [1] of carbon nanotubes
(CNTs), their networks and arrays have been widely investigated for thin-film transistors (TFTs) [2] on
flexible or transparent substrates to improve the performance in diverse applications such as liquid crystal
displays, sensors, and flexible antennae and radar [3-5]. The fabrication of fully transparent and
mechanically flexible TFTs using aligned CNT arrays or a random network of CNTs have demonstrated
Journal of Heat Transfer. Received November 30, 2012;Accepted manuscript posted September 17, 2013. doi:10.1115/1.4025436Copyright (c) 2013 by ASME
Downloaded From: http://heattransfer.asmedigitalcollection.asme.org/ on 01/08/2014 Terms of Use: http://asme.org/terms

Acce
pted
Man
uscr
ipt N
ot C
opye
dite
d
Corresponding author: Satish Kumar Paper No. HT-12-1637 2
high potential of CNT networks for next generation display technologies [6, 7]. In a transparent or
flexible display, the carbon nanotube network based thin film transistors (CN-TFTs) will be placed
between glass or polymer which have low thermal conductivity. Besides, their surfaces are usually cooled
only through natural convection which can make self-heating critical especially for CN-TFTs operating in
high frequency range (~ MHz) [8, 9]. Although CNTs have high thermal conductivity [10, 11], the
interfacial thermal conductance at CNT-substrate interfaces [12-19] and CNT-CNT junctions [20-24] are
very low which can exacerbate the self-heating effects and can significantly degrade the TFT
performance.
Studies of breakdown of a single CNT supported on SiO2 substrate [12, 16] have demonstrated that
the thermal boundary resistance (TBR) between CNTs and SiO2 substrate limits the heat dissipation. The
TBR is dependent on the CNT-substrate van der Waals (vdW) interactions, CNT diameter, and substrate
roughness [16, 17]. The thermal energy exchange at the CNT-CNT interfaces (~ CNT junctions) is even
worse due to the weak interactions and small contact area. The large TBR at CNT junctions can have
dominant effect on the heat transport in CNT networks which is highly dependent on the CNT spacing
and overlap [23]. Experimental analysis in Reference [21] showed that the TBR at CNT junction can
decrease by nearly two orders of magnitude (from 810 to 610 K/W) as the contact area increases from a
cross contact to an aligned contact. The bulk thermal conductivity of a 3D random network of CNTs [24]
can be as low as 0.13 ~ 0.20 W/mK due to the low TBR at CNT junctions, which is even smaller than the
thermal conductivity of the amorphous polymers used for the thermal insulation. The high electrical and
thermal resistances at CNT junctions have been considered as the key factors that can limit the
performance and reliability of CN-TFTs because they can cause hot spots, inefficient heat removal or
even breakdown of CNTs [25]. Therefore, it is of great interest and importance to explore the thermal
transport mechanism at CNT junctions and CNT-substrate interfaces.
Molecular dynamic (MD) simulations have been used in previous studies to estimate the TBR at CNT
junctions and CNT-substrate interfaces and to investigate the roles of different phonon modes. These
studies are based on the heat pulse analysis [26-29], direct methods [23, 30, 31], or transient relaxation
Journal of Heat Transfer. Received November 30, 2012;Accepted manuscript posted September 17, 2013. doi:10.1115/1.4025436Copyright (c) 2013 by ASME
Downloaded From: http://heattransfer.asmedigitalcollection.asme.org/ on 01/08/2014 Terms of Use: http://asme.org/terms

Acce
pted
Man
uscr
ipt N
ot C
opye
dite
d
Corresponding author: Satish Kumar Paper No. HT-12-1637 3
methods [14, 17, 32]. Although, the calculated TBR values have large variations in these studies due
to the different CNT structures, empirical potential models, and statistical methodologies, a general
agreement can be observed about the role of phonon modes in interfacial thermal transport. The large
interfacial resistance between CNTs can be attributed to the weak vdW interactions [23] and small
contact area. At CNT junctions, CNTs are non-bonded, and atoms interact through weak van der
Waals forces. The modes which has strong inter-tube coupling such as bending, waving, and radial
breathing are low frequency modes while the high frequency modes such as in-plane distortions and
transverse modes has weak inter-tube coupling. [20, 26] The low frequency phonons are dominant
heat carriers across CNT-SiO2 interface as the transmission of high-frequency phonons (above a few
tens of THz) is highly suppressed [22, 24]. Most of the previous studies were performed on isolated
CNT junctions or CNT-substrate interfaces. In many applications such as CN-TFTs, the CNT network
is supported on an oxide substrate [16, 25]. A close observation of these networks [16, 25] reveal that
many CNTs may not be directly touching substrate, but partially or fully supported by other CNTs
which can lead to the structures similar to shown in Fig. 1(b) or Fig. 1(c). Such structures can lead to
the localized hot spots in the CNT networks and can pose severe reliability issues to the TFTs. Gupta
et al. [33] analyzed the effects of TBRs at CNT interfaces on electrical breakdown of CN-TFTs using
a coupled electro-thermal model. Their study also estimated the TBRs at CNT interfaces in CN-TFTs
using the experimentally measured temperature distribution and power dissipation in TFTs. The
phonon transport at these CNT junctions significantly affect TBR, temperature rise and hence CN-
TFT performance and reliability. However, the phonon transport across CNT junction structures
supported on a SiO2 substrate has not been explored. Atomistic simulations of the thermal transport
across such CNT structures can provide insights into possible modifications of molecular structure at
the interface to enhance the phonon spectra matching and phonon mode coupling leading to better
heat removal from the CN-TFTs [20].
In this study, we use molecular dynamics (MD) simulations to investigate the heat dissipation and
phonon interactions at CNT junctions supported on SiO2 substrate. We obtain the equilibrium
Journal of Heat Transfer. Received November 30, 2012;Accepted manuscript posted September 17, 2013. doi:10.1115/1.4025436Copyright (c) 2013 by ASME
Downloaded From: http://heattransfer.asmedigitalcollection.asme.org/ on 01/08/2014 Terms of Use: http://asme.org/terms

Acce
pted
Man
uscr
ipt N
ot C
opye
dite
d
Corresponding author: Satish Kumar Paper No. HT-12-1637 4
structures of the single CNT and CNT junctions supported on an oxide substrate (see Fig. 1), and
demonstrate that at similar power densities the temperature in hanging CNTs (~ supported by only other
CNTs) can be hundreds of degree higher compared to the CNTs well-contacted with the substrate leading
to early breakdown. We investigate the decay of thermal energy in different frequency ranges using the
spectral temperature. The high frequency phonons in CNTs (> 40 THz) do not have counterpart in SiO2
substrate. However, they still have similar relaxation time as phonons in intermediate frequency range (5-
40 THz), which suggests very fast intra-tube energy transfer in a CNT from high frequency band to
intermediate frequency bands. We find that the low frequency phonon band (0-5 THz) of top CNT in a
SiO2 supported CNT junction have two-stage energy relaxation. The first stage with fast relaxation shows
efficient coupling of low frequency phonons in CNT-oxide system. The second stage with very slow
relaxation is consequence of blocking of the direct transport of high frequency phonons of top CNT to the
oxide substrate by bottom CNT.
2 NUMERICAL METHODLOGY
Molecular dynamics (MD) simulation is a promising method to study the interfacial thermal transport
as different atomic configurations can be easily considered and phonon-phonon scattering events at
interface including anharmonic effects can be inherently treated in a natural way [34, 35]. In this paper,
we perform MD simulations on three configurations of CNT junctions (see Fig. 1) in order to develop an
understanding of heat dissipation and phonon interactions in CNT networks supported on SiO2 substrate.
System I consists of a single CNT directly supported on the SiO2 substrate, while the CNTs in System II
and III are placed on one and two perpendicular CNTs, respectively. System II represents a typical
crossed CNT junction in the CNT network of a CN-TFT, while system III represents CNTs in a high
density network which is only supported by other CNTs and which do not make direct contact with the
substrate. The substrate is periodic in x (length) and z (width) directions; it has 24,052 atoms and its
dimensions are 285.0 Å × 23.7 Å × 59.6 Å. We have checked the length effect by increasing the length of
top CNT to 400 Å and performing the thermal relaxation simulations (Section 3.1) for System I. No
Journal of Heat Transfer. Received November 30, 2012;Accepted manuscript posted September 17, 2013. doi:10.1115/1.4025436Copyright (c) 2013 by ASME
Downloaded From: http://heattransfer.asmedigitalcollection.asme.org/ on 01/08/2014 Terms of Use: http://asme.org/terms

Acce
pted
Man
uscr
ipt N
ot C
opye
dite
d
Corresponding author: Satish Kumar Paper No. HT-12-1637 5
obvious difference is observed in the estimated relaxation time. The distance between the two bottom
CNTs in System III is half of the substrate length in x-direction which ensures a symmetric
configuration on two sides from the center of substrate. The CNTs in the simulations have a chirality
of (6, 0) and diameter of 4.7 Å. We use Lammps package [36] for the molecular dynamics
simulations. To describe C-C interactions in CNTs, we use the adaptive intermolecular reactive
empirical bond order potential (AIREBO) [37]. For the amorphous SiO2, we use the Munetoh
parameterization [38] of the Tersoff potential to describe the Si-Si, O-O, and Si-O interactions. The
vdW interactions between the CNT atoms at the interface are modeled by Lennard-Jones potential,
12 6
4ij ij ij ijV r r r
. The present study employs the L-J parameterization used by Zhong
and Lukes [23], with C-C 4.41meV and C-C 0.228 nm . The vdW between the C-Si and C-O are
also modeled using a L-J potential with the parameters from the universal force field (UFF) model by
Rappe et al [39]. The parameters are C-Si 8.909 meV , C-O 3.442 meV , C-Si 0.3326 nm , and
C-O 0.3001nm similar to parameters used in Reference [17, 18].
In the MD simulations, the atoms in the bottom layer of substrate are fixed to anchor the
substrate. A time step of 0.25 fs is used for all simulations. In order to obtain the equilibrium
structures, we first perform an energy minimization on the CNTs and amorphous SiO2 system and
then we equilibrate the system using NPT at 1 bar and 375 K for 1 ns. We applied a very small force
(0.001 eV/Å on each atom) on the top CNT during the first 0.25 ns simulation in NPT to prevent the
CNT to fly away from the system, and afterward the force is removed. Following the NPT
equilibration, the volume of simulation box is determined, and the equilibration is continued using
NVT at 375 K for 1 ns. The structures after equilibration are shown in Fig. 1. The deformation in
CNTs due to the interaction with substrate is observed to be very small and its cross-section remains
in circular shape after the equilibration, which is expected for small-diameter CNTs (d<21 Å) [16].
The single CNT in System I is completely supported by the substrate and remains straight after the
equilibration like an isolated CNT. The top CNT in System II has a curvature near the region
Journal of Heat Transfer. Received November 30, 2012;Accepted manuscript posted September 17, 2013. doi:10.1115/1.4025436Copyright (c) 2013 by ASME
Downloaded From: http://heattransfer.asmedigitalcollection.asme.org/ on 01/08/2014 Terms of Use: http://asme.org/terms

Acce
pted
Man
uscr
ipt N
ot C
opye
dite
d
Corresponding author: Satish Kumar Paper No. HT-12-1637 6
supported by the bottom CNT. The minimum distance between the top CNT and SiO2 substrate in System
II is shown in Fig. 2. The curvature region spans 91 Å, which is about 20 times of the CNT diameter. As
the spacing between the bottom CNTs supporting top CNT decreases, the top CNT get fully detached
from the substrate as in System III and only has a slight bending toward the substrate at the ends.
3 RESULTS AND DISCUSSIONS
In order to elucidate the thermal transport at supported CNT junctions, we present the thermal
analysis using two methods. The first one is the direct method of classical MD simulations where we
examine the temperature distribution in CNT junctions and substrate by heating the top CNT (Section
3.1). In the second method, we study the transient energy relaxation in system (Section 3.2) by MD
simulations and investigate the spectral energy decay using the spectral energy density (SED) approach.
[14, 32]
3.1 Thermal Transport at CNT junction under High Power Density
In the direct MD method, we apply heating power in the range of 5 nW to 26.5 nW on the top CNT
by rescaling the velocities of atoms. The maximum value 26.5 nW is selected following the experimental
results [25] of the breakdown power of CNTs at high temperatures. A thermostat is applied to a 5Å thick
region above the fixed layer of SiO2 substrate to control its temperature at 375 K. The simulations are
performed on the three configurations prepared by the equilibration (Fig. 1). Each case is simulated for 15
ns (25 ns for system III) to obtain a steady state, and then the data are sampled for 5 ns
During the sampling period, we calculate the temperature within 67 slabs along the CNT by
2B
3 1
2 2
n
i i
i
nk T m v (1)
where n is the number of atoms per slabs, and im and iv are the mass and velocity of each atom. Bk is
the Boltzmann’s constant. Since the CNTs in the present simulations are relatively short and have very
large thermal conductivity in the length direction, the temperature variations along the top CNTs are very
Journal of Heat Transfer. Received November 30, 2012;Accepted manuscript posted September 17, 2013. doi:10.1115/1.4025436Copyright (c) 2013 by ASME
Downloaded From: http://heattransfer.asmedigitalcollection.asme.org/ on 01/08/2014 Terms of Use: http://asme.org/terms

Acce
pted
Man
uscr
ipt N
ot C
opye
dite
d
Corresponding author: Satish Kumar Paper No. HT-12-1637 7
small. The top CNT in System I is in complete contact with the substrate and in system II is also primarily
supported by the substrate; consequently small temperature variations (< 3K) has been observed. The top
CNT in System III is supported by two bottom CNTs with a small contact. The section of top CNT
between the supports can be treated as suspended CNT, and the contact with the bottom CNTs acts as heat
sinks. The temperature distribution along the top CNT in System III at heating power of 26.5 nW is
shown in Fig. 3; the variations are within 10 K, but larger than that in the other two Systems. The two
minima in temperature are at coordinates of around -75 Å and 75 Å (Fig. 3), where the bottom CNTs are
located. So the input power to top CNT is first transferred to two bottom CNTs through the small contact
area at CNT junctions, and then conducted to the substrate through the bottom CNTs.
The temperature variation in top CNT at different heating power is shown in Fig. 4. The
temperature rise for the fully supported (~System I) or partially supported CNT on SiO2 (~System II)
is not large, even at a high power density. However, the temperature increases rapidly when the top
CNT is only supported by bottom CNTs and do not make any direct contact with the substrate
(~System III). The contact area between the small diameter tubes is very small, and the inefficient
heat conduction between CNTs can lead to this overheating in the top CNT at high power density. In
our simulations, the temperature of top CNT increases beyond 834 K at the heating power of 26.5 nW
which suggests that the breakdown temperature (873 K) [15, 25] will be easily reached in such CNTs
even though the other CNTs in the network will be at much lower temperatures (~ 400 K).
As shown in Fig. 2, the CNT contact area with the substrate in System II is reduced by 32%
compared to System I but its temperature rise is only about 10 K (see Fig. 4) larger than that in
System I. So it is of high interest to find how the heat is conducted to the substrate in System II. As
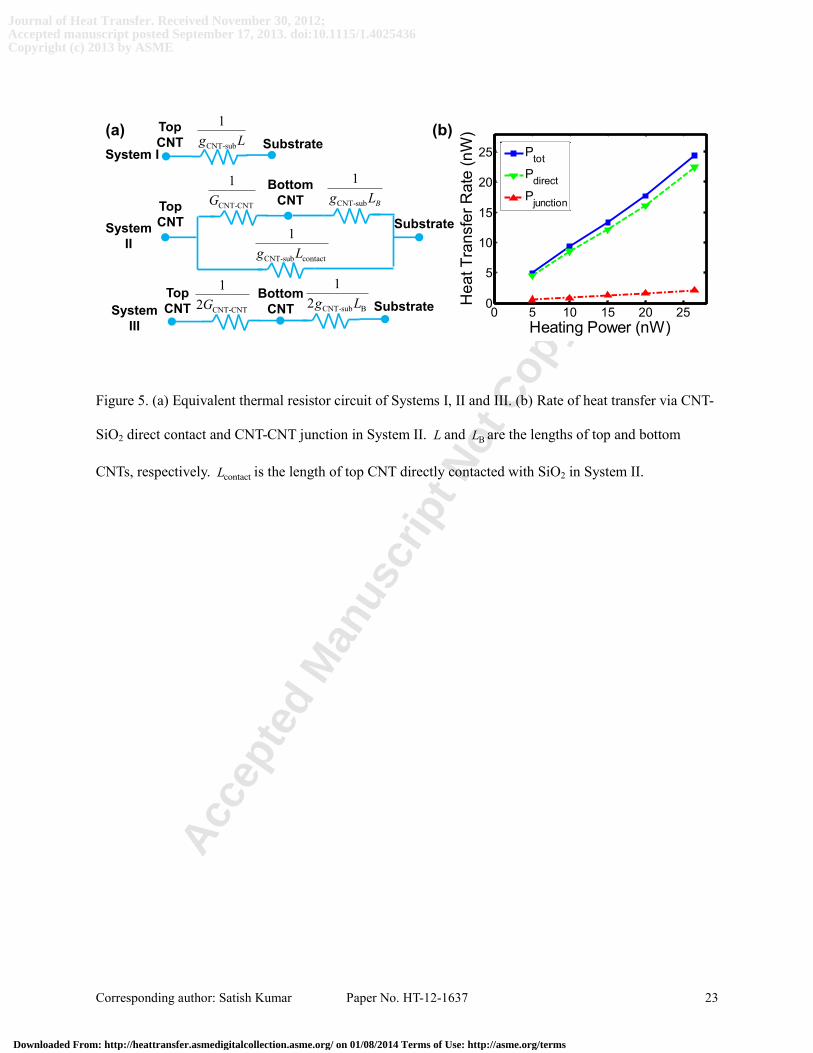
shown in Fig. 5 (a), there are two heat conduction paths: (i) in the first path heat is directly conducted
from top CNT to the substrate and the important thermal conductance is CNT-subg (see System I), and
(ii) in the second path heat is conducted first to bottom CNT and then to SiO2 substrate; the important
thermal conductance are CNT-CNTG and CNT-subg (see System III). Due to the 1-D structure of CNT,
Journal of Heat Transfer. Received November 30, 2012;Accepted manuscript posted September 17, 2013. doi:10.1115/1.4025436Copyright (c) 2013 by ASME
Downloaded From: http://heattransfer.asmedigitalcollection.asme.org/ on 01/08/2014 Terms of Use: http://asme.org/terms
Acce
pted
Man
uscr
ipt N
ot C
opye
dite
d
Corresponding author: Satish Kumar Paper No. HT-12-1637 8
thermal conductance between CNT and substrate is defined as the rate of heat transfer per unit length
(W/mK). Thermal conductance at CNT junction is not normalized with contact area and has unit of W/K.
We can further assume interfacial thermal conductance through these two paths in System II equals to
corresponding values in System I and III, respectively. Based on the thermal resistor circuit shown in Fig.
5 (a), the overall conductance from top CNT to SiO2 substrate for each system can be obtained.
I CNT-subG g L (2)
1
II CNT-sub contactCNT-CNT CNT-sub B
1 1G g L
G g L
(3)
1
IIICNT-CNT CNT-sub B
1 1
2 2G
G g L
(4)
Using the temperature response at different heating power (Fig. 4), thermal conductance CNT-subg and
CNT-CNTG can be determined. Thermal conductance CNT-subg is estimated as 0.014 W/mK. Reference [17]
gave an expression to estimate thermal conductance between CNT and SiO2 substrate for the CNT
diameter in the range of 0.81~1.63 nm and temperature in the range of 200~600 K. However, CNT
diameter considered in our study is only 0.47 nm which is much smaller than the lower limit in Ref. [17].
If we extrapolate beyond the diameter range studied in Ref. [17], we estimate thermal conductance of
0.029 W/mK at 375K. The thermal conductance of CNT junction is 0.042 nW/K which is approximately
twice of the value (~0.02 nW/K for CNTs with diameter of 0.5 nm) determined by atomistic Green’s
Function Calculations in Ref. [22]. Using thermal conductance CNT-subg and CNT-CNTG , the rate of heat
transfer via two different paths in System II can be determined, as shown in Fig. 5 (b). It can be observed
that heat is mainly conducted through the direct contact with the substrate, and less than 10% of the
power is dissipated through the CNT-CNT junction. Since the CNTs have a high thermal conductivity, the
heat generated in the buckled section of the top CNT can be first efficiently conducted along the tube to
the sections supported by the SiO2 substrate and then get dissipated to the substrate. Even if the contact
length with the substrate is reduced by 32% in System II, the heat can still be effectively dissipated
Journal of Heat Transfer. Received November 30, 2012;Accepted manuscript posted September 17, 2013. doi:10.1115/1.4025436Copyright (c) 2013 by ASME
Downloaded From: http://heattransfer.asmedigitalcollection.asme.org/ on 01/08/2014 Terms of Use: http://asme.org/terms
Acce
pted
Man
uscr
ipt N
ot C
opye
dite
d
Corresponding author: Satish Kumar Paper No. HT-12-1637 9
through the reduced contact length (~18 nm) with a relatively small temperature rise. This agrees well
with the previous measurements which suggest that relatively short contact lengths (10-30 nm) to a
typical solid should be sufficient to transfer heat efficiently.[12]
We then calculate the overall thermal conductance at each interface in System III. Thermal
conductance at CNT-CNT interfaces is about 0.084 nW/K which is half of the thermal conductance
(0.172 nW/K) between bottom CNT and SiO2 substrate. This indicates enhancing heat transfer at
CNT junction will yield the largest gain. Besides, a low CNT junction density can also help to
maintain a good contact between CNT and SiO2 and avoid the fully suspended CNT structures as in
System III; such CNTs should be removed from the CNT network in order to avoid hot spots.
3.2 Spectral Analysis of Heat Dissipation at CNT Junction
In order to investigate the role of phonon interactions in the interfacial thermal transport, we use
the transient relaxation method and SED approach to obtain the transient decay of spectral
temperature. In the simulations, we set an initial temperature difference T between the top CNT and
bottom CNTs/SiO2 substrate. We set the bottom CNTs and SiO2 substrate at 375 K and the top CNT at
600 K. This is achieved by first equilibrating the top CNT 600 K for 100 ps in the three
configurations previously prepared by equilibration. The temperature of the bottom CNTs and SiO2
substrate is kept at 375 K. The temperature is controlled by the velocity rescaling thermostat. Then,
the thermostat is switched off, and the system is allowed to relax for 0.25 ns and 0.5 ns for System I
and System III, respectively. The relaxation is simulated in a NVE ensemble. [17, 18] The
temperature profile and the SED are averaged over every 10 time steps to reduce the random
fluctuations of MD simulations.
We analyze the phonon energy distribution in the top CNT by calculating the SED. The SED is
obtained by taking the Fourier transform of velocities of C atoms with respect to the frequency ω and
wave vector k [32].
Journal of Heat Transfer. Received November 30, 2012;Accepted manuscript posted September 17, 2013. doi:10.1115/1.4025436Copyright (c) 2013 by ASME
Downloaded From: http://heattransfer.asmedigitalcollection.asme.org/ on 01/08/2014 Terms of Use: http://asme.org/terms

Acce
pted
Man
uscr
ipt N
ot C
opye
dite
d
Corresponding author: Satish Kumar Paper No. HT-12-1637 10
23 1
,
0
1, ,
2
p N
z j
j n
mk exp ik z v n t exp i t dt
N
(5)
where p is the atoms in each unit cell, and N is the total number of unit cells in z direction. j , n , and
are the indices for p , N , and co-ordinate axes, respectively. The dispersion relations can be obtained
by plotting the contour of the SED with respect to ω and zk , as shown in Fig. 6(a). The wave vector is
defined as 2z zk n a N where za is the lattice constant in z direction. The frequency dependence of the
phonon energy distribution can be obtained by analyzing the spectrum of velocity which is determined by
taking the Fourier transform of atom velocities with respect to frequency ω [32].
a 3 2
,a
1g
3
N
j
j
v t exp i t dtN
(6)
where aN is the total number of atoms. The normalized spectrum energy of C, O and Si atoms in System
III are shown in Fig. 6(b). The spectral energy of C, Si, and O is normalized to the maximum value of
spectral energy of C atoms in the top CNT. By assuming the energy is evenly distributed among all the
phonon modes for CNTs at equilibrium, the equilibrium spectrum energy, eqg , can be written as :
eq eqB( )g k T (7)
where ( ) is the phonon density of states and eqT is the equilibrium kinetic temperature. We further
assume that ( ) does not change during the transient relaxation, and introduce the spectral temperature
sp( , )T t [32]. The transient spectrum energy can be written as:
neqB sp( ) ( , )g k T t (8)
In the calculation of transient spectrum energy, the short time Fourier transform is used. The
velocities are sampled every 5 fs, which corresponds to the sampling rate of 200 THz. Then the entire
time series are divided into blocks of 5 ps length and shift of 0.5 ps. Finally, we can determine the spectral
temperature of each frequency band by
Journal of Heat Transfer. Received November 30, 2012;Accepted manuscript posted September 17, 2013. doi:10.1115/1.4025436Copyright (c) 2013 by ASME
Downloaded From: http://heattransfer.asmedigitalcollection.asme.org/ on 01/08/2014 Terms of Use: http://asme.org/terms
Acce
pted
Man
uscr
ipt N
ot C
opye
dite
d
Corresponding author: Satish Kumar Paper No. HT-12-1637 11
2
1
neqeq
sp eq1 2
( )gT
T t dg
(9)
In order to develop an understanding of the phonon coupling at the interfaces, we divide the
entire frequency range into four bands, as shown in Fig. 6(b). Band 1 is the low frequency region
below 5 THz which is most important for the energy transfer across interfaces. Band 2 and 3
corresponds to the frequency range of 5-12 THz and 12-40 THz. The overlap between the frequency
spectrum of CNTs and SiO2 exists in all the first three bands. Band 4 spans from 40 THz to 55 THz
which has no overlap between frequency spectrum of CNTs and SiO2. The SED ,?k and the
frequency dependence of the spectral energy g of the CNT in system I are similar to system III.
The transient decay of spectral temperature spT t and its difference to the substrate temperature
spT t are shown in Fig. 7 (a) and (b) for system I and in Fig. 7 (c) and (d) for system III. We obtain
the relaxation time constant, τ, of the spectral energy of each band by fitting the spectral temperature
with an exponential function, i.e., sp 0exp( / )T t T t . The relaxation time of the overall
temperature of the top CNT in System I is 119 ps (Fig. 7 (b)). The spectral energy of band 1 decays
fast with a relaxation time of 70 ps, while the spectral energies of the other three bands decays slowly
with relaxation times (~115-121 ps) close to the overall temperature (Fig. 7 (b)). The fast relaxation
of the low frequency spectral temperature indicates an efficient energy transfer across the interface,
which confirms the importance of the low frequency phonons in the interfacial heat transfer.[18, 19]
As shown in Fig. 6(b), there is no overlap in phonon spectrum of CNT and SiO2 in band 4. It can be
observed that spT of the band 4 (not overlapping with SiO2) also decays at nearly the same rate as the
overall temperature. The phonons in band 4 of CNT have to dissipate energy to its own bands 1-3
(below 40 THz and overlapping with SiO2) to transfer energy to SiO2 substrate. This intra-tube energy
transfer must be much faster than the interfacial energy transfer.[14] The similarity between the
energy relaxation of bands 2, 3 and 4 may also indicates that the energy in band 4 primarily dissipate
Journal of Heat Transfer. Received November 30, 2012;Accepted manuscript posted September 17, 2013. doi:10.1115/1.4025436Copyright (c) 2013 by ASME
Downloaded From: http://heattransfer.asmedigitalcollection.asme.org/ on 01/08/2014 Terms of Use: http://asme.org/terms

Acce
pted
Man
uscr
ipt N
ot C
opye
dite
d
Corresponding author: Satish Kumar Paper No. HT-12-1637 12
to band 2 and 3 (Fig. 7(b)).
Compared to System I, System III has a much larger relaxation time (~1372 ps) for the overall
temperature decay of the top CNT (Figs. 7 (c) and 7 (d)). The spectral temperature in band 2 to 4 decays
similar to the overall temperature. However, the energy in band 1 has a two-stage decay characteristic,
and cannot be described by a single relaxation time. So we fit the spT t to the sum of two exponential
functions: sp 0, 1, , 1, 1
0exp( / ) exp( / )a a b bT t T t T t . The first stage is very fast with a relaxation time,
1, a , of 47 ps, but the second stage is much slower ( 1, b =2132 ps). In System III, the top CNT is
supported only by bottom CNTs and have a small contact area and weak vdW interactions at the interface.
The tube-tube energy transfer is mainly achieved by the low frequency phonons.[20, 22] As shown in
Reference [22] using the atomic Green’s function calculation, the phonon transmission above 10 THz is
strongly suppressed, and this frequency threshold becomes even smaller for small diameter CNTs. For the
CNT of chirality (6, 0) in this study, the phonon transmission has diminished to nearly zero for frequency
above 8 THz.[22] In this stage the energy carried by low frequency phonons, which are excited during
heating process, is transferred to the lower CNTs/ substrate rapidly due to the efficient coupling between
the low frequency modes. The second stage ( 1, b =2132 ps) may corresponds to the phase when the
energy in high frequency bands (2 to 4) is first transferred to band 1 before getting transferred to lower
CNT and the substrate. As shown in Fig. 7 (d), the time constant of spectral temperature relaxation is
smallest for the highest frequency band but largest for the second stage of the low frequency band (
4 3 2 1b ). This is because bottom CNTs block the energy transfer through the direct coupling of
high frequency phonons and the energy from high frequency band need to be first transferred to the lower
frequency band. The energy can get accumulated in these high frequency modes. As dominant energy
content is in the high frequency bands, the slower relaxation of energy in high frequency bands (~2 to 4)
to low frequency band (~1) as reflected in high 1, b and absence of direct coupling of high frequency
phonons may become bottleneck for energy exchange at interface.
In system III, the bottom CNT works as a frequency filter which blocks the direct energy transfer via
Journal of Heat Transfer. Received November 30, 2012;Accepted manuscript posted September 17, 2013. doi:10.1115/1.4025436Copyright (c) 2013 by ASME
Downloaded From: http://heattransfer.asmedigitalcollection.asme.org/ on 01/08/2014 Terms of Use: http://asme.org/terms

Acce
pted
Man
uscr
ipt N
ot C
opye
dite
d
Corresponding author: Satish Kumar Paper No. HT-12-1637 13
the high frequency phonons from top CNT to substrate. Coupling of higher frequency phonons can
help to enhance the heat transfer at CNT junctions, which may be achieved by nano-engineering the
CNT-CNT interfaces through polymer wrapping, metal coating and linker molecules. [20, 40]
Polymer molecules or smaller linker molecules can also be used as fillers to bridge the gap between
top CNT and SiO2. Besides, CNTs with larger diameter can have larger interfacial thermal
conductance and contact area. [20, 33] But larger diameter can increase the buckling length of top
CNTs, and thereby significantly reduce the contact area with substrate and deteriorate the heat
dissipation around CNT junctions. [33]
CONCLUSIONS
In summary, the present study investigates the heat dissipation at CNT junctions supported on
SiO2 substrate using direct method and transient relaxation method of MD simulations. A CNT
junction can reduce the contact of top CNT with the SiO2 substrate by about 20 times of the CNT
diameter, but the temperature of top CNT heated by high power does not increases rapidly until it
becomes fully suspended. The relatively short contact length (~18 nm in present study) of CNT with
substrate is sufficient for the heat removal at a high power density with an acceptable increase of
temperature rise. However, CNTs fully suspended on other CNTs can reach to breakdown
temperature at similar power density. In a CN-TFT with high density network such suspended CNTs
will be prone to early breakdown. The role of phonons in the interfacial energy transfer in the
supported CNT junctions is examined by analyzing the spectral temperature decay. The importance of
the low frequency phonons in the interfacial thermal transport is confirmed by its fast relaxation. The
bottom CNT in the supported CNT junctions blocks the direct transport of high frequency phonons of
top CNT to the oxide substrate. The primary energy exchange in CNT-CNT-oxide junctions is
through low frequency phonons in the range of 0-10 THz. The energy carried by these low frequency
phonons in the fully suspended CNTs decays in two stages. The second stage seems to corresponds to
intra-tube energy exchange from high frequency bands to low frequency bands in top CNT and then
Journal of Heat Transfer. Received November 30, 2012;Accepted manuscript posted September 17, 2013. doi:10.1115/1.4025436Copyright (c) 2013 by ASME
Downloaded From: http://heattransfer.asmedigitalcollection.asme.org/ on 01/08/2014 Terms of Use: http://asme.org/terms
Acce
pted
Man
uscr
ipt N
ot C
opye
dite
d
Corresponding author: Satish Kumar Paper No. HT-12-1637 14
to the bottom CNT and substrate.
NOMENCLATURE
A contact area
E energy
G thermal boundary conductance
L length
N number of unit cells
T temperature
V potential energy
g spectral energy
j index for atoms in a unit cell
k index for unit cells
Bk Boltzmann constant
m atomic mass
n number of atoms
p number of atoms in a unit cell
t time
v velocity
Greek symbols
index for dimensions
depth of potential well in L-J potential
spectral energy density
phonon density of states
Journal of Heat Transfer. Received November 30, 2012;Accepted manuscript posted September 17, 2013. doi:10.1115/1.4025436Copyright (c) 2013 by ASME
Downloaded From: http://heattransfer.asmedigitalcollection.asme.org/ on 01/08/2014 Terms of Use: http://asme.org/terms

Acce
pted
Man
uscr
ipt N
ot C
opye
dite
d
Corresponding author: Satish Kumar Paper No. HT-12-1637 15
distance parameter in L-J potential
relaxation time constant
angular frequency
Subscripts
I system I
II system II
III system III
C carbon
Si silicon
O oxygen
Superscripts
eq equilibrium
neq non-equilibrium
sp spectral
ACKNOWLEDGEMENT
This work has been partly supported by the National Science Foundation Grant CBET-1236416
and CCF-1319935. We acknowledge technical discussion with Man Prakash Gupta (Georgia Institute
of Technology) and Prof. Eric Pop (Stanford University).
REFERENCES
[1] Baughman, R. H., Zakhidov, A. A., and de Heer, W. A., 2002, "Carbon nanotubes - the route toward
applications," Science, 297(5582), pp. 787-792.
[2] Reuss, R. H., Chalamala, B. R., Moussessian, A., Kane, M. G., Kumar, A., Zhang, D. C., Rogers,
J. A., Hatalis, M., Temple, D., Moddel, G., Eliasson, B. J., Estes, M. J., Kunze, J., Handy, E. S., Harmon,
E. S., Salzman, D. B., Woodall, J. M., Alam, M. A., Murthy, J. Y., Jacobsen, S. C., Olivier, M., Markus,
Journal of Heat Transfer. Received November 30, 2012;Accepted manuscript posted September 17, 2013. doi:10.1115/1.4025436Copyright (c) 2013 by ASME
Downloaded From: http://heattransfer.asmedigitalcollection.asme.org/ on 01/08/2014 Terms of Use: http://asme.org/terms

Acce
pted
Man
uscr
ipt N
ot C
opye
dite
d
Corresponding author: Satish Kumar Paper No. HT-12-1637 16
D., Campbell, P. M., and Snow, E., 2005, "Macroelectronics: Perspectives on technology and
applications," P Ieee, 93(7), pp. 1239-1256.
[3] Cao, Q., and Rogers, J. A., 2009, "Ultrathin Films of Single-Walled Carbon Nanotubes for
Electronics and Sensors: A Review of Fundamental and Applied Aspects," Adv Mater, 21(1), pp. 29-53.
[4] Novak, J. P., Snow, E. S., Houser, E. J., Park, D., Stepnowski, J. L., and McGill, R. A., 2003,
"Nerve agent detection using networks of single-walled carbon nanotubes," Appl Phys Lett, 83(19), pp.
4026-4028.
[5] Snow, E. S., Novak, J. P., Lay, M. D., Houser, E. H., Perkins, F. K., and Campbell, P. M., 2004,
"Carbon nanotube networks: Nanomaterial for macroelectronic applications," J Vac Sci Technol B, 22(4),
pp. 1990-1994.
[6] Kim, S., Kim, S., Park, J., Ju, S., and Mohammadi, S., 2010, "Fully Transparent Pixel Circuits
Driven by Random Network Carbon Nanotube Transistor Circuitry," Acs Nano, 4(6), pp. 2994-2998.
[7] Kim, S., Ju, S., Back, J. H., Xuan, Y., Ye, P. D., Shim, M., Janes, D. B., and Mohammadi, S.,
2009, "Fully Transparent Thin-Film Transistors Based on Aligned Carbon Nanotube Arrays and Indium
Tin Oxide Electrodes," Adv Mater, 21(5), pp. 564-568.
[8] Valletta, A., Moroni, A., Mariucci, L., Bonfiglietti, A., and Fortunato, G., 2006, "Self-heating
effects in polycrystalline silicon thin film transistors," Appl Phys Lett, 89(9), p. 093509.
[9] Kumar, S., Pimparkar, N., Murthy, J. Y., and Alam, M. A., 2011, "Self-consistent electrothermal
analysis of nanotube network transistors," J Appl Phys, 109(1), p. 014315.
[10] Pop, E., Mann, D., Wang, Q., Goodson, K., and Dai, H. J., 2006, "Thermal conductance of an
individual single-wall carbon nanotube above room temperature," Nano Lett, 6(1), pp. 96-100.
[11] Kim, P., Shi, L., Majumdar, A., and McEuen, P. L., 2001, "Thermal transport measurements of
individual multiwalled nanotubes," Phys Rev Lett, 87(21), p. 215502.
[12] Maune, H., Chiu, H. Y., and Bockrath, M., 2006, "Thermal resistance of the nanoscale
constrictions between carbon nanotubes and solid substrates," Appl Phys Lett, 89(1), p. 013109.
[13] Tsai, C. L., Liao, A., Pop, E., and Shim, M., 2011, "Electrical power dissipation in
semiconducting carbon nanotubes on single crystal quartz and amorphous SiO(2)," Appl Phys Lett, 99(5),
p. 053120.
[14] Ong, Z. Y., and Pop, E., 2010, "Frequency and polarization dependence of thermal coupling
between carbon nanotubes and SiO(2)," J Appl Phys, 108(10), p. 103502.
[15] Pop, E., Mann, D. A., Goodson, K. E., and Dai, H. J., 2007, "Electrical and thermal transport in
metallic single-wall carbon nanotubes on insulating substrates," J Appl Phys, 101(9), p. 093710.
[16] Liao, A., Alizadegan, R., Ong, Z. Y., Dutta, S., Xiong, F., Hsia, K. J., and Pop, E., 2010, "Thermal
dissipation and variability in electrical breakdown of carbon nanotube devices," Phys Rev B, 82(20), p.
205406.
[17] Ong, Z. Y., and Pop, E., 2010, "Molecular dynamics simulation of thermal boundary conductance
between carbon nanotubes and SiO(2)," Phys Rev B, 81(15), p. 155408.
[18] Ong, Z. Y., Pop, E., and Shiomi, J., 2011, "Reduction of phonon lifetimes and thermal
conductivity of a carbon nanotube on amorphous silica," Phys Rev B, 84(16), p. 165418.
[19] Grujicic, M., Cao, G., and Gersten, B., 2004, "Atomic-scale computations of the lattice
contribution to thermal conductivity of single-walled carbon nanotubes," Mat Sci Eng B-Solid, 107(2),
pp. 204-216.
[20] Xu, Z. P., and Buehler, M. J., 2009, "Nanoengineering Heat Transfer Performance at Carbon
Nanotube Interfaces," Acs Nano, 3(9), pp. 2767-2775.
[21] Yang, J. K., Waltermire, S., Chen, Y. F., Zinn, A. A., Xu, T. T., and Li, D. Y., 2010, "Contact
thermal resistance between individual multiwall carbon nanotubes," Appl Phys Lett, 96(2), p. 023109.
[22] Chalopin, Y., Volz, S., and Mingo, N., 2009, "Upper bound to the thermal conductivity of carbon
nanotube pellets," J Appl Phys, 105(8), p. 084301.
[23] Zhong, H. L., and Lukes, J. R., 2006, "Interfacial thermal resistance between carbon nanotubes:
Molecular dynamics simulations and analytical thermal modeling," Phys Rev B, 74(12), p. 125403.
Journal of Heat Transfer. Received November 30, 2012;Accepted manuscript posted September 17, 2013. doi:10.1115/1.4025436Copyright (c) 2013 by ASME
Downloaded From: http://heattransfer.asmedigitalcollection.asme.org/ on 01/08/2014 Terms of Use: http://asme.org/terms
Acce
pted
Man
uscr
ipt N
ot C
opye
dite
d
Corresponding author: Satish Kumar Paper No. HT-12-1637 17
[24] Prasher, R. S., Hu, X. J., Chalopin, Y., Mingo, N., Lofgreen, K., Volz, S., Cleri, F., and Keblinski,
P., 2009, "Turning Carbon Nanotubes from Exceptional Heat Conductors into Insulators," Phys Rev Lett,
102(10), p. 105901.
[25] Estrada, D., and Pop, E., 2011, "Imaging dissipation and hot spots in carbon nanotube network
transistors," Appl Phys Lett, 98(7), p. 073102.
[26] Chen, L., and Kumar, S., 2011, "Thermal transport in double-wall carbon nanotubes using heat
pulse," J Appl Phys, 110(7), p. 074305.
[27] Kumar, S., and Murthy, J. Y., 2009, "Interfacial thermal transport between nanotubes," J Appl
Phys, 106(8), p. 084302.
[28] Osman, M. A., and Srivastava, D., 2005, "Molecular dynamics simulation of heat pulse
propagation in single-wall carbon nanotubes," Phys Rev B, 72(12), p. 125413.
[29] Shiomi, J., and Maruyama, S., 2006, "Non-Fourier heat conduction in a single-walled carbon
nanotube: Classical molecular dynamics simulations," Phys Rev B, 73(20), p. 205420.
[30] Diao, J., Srivastava, D., and Menon, M., 2008, "Molecular dynamics simulations of carbon
nanotube/silicon interfacial thermal conductance," J Chem Phys, 128(16), p. 164708.
[31] Thomas, J. A., Iutzi, R. M., and McGaughey, A. J. H., 2010, "Thermal conductivity and phonon
transport in empty and water-filled carbon nanotubes," Phys Rev B, 81(4), p. 045413.
[32] Carlborg, C. F., Shiomi, J., and Maruyama, S., 2008, "Thermal boundary resistance between
single-walled carbon nanotubes and surrounding matrices," Phys Rev B, 78(20), p. 205406.
[33] Gupta, M. P., Chen, L., Estrada, D., Behnam, A., Pop, E., and Kumar, S., 2012, "Impact of
thermal boundary conductances on power dissipation and electrical breakdown of carbon nanotube
network transistors," J Appl Phys, 112(12), p. 124506.
[34] Cahill, D. G., Ford, W. K., Goodson, K. E., Mahan, G. D., Majumdar, A., Maris, H. J., Merlin, R.,
and Phillpot, S. R., 2003, "Nanoscale thermal transport," J Appl Phys, 93(2), pp. 793-818.
[35] Maruyama, S., 2002, "A molecular dynamics simulation of heat conduction in finite length
SWNTs," Physica B, 323(1-4), pp. 193-195.
[36] Plimpton, S., 1995, "Fast Parallel Algorithms for Short-Range Molecular-Dynamics," J Comput
Phys, 117(1), pp. 1-19.
[37] Stuart, S. J., Tutein, A. B., and Harrison, J. A., 2000, "A reactive potential for hydrocarbons with
intermolecular interactions," J Chem Phys, 112(14), pp. 6472-6486.
[38] Munetoh, S., Motooka, T., Moriguchi, K., and Shintani, A., 2007, "Interatomic potential for Si-O
systems using Tersoff parameterization," Comp Mater Sci, 39(2), pp. 334-339.
[39] Rappe, A. K., Casewit, C. J., Colwell, K. S., Goddard, W. A., and Skiff, W. M., 1992, "Uff, a Full
Periodic-Table Force-Field for Molecular Mechanics and Molecular-Dynamics Simulations," J Am Chem
Soc, 114(25), pp. 10024-10035.
[40] Varshney, V., Patnaik, S. S., Roy, A. K., and Farmer, B. L., 2010, "Modeling of Thermal
Conductance at Transverse CNT-CNT Interfaces," J Phys Chem C, 114(39), pp. 16223-16228.
Journal of Heat Transfer. Received November 30, 2012;Accepted manuscript posted September 17, 2013. doi:10.1115/1.4025436Copyright (c) 2013 by ASME
Downloaded From: http://heattransfer.asmedigitalcollection.asme.org/ on 01/08/2014 Terms of Use: http://asme.org/terms
Acce
pted
Man
uscr
ipt N
ot C
opye
dite
d
Corresponding author: Satish Kumar Paper No. HT-12-1637 18
Figure Captions
Figure 1. Configurations of (a) System I, (b) System II, and (c) System III. These Systems are
equilibrated at 375K.
Figure 2. Minimum distance between top CNT and SiO2 substrate in System II (see Fig. 1 (b)). Here, x=0
corresponds to the mid-point of the bottom CNT.
Figure 3. Temperature distribution along the top CNT in System III at heating power of 26.5 nW.
Figure. 4. Temperature variations of top CNT in the three Systems shown in Fig. 1 as a function of
heating power.
Figure 5. (a) Equivalent thermal resistor circuit of Systems I, II and III. (b) Rate of heat transfer via CNT-
SiO2 direct contact and CNT-CNT junction in System II. L and BL are the lengths of top and bottom
CNTs, respectively. contactL is the length of top CNT directly contacted with SiO2 in System II.
Figure. 6. (a) Phonon dispersion relations of top CNT in system III at T=375 K. k is wave vector
normalized with respect to 2 za . (b) Normalized phonon spectral energy of system III at different
frequencies at T=375 K. The spectral energy of C (in top and bottom CNTs), Si, and O is normalized to
the maximum value of spectral energy of C atoms in top CNT. The frequency ranges of four phonon
bands (1-4) are shown.
Figure. 7. Top CNT total temperature, substrate temperature, and spectral temperature ( spT ) of four
frequency bands (see Fig. 6 (b)) of top CNT in (a) System I and (c) System III. The transient decay of
difference between top CNT total temperature (or spectral temperature of phonon bands) and substrate
temperature ( T ) for (b) System I and (d) System III. The unit of time constant is picosecond.
Journal of Heat Transfer. Received November 30, 2012;Accepted manuscript posted September 17, 2013. doi:10.1115/1.4025436Copyright (c) 2013 by ASME
Downloaded From: http://heattransfer.asmedigitalcollection.asme.org/ on 01/08/2014 Terms of Use: http://asme.org/terms

Acce
pted
Man
uscr
ipt N
ot C
opye
dite
d
Corresponding author: Satish Kumar Paper No. HT-12-1637 19
Figure 1. Configurations of (a) System I, (b) System II, and (c) System III. These Systems are
equilibrated at 375K.
x
y
(a)
(b)
(c)
System I
System II
System III
Journal of Heat Transfer. Received November 30, 2012;Accepted manuscript posted September 17, 2013. doi:10.1115/1.4025436Copyright (c) 2013 by ASME
Downloaded From: http://heattransfer.asmedigitalcollection.asme.org/ on 01/08/2014 Terms of Use: http://asme.org/terms

Acce
pted
Man
uscr
ipt N
ot C
opye
dite
d
Corresponding author: Satish Kumar Paper No. HT-12-1637 20
Figure 2. Minimum distance between top CNT and SiO2 substrate in System II (see Fig. 1 (b)). Here, x=0
corresponds to the mid-point of the bottom CNT.
-150 -100 -50 0 50 100 1502
4
6
8
10
x (?D
min
(?
(Å)
(Å)
91 Å
Journal of Heat Transfer. Received November 30, 2012;Accepted manuscript posted September 17, 2013. doi:10.1115/1.4025436Copyright (c) 2013 by ASME
Downloaded From: http://heattransfer.asmedigitalcollection.asme.org/ on 01/08/2014 Terms of Use: http://asme.org/terms

Acce
pted
Man
uscr
ipt N
ot C
opye
dite
d
Corresponding author: Satish Kumar Paper No. HT-12-1637 21
Figure 3. Temperature distribution along the top CNT in System III at heating power of 26.5 nW.
-100 0 100825
830
835
840
x
Tem
pera
ture
(K
)
(Å)
Journal of Heat Transfer. Received November 30, 2012;Accepted manuscript posted September 17, 2013. doi:10.1115/1.4025436Copyright (c) 2013 by ASME
Downloaded From: http://heattransfer.asmedigitalcollection.asme.org/ on 01/08/2014 Terms of Use: http://asme.org/terms

Acce
pted
Man
uscr
ipt N
ot C
opye
dite
d
Corresponding author: Satish Kumar Paper No. HT-12-1637 22
Figure. 4. Temperature variations of top CNT in the three Systems shown in Fig. 1 as a function of
heating power.
5 10 15 20 25
400
500
600
700
800
Heating Power (nW)
Tem
pe
ratu
re (
K)
System I
System II
System III
Journal of Heat Transfer. Received November 30, 2012;Accepted manuscript posted September 17, 2013. doi:10.1115/1.4025436Copyright (c) 2013 by ASME
Downloaded From: http://heattransfer.asmedigitalcollection.asme.org/ on 01/08/2014 Terms of Use: http://asme.org/terms
Acce
pted
Man
uscr
ipt N
ot C
opye
dite
d
Corresponding author: Satish Kumar Paper No. HT-12-1637 23
Figure 5. (a) Equivalent thermal resistor circuit of Systems I, II and III. (b) Rate of heat transfer via CNT-
SiO2 direct contact and CNT-CNT junction in System II. L and BL are the lengths of top and bottom
CNTs, respectively. contactL is the length of top CNT directly contacted with SiO2 in System II.
0 5 10 15 20 250
5
10
15
20
25
Heating Power (nW)
He
at T
ran
sfe
r R
ate
(n
W)
Ptot
Pdirect
Pjunction
System I
Top
CNT SubstrateCNT-sub
1
g L
System
II
Top
CNT
Bottom
CNT
Substrate
CNT-CNT
1
G CNT-sub
1
Bg L
CNT-sub contact
1
g L
System
III
Top
CNT SubstrateCNT-CNT
1
2G CNT-sub B
1
2g LBottom
CNT
(a) (b)
Journal of Heat Transfer. Received November 30, 2012;Accepted manuscript posted September 17, 2013. doi:10.1115/1.4025436Copyright (c) 2013 by ASME
Downloaded From: http://heattransfer.asmedigitalcollection.asme.org/ on 01/08/2014 Terms of Use: http://asme.org/terms

Acce
pted
Man
uscr
ipt N
ot C
opye
dite
d
Corresponding author: Satish Kumar Paper No. HT-12-1637 24
Figure. 6. (a) Phonon dispersion relations of top CNT in system III at T=375 K. k is wave vector
normalized with respect to 2 za . (b) Normalized phonon spectral energy of system III at different
frequencies at T=375 K. The spectral energy of C (in top and bottom CNTs), Si, and O is normalized to
the maximum value of spectral energy of C atoms in top CNT. The frequency ranges of four phonon
bands (1-4) are shown.
0 10 20 30 40 500
0.2
0.4
0.6
0.8
1
1.2
Frequency (THz)
No
rma
lize
d S
pe
ctr
al E
ne
rgy
Top CNT
Bottom CNT
O
Si
(a) (b)
1 2 3 4
5 12 40
Journal of Heat Transfer. Received November 30, 2012;Accepted manuscript posted September 17, 2013. doi:10.1115/1.4025436Copyright (c) 2013 by ASME
Downloaded From: http://heattransfer.asmedigitalcollection.asme.org/ on 01/08/2014 Terms of Use: http://asme.org/terms

Acce
pted
Man
uscr
ipt N
ot C
opye
dite
d
Corresponding author: Satish Kumar Paper No. HT-12-1637 25
Figure. 7. Top CNT total temperature, substrate temperature, and spectral temperature ( spT ) of four
frequency bands (see Fig. 6 (b)) of top CNT in (a) System I and (c) System III. The transient decay of
difference between top CNT total temperature (or spectral temperature of phonon bands) and substrate
temperature ( T ) for (b) System I and (d) System III. The unit of time constant is picosecond.
0 50 100 150 200 2500
50
100
150
200
250
t (ps)
T
(K
)
=119
1=70
2=115
3=117
4=121
Top CNT
Band 1
Band 2
Band 3
Band 4
0 50 100 150 200 250350
400
450
500
550
600
650
t (ps)
T (
K)
Top CNT
Substrate
Band 1
Band 2
Band 3
Band 4
0 100 200 300 400 500350
400
450
500
550
600
650
t (ps)
T (
K)
Top CNT
Substrate
Band 1
Band 2
Band 3
Band 4
0 100 200 300 400 500100
150
200
250
300
t (ps)
T
(K
)
=1372
1a
=47 1b
=2132
2=1534
3=1486
4=1213
Top CNT
Band 1
Band 2
Band 3
Band 4
(a) (b)
(c) (d)
System I System I
System III System III
Journal of Heat Transfer. Received November 30, 2012;Accepted manuscript posted September 17, 2013. doi:10.1115/1.4025436Copyright (c) 2013 by ASME
Downloaded From: http://heattransfer.asmedigitalcollection.asme.org/ on 01/08/2014 Terms of Use: http://asme.org/terms