copyright © information resources, inc. 2004. confidential and proprietary. pat handley, tropicana...
Post on 22-Dec-2015
213 views
TRANSCRIPT

Copyright © Information Resources, Inc. 2004. Confidential and proprietary.Beverages & Foods
Pat Handley, Tropicana
Steve Frenda, Mosaic InfoForce
February, 2005
What Trend Data Can’t Tell You About Out-of-StocksTropicana and Mosaic InfoForce

Beverages & Foods
2
Executive Summary - Out-of-Stocks In The Past
• The Traditional View of OOS
Over the last 10 years, Over 50 studies have been conducted
Virtually all studies report OOS in the 5-10% range
Conclude that 70-75% of OOS are the direct result of retail store practices
The consumer components tend to indicate that the retailer will lose nearly 50% of the planned purchases resulting in a loss of 4% of sales.
1
1Retail Out of Stocks: A Worldwide Examination of Extent, Causes and Consumer Responses – GMA, FMI, CIES
The traditional view grossly understates the seriousness of the problem Modernizing the view --- Out-of-stocks + Voids = Not Available For Sale NAS

Beverages & Foods
3
Executive Summary - Out-of-Stocks Today
A Contemporary View of “OOS”
A condition where a shelf tag exists with no product to support sale to the consumer continues to be a problem
More insidious is the product that should be in the store, but isn’t due to either planogram degradation or physical store and shelf limitations
This condition has largely been caused by the explosion of new products’ sizes, flavors, and “healthy for you” entries – Chain & store discipline a problem
Promotional activity has made the problem more serious. More flavors/varieties has put pressure on holding power for top sellers
The traditional view grossly understates the seriousness of the problem Modernizing the view --- Out-of-stocks + Voids = Not Available For Sale NAS

Beverages & Foods
4
The Transformation of OOS / Voids Analysis
Evaluate CurrentConditions
Drill Down ToCritical Times
Daily OOSReport
Use:
Determine RetailOOS, Distribution
& Discipline
Further detail OOS day part risks &
improve execution
Identify OOS events; model & predict drivers
Current Methodology 2005
Census Data& Audit
Census Store Level Daily Data
Day and TimeSpecific Audit
• Timely, Actionable• Store Level Data• Most Efficient

Beverages & Foods
5
OOS – Designing an Appropriate MethodologyOOS – In Reality, The 20% Problem
OOS with hole on shelf will be captured
OOS with pack out hole of substitute product will not likely be captured
without scanning
Inferior audit design solves for 5% of the
20% problem!!
OOS with hole on shelf will be captured
OOS with pack out hole of substitute product will not likely be captured
without scanning
Inferior audit design solves for 5% of the
20% problem!!

Beverages & Foods
6
The Problem is Serious
Across Most Categories, Base OOS is Running in
the 10-15% Range

Beverages & Foods
7
Case Study – Beer CategoryKroger, Michigan Division

Beverages & Foods
8
Case Study – Beer CategoryKroger, Michigan Division
• 112 stores• Average store stocks 185 beer
sku’s• # of items sold in the Division for 4
weeks? A. 200 B. 300C. 400D. 500

Beverages & Foods
9
3
3
4
4
5
6
9
10
11
16
19
8
4
4
6
<110 items
110-119
120-129
130-139
140-149
150-159
160-169
170-179
180-189
190-199
200-209
210-219
220-229
230-239
>240
Kroger – Michigan KMA - # of Beer Items Sold by Store
Distribution in 112 stores - There is a complete lack of consistency in the KMA planograms
• There were 525 different beer SKUs sold in the Michigan KMA last month.
• Average # of items sold by store is 185.

Beverages & Foods
10
A Practical Roadmap to NAS – Total U.S. Supermarket Chains
Beer / Ale – Average Chain/Store - # of Items
Total number of unique UPC’s sold in chain
Average # of unique UPC’s sold in stores
Average # of items observed on shelf audit
510
161
185
Reflects Chain Discipline
Reflects Store POG and Execution Discipline
Results in NASVoids + OOS
Results in NASVoids + OOS
-64%
-13%
Beer Category – From Approved to Customer – a 77% Problem

Beverages & Foods
11
“Healthy” Extensions Adding More Complication
MIF survey: Retailers asked “How high an impact will low carb and healthy product introductions have on your merchandising strategies, 1-10?”; result 7.5

Beverages & Foods
12
Consumers Navigating to Eat “Right” Retailers: “What Do I Stock? …Discontinue?
Regular Fat FreeLight
Low CarbsHigh Fat
High Cholesterol
Low CarbsModerate Fat
High Cholesterol
High CarbsNo Fat
No Cholesterol
How Can Retailers Properly Stock, Advertise and Display These PrHow Can Retailers Properly Stock, Advertise and Display These Products?oducts?
Regular Fat FreeLight
Low CarbsHigh Fat
High Cholesterol
Low CarbsModerate Fat
High Cholesterol
High CarbsNo Fat
No Cholesterol
Low CarbsHigh Fat
High Cholesterol
Low CarbsModerate Fat
High Cholesterol
High CarbsNo Fat
No Cholesterol
How Can Retailers Properly Stock, Advertise and Display These PrHow Can Retailers Properly Stock, Advertise and Display These Products?oducts?

Beverages & Foods
13
Consumers Navigating to Eat “Right” Retailers: “What Do I Stock? …Discontinue?
Regular Fat FreeLight
Low CarbsHigh Fat
High Cholesterol
Low CarbsModerate Fat
High Cholesterol
High CarbsNo Fat
No Cholesterol
How Can Retailers Properly Stock, Advertise and Display These PrHow Can Retailers Properly Stock, Advertise and Display These Products?oducts?
Regular Fat FreeLight
Low CarbsHigh Fat
High Cholesterol
Low CarbsModerate Fat
High Cholesterol
High CarbsNo Fat
No Cholesterol
Low CarbsHigh Fat
High Cholesterol
Low CarbsModerate Fat
High Cholesterol
High CarbsNo Fat
No Cholesterol
How Can Retailers Properly Stock, Advertise and Display These PrHow Can Retailers Properly Stock, Advertise and Display These Products?oducts?
Low CarbsModerate Fat
No CholesterolNo Taste

Beverages & Foods
14
The Collision Between Assortment and Availability
Beverages & Foods
15
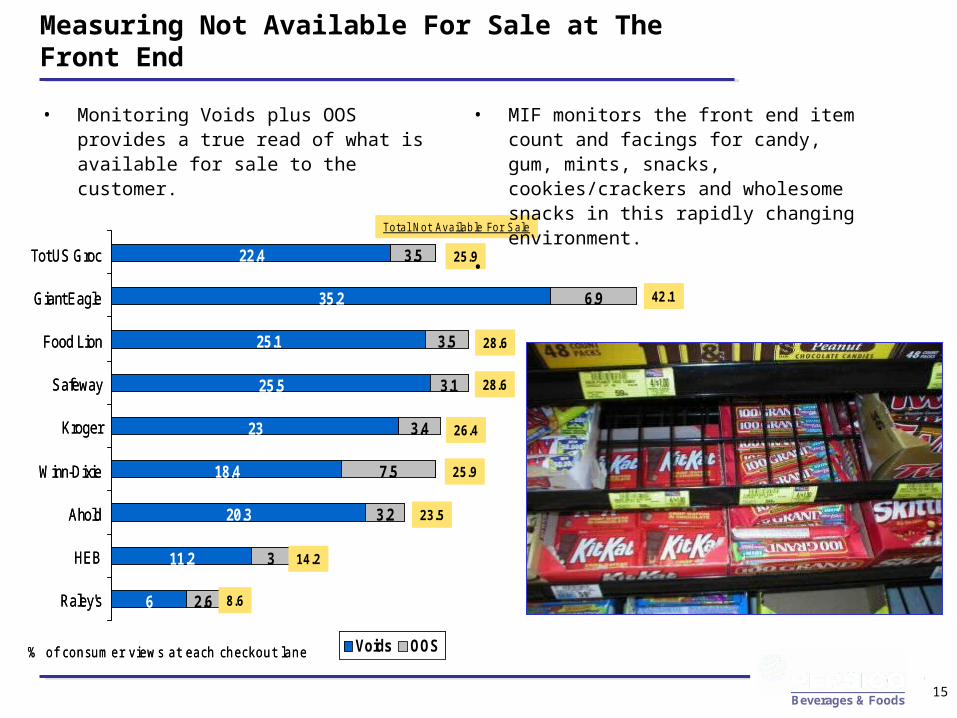
Measuring Not Available For Sale at The Front End
• Monitoring Voids plus OOS provides a true read of what is available for sale to the customer.
6
11.2
20.3
18.4
23
25.5
25.1
35.2
22.4
2.6
3
3.2
7.5
3.4
3.1
3.5
6.9
3.5
Raley's
HEB
Ahold
Winn-Dixie
Kroger
Safeway
Food Lion
Giant Eagle
Tot US Groc
Voids OOS
25.9
23.5
14.2
8.6
25.9
28.6
42.1
28.6
26.4
% of consumer views at each checkout lane
Total Not Available For S ale
6
11.2
20.3
18.4
23
25.5
25.1
35.2
22.4
2.6
3
3.2
7.5
3.4
3.1
3.5
6.9
3.5
Raley's
HEB
Ahold
Winn-Dixie
Kroger
Safeway
Food Lion
Giant Eagle
Tot US Groc
Voids OOS
25.9
23.5
14.2
8.6
25.9
28.6
42.1
28.6
26.4
% of consumer views at each checkout lane
Total Not Available For S ale
• MIF monitors the front end item count and facings for candy, gum, mints, snacks, cookies/crackers and wholesome snacks in this rapidly changing environment.
•

Beverages & Foods
16
The Front End – A Rapidly Changing Environment
An average supermarket sells 120 single serve candy, gum
and mint items
1,520

Beverages & Foods
17
Maximizing Consumer Choice
• 75% of Check Lanes Sell Chocolate Candy in This Chain
Percent Check Lanes Stocking UPC
Source: Mosaic InfoForce Check Lane Audit – Total U.S. Chain

Beverages & Foods
18
Maximizing Consumer Choice
• 75% of Check Lanes Sell Chocolate Candy in This Chain
Percent Check Lanes Stocking UPC
Source: Mosaic InfoForce Check Lane Audit – Total U.S. Chain

Beverages & Foods
19
Store Conditions - Realities
• Intentions of retailers and Field Sales are good, but distractions are many– Retailers see 30,000 new items per year– Broker consolidation = less brand dedication
• Many revenue “top dogs” now “second tier”
– No sense of urgency
• Planogram deterioration begins immediately
• Limited consumer support on line extensions cannot carry new product success alone

Beverages & Foods
20
Conclusions
• Quality retail execution can make or break success
• Must determine which KPI’s will drive performance for your brand, products or stores
• Set standards for retail field organization
• Measure performance – “inspect what you expect”
• Make results transparent throughout organization - ASAP– Offer tools that are accessible and easy to use– Focus limited field resources on categories or stores with biggest opportunity
gap

Copyright © Information Resources, Inc. 2004. Confidential and proprietary.Beverages & Foods
Pat Handley - Pepsico

Beverages & Foods
22
Providing reliable tracking and diagnostics of out of stocks is critical
We needed to provide measurement on OOS levels which was:
1. Actionable at retail
2. Simple to understand
3. Timely
4. Cost effective
Cost effective, accurate, timely, on going tracking methodology needed to monitor out of stocks

Beverages & Foods
23
New methodology utilizes both scanner data and audit data:• Actionable: Data available for 125 Retailers (3000 store audit)• Ongoing: Conducted quarterly • Timely: Results available in 2 weeks • Robust: Historic data available for benchmarking• Simple: Combines scanner (what’s available) with audit (what’s
in-stock)• Accurate: Measures both observed (tagged but unavailable) and
unobserved (item not tagged but selling in store) OOS
Prior methodologies were limited:• Scanner Based
‾ Cost prohibitive‾ Inaccurate‾ Complicated
• Custom Audit Based‾ Cost prohibitive‾ Not timely ‾ Not actionable – few retailers, sporadic timing
Success required a new OOS tracking methodology

Beverages & Foods
24
Limited shelf space despite brand and item proliferation creates tremendous pressure at shelf
Section Size-Feet
17.0 17.4
'99 '03
• Category space increased only 2% since 2001 Average Items in Chilled Case
97
125
'99 '03
Average # of Brands
26
29
'99 '03
• While # items increased 29%!
• And # of brands increased 12%

Beverages & Foods
25
Cluttered shelf results in limited space and days of supply issues for fast selling SKUs driving high OOS.
Top SKUsDays of Supply
3.1
6.3
Top SKUs AO
10.4
5.3
Share of Volume Share of Space
Top SKUsSpace allocation
•Days Of Supply for fastest selling SKUs only half that of other SKUs.
•Fastest selling SKUs only receive half their fair share of shelf.
•Nationally, OOS represent over a $100MM opportunity
Fast moving chilled case turns every 5 1/2 days
ResultingIn
High OOS

Beverages & Foods
26
OOS levels in the category are high both nationally and with individual customers.
National
• OOS rampant with 90% of stores having at least one item out of stock
Account Level Example
• At a customer level, up to ¼ off items may not be available
92%
24%30%
25%
13%
Any Item 1-2 Items 3-5 Items 6-10 Items >10 Items
8% 8% 8%10%
12%15%
22%
27%
AccountA
AccountB
AccountC
AccountD
AccountE
AccountF
AccountG
AccountH
% of Stores OOS % of Items OOS

Beverages & Foods
27
70%
30%
30%
70%
50%
50%
0%
20%
40%
60%
80%
100%
1st Time 2nd Time 3rd Time
Substitute Not BuyNo loss = 40%
Buy Same Brand, Different Flavor/Size
Manufacturer loss = 60%
Buy Different Brand, Same Flavor/Size *Wait Until Next Trip, Same StoreBuy a Different Beverage
Retailer Loss = 20%Go To A Different Store *Wait Until Next Trip, Same Store
When out of stock, both the Manufacturer and the Retailer lose.
What do you do if the item you want is Out of Stock?
Delayed Purchase *
OOS result in lost sales for both the Manufacturer and the Retailer. The more prevalent the problem, the higher the cost.
* Source: GMA “Retail Out-of-Stocks: A Worldwide Examination of Extent, Causes and Consumer Responses”
Reoccurring out of stocks increase lost sales.

Copyright © Information Resources, Inc. 2004. Confidential and proprietary.Beverages & Foods
Customer Example

Beverages & Foods
29
91.2%97.5%
Segment A Segment B
16.6
13.714.9
May '03 Nov '03 May '04
Total Account X
% StoreWith Any Item OOS
Average # Items OOS
% ofItemsOOS
15.9% 16.3% 13.4%
Current OOS Situation
Out of stocks impact more than 90% of stores and average at least 13 items.
Implication: Reducing out of stocks is an opportunity at Account X.

Beverages & Foods
30
Understanding What Drives Out of Stocks
Shelf / MarketAccount/ Dynamics
Store OperationsSupply Chain
Inventory
• Degree of Merchandising
• Pricing Strategy
• High/Low BDI Markets
• Shelving Best Practices
– How to Shelve
– Assortment Mix
– Mix of space
• Length of time for average OOS
– When should re-stocking
occur
• Re-stocking Process
– Any hindrances?
• Re-stocking Time of Day
– Is it timed with OOS?
• Logistics
• Ordering
Hypothesized Out of Stock Drivers
Results to Share Today
Additional Research Needed
Additional Research Needed
Beverages & Foods
31
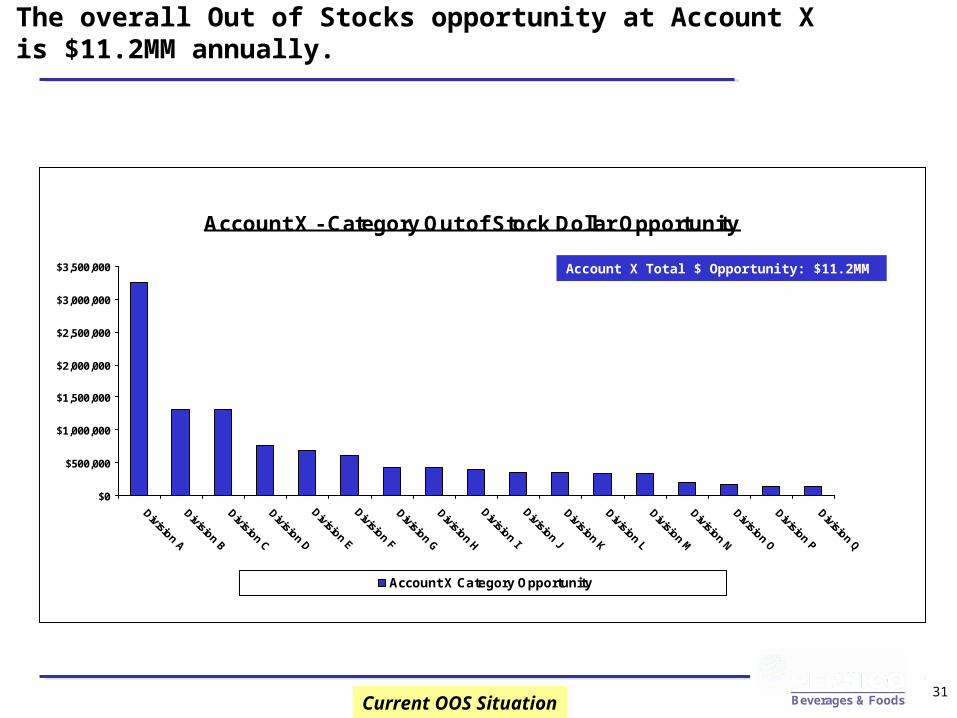
The overall Out of Stocks opportunity at Account X is $11.2MM annually.
Account X - Category Out of Stock Dollar Opportunity
$0
$500,000
$1,000,000
$1,500,000
$2,000,000
$2,500,000
$3,000,000
$3,500,000
Division A
Division B
Division C
Division D
Division E
Division F
Division G
Division H
Division I
Division J
Division K
Division L
Division M
Division N
Division O
Division P
Division Q
Account X Category Opportunity
Account X Total $ Opportunity: $11.2MM
Current OOS Situation
Beverages & Foods
32
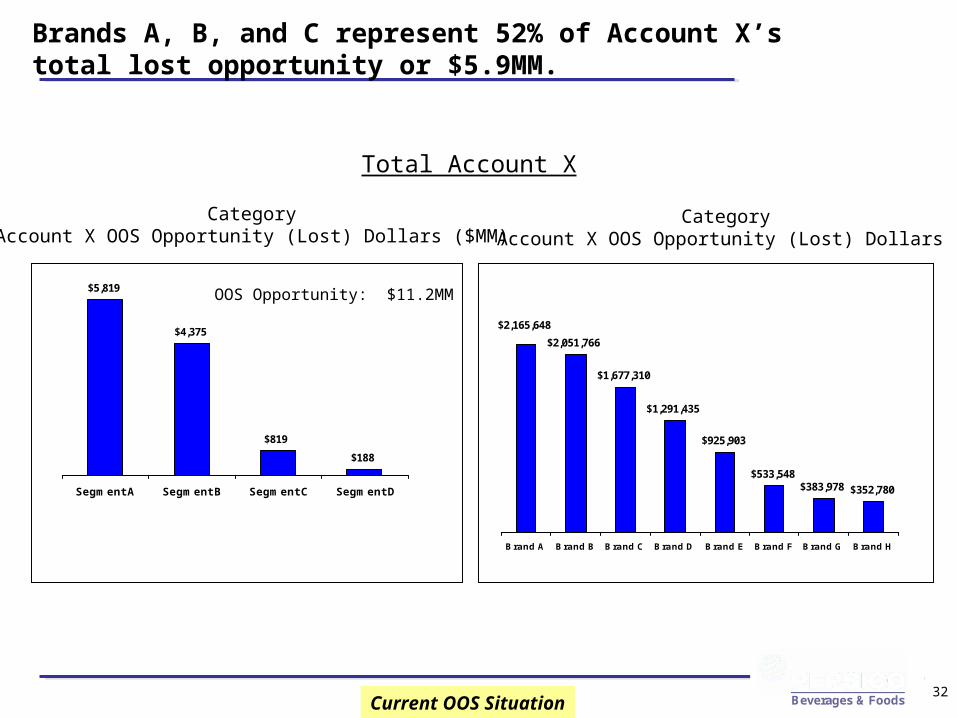
Brands A, B, and C represent 52% of Account X’s total lost opportunity or $5.9MM.
Total Account X
CategoryAccount X OOS Opportunity (Lost) Dollars ($MM)
CategoryAccount X OOS Opportunity (Lost) Dollars
$4,375
$819
$188
$5,819
Segment A Segment B Segment C Segment D
$925,903
$533,548$383,978 $352,780
$2,165,648
$1,291,435
$1,677,310
$2,051,766
Brand A Brand B Brand C Brand D Brand E Brand F Brand G Brand H
Current OOS Situation
OOS Opportunity: $11.2MM
Beverages & Foods
33
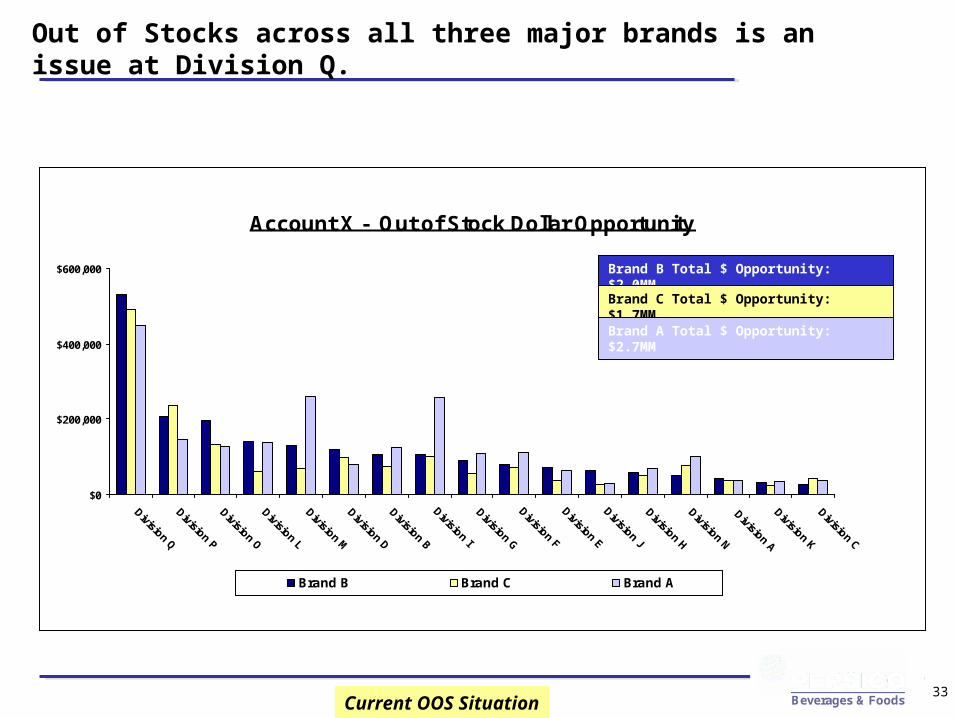
Out of Stocks across all three major brands is an issue at Division Q.
Account X - Out of Stock Dollar Opportunity
$0
$200,000
$400,000
$600,000
Division Q
Division P
Division O
Division L
Division M
Division D
Division B
Division I
Division G
Division F
Division E
Division J
Division H
Division N
Division A
Division K
Division C
Brand B Brand C Brand A
Brand B Total $ Opportunity: $2.0MM
Current OOS Situation
Brand C Total $ Opportunity: $1.7MM
Brand A Total $ Opportunity: $2.7MM

Beverages & Foods
34
The top 20 moving items represent a $2.9MM opportunity.
$0
$100,000
$200,000
$300,000
Ite
m A
Ite
m B
Ite
m C
Ite
m D
Ite
m E
Ite
m F
Ite
m G
Ite
m H
Ite
m I
Ite
m J
Ite
m K
Ite
m L
Ite
m M
Ite
m N
Ite
m O
Ite
m P
Ite
m Q
Ite
m R
Ite
m S
Ite
m T
DOS 1.3 6.6 5.3 4.9 5.4 4.9 4.1 3.3 4.9 0.1 7.5 4.0 3.6 6.2 6.5 4.7 4.6 6.0 3.7 3.5
% of Tot. Opp. 0.2 0.5 0.6 0.6 0.7 0.9 1.0 1.2 1.2 1.3 1.3 1.4 1.5 1.5 1.5 1.6 1.9 2.1 2.1 2.3
Current OOS Situation
Account X OOS Annual $ Opportunity for Top 20 Moving ItemsTop 20 Ranked on Velocity
Item Rank 20 10 1

Beverages & Foods
35
Segment A and Brand B have higher OOS rates when Brand G is in distribution.
Shelf / Market Account Dynamics
No Brand G Dist.
With Brand G Dist.
Total Account X
3.2%
8.8%
6.3%
12.7%
Brand A Item 1 %OOS Brand A Item 2 %OOS
6.6%
9.6%
Segment A % OOS

Beverages & Foods
36
Display Support - % ACV Display Segment A
14.2%
6.3%
Account X Divisions w/ LowDisplay Support (< 10%)
Account X Divisions w/ High Display Support (> 30%)
Shelf / Market Account Dynamics
Out of stock rates are lower when display support is stronger.
Implication: Offering display support can be a lever used to help reduce category out of stocks.
Segment A - % OOS
Annual OOS $ Opportunity $694M $1.1MM

Beverages & Foods
37
Day of Week Ad Breaks
Average Weekly Out of Stock Rates for Top 20 Items by Compared by Day of
Week Ad Breaks
11.5% 12.1%
7.3%9.6%
Sunday Monday Wednesday Thursday
Weekly out of stock rates are lower when feature ads break on Sunday.
Implication: Focus on reducing out of stocks in Divisions that have ad break days on Wednesday/Thursday (high traffic days) and larger OOS opportunities.
Shelf / Market Account Dynamics

Beverages & Foods
38
Out of Stock Rates for top 20 selling Items
9%10%
Higher # of Items Lower # of Items
# of Items stocked
Shelf / Market Account Dynamics
Avg. # Items 117
Out of stock rates were similar irregardless of number of items shelved in the category.
Avg. # Items 90
Implication: Just reducing the number items will not deliver lower out of stock rates. The right mix of items must be shelved.

Beverages & Foods
39
Optimizing space for the top 20 OOS items at fair share will improve volume, dollars and profitability.
Category
3.0%
4.0%
3.3%
Volume Dollars Profit
Increasing top 20 OOS items space to fair share will drive growth
Implication: Focus on getting right space for the right items