copyright is owned by the author of the thesis. permission ... · doctors robert camp, martin gooch...
TRANSCRIPT

Copyright is owned by the Author of the thesis. Permission is given for a copy to be downloaded by an individual for the purpose of research and private study only. The thesis may not be reproduced elsewhere without the permission of the Author.

Implementing Lean in a seasonal
horticultural sector: Theoretical and
practical suitability in the NZ pipfruit
industry.
A thesis presented in partial fulfilment of the requirements for the degree
of
Doctor of Philosophy
at
Massey University, Palmerston North, Manawatu, New Zealand
Johan Theodoor (Hans) Doevendans
2014

Page 2 of 372
© Johan Theodoor (Hans) Doevendans, 2015

Page 3 of 372
Abstract
The New Zealand (NZ) pipfruit industry has recently set an ambitious target of more than
doubling its export by 2022. However the industry has not performed very well in the past ten
years with many growers averaging substantial losses. One key government action has been
to deploy Lean thinking to improve production performance. The New Zealand pipfruit
industry has not taken up this opportunity for unknown reasons. One reason may be that it is
not known if the Lean paradigm will suit this seasonal industry which has a large manual
labour component but pushes product into market, contrary to Lean principles.
Although Lean has been successfully implemented in a number of industries, there is little
information about implementation in a horticultural context. Lean was not designed for
pipfruit. The aim of this study is to research the concept of Lean and its theoretical ‘fit’ and
practical applicability in a horticultural setting, specifically the New Zealand pipfruit industry.
A complex of methodologies integrates to find the answer. The literature review discusses
transferability of common theoretical Lean themes to other industries. Consultants are
interviewed to assess their views on the suitability of Lean for the pipfruit industry, while an
industry-wide survey determines the current state of knowledge and Lean deployment within
the industry, using a unique ‘single-question-per-day’ approach. Several case studies and
action research studies then obtain rich data from organisations that have started with Lean
implementation in recent times.
The inquiry demonstrates that Lean has many transferable elements and that the industry as a
whole is not currently considered Lean. Data from action research and case studies
demonstrate that Lean is largely applicable—leading to a measurable increase of Lean—
supported by some positive financial indicators. The inquiry culminates in the development of
a model and framework that can be applied in the future. In addition, orchards delivered
some original interpretations of waste and developed a Lean assessment tool.
The inquiry edified that Lean substantially fits the different elements of the NZ pipfruit
industry. This paper contributes to fill the gap in knowledge about Lean in a horticultural
environment.

Page 4 of 372
Acknowledgements
This project was something that was on my mind; it had to be done by somebody. I ended up doing it—
but only after considerable thought about the commitment required and the sacrifices to be made by
family and friends. I took this step as ‘mature student’ out of curiosity and with an intent to make a
difference, knowing that I had a lot of support. This support came from many corners and this page
serves to acknowledge that support, never truly being able to do justice to it.
First and foremost, I must thank my wife Winnie for putting up with me, locked away in my office on
numerous early mornings, late nights, days and weekends; that time was also your time and I can only
thank you for showing as much determination to get through this as I needed. A time may soon arrive
when I can talk about more than just Lean and the industry; it will probably be the ‘jobs-to-do’ l ist.
All our children, spouses and grandchildren have been short-changed with the little attention I could
give them. It may have hurt to see me withdraw to my office or be deep in thought instead of joining in
a cup of tea or playing with the grandchildren who give us so much joy. You have all been a source of
sanity for me, luring me out of my hide-out regularly and showing me that there is l ife after study. I
thank you for your patience and understanding.
Our friends and colleagues must have noticed the little time I had available and I thank you for your
understanding. I will be back soon!
Then there are the people who live in this academic world and/or who stimulated me, encouraged me,
and were food for determination. I may not mention a ll of you but thank you all, particularly Nigel and
Jane for being creative and critical and encouraging in single sessions, but not forgetting Greg, Mark,
Rick, Mike, Gary and others. It would have been hard without you. Massey University has been my
university since 1988, and made it possible to study extramurally throughout my various study courses.
For this inquiry, Massey University granted me a scholarship. I am very grateful for that assistance.
During the course of this study, a number of people were kind enough to spend time to communicate
with me about the thesis. These included Professors Peter Hines, Paul Coughlan, Carol Cardno and
Doctors Robert Camp, Martin Gooch and several practitioners such as Danie, Peter, Tony, Ian and
others. I asked industry experts to proofread sections which needed verifying and I thank you for giving
me your time and feedback.
This inquiry could not have been completed without the help of the research companies who sacrificed
time and effort to participate. I cannot name you but you know who you are and I am grateful for your
help and I hope that the inquiry will help the industry. Without you all, there would be no thesis.

Page 5 of 372
Table of Contents
Abstract ______________________________________________________________ 3
Acknowledgements ____________________________________________________ 4
Table of Contents ______________________________________________________ 5
List of Figures ________________________________________________________ 10
List of Tables _________________________________________________________ 14
1. Introduction _______________________________________________________ 16
1.1. Growing world population; growth targets set by government and industry ______ 16
1.2. The New Zealand pipfruit industry _________________________________________ 17
1.3. NZ Government’s response to support export growth - Lean ___________________ 18
1.4. Lean production and its transferability ______________________________________ 19
1.5. The problem ____________________________________________________________ 19
1.6. Researcher position within the industry _____________________________________ 20
1.7. Aim of this inquiry _______________________________________________________ 20
1.8. Approach _______________________________________________________________ 21
2. Background and Literature Review _____________________________________ 23
2.1. Introduction to the literature review _______________________________________ 23
2.2. The NZ pipfruit industry and its processes ___________________________________ 24
2.2.1. Brief history of the NZ pipfruit industry _____________________________________________ 25 2.2.2. Effects of deregulation on industry workings ________________________________________ 26
2.2.3. Economic hardship in years following deregulation and sustainability __________________ 27
2.2.4. Current position of the industry, nationally and internationally ________________________ 28
2.2.5. NZTE approach to introduce Lean to improve the industry’s position ___________________ 29 2.2.6. Pipfruit industry internal supply chain current state __________________________________ 30
2.2.7. Main attributes of the fruit, affecting supply to the customer _________________________ 34
2.2.8. Seasonal ‘push’ of the industry ____________________________________________________ 36
2.2.9. Market access constraints_________________________________________________________ 37 2.2.10. The role of people and leadership_________________________________________________ 38
2.2.11. The role of science and technology________________________________________________ 39
2.2.12. Industry processes ______________________________________________________________ 41 2.2.13. Summary of key characteristics of the NZ pipfruit industry ___________________________ 42
2.3. Lean ___________________________________________________________________ 43
2.3.1. Enhancing productivity: Historical approaches, methods and techniques _______________ 43 2.3.2. Antec edents to the Lean paradigm _________________________________________________ 50
2.3.3. Emergence of the Lean paradigm __________________________________________________ 54
Page 6 of 372
2.3.4. Definitions, philosophy and tools __________________________________________________ 56
2.3.5. The focus of Lean ________________________________________________________________ 63 2.3.6. A critical look at lean manufacturing _______________________________________________ 71
2.3.7. Assessing Lean in organisations ____________________________________________________ 83
2.3.8. Lean in other industries and areas: Several examples_________________________________ 90
2.3.9. Core themes within Lean literature________________________________________________ 106 2.3.10. Synthesising a Lean model from the literature _____________________________________ 110
2.4. Literature conclusion ____________________________________________________ 114
3. Methodology _____________________________________________________ 118
3.1. Introduction to methodology _____________________________________________ 118
3.2. Methodology: An overview _______________________________________________ 118
3.2.1. The nature of knowledge: Ontological and epistemological footing ___________________ 118
3.2.2. The need for tailored research; discussing the research options ______________________ 119
3.2.3. Linking research strategies to objectives ___________________________________________ 121
3.3. The first objective: Strategy, method and sample.____________________________ 121
3.3.1. Strategy to achieve the first objective _____________________________________________ 122
3.3.2. Literature review method ________________________________________________________ 122 3.3.3. Consultant method ______________________________________________________________ 123
3.4. The second objective: Strategy, method and sample _________________________ 124
3.4.1. Strategy to achieve the second objective __________________________________________ 124 3.4.2. Stakeholder survey: The first method for objective two______________________________ 125
3.4.3. Population and sample __________________________________________________________ 127
3.4.4. A practitioner review: The second method for objective two _________________________ 127
3.4.5. Complementing consultant interviews. The third method ____________________________ 128
3.5. The third objective: Strategy, method and sample ___________________________ 128
3.5.1. Strategy to achieve the third objective—quantitative or qualitative? __________________ 128
3.5.2. Action research as strategy_______________________________________________________ 131 3.5.3. Case study as strategy ___________________________________________________________ 132
3.5.4. Data collection for action research and case study __________________________________ 133
3.5.5. Population and sample __________________________________________________________ 133
3.6. The fourth objective _____________________________________________________ 134
3.6.1. Strategy to achieve the fourth objective ___________________________________________ 135
3.6.2. Industry model requirements_____________________________________________________ 135
3.6.3. Using the literature review model as basis for industry models _______________________ 136 3.6.4. Synthesising findings of the inquiry with the literature review model __________________ 136
3.6.5. Summarising the strategy ________________________________________________________ 136
3.7. Quantitative and qualitative methods combined—a mixed method approach ____ 137
3.8. Data analysis and synthesis _______________________________________________ 138
3.8.1. Quantitative and qualitative data analysis__________________________________________ 139
3.8.2. Qualitative data analysis _________________________________________________________ 139
3.9. Summary of the research design __________________________________________ 144
3.9.1. Deducting the theoretical approach options________________________________________ 144
Page 7 of 372
3.9.2. Available population, sample selection and data collection___________________________ 145
3.9.3. The overall research design ______________________________________________________ 146 3.9.4. Issues of trustworthiness: Reliability and validity____________________________________ 148
3.9.5. Reliability ______________________________________________________________________ 149
3.9.6. Validity ________________________________________________________________________ 149
3.10. Ethical considerations __________________________________________________ 152
3.11. Chapter conclusion ____________________________________________________ 152
4. Results ___________________________________________________________ 154
4.1. Introduction to results___________________________________________________ 154
4.2. Findings from literature review and the first objective________________________ 154
4.3. Findings from reflective practitioner review ________________________________ 155
4.3.1. The need for a reflective practitioner review _______________________________________ 155
4.3.2. Reflective practitioner review synopsis ____________________________________________ 155
4.4. Findings from consultant interviews and the second objective _________________ 157
4.4.1. Consultant response rate ________________________________________________________ 157
4.4.2. Consultant responses____________________________________________________________ 157 4.4.3. Consultant synopsis _____________________________________________________________ 161
4.5. Findings from stakeholder survey and the second objective ___________________ 162
4.5.1. Stakeholder response rate _______________________________________________________ 162 4.5.2. Stakeholder responses___________________________________________________________ 162
4.5.3. Stakeholder survey synopsis______________________________________________________ 166
4.5.4. Findings from action research and the third objective _______________________________ 166
4.5.5. Guideline for reading the graphs in the results section_______________________________ 166 4.5.6. Action research orchards ________________________________________________________ 167
4.5.7. Action research packhouse _______________________________________________________ 183
4.5.8. Action Research Lean Pipfruit Cluster______________________________________________ 191 4.5.9. Action research summary results supporting objectives _____________________________ 194
4.6. Findings from case studies and the third objective ___________________________ 194
4.6.1. Packhouse with Lean champion (CSP) _____________________________________________ 194
4.6.2. Packhouse with Lean consultant (CSPC)____________________________________________ 202 4.6.3. Exporter 1 ______________________________________________________________________ 209
4.6.4. Exporter 2 ______________________________________________________________________ 211
4.6.5. Interviews with stakeholders in kiwifruit and wine __________________________________ 213 4.6.6. Case study summary results supporting objectives __________________________________ 214
4.7. Chapter conclusion _____________________________________________________ 215
5. Analysis and Discussion _____________________________________________ 216
5.1. Introduction to analysis and discussion ____________________________________ 216
5.2. Objective 1: Transferable common theoretical themes _______________________ 216
5.2.1. Common themes: Historical development in literature review ________________________ 217
5.2.2. Common themes across industries in literature review ______________________________ 218
5.2.3. Common themes: The view by consultants _________________________________________ 220

Page 8 of 372
5.2.4. Synopsis of analysis and discussion of the first objective _____________________________ 221
5.3. Objective 2: Identification and analysis of current Lean deployment ____________ 221
5.3.1. Current Lean deployment: A consultant estimate ___________________________________ 222
5.3.2. Current Lean deployment: A stakeholder survey ____________________________________ 223
5.3.3. Current Lean deployment: The reflective practitioner review _________________________ 225 5.3.4. Synthesising the results towards the second objective_______________________________ 226
5.4. Objective 3: Applicability and implementation approaches ____________________ 226
5.4.1. Applicability and implementation: From the literature_______________________________ 227 5.4.2. Applicability and implementation: Reflective practitioner review _____________________ 228
5.4.3. Applicability and implementation: Consultants complementary views _________________ 229
5.4.4. Applicability and implementation: Action research component _______________________ 229
5.4.5. Applicability and implementation: Case study component ___________________________ 235 5.4.6. Synopsis of analysis and discussion of the third objective ____________________________ 240
5.5. Chapter conclusion ______________________________________________________ 240
5.5.1. Achieving objectives_____________________________________________________________ 240 5.5.2. Reliability and validity ___________________________________________________________ 241
5.5.3. General comment _______________________________________________________________ 242
6. Developing a Model, the fourth objective _______________________________ 243
6.1. Introduction to development of a model ___________________________________ 243
6.1.1. The Lean model_________________________________________________________________ 244
6.1.2. A framework to complement the industry model ___________________________________ 245
6.2. Applying lessons from the inquiry to the model______________________________ 245
6.2.1. Themes that emerged from the inquiry ____________________________________________ 245
6.2.2. Synthesising sector-specific applicability data to the model __________________________ 246 6.2.3. Effect of the inquiry findings on the model _________________________________________ 249
6.2.4. A Lean pipfruit model for industry sectors _________________________________________ 251
6.2.5. Summarising the industry’s sector-specific models __________________________________ 255
6.3. Building the framework __________________________________________________ 257
6.3.1. A l iving model and its place within a framework ____________________________________ 257
6.3.2. The implementation approach of the framework ___________________________________ 258 6.3.3. Framework adjustments for growing, packing/storing and exporting __________________ 259
6.3.4. Summarising the framework _____________________________________________________ 263
6.3.5. Applicability to the wider horticultural sector ______________________________________ 265
6.4. Model and framework conclusion _________________________________________ 266
7. Conclusion ________________________________________________________ 268
7.1. Introduction____________________________________________________________ 268
7.2. Conclusion _____________________________________________________________ 268
7.2.1. Common themes transferable to the NZ pipfruit industry ____________________________ 269
7.2.2. Current Lean deployment within the NZ pipfruit industry ____________________________ 269 7.2.3. Applicability and implementation of Lean within the NZ pipfruit industry ______________ 270
7.2.4. A conceptual Lean model for the NZ pipfruit industry _______________________________ 271
7.2.5. Considerations for implementing the model to the wider horticultural industry ________ 271
Page 9 of 372
7.3. Limitations ____________________________________________________________ 272
7.4. Originality and contribution ______________________________________________ 273
7.5. Recommendations for the industry ________________________________________ 274
7.6. Contribution to practice: The Lean apple tree _______________________________ 275
7.6.1. Growing Lean from a seed or graft ________________________________________________ 278
7.6.2. Originality of the model__________________________________________________________ 279
7.6.3. The implementation approach of the framework ___________________________________ 279
7.7. Future research ________________________________________________________ 281
7.8. A final word____________________________________________________________ 282
8. References: _______________________________________________________ 283
9. Appendices: _______________________________________________________ 307
Appendix 1: Reflective practitioner industry review _______________________________________ 308 Appendix 2: Pipfruit Varieties (apples, pears, nashi) _______________________________________ 321
Appendix 3: Export variety -by size -by country example___________________________________ 322
Appendix 4: 20 Kobayashi keys in relationship diagram (from Kobayashi, 1995) ______________ 323 Appendix 5: Lean Consultants __________________________________________________________ 324
Appendix 6: Announcement of Lean industry study and request for volunteers ______________ 325
Appendix 7: Pipfruit industry stakeholder questionnaire___________________________________ 326
Appendix 8: Consultant semi-structured interview guideline _______________________________ 333 Appendix 9: Protocol for case study with partial applicability to action research ______________ 334
Appendix 10: Pipfruit NZ statistical annual data for orchards and packhouses 2012 ___________ 344
Appendix 11: ARO: Pruning procedure and visual aid example______________________________ 347
Appendix 13: Pipfruit Lean Cluster Summary _____________________________________________ 352 Appendix 14: Pipfruit Lean Cluster Summary Feedback example (Si c.) _______________________ 353
Appendix 15: Future State Lean Activity Planner __________________________________________ 355
Appendix 16: ARP exercise in identifying waste ___________________________________________ 368 Appendix 17: Concerning the originality of the Lean apple tree model _______________________ 369

Page 10 of 372
Lists of figures and tables on the following pages are numbered as follows: The chapter
number precedes the chronological number of the figure or table in that chapter, for instance
figure 2-7 is the seventh figure in chapter 2.
List of Figures
FIGURE 1-1: RELATIVE POPULATION AND EXPORT GROWTH PROJECTIONS WITH END-DATE TAKEN AS
100%...................................................................................................................................................................17
FIGURE 1-2: PIPFRUIT SECTOR PROFIT BEFORE TAX, 2007-2011 (SOURCE MAF HORTICULTURE
MONITORING REPORT 2011 – PIPFRUIT SECTION). ..................................................................................18
FIGURE 2-1: PRIMARY STAKEHOLDER SUMMARY PROCESS..............................................................................24
FIGURE 2-2: RELATIVE INCREASE/DECREASE IN STAKEHOLDERS SINCE 2000 IN RELATION TO
PRODUCTION....................................................................................................................................................26
FIGURE 2-3: RESPECTIVE OPERATOR TASKS BY CHRONOLO GICAL ORDER (FOCUS GROUP REVIEWED)...31
FIGURE 2-4: PIPFRUIT ACTUAL SUPPLY CHAIN EXAMPLE (FROM DOEVENDANS AND ROSS, 2011). .........32
FIGURE 2-5: PIPFRUIT PRODUCT, SERVICE AND MONEY FLOWS (DOEVENDANS, 2010). ............................33 FIGURE 2-6: SAMPLE FRUIT DISTRIBUTION BY COUNT/SIZE (FOCUS GROUP REVIEWED). ..........................35
FIGURE 2-7: 'DISASSEMBLY' AND 'ASSEMBLY' IN PACKHOUSE (FOCUS GROUP REVIEWED).......................36
FIGURE 2-8: PUSH AND PULL ELEMENTS RELATED TO RAW MATERIALS AND CUSTOMER.........................37 FIGURE 2-9: DEVELOPMENT OF LABOUR ACTIVITY TRENDS DURING THE LAST CENTURY (ADAPTED
FROM PERIGORD, 1990). ................................................................................................................................38
FIGURE 2-10: LEAN? CLOSE MACHINE PLACING AND FLOW CONCEPT AT HIGHLAND PARK (SOURCE:
ARNOLD AND FAUROTE, 1915, P39). ...........................................................................................................52 FIGURE 2-11: THE SUSTAINABLE LEAN ICEBERG MODEL. (SOURCE: HINES ET AL, 2011A, P16). ................59
FIGURE 2-12: TOYOTA'S 4P MODEL (LIKER, 2004) ...............................................................................................60
FIGURE 2-13: 'THE HOUSE OF LEAN', FROM LIKER (2004, P33). .......................................................................61
FIGURE 2-14: 4-M MODEL FOR PROBLEM SOLVING (FROM KRAFCIK, 1988, P15). .......................................62 FIGURE 2-15: RELATION BETWEEN CUSTOMER VALUE, COST AND WASTE (SOURCE: HINES ET AL, 2004,
P997). .................................................................................................................................................................64
FIGURE 2-16: TOYOTA CULTURE (LIKER & HOSEUS, 2007, PXXVIII). ................................................................69 FIGURE 2-17: RELATION BETWEEN INNOVATION AND KAIZEN (IMAI, 1986).................................................70
FIGURE 2-18: INNOVATION AS IMAI SEES IT (IMAI, 1986, P26). .......................................................................70
FIGURE 2-19: THE COMBINATION OF INNOVATION AND CONTINUOUS IMPROVEMENT AS IMAI SEES IT
(IMAI, 1986, P27). ............................................................................................................................................71 FIGURE 2-20: HIGH AND LOW VARIABILITY VERSUS HIGH AND LOW VOLUME. ...........................................80
FIGURE 2-21: SAMPLE OF KOBAYASHI KEY WITH LEVEL AND JUDGEMENT CRITERIA ..................................85
FIGURE 2-22: EXAMPLE OF LEAN ASSESSMENT BY TAPPING, LUYSTER AND SHUKER, 2002. .....................86 FIGURE 2-23: TAPPING ET AL (2002) REVIEWED LEAN ASSESSMENT EXAMPLE (SIC.)..................................86
FIGURE 2-24: LESAT LEAN ASSESSMENT TOOL DEVELOPED BY MIT AND LAI (P7). .......................................87
FIGURE 2-25: MANUFACTURING NZ'S LEANSTEP PROGRAMME......................................................................88
FIGURE 2-26: EXAMPLE OF A BOX SCORE USED FOR WEEKLY VALUE STREAM REPORTING. SOURCE:
MASKELL, 2004, P8).........................................................................................................................................93
FIGURE 2-27: PRINCIPLES, PRACTICES & TOOLS OF LEAN ACCOUNTING (SOURCE: MASKELL &
BAGGALEY, 2006, P37)....................................................................................................................................95 FIGURE 2-28: PROCESS SWAPS TO FACILITATE BUILT-TO-ORDER. ...................................................................98

Page 11 of 372
FIGURE 2-29: REPRESENTATION OF THE MATERIAL DECOUPLING POINT (SOURCE: MASON-JONES &
TOWILL, 1999, P17). ..................................................................................................................................... 102 FIGURE 2-30: CRANFIELD UNIVERSITY FOOD WASTE ISHIKAWA DI AGRAM (GOOCH ET AL, 2010, P9).. 105
FIGURE 2-31: APPLE VALUE CHAIN RECOMMENDATIONS FOR ONTARIO. VINELAND RESEARCH REPORT,
GOOCH ET AL 2009, P156). ......................................................................................................................... 106
FIGURE 2-32: ESSENCE OF BEER'S VIABLE SYSTEM .......................................................................................... 109 FIGURE 2-33: DEVELOPMENT OF CUSTOMER VALUE EXPECTATION ............................................................ 110
FIGURE 2-34: ENVIRONMENTAL INFLUENCE ON CUSTOMER PRODUCT VALUE EXPECTATION .............. 111
FIGURE 2-35: DEVELOPMENT OF THE VALUE CREATION ................................................................................ 111 FIGURE 2-36: BELIEF SYSTEM AFFECTS PEOPLE INVOLVEMENT AND SYSTEMS AND PROCESSES ........... 112
FIGURE 2-37: CONCEPTUAL MODEL OF LEAN, SHOWING VALUE EXPECTATION BEING MATCHED BY
VALUE CREATION .......................................................................................................................................... 113
FIGURE 2-38: WHERE VALUE EXPECTATION AND VALUE CREATION MEET: THE PRODUCT..................... 114 FIGURE 2-39: DOES THE LEAN PARADIGM SUIT A SEASONAL HORTICULTURAL INDUSTRY SUCH AS THE
NZ PIPFRUIT INDUSTRY? .............................................................................................................................. 117
FIGURE 3-1: RESEARCH OPTIONS BASED ON DEGREE OF CONTROL (CONRAD AND MAUL, 1981, SIC.).120 FIGURE 3-2: RESEARCH PROCESS STRATA (MODELLED AFTER SAUNDERS ET AL (2011) AND GHAURI AND
GRǾNHAUG (2005). ...................................................................................................................................... 120
FIGURE 3-3: ACTION RESEARCH CYCLE (DICK, 2002, P4) ................................................................................. 131
FIGURE 3-4: THE SPIRALING EFFECT OF CONTINUOUSLY BUILDING ITERATIVE CYCLES (CARDNO, 2003,
P13). ................................................................................................................................................................ 132
FIGURE 3-5: INDUCTIVE AND DEDUCTIVE REASONING TO LEAD TO A MODEL. ......................................... 135
FIGURE 3-6: PURPOSES FOR MIXED METHODS EVALUATION DESIGN (MODELLED AFTER GREENE ET AL,
1989). .............................................................................................................................................................. 137 FIGURE 3-7: COMPONENTS OF DATA ANALYSIS: INTERACTIVE MODEL (RE-CREATED FROM MILES AND
HUBERMAN, 1984). ...................................................................................................................................... 140
FIGURE 3-8: RESEARCH DESIGN & METHODOLOGY MAP. .............................................................................. 147 FIGURE 4-1: STAKEHOLDER PRE- AND POST-SURVEY SELF-ASSESSMENTS OF LEAN KNOWLEDGE. ....... 163
FIGURE 4-2: KOBAYASHI KEYS LEVEL OF IMPLEMENTATION – WIDER INDUSTRY STAKEHOLDER SCORES
(2012).............................................................................................................................................................. 164
FIGURE 4-3: LEAN TOOLS KNOWLEDGE AND USE: WIDER INDUSTRY STAKEHOLDER SCORES (2012). .. 165 FIGURE 4-4: ARO KOBAYASHI KEYS- COMPARISON BETWEEN INDUSTRY AND ACTION RESEARCH
ORCHARD PROGRESS (2012-2014). ........................................................................................................... 168
FIGURE 4-5: ARO KNOWLEDGE AND USE OF LEAN PRINCIPLES, METHODS & TOOLS- COMPARISON
BETWEEN INDUSTRY AND ACTION RESEARCH ORCHARD PROGRESS (2012-2014).......................... 169
FIGURE 4-6: ARO WEIGHTED LONGITUDINAL LEAN ASSESSMENT IN 2012, 2013 AND 2014. ................. 169
FIGURE 4-7: ARO GROUP WORK ON TRANSLATING LEAN CONCEPTS INTO GROWING PRACTICE. ........ 170
FIGURE 4-8: ARO LEAN APPLICABILITY ELEMENTS FROM MEETINGS AND INTERVIEWS (2013-2014). .. 173 FIGURE 4-9: ARO LEAN IMPLEMENTATION ELEMENTS (2013-2014). ........................................................... 174
FIGURE 4-10: OTHER ELEMENTS CODING GROUP SCORES (2013-2014). .................................................... 175
FIGURE 4-11: THE INFLUENCE OF LEAN - A SIMPLE MONITORING SYSTEM AVOIDING WASTE. ............. 176 FIGURE 4-12: FORKLIFT EXTENSION, LOW COST AND SAVING SUBSTANTIAL TIME. ................................. 177
FIGURE 4-13: THE ORCHARD AS A FACTORY WITH MACHINES (TREES) REQUIRING MAINTENANCE..... 178
FIGURE 4-14: ARO SHOWING DEAD TREES AS LEAN WASTE THAT MUST BE CORRECTED. ...................... 179
FIGURE 4-15: ARO – ORCHARD MANAGERS’ SCORES FOR ON-ORCHARD APPLICABILITY AND
IMPLEMENTABILITY OF LEAN ELEMENTS (2014). ................................................................................... 182
FIGURE 4-16: KOBAYASHI KEYS: COMPARISON BETWEEN INDUSTRY AND ACTION RESEARCH
PACKHOUSE PROGRESS (2012-2014). ....................................................................................................... 183

Page 12 of 372
FIGURE 4-17: ARP KNOWLEDGE AND USE OF LEAN PRINCIPLES, METHODS & TOOLS (2012-2014). ..... 184
FIGURE 4-18: ARP WEIGHTED LONGITUDINAL LEAN ASSESSMENT IN 2012, 2013 AND 2014................. 185 FIGURE 4-19: ARP APPLICABILITY CODES AND RESULTS (2013-2014). ......................................................... 186
FIGURE 4-20: ARP IMPLEMENTATION CODES AND RESULTS (2013-2014). ................................................. 187
FIGURE 4-21: ARP 'OTHER ELEMENTS' AS THEY FEATURED IN INTERVIEWS AND MEETINGS (2013-2014).
.......................................................................................................................................................................... 187 FIGURE 4-22: ARP INSTALLATION OF TRAFFIC LIGHT SYSTEM TO CORRECT GRADING. ............................ 188
FIGURE 4-23: ARP VISUAL FOR GRADING FEEDBACK....................................................................................... 188
FIGURE 4-24: DRAFT AND COMPLETED STANDARD PROCEDURE FOR FLUME FILLING. ........................... 189 FIGURE 4-25: LEAN PIPFRUIT CLUSTER COOLSTORE VISIT - STAND-UP MEETING BOARD. ...................... 192
FIGURE 4-26: KOBAYASHI KEYS: COMPARISON BETWEEN INDUSTRY AND CSP PROGRESS. .................... 195
FIGURE 4-27: CSP KNOWLEDGE AND USE OF LEAN PRINCIPLES, METHODS & TOOLS. ............................. 196
FIGURE 4-28: CSP WEIGHTED LONGITUDINAL LEAN ASSESSMENT IN 2012, 2013 AND 2014. ................ 197 FIGURE 4-29: CSP APPLICABILITY CODE CATEGORIES AND RESULTS. ........................................................... 198
FIGURE 4-30: CSP IMPLEMENTATION CODE CATEGORIES AND RESULTS. ................................................... 199
FIGURE 4-31: CSP OTHER ELEMENTS CODE CATEGORIES AND RESULTS. .................................................... 199 FIGURE 4-32: CSP EXAMPLE OF VALUE STREAM MAPPING EXERCISE. ......................................................... 200
FIGURE 4-33: SIMPLE REVERSIBLE VISUAL. ........................................................................................................ 200
FIGURE 4-34: MAINTENANCE PLANNING—VISUAL, FLEXIBLE, PRIORITISED, SEGREGATED, EASY TO
UNDERSTAND. ............................................................................................................................................... 201 FIGURE 4-35: KOBAYASHI KEYS: COMPARISON BETWEEN INDUSTRY AND CSPC PROGRESS................... 203
FIGURE 4-36: CSPC KNOWLEDGE AND USE OF LEAN PRINCIPLES, METHODS & TOOLS. .......................... 204
FIGURE 4-37: CSPC WEIGHTED LONGITUDINAL LEAN ASSESSMENT IN 2012, 2013 AND 2014. .............. 204
FIGURE 4-38: CSPC APPLICABILITY CATEGORY SCORES................................................................................... 205 FIGURE 4-39: CSPC IMPLEMENTATION CATEGORY SCORES. .......................................................................... 206
FIGURE 4-40: OTHER ELEMENTS CATEGORY SCORES. ..................................................................................... 207
FIGURE 4-41: A SIMPLE VISUAL SYSTEM FOR PUTTING P ACKAGING IN ITS PLACE AND RE-ORDERING. 207 FIGURE 4-42: CSPC KANBAN BOARD FOR RE-ORDERING. ............................................................................... 208
FIGURE 4-43: LABOUR COSTS PER PACKED CARTON (GRAPH REPRODUCED SIC - AS PROVIDED) .......... 209
FIGURE 4-44: CODES AND FREQUENCIES IDENTIFIED IN MINI CASE STUDY EXPORTER 1. ....................... 210
FIGURE 4-45: CODES AND FREQUENCIES IDENTIFIED IN MINI CASE STUDY EXPORTER 2. ....................... 212 FIGURE 5-1: RESEARCH ELEMENTS SYNTHESISED TO OBJECTIVE 1............................................................... 217
FIGURE 5-2: SYNTHESISIGNG METHODS USED FOR OBJECTIVE 2. ................................................................ 222
FIGURE 5-3: COMPETENCY/KNOWLEDGE MATRIX, MODELLED AFTER FLOWER (1998)........................... 224 FIGURE 5-4: SYNTHESISING METHODS USED FOR OBJECTIVE 3. ................................................................... 227
FIGURE 6-1: SYNTHESISING FINDINGS INTO INDUSTY MODELS .................................................................... 243
FIGURE 6-2: FUNDAMENTAL LEAN MODEL WITH SUMMARY EXPLANATIONS........................................... 244
FIGURE 6-3: APLICABILITY OF LEAN PRINCIPLES, METHODS AND TOOLS BY SECTOR................................ 248 FIGURE 6-4: FUNDAMENTAL LEAN MODEL ....................................................................................................... 251
FIGURE 6-5: LEAN MODEL, ADAPTED TO EXPORTER SECTOR ........................................................................ 252
FIGURE 6-6: LEAN MODEL, ADAPTED TO PACKHOUSE/COOLSTORE SECTOR ............................................. 254 FIGURE 6-7: LEAN MODEL, ADAPTED TO THE GROWER SECTOR .................................................................. 255
FIGURE 6-8: FOREVER LEARNING AND IMPROVING, AN INFINITE STAIRCASE ............................................ 258
FIGURE 6-9: RELATIVE LOAD-LEVELING IN THE PACKHOUSE COMPARED WITH HARVESTING................ 261
FIGURE 6-10: FRAMEWORK SUPPORTING THE MODEL................................................................................... 264 FIGURE 6-11: SYMBOLIC CONTINUUM, DEPICTING LEAN APPLICABILITY VERSUS REQUIRED
ADAPTATION. NOT BASED ON EMPIRICAL DATA. ................................................................................... 265
FIGURE 7-1: LEAN APPLE TREE MODEL............................................................................................................... 276

Page 13 of 372
FIGURE 7-2: THE LEAN ORGANISATION TREE, MATURING OVER A PERIOD OF YEARS. ............................ 277
FIGURE 7-3: ENTRY ONTO AN INFINTE STAIRCASE IMPLEMENTATION MODEL. ........................................ 279 FIGURE 7-4: THREE STAGES OF LEAN IMPLEMENTATION............................................................................... 280

Page 14 of 372
List of Tables
TABLE 1-1: THESIS PARTS, CHAPTERS AND DESCRIPTIONS................................................................................22 TABLE 2-1: KEY CHARACTERISTICS OF THE NZ PIPFRUIT INDUSTRY. ................................................................42
TABLE 2-2: HISTORICAL PRODUCTIVITY IMPROVEMENT INITIATIVES, DRIVERS AND ATTRIBUTES............48
TABLE 2-3: SUMMARY OF LEAN MODELS .............................................................................................................62 TABLE 2-4: SUMMARY OF DIFFERENT WASTE PERSPECTIVES. ..........................................................................66
TABLE 2-5: COMPARISON BETWEEN JAPANESE/US 'TRANSPLANT' AND US CAR ASSEMBLY PLANT
(SOURCE: WOMACK, JONES AND ROOS, 1990)..........................................................................................72
TABLE 2-6: GROUPING OF CRITICAL ELEMENTS FOR LEAN IMPLEMENTATION.............................................75 TABLE 2-7: NUMBER, PERCENTAGE, AND CUMULATIVE PERCENTAGE OF ENTERPRISES BY SIZE IN
FEBRUARY 2010. (SOURCE: SMES IN NEW ZEALAND, 2011)....................................................................81
TABLE 2-8: CRITICAL SUCCESS FACTORS IDENTIFIED IN THREE DIFFERENT BUSINESS IMPROVEMENT
PHILOSOPHIES. .................................................................................................................................................82
TABLE 2-9: COMPARING LEAN ASSESSMENT CRITERIA. .....................................................................................89
TABLE 2-10: PROPOSED COMPARISON BETWEEN LEAN MANUFACTURING AND LEAN AGRIFOODS
(FROM HINES ET AL, 2011B). ...................................................................................................................... 103 TABLE 2-11: GOOCH ET AL (2010, P4) TRANSLATION OF TRADITIONAL WASTE INTO AGRI-WASTE. ..... 104
TABLE 2-12: CHARACTERISTICS OF LEAN, GROUPED IN THEMES AND REFERENCED BY AUTHOR .......... 107
TABLE 3-1: DISTRIBUTION OF SAMPLE BY INDUSTRY ACTIVITY. .................................................................... 127
TABLE 3-2: DISTINCTIONS BETWEEN QUANTITATIVE AND QUALITATIVE DATA (SAUNDERS ET AL, 2011).
.......................................................................................................................................................................... 138
TABLE 3-3: RESEARCH STRATEGIES AND QUALITATIVE/QUANTITATIVE EMPHASIS. ................................. 145
TABLE 3-4: RESEARCH ORGANISATION GROUPING BY RESEARCH STRATEGY AND ORGANISATION TYPE.
.......................................................................................................................................................................... 146
TABLE 3-5: RELIABILITY AND VALIDITY DESIGN................................................................................................. 151
TABLE 4-1: INTUITIVE AND PROBLEMATIC LEAN PRACTICES WITHIN THE PIPFRUIT INDUSTRY.............. 156
TABLE 4-2: ACTIVITY FOCUS OF CONSULTANTS................................................................................................ 157 TABLE 4-3: CONSULTANTS’ AREA OF SPECIALISATION. ................................................................................... 158
TABLE 4-4: 'PUSH' AFFECTING LEAN IMPLEMENTATION. ............................................................................... 158
TABLE 4-5: SUMMARY VIEW OF LEAN EMPHASIS FOR SEASONAL INDUSTRIES. ........................................ 159 TABLE 4-6: PHILOSOPHY OR TOOLS/METHODS? .............................................................................................. 159
TABLE 4-7: OTHER MODELS RECOMMENDED BY CONSULTANTS. ............................................................... 160
TABLE 4-8: CONSULTANTS’ CLOSING COMMENTS. .......................................................................................... 161
TABLE 4-9: PERCENTAGE DIVISION OF RESPONSES TO KOBAYASHI STATEMENTS. ................................... 164 TABLE 4-10: SKEWING TOWARDS ‘NOT KNOWING’ LEAN PRINCIPLES, METHODS AND TOOLS.............. 166
TABLE 4-11: KEYWORD GROUPS ESTABLISHED TO ASSIST ANALYSIS ........................................................... 171
TABLE 4-12: SAMPLE OF RECORDS, ALLOCATED KEY WORDS OR CODES AND CATEGORISATION (ALL
ACTION RESEARCH AND CASE STUDY SAMPLES) .................................................................................... 172
TABLE 4-13: LEAN ORCHARD AUDIT SCORING CRITERIA................................................................................. 179
TABLE 4-14: RESULT OF INITIAL LEAN ORCHARD AUDIT (FIRST DRAFT)....................................................... 180
TABLE 4-15: ARO - APPLICABILITY AND IMPLEMENTABILITY SCORES........................................................... 182 TABLE 4-16: SELECTED COMMENTS FROM ARP END-OF-SEASON REPORTS (SIC.). ................................... 190
TABLE 4-17: INITIAL LEAN PIPFRUIT CLUSTER CALENDAR............................................................................... 191
TABLE 4-18: SUBJECTS OBSERVED DURING CLUSTER MEETING FEEDBACK ................................................ 193 TABLE 5-1: SAMPLE OF APPENDIX 15 WITH 32 PRINCIPLES/METHODS/TOOLS DISCUSSED .................... 230

Page 15 of 372
TABLE 5-2: SAMPLE OF APPENDIX 15 WITH 32 PRINCIPLES/METHODS/TOOLS DISCUSSED .................... 235
TABLE 6-1: RESEARCH FINDINGS, GROUPED AND DETAIL ADDED ................................................................ 245 TABLE 6-2: EFFECT OF THEMES ON INDUSTRY SECTOR MODELS .................................................................. 256
TABLE 6-3: CURRENT AND FUTURE STATE FOR ORCHARD QUICK CHANGE-OVER PLUS EXAMPLE ........ 260
TABLE 7 -1 : SUMMARY OF CRI TI CAL FACTORS FOR SUCCESSFUL LEAN I MPLEMENTATI ON ..... 277

Page 16 of 372
1. Introduction
This study researches the concept of ‘Lean1’ and its applicability in a horticultural setting,
specifically the New Zealand (NZ) pipfruit industry. The New Zealand pipfruit industry
comprises apples and pears and has an annual growing cycle of a perishable product. The
study’s focus is particularly on the theoretical ‘fit’ and practical implementation of Lean into a
seasonal horticultural setting.
1.1. Growing world population; growth targets set by government and
industry
The primary industries including pipfruit are gaining in relevance for New Zealand, nationally
and internationally, both from the monetary perspective to increase NZ export trade and from
the global perspective to provide food for the world’s population. In an article in NZ Science
Review, Ballard (2010) describes NZ as the land of milk and honey with its abundant natural
resources. In a presentation to the NZ pipfruit industry 2013 annual conference, Carol Barnao,
on behalf of the Minister for Primary Industries, presented data showing that the NZ primary
industries account for 72% of New Zealand’s total exports at $30 billion per year (Barnao,
2013). As a nation of 4.5 million people, New Zealand grows sufficient primary product to feed
40 million people.
With a world population rising from the current 7 billion to 8 billion in 2025 and 9.3 billion in
2050 (Marshall et al, 2012; Lutz et al, 2001), the sustainable and by inference ‘Lean’ use of
land and water, and production of food will become increasingly important in the growing
global environment. The NZ government and industry bodies have therefore set ambitious
strategic performance targets that need re-thinking of ‘the way we do things’ (The Business
Growth Agenda Progress Reports, 2012; Horticulture Industry Strategy: Growing a New
Future, 2009; Pipfruit NZ annual conference, 2013) (Figure 1-1).
1 Throughout this document, Lean where it relates to the philosophy, processes and tools will be spelled with a capital to differentiate from any other meaning of the word.

Page 17 of 372
FIGURE 1 -1 : RELATIVE POPULATION AND EXPORT GROWTH PROJECTIONS WITH END -DATE
TAK EN AS 1 0 0 %.
In this growing world, the global competitive playing field is levelling itself. As faster and more
complete information is becoming more accessible to everybody, more people than ever
before compete and collaborate in real time on a more level footing than at any previous time
in the history of mankind. Our world is changing. The world is becoming ‘flat’ (Friedman,
2006). And although the natural resource position of New Zealand (NZ) is enviable
internationally, NZ has other constraints that require a targeted approach to service its
customers.
1.2. The New Zealand pipfruit industry
The pipfruit industry is a challenging industry, particularly since deregulation in 2001. It has
undergone numerous changes. Most challenges are based on market access issues, internal
competition for supply between NZ based exporting companies, in-market competition
between NZ based exporters and competition from other Southern Hemisphere countries
such as Chile and South Africa. The industry has generated losses for grower stakeholders in a
0
20
40
60
80
100
120
2009 2010 2011 2012 2013 2014 2015 2016 2017 2018 2019 2020 2021 2022 2023 2024 2025
Relative population and planned export production growth in percentages, 2009-2025 period
World Population Government Primary Sector
Horticulture New Zealand Pipfruit New Zealand

Page 18 of 372
number of years and is not thriving (MAF Horticulture Monitoring Report 2011). Figure 1-2
shows the profit before tax of the New Zealand Ministry of Agriculture and Forestry (MAF)2
monitoring orchards which represent a cross-section of the industry. Orchards have not been
profitable businesses for a period of time, particularly in the Nelson area. The renamed MPI
stopped monitoring the pipfruit sector beginning 2013 while re-designing the monitoring
programme to address identified information gaps, provide relevant information and use MPI
funding smarter.
FIGURE 1 -2 : PIPFRUIT SECTOR PROFIT BEFORE TAX, 2 00 7-201 1 (SOURCE MAF HORTICULTURE
MONITORING REPORT 2 011 – PIPFRUIT SECTION).
1.3. NZ Government’s response to support export growth - Lean
In its Business Growth Agenda, the NZ Government has set an export growth target of 40 % by
2025. In order to achieve such growth, the government is investing a further $100 million per
year over the four years starting 2013 as part of its Internationally Focussed Growth Package .
The government is already investing in business development with a number of programmes.
New Zealand Trade and Enterprise (NZTE), as the NZ government’s national economic
development agency, introduced several business improvement programmes including its
‘Beachheads’ programme, ‘Better by Capital’ programme, ‘Better by Design’ programme,
2 The New Zealand Ministry of Agriculture and Forestry (MAF) has been renamed ‘Ministry for Primary Industries (MPI) in March 2013.
$(300,000.00)
$(200,000.00)
$(100,000.00)
$-
$100,000.00
$200,000.00
$300,000.00
2007/08 2008/09 2009/10 2010/11 2011/12 budget
Profit before tax per business unit, 2007 to 2011 budget
Hawke's Bay pipfruit Nelson pipfruit Combined
Page 19 of 372
‘Better by Strategy’ programme and ‘Better by Lean’ programme, as well as a number of other
initiatives (e.g. ‘How NZTE can help’). Each programme targets specific business concerns,
ranging from raising capital or arranging networks to improving performance.
Starting in 2005, NZTE initiated several programmes based on the Lean paradigm, including its
Aichi programme, Lean Direct programme (Murti, 2009) and the current ‘Better by Lean’
programme. The expectation is that adoption of the Lean paradigm potentially offers
advantages that will create a better fit for industries in the global drive for improved
performance, eliminate inefficient processes and activities, and satisfy the customer in both
production volume and quality. Since 2005, NZTE has supported the founding and
coordination of regional Lean clusters—clusters of companies who implemented Lean and
seek exchange of information to help them progress Lean (e.g. www.nzte.govt.nz).
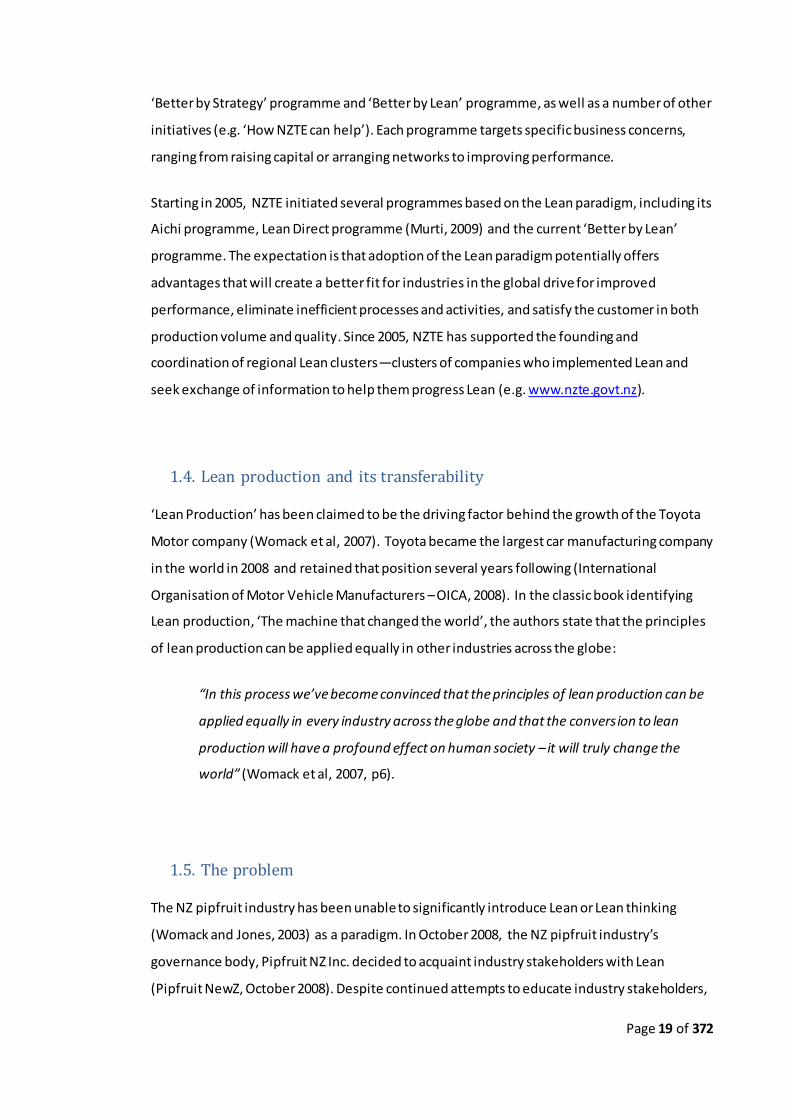
1.4. Lean production and its transferability
‘Lean Production’ has been claimed to be the driving factor behind the growth of the Toyota
Motor company (Womack et al, 2007). Toyota became the largest car manufacturing company
in the world in 2008 and retained that position several years following (International
Organisation of Motor Vehicle Manufacturers – OICA, 2008). In the classic book identifying
Lean production, ‘The machine that changed the world’, the authors state that the principles
of lean production can be applied equally in other industries across the globe:
“In this process we’ve become convinced that the principles of lean production can be
applied equally in every industry across the globe and that the conversion to lean
production will have a profound effect on human society – it will truly change the
world” (Womack et al, 2007, p6).
1.5. The problem
The NZ pipfruit industry has been unable to significantly introduce Lean or Lean thinking
(Womack and Jones, 2003) as a paradigm. In October 2008, the NZ pipfruit industry’s
governance body, Pipfruit NZ Inc. decided to acquaint industry stakeholders with Lean
(Pipfruit NewZ, October 2008). Despite continued attempts to educate industry stakeholders,

Page 20 of 372
Lean is not embedded in the industry to-date. Although several companies are known to make
some progress (e.g. Pipfruit NewZ, June 2013), the industry as a whole, has not been
embracing Lean as a conceptual business improvement opportunity. The reasons for this have
yet to be positively identified. Possible reasons are that Lean simply does not ‘fit’ the pipfruit
industry and that the current industry culture is not conducive to adopting the Lean paradigm.
Perhaps the industry is already Lean without calling it so. However we look at it, the industry
suffers from relatively poor performance in a world demanding increased performance, and
Lean has been identified as a very effective business improvement paradigm; the purpose of
this study is to investigate how Lean can be made to work in a horticultural industry,
specifically the NZ pipfruit industry.
1.6. Researcher position within the industry
It is relevant to summarise my personal position as researcher within the industry as this plays
a role in the inquiry. I have been working in the industry since 2000, when the industry was
still regulated and had a single desk export setup. Until 2008 I worked as operations manager
at one of the larger vertically integrated pipfruit organisations, comprising orchards,
packhouses, coolstores and exporting. From 2008 onwards, I worked as independent quality
management, quality systems and market access practitioner, assisting a number of
companies and the national pipfruit governance organisation (Pipfruit NZ Inc.) with their
programmes. In addition, I have developed and annually deliver the industry’s phytosanitary
training programme. I also write regularly for the Pipfruit NZ newsletter with a focus on
quality systems, quality management and recently Lean. This places me in a position where I
have observed a number of organisations and how they operate. My personal knowledge and
experience as independent practitioner allow me to provide a qualitative reflection on the
industry which assists with the inquiry.
1.7. Aim of this inquiry
The aim of this study is to research the concept of Lean and its theoretical ‘fit’ and practical
applicability in a horticultural setting, specifically the New Zealand (NZ) pipfruit industry.

Page 21 of 372
The result of this study is to contribute original knowledge to the body of knowledge that
exists in relation to ‘Lean’ and to horticulture in New Zealand, specifically the NZ pipfruit
industry. The study’s objectives are:
1. Identify common theoretical themes for the Lean philosophy, methods and tools, that
are not industry or contextually bound and that may be transferable to the pipfruit industry.
2. Identify and analyse the current Lean deployment within the NZ pipfruit industry.
3. Analyse the applicability and any implementation approaches of the Lean philosophy,
methods and tools within the NZ pipfruit industry.
4. Develop a conceptual Lean model for the NZ pipfruit industry and consider if the
model is applicable to the wider horticultural sector.
1.8. Approach
Part one of the thesis introduces the problem and the aim of the inquiry.
Part two of the thesis includes a literature research that grounds the research project in
available theory. The literature research includes the NZ pipfruit industry, Lean, its
fundamental elements and its transferability and concludes with identification of observed
gaps.
Part three of the thesis includes the selection of the research methodology, which is based on
the aims and objectives of the inquiry and the literature research findings, and sets the scope
and boundaries for the inquiry. The structure of the industry, its seasonal activities and the
industry culture significantly determine the used methodology. The results of the practical
research component include growing, packing/storing and exporting industry elements. The
applied methodology uses volunteer companies for primary data collection; companies’
identities may be commercially sensitive and are protected.
Part four of the thesis synthesises the data. The results of this original research are analysed
and interpreted and combined to triangulate, and complement findings. The empirical results
and analysis lead to the development of a model for the industry that links the analysed

Page 22 of 372
findings. The model precedes a conclusion, linking the findings and analysis back to the aim of
the study and discussing the contribution to knowledge. The section includes limitations and
recommendations. Table 1-1 shows an overview of the thesis.
TABLE 1 -1 : THESIS PARTS, CHAPTE RS AND DESCRIPTIONS.
Part Chapter Description Part 1: Introduction: Problem, aim, thesis
overview
Preliminaries: Table of contents, List of illustrations, tables etc.
Ch. 1: Introduction Introduces the situation, the problem, the aim, objectives and format of the thesis
Part 2: Background: Body of knowledge and underlying
assumptions, current theory and practice
Ch. 2: Background and literature review
Literature review of the NZ pipfruit industry and Lean incl. transferability; includes gap analysis based on review
Part 3: Own work: Design of own study, research design,
results.
Ch. 3: Methodology Research options, selected research method and motivation
Ch. 4: Results Reports on results of survey, interviews, case studies and action research
Part 4: Synthesis: Contribution to knowledge,
understanding of topic, examination of results, comparing results with
others’
Ch. 5: Discussion Synthesis of results, linking to literature, discussion and limitations
Ch. 6: Model Development of a model for the pipfruit industry
Ch. 7: Conclusion Contribution to knowledge, future research and implications of study, development of a pipfruit model
Additional information
References, Appendices

Page 23 of 372
2. Background and Literature Review
2.1. Introduction to the literature review
There is a vast body of popular and academic literature around the subject of Lean. In itself,
that is testament to the interest that Lean has sparked since the inception of the term by
Krafcik (1988) and the popularisation of the term by Womack et al (1990) in writing ‘The
machine that changed the world’. Since 1988 when Krafcik first used the term to describe the
Toyota Production System, people in a number of industries have tried to make Lean ‘fit’ their
industry, or have tried to take out of the Lean philosophy what suited their area of interest
best. Over the years, Lean was adapted to suit a number of different sectors. The world has
changed since 1988. Lean has been no exception.
In the same approximate period, the pipfruit industry has changed. The industry was centrally
organised under a government controlled Apple and Pear Marketing Board (APMB) and later
ENZA3 until 2001. Just under 1500 growers were involved in the industry in 2000, and just
before deregulation in 2001 (FreshFacts, 2002). Deregulation allowed the entrance of a
number of export organisations into the industry. The direct and indirect consequences of
deregulation are still felt within the industry. Growers and packers have consolidated
substantially. The number of exporters has increased substantially. Although there is evidence
of increased production per hectare, there is also evidence of an unsettled industry with much
to learn (Doevendans and Wilson, 2011).
This section discusses the available literature on the development and workings of both the
NZ pipfruit industry and Lean. A critical look at the NZ pipfruit industry will assist
understanding how it can introduce Lean to improve performance. Similarly, a critical analysis
of Lean will assist understanding how Lean can be used by the NZ pipfruit industry. A
discussion and analysis of the literature concerning the NZ pipfruit industry and its processes
is followed by a discussion and analysis of literature on Lean and its various developed forms.
3 ENZA replaced the single desk APMB and was registered as a public company as a result of the Apple and Pear Industry Restructuring Bil l of 31 August 1999.

Page 24 of 372
2.2. The NZ pipfruit industry and its processes
The NZ pipfruit industry grows, packs, stores and exports fruit (apples and pears)
predominantly for export to overseas markets (Figure 2-1). More than 75% of all harvested
fruit ends up as fresh fruit in Northern Hemisphere markets. The balance ends up on local
markets and is processed by juice plants.
This section describes the New Zealand (NZ) pipfruit industry. It briefly summarises the
historical development of the industry, presents a picture of its place in the global pipfruit
trade and describes the industry’s economic hardship since deregulation. It continues with
relevant fruit-technical details, seasonal aspects, market access and the role of people and
science and technology within the industry.
There is a lack of literature that attempts to describe the flows, mechanisms and processes
within the industry. This may be attributed to the fact that, until 2001, all non-grower aspects
of the industry were organised and controlled by ENZA. Deregulation led to within-industry
competition to secure supply and consequently industry processes changed substantially as an
increasing number of export organisations offered different service and cost structures.
Emphasis was on fruit technical specifications and industry processes were largely ignored.
Central organisation under ENZA was lost and no single organisation assumed responsibility.
Within the industry, there is a body of literature describing technical aspects. Pipfruit NZ, the
national body, provides the Integrated Fruit Production (IFP) growing manual (2008) and
numerous technical papers and tools. The IFP manual provides best practice information for
FIGURE 2 .1 FIGURE 2 -1 : PRIMARY STAKEHOLDER SUMMARY PROCESS.

Page 25 of 372
growers, concerning pests and diseases, varieties, planting systems and production-, soil-,
water-, weed- and shelter-management and spray technology. Pipfruit NZ also provides the
Best Practice Guidelines for Production, Harvest, Cool-chain and Packing of NZ pipfruit;
Industry Quality Recommendations (2012). This document provides generic growing
information and quality specifications for various fruit types. It also contains recommended
documentation templates.
Several packhouse/coolstore and export companies provide operations and quality
requirement manuals. ENZA developed the original technical manual before deregulation and
this manual forms the basis for all current manuals (e.g. ENZA specifications manual 2003).
However none of these documents describes the different processes between organisations
within the industry. A study of the NZ pipfruit supply- and value-chain focussed on financial
aspects and industry supply and value chain assessment by internal and external industry
stakeholders, and did not describe the processes involved (Doevendans and Wilson, 2011). In
order to understand the industry, the following section discusses what is available w ithin the
literature.
2.2.1. Brief history of the NZ pipfruit industry
Pipfruit growing was established during the colonisation of New Zealand in the 1850’s.
Farmers, growing for their families, found markets in Wellington in the 1880’s . This started a
planting boom between 1910 and 1916 (Benzies, 1968, Monigatti, 1966). During the next
eighty years, the growing of apples resulted in a flourishing export industry with the
government’s Apple and Pear Marketing Board (APMB) marketing all fruit overseas for a
number of years. In 1963, the crop was extremely varied with 141 apple and pear varieties. Of
these 141 varieties, a total of 109 made up 2% of the total crop (McKenna and Campbell,
1999).
During the early 1980’s, a new levy system was introduced which led to ‘the bitter years’
(Mannering, 1999), and a newly elected Labour Government set out to profoundly change the
political, social and economic thinking in New Zealand to one of pure neo-liberal economy
(Kelsey, 1997). Growing concern with the single desk position was voiced in the early 1990’s
(Apple Fields Ltd. 1991). The single desk marketing monopoly continued until 1993 when the
1993 Apple and Pear Marketing Amendment Act deregulated the domestic market and
Page 26 of 372
provided for some semi-regulated niche export marketing. In 1999, the government
introduced the Apple and Pear Restructuring Act and effectively separated the regulatory and
marketing arms of the industry (McKenna et al, 1999). The short period following was fuelled
by grower dissatisfaction over reclaiming of historical foreign exchange losses and court
actions over export consents. In May 2001, the government announced that the industry
would be deregulated per the 1st October 2001. Some further detail including some
undocumented contemporary history of the NZ pipfruit industry can be found in Appendix 1:
Reflective practitioner industry review.
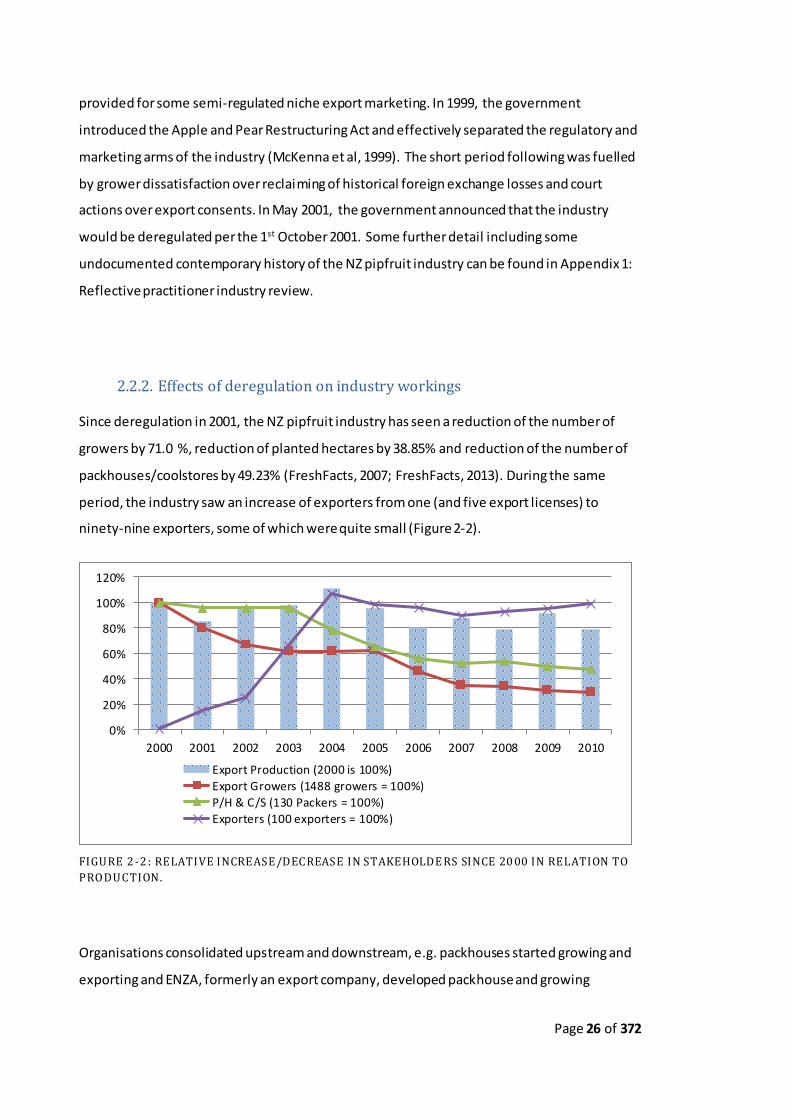
2.2.2. Effects of deregulation on industry workings
Since deregulation in 2001, the NZ pipfruit industry has seen a reduction of the number of
growers by 71.0 %, reduction of planted hectares by 38.85% and reduction of the number of
packhouses/coolstores by 49.23% (FreshFacts, 2007; FreshFacts, 2013). During the same
period, the industry saw an increase of exporters from one (and five export licenses) to
ninety-nine exporters, some of which were quite small (Figure 2-2).
FIGURE 2 -2 : RELATIVE INCREASE/DECREASE IN STAKEHOLDE RS SINCE 20 00 IN RELATION TO
PRODUCTION.
Organisations consolidated upstream and downstream, e.g. packhouses started growing and
exporting and ENZA, formerly an export company, developed packhouse and growing
0%
20%
40%
60%
80%
100%
120%
2000 2001 2002 2003 2004 2005 2006 2007 2008 2009 2010
Export Production (2000 is 100%)
Export Growers (1488 growers = 100%)
P/H & C/S (130 Packers = 100%)
Exporters (100 exporters = 100%)

Page 27 of 372
capacity. Export production remained stable, averaging 305,335 tonnes over that ten year
period (FreshFacts, 2007; FreshFacts 2013, and Pipfruit NZ, 2013).
2.2.3. Economic hardship in years following deregulation and sustainability
Immediately following deregulation in 2001, the New Zealand Pipfruit industry enjoyed
several good years, soon followed by a poor 2004 result and a disastrous 2005 result (Pipfruit
statistical annual 2006). This period was followed by years of moderate results, caused by
frosts, several phytosanitary4 market restrictions, some poor markets and unfavourable
exchange rates. The industry and in particular the growers were having a hard time. In August
2005, the chairman of Pipfruit NZ wrote:
“There is no doubt that the industry cannot survive another year like this
one has been. There is a clear need for us to start working together in a co-
operative manner and introduce the necessary disciplines to minimise the
infighting and maximise the value from the market. The orchard gate
returns for growers must be sufficient to allow growers to reinvest in their
businesses so the industry can continue to thrive” (Pipfruit NewZ, August
2005, p3).
Interestingly, this statement reflected recognition of the ‘infighting’ that had started after
deregulation, when exporters fought hard to secure fruit supply and in the process diminished
more of the already fragile trust within the industry. Consequently, stakeholders
communicated more about monetary trading returns than about effectiveness of operations.
Doevendans and Ross (2011) examined the industry’s supply and value chain, obtaining
monetary data from a sample of ten export organisations and interviewing and surveying
stakeholders. The study showed that monetary results varied significantly between export
organisations, but reasons were not conclusively identified. Themes from interviews
highlighted the lack of trust and the fragmentation of the industry. The researchers state that
indirect stakeholders appear to understand the supply chain better than direct stakeholders.
Further literature shows little factual evidence of anybody questioning the industry processes
4 Phytosanitary relates to plant health, essentially fruit free from pests and diseases. Phytosanitary regulations are used by 177 countries that signed the International Plant Protection Convention (IPPC).

Page 28 of 372
that had evolved over time; the ‘in-fighting’ between exporters is referred to at times, and
Pipfruit NZ, the governance body of the industry tried to address exporter fragmentation by
facilitating coordination meetings which focussed on market information (Pipfruit NewZ,
December 2005).
2.2.4. Current position of the industry, nationally and internationally
2.2.4.1. Relevance of the industry for New Zealand’s exports.
The pipfruit industry in New Zealand is a considerable export industry, contributing 24.94% to
the total New Zealand fresh fruit export and 10.51% of total horticultural export income in
2010 (FreshFacts, 2011). Data released by Statistics New Zealand show that fruit exports make
up 3.71% of the total New Zealand exports (Statistics NZ, 2011). New Zealand produces about
0.39 % of the world’s apples but is largely export driven and captures 3.86 % of the global
export trade (World Apple Review 2012).
2.2.4.2. International competitive position of the industry.
The World Apple Review considers pipfruit producing countries on the basis of 22 f actors.
Starting in 1996, the report shows New Zealand as leading a group of 28 countries between
1996 and 2002. Internationally, NZ was considered the most competitive country in the world.
The 2002 review (World Apple Review, 2002) comments that New Zealand is both succeeding
and failing in an attempt to become more effective as the food distribution system changes.
The review mentions the ‘old’ marketing system being managed by one company (ENZA
Limited), allowing the introduction of new premium apple and pear cultivars on the world
market and allowing above average market returns which compensated for the long distance
from major markets (World Apple Review, 2003).
Following 2002, the 2003 review report expresses the expectation that the industry may fi nd
itself in an awkward position because the government withdrew its funding for the

Page 29 of 372
involvement of HortResearch5 into innovation of the industry. Since then, the NZ position has
turned into a roller coaster ride with NZ dropping to second in 2003, droppi ng to third in
2009, to fifth in 2010, back to fourth in 2011 and to second again in 2012 (World Apple
Review, 2002, 2003, 2009, 2010, 2012).
The 2013 OECD report on labour productivity levels shows NZ as a country lagging behind the
OECD average in presented metrics (OECD, 2013). This contrasts with the NZ position
presented in the 2012 World Apple review. It is not the intention of this document to criticise
either review process, but the question must be asked how a country that believes the
industry is hardly viable in 2005 can be placed second on the international competitiveness
scale while economically being projected well below the average of the OECD indicators
(OECD, 2013). It points towards a dichotomy between the different perceptions or towards an
industry that performs better than the national average despite reports to the contrary.
Future research may explain this phenomenon which falls outside the scope of this inquiry.
2.2.5. NZTE approach to introduce Lean to improve the industry’s position
In 2008, New Zealand Trade and Enterprise (NZTE), following several discussions with Pipfruit
NZ, offered the industry funding for those who intended to focus on Lean production. The NZ
Government had already created similar opportunities for a number of manufacturers in 2005
(the ‘Aichi’ and ‘Direct’ Lean programme) through to 2008 (Goodyer et al, 2011). The uptake
of the Pipfruit NZ initiative amongst pipfruit organisations was poor with only three
companies participating in an expansion of the initial session, despite NZTE offering
substantial co-funding of participation. In my personal conversations with the three
organisations, none of the three claimed to have been successful with Lean implementation
following the initial training (personal communication with stakeholders, May 25, 2012; May
30, 2012 and June 7, 2012).
5 HortResearch (Horticulture and Food Research Institute of New Zealand Limited) was a semi -
commercialised Crown Research Institute which became Plant & Food Research in 2008.

Page 30 of 372
NZTE introduced Lean programmes, as have at least five other government departments
(Wilson et al, 2008). The sustainability of these programmes has been questioned during a
follow-up study, several years later with only one of eleven companies looking most likely to
sustain Lean by having strong leadership and management commitment (Goodyer et al, 2011)
and investing in ‘below the waterline’ enabling approaches (Hines et al, 2011a). The “Lean –
Windshift” study (2011), also commissioned by NZTE, appears to be a commercial study
without reference to a scientific foundation. The three studies show different pictures,
ranging from enthusiasm (Wilson et al, 2008) to a critical look at sustainability (Goodyer et al,
2011) and ‘on-the-fence-sitting’ (Windshift” study, 2011). However none of these studies
looks specifically at the horticultural sector which represents 7.8% of all NZ exports
(FreshFacts 2013). In addition, Lean cannot be implemented thoughtlessly into a different
industry type (e.g. Fillingham, 2007). These indicators imply that it is difficult enough to
implement and sustain Lean, perhaps more so if Lean has not been tested in specific industry
sectors. The Lean component of the literature review elaborates on the currently available
knowledge base.
2.2.6. Pipfruit industry internal supply chain current state
Growers have relationships with packhouse/coolstore combinations and exporter/traders
(Figure 2-3), each completing a number of tasks. Immediately after growers harvest, they will
submit bins of fruit to coolstores to maintain storage-life and thus quality. At the start of
harvest, coolstores may build up some stock to allow continuous packing by packhouses once
packing starts. Packhouses pack product and store packed product (pallets) in coolstores to
maintain quality. Packing typically starts mid-February and is often completed somewhere in
June or July each year. Traceability will be maintained for food safety and quality (e.g. BRC
Global Standard for Food), for regulatory requirements (e.g. MPI systems) and bill payments.
Relationships within the intra-industry supply chain have a degree of complexity (figures 2-4
and 2-5).

Page 31 of 372
FIGURE 2 -3 : RESPECTIVE OPERATOR TASKS BY CHRONOLOGICAL ORDER ( FOCUS GROUP
REVIEWED) .
Growers generally have little direct influence on where their fruit is going to be sold; in
principle, growers will want to get the best price for their fruit and leave the marketing to the
exporters. The exporter/trader will market the grower’s fruit, provide storing and packing
instructions to the packhouse and thus determine some of the costs that the grower incurs
(The grower pays packhouse and coolstore bills). Some exporters pay for agreed extra
packing/packaging/storing charges and generally recover these payments by charging the
grower and deducting the costs out of the market returns. All this time, right up to the
moment that the fruit is physically sold, the fruit is generally owned by the grower. This
process is referred to as consigning or selling on consignment (Business Dictionary, 2013). It is
rare that the exporter buys the fruit from the grower. This means that the grower runs all the
risk while the exporter determines how the product will be packed, attempting to maximise
value.
Grower
•Prunes trees•Sprays trees
•Ferilises trees
•Thins crop
•Fights frosts
•Harvests•Supplies harvested fruit in bins to coolstore (pushes)
Coolstore
•Submits bins (traceability)
•Batches bins before packing (quality)
•Applies CA or SM™ treatment (quality)
•Provides bins to packhouse on demand (pull)
Packhouse
•Plans packing
•Orders required packaging
•Pulls bins from coolstore for packing
•Packs apples as instructed
•Transfers packed product to coolstore
Coolstore
•Batches packed product
•Maintains inventory
•Ships packed product as instructed
Exporter
•Checks stocks of unpacked product
•Negotiates programmes and sales
•Provides packing instructions to packers
•Maintains packed product inventories
•Provides shipping instructions to coolstores
•Completes documentation

Page 32 of 372
Depending on the fruit varieties that a grower produces, the grower may not fully control
which exporter trades his fruit, e.g. in case of Intellectual Property (IP) fruit, the rights to
which may be owned by a single exporter (Doevendans 2010).
2.2.6.1. Complexity of customer requirements
Customers require apples and pears to be packed in a large variety of ‘pack -types’, e.g. ‘Z-
packs’, RSTs (Retail Single Tray), RDTs (Retail Double Tray) and others. Each type of carton is
manufactured in different sizes for different size brackets of fruit. In addition, each pack -type
usually has different graphics for different exporters and end-customers. More than 200
different pack-types can be manufactured by a single packaging company.
Fruit is packed into cartons on moulded trays, manufactured from recycled paper. These trays
are produced in different colours and a different tray is manufactured for each fruit size/count
(the number of apples per carton by size); some counts/sizes have ‘reversible’ trays, trays that
can be reversed for each layer of fruit so that fruit on the second layer sits partly in between
the top of fruit of the first layer to prevent bruising. Other sizes have ‘A’ and ‘B’ trays as the
FIGURE 2 -4 : PIPFRUIT ACTUAL SUPP LY CHAIN EXAMPLE (FROM DOEVENDANS AND RO SS, 2 01 1).
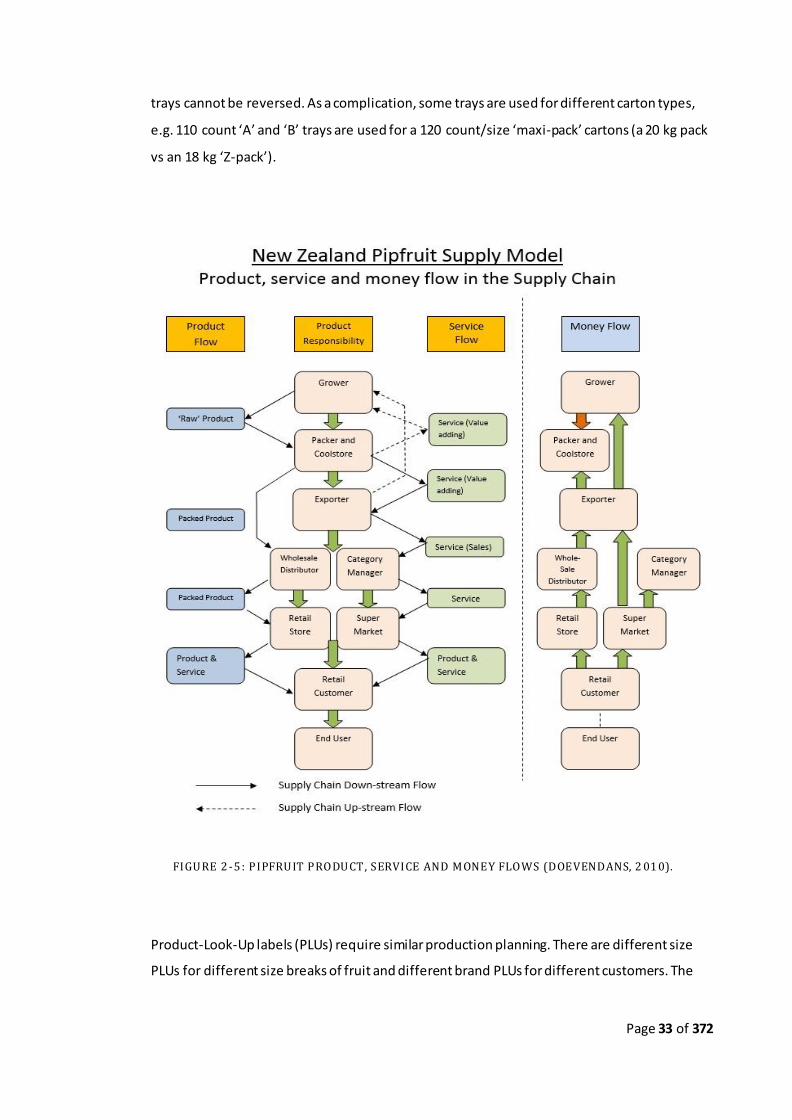
Page 33 of 372
trays cannot be reversed. As a complication, some trays are used for different carton types,
e.g. 110 count ‘A’ and ‘B’ trays are used for a 120 count/size ‘maxi-pack’ cartons (a 20 kg pack
vs an 18 kg ‘Z-pack’).
Product-Look-Up labels (PLUs) require similar production planning. There are different size
PLUs for different size breaks of fruit and different brand PLUs for different customers. The
FIGURE 2 -5 : PIPFRUIT PRODUCT, SERVICE AND MONEY FLOWS (DOEVENDANS, 2 01 0).

Page 34 of 372
PLU manufacturer confirms that the range of PLUs approximates 300 (confirmed by email
from the manufacturer on 10-10-2013).
Considering the complexity of the packing process where up to 20 different products may be
packed simultaneously, the packing and packaging processes are complicated both in planning
and execution.
2.2.6.2. Convoluted relationship structure
From the hereinbefore, it is clear that the relationship structure between grower, packer and
exporter is convoluted as a result of the mixed information, instruction, product and
monetary flows which have developed historically and are not well docume nted (Figure 2-5).
As the industry consolidates further, there may be opportunity to provide straight-forward
supply relationships and map a standardised supply chain. The current supply chain structure
may not be conducive to a Lean supply chain.
2.2.7. Main attributes of the fruit, affecting supply to the customer
Fruit is a live, perishable product with a limited lifespan. In order to understand the impact of
the product on Lean and vice versa, it is important to understand some of the idiosyncrasies
of fruit and its production. To this end, some of the characteristics of the industry’s products
are described below.
2.2.7.1. Varieties:
There are a large number of varieties for both apples and pears (Appendix 2). The
environment dictates largely what type of apple varieties can best be grown in specific areas.
In 2013, 95.1 % of the NZ crop is represented by 11 varieties, while 3.3 % represents other
apple varieties and 1.6 % represents pear varieties (National Pipfruit Crop Estimate 2013).
From the moment that a decision is made to grow a certain variety, trees will not achieve full

Page 35 of 372
production until approximately seven or eight years later when they have achieved maturity
(Wilson and Emms, 2009).
2.2.7.2. Count or size distribution:
FIGURE 2 -6 : SAMPLE FRUIT DISTRIBUTION BY COUNT/SIZE (FOCUS GROUP REVIEWED).
Apples grow following a normal distribution. Figure 2-6 shows a typical size distribution. Size
distributions vary for each variety. Customers in different countries typically prefer larger or
smaller fruit. These trends are historical and well known; an example of typical export sizes to
specific countries is attached as Appendix 3.
2.2.7.3. Colour:
Customers in different countries have different colour requirements. It is commonly known
that Asian customers prefer bold red colours while European customers prefer striped
coloured fruit or fruit with a ‘blush’. Although colour is partly inherent to varieties, colour is
also intensified by seasonal circumstances. Warm days and cold nights typically bring out
colour in pipfruit.
0.00%
5.00%
10.00%
15.00%
20.00%
25.00%
060 070 080 090 100 110 120 135 150 165 180 198
Vo
lum
e in
%
Fruit Size
Fruit Distribution

Page 36 of 372
2.2.7.4. Disassembly before assembly?
FIGURE 2 -7 : 'DISASSEMBLY' AND 'ASSEMBLY' IN PACKHOUSE ( FOCUS GROUP REVIEWE D).
The fact that size and colour can best be segregated in a packhouse means effectively that
bins of fruit must first be disassembled into a number of size and colour combinations, before
the customer product can be assembled into a packed carton (figure 2-7).
2.2.8. Seasonal ‘push’ of the industry
The conflict between Womack and Jones’ Lean principles (Womack and Jones, 2003) and
horticultural industries such as the pipfruit industry starts with the single annual fruit
production cycle, culminating in a production process that is typically ‘Push’. ‘Push’ and ‘Pull’
are characteristic elements of supply chains, as is the case with Toyota. Womack and Jones
(2003, p71) as an example quote an operating doctrine that states:
“Don’t make anything until it is needed; then make it very quickly”
This operating doctrine typifies Lean production but does not fit easily with fruit production
and only partly fits the packed product. The fundamental fruit supply chain components are

Page 37 of 372
typically ‘push’ as production cannot easily change. As customer demand can be more
accurately forecasted, ‘pull’ strategies are more likely towards the customer end of the supply
chain (Simchi-Levi et al, 2003). ‘Push-Pull’ strategies define the point where a transition
between one and the other takes place (figure 2-8). Where packhouses ‘pre-size’ fruit, the
fruit can be packed later to customer requirement and shipped as required ( ‘Pull’). For the
most part however, fruit is packed continuously to level the load on the packhouse, and
subsequently stored until required to be shipped. This demands substantial storage facilities.
2.2.9. Market access constraints
Access to countries is regulated under the United Nations’ Food and Agricultural Organisation
(FAO). The FAO oversees the International Plant Protection Convention (IPPC), a treaty
underwritten by 177 countries that secures action to prevent the spread and introduction of
pests of plants and plant products, and promotes appropriate measures for their control (IPPC
website: Retrieved 10-1-2013). MPI as the National Plant Protection Organisation (NPPO)
provides country-to-country guarantees that New Zealand will not export product with
quarantine pests and diseases. This effectively creates a body of regulatory compliance
requirements and places substantial constraint on operations to achieve market access for
their product. A number of specific programmes and procedures must be followed by
operations, none of which add value for the customer. Pipfruit NZ recognises market access as
Pipfruit NZ’s number one priority (Pipfruit NewZ, June 2013).
Raw Materials End Customer
Supply Chain Supply Line
Transition between Push and Pull: Buffer Inventory at transition point
FIGURE 2 .8 : PUSH AND PULL ELEMENTS RELATED TO RAW MATERIALS AND CUSTOMER FIGURE 2 -8 : PUSH AND PULL ELEMENTS RELATED TO RAW MATERIALS AND CUSTOMER.

Page 38 of 372
2.2.10. The role of people and leadership
2.2.10.1. Manual labour requirements
The last 100 years has seen major economic shifts. Birch (1987, in Zeithaml et al, 1990)
reports that jobs in the agricultural sector in the US have dropped from well over half of all
jobs to 2%. The shift from primary production and industrial activities to service delivery and
data processing is substantial (figure 2-9). The pipfruit industry however still relies upon a
substantial manual labour component. A sudden ten-fold increase in staff numbers during the
harvest and pack season presents specific challenges (Grigg and Doevendans, 2011). Orchards
spend more than 50% of their expenses on wages and salaries (MAF Horticulture and Arable
Monitoring Report 2008 & 2009); packhouses spend more than 40% and exporters estimate
their wage/salary bill to run between 58% and 65% of total expenditure (Doevendans, 2010).
FIGURE 2 -9 : DEVELOPMENT OF LABOUR ACTIVITY TRENDS DURING THE LAST CENTURY
( ADAPTED FROM PERIGO RD, 1 99 0).

Page 39 of 372
2.2.10.2. Leadership, general and within the industry
A contemporary study into leadership in New Zealand businesses concludes that NZ
owner/managers show an excessive focus on short-term goals and lack long-term strategy
(Kennedy, 2000). The management style tends to be one of little empowerment with owners
making most decisions (Green et al, 2011). Both Kennedy and the ‘Management Matters in
New Zealand’ paper (Green et al, 2011) argue that NZ owner/managers are generally
innovative but have limited leadership skills. Wilson et al (2008) refer to the Auckland 3 B’s,
the Bach, the Boat and the BMW, as a measure of success. Being successful makes owners
hesitant to open up to new ideas because the evidence that the owner’s approach is correct
lies within their success (having the 3 B’s). Masaaki Imai, in an interview (Jayne, 2010) argued
that most of the change process is initiated by middle managers with limited jurisdiction.
Owner/managers who do not accept initiatives by middle managers, will continue along the
path of short-term production systems and continue to present a debi litating inward-focus.
Business NZ (2006) finds that there has been an over-reliance on boosting production through
longer hours and the use of cheap labour. It appears that leadership in general in NZ is in
question.
Historically, many pipfruit organisations are family organisations or were borne out of family
organisations. These organisations brought with them hard workers who left school early and
had little formal training (Mannering, 1999). Doevendans (2013) discusses the importance of
choosing a direction rather than maintaining heuristic non-directional models. Leadership
within the industry is not robustly structured and internal competition does not contribute to
strong directional development within the industry.
2.2.11. The role of science and technology
The industry has invested substantially in the development of science-based approaches
towards growing better fruit with fewer diseases and affected less by seasonal and climatic
conditions. In addition, the industry has invested in ‘open-to-all’ industry database systems,
and a variety of equipment and other innovations. A number of these science based
approaches are reflected in monitoring and spray programmes to combat fungi and pests with

Page 40 of 372
the lowest possible environmental and ethical effects. These have been well documented in
the Pipfruit NZ technical library.
Technologies include the development of grading and sizing equipment of world quality. NZ
equipment is used around the world and can accurately size fruit, distinguish between colour
parameters and in recent years has achieved substantial progress in de fect grading (e.g.
http://www.compacsort.com/). Other equipment includes ‘high volume apple washers’ that
clean pests off fruit, facilitating market access and thus making fruit available for the customer
in specific countries. This technology is only documented as equipment requirements in MPI
provided country specific programmes (e.g. MPI Phytosanitary Compliance Programme for the
Export of Apples to Taiwan 2012-2013) but not as process-improvement technology.
2.2.11.1. New fruit varieties
The pipfruit production system is unsuitable for short term changes to either product
attributes or production cycles (volume); production is partly opportunistic and partly based
on long term trends. Varieties and volumes are largely dependent on the number of trees ‘in-
the-ground’ and production density (density of tree plantings per hectare). To positively
change a product volume in the pipfruit industry will generally take between five and eight
years.
2.2.11.2. New varieties and time-based pacing
The approach towards development of new varieties likens time-based pacing (Eisenhardt &
Brown, 1998) which has been identified predominantly as a strategic tool for introducing
product change in a fast-changing environment. Considering the time required to develop
new varieties, event-based pacing (Brown and Eisenhardt, 1997), a reactive strategy—if it
could be qualified as a strategy—is a poor strategy for an industry such as the NZ pipfruit
industry. Time-based pacing is a strategy for regular innovation in a fast paced environment.
Time-based pacing may equally apply to time-consuming innovations–e.g. it may take a
minimum of twelve years to develop a new variety in a slow paced environment (personal

Page 41 of 372
communication with Prevar’s Chief Executive, September 20, 20136); it may perhaps even be
more applicable in that environment where, once a new variety is successfully launched by a
competitor or competing country, it is likely to take a long period of time to catch up.
Time-based pacing as a strategy may need to be developed further for industries such as the
NZ pipfruit industry where conventional development of a variety can take twelve to fifteen
years, and commercialisation another ten years. The industry may require a continuing variety
development programme—which it has in the form of Prevar Ltd—followed by time-paced
commercialisation. Summarising, in order to produce a new variety for market, there is a
twelve to fifteen year development period, followed by a commercialisation period estimated
at ten years, which may or may not include a grower’s period from planting to full production.
2.2.12. Industry processes
The sections above discuss a number of basic aspects of the pipfruit industry where these can
be found in literature. Most of the reference material is not stemming from academic studies
or research reports. Where data are obtained from industry or websites such as OECD, we can
expect the data to be reliable. Similarly, several industry research reports have been
scrutinised by industry and although not following the academic format per se, allow a
measure of confidence in the accuracy and validity of these reports.
The fact that there is little literature researching industry processes other than technical
processes is both curious and concerning. Frater e.g. observes that only 9.9% of articles in the
national horticultural magazine relate to management subjects, of which 4.3% (a total of
0.43%) relates to Research and Development and a further 1.8% (0.18%) relates to
innovations, patents and IP protection (Frater, 1999). Frater researches innovation
management in the NZ pipfruit industry using survey and two case study trials, and finds that
there is little familiarity within the industry with innovation practices (Frater, 1999). His
findings are corroborated by Doevendans (2010) who uncovers low levels of total quality
management awareness (TQM) within the industry. Interestingly, both writers are
6 Prevar™ is an international joint venture and registered company established to develop and globally commercialise new apple and pear varieties and products. Pipfruit NZ is a major shareholder in Prevar.
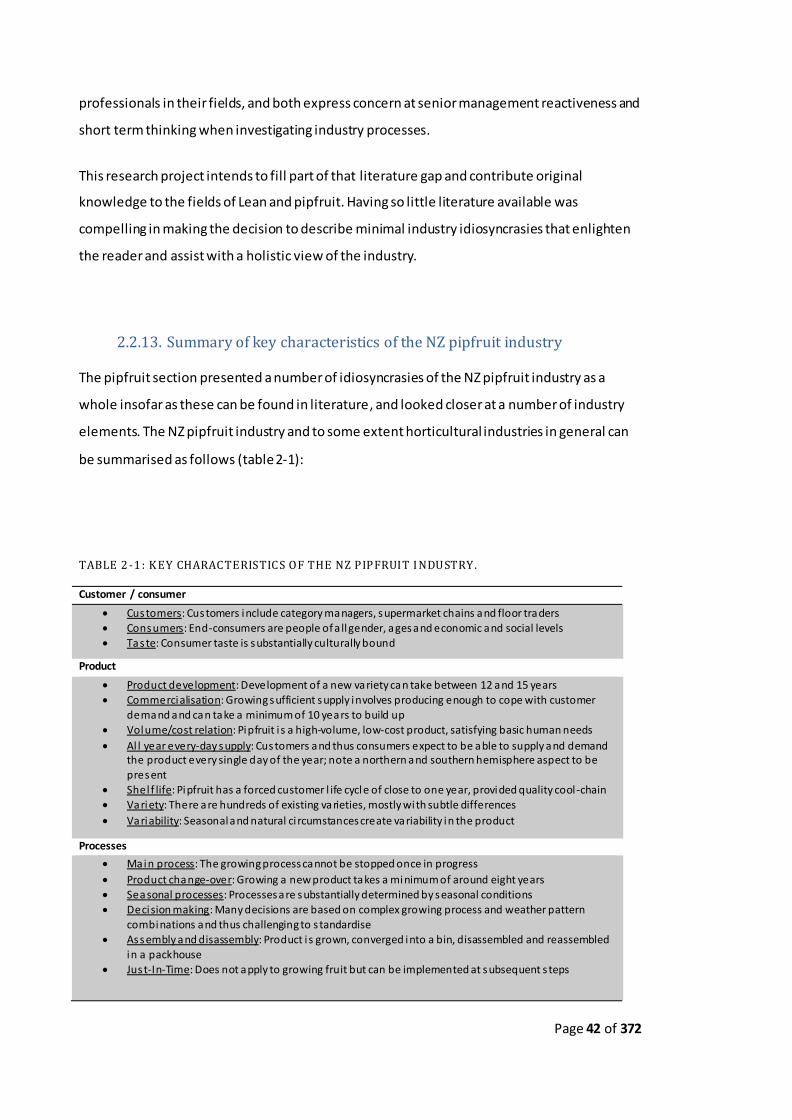
Page 42 of 372
professionals in their fields, and both express concern at senior management reactiveness and
short term thinking when investigating industry processes.
This research project intends to fill part of that literature gap and contribute original
knowledge to the fields of Lean and pipfruit. Having so little literature available was
compelling in making the decision to describe minimal industry idiosyncrasies that enlighten
the reader and assist with a holistic view of the industry.
2.2.13. Summary of key characteristics of the NZ pipfruit industry
The pipfruit section presented a number of idiosyncrasies of the NZ pipfruit industry as a
whole insofar as these can be found in literature, and looked closer at a number of industry
elements. The NZ pipfruit industry and to some extent horticultural industries in general can
be summarised as follows (table 2-1):
TABLE 2 -1 : K EY CHARACTERISTICS OF THE NZ PIPFRUIT I NDUSTRY.
Customer / consumer
Customers: Customers include category managers, supermarket chains and floor traders Consumers: End-consumers are people of a ll gender, ages and economic and social levels Taste: Consumer taste is substantially culturally bound
Product
Product development: Development of a new variety can take between 12 and 15 years Commercialisation: Growing sufficient supply involves producing enough to cope with customer
demand and can take a minimum of 10 years to build up
Volume/cost relation: Pipfruit i s a high-volume, low-cost product, satisfying basic human needs
Al l year every-day supply: Customers and thus consumers expect to be able to supply and demand the product every single day of the year; note a northern and southern hemisphere aspect to be present
Shel f life: Pipfruit has a forced customer l ife cycle of close to one year, provided quality cool-chain
Variety: There are hundreds of existing varieties, mostly with subtle differences
Variability: Seasonal and natural ci rcumstances create variability in the product
Processes
Main process: The growing process cannot be stopped once in progress
Product change-over: Growing a new product takes a minimum of around eight years Seasonal processes: Processes are substantially determined by seasonal conditions
Decision making: Many decisions are based on complex growing process and weather pattern combinations and thus challenging to s tandardise
Assembly and disassembly: Product i s grown, converged into a bin, disassembled and reassembled
in a packhouse Just-In-Time: Does not apply to growing fruit but can be implemented at subsequent s teps

Page 43 of 372
Resources
Infrastructure: Growing land and coolstores and packhouses
Manual labour: Large temporary workforce, mostly unskilled
Equipment: Variety of orchard, packhouse and coolstore equipment
Logistics
Distance to market: Distance to market i s substantial; all transport includes ships, costing time
Push/pull: Supply and demand is both push and pull with relative predictability
Inventory: Inventory building from ISO week 6 to ISO week 20-24, then gradually subsiding
Market access: Regulatory restrictions determine where fruit can be shipped
Seasonal influences
Forced actions: Seasonal component forces actions Activi ty periods: Different activity periods in different segments of the industry
Weather: Weather has a significant impact on required actions, quality and quantity of fruit
2.3. Lean
Lean was popularised as a paradigm in the book ‘The machine that changed the world’, in
which the authors acknowledge that the term ‘Lean’ was first coined by their colleague John
Krafcik because Lean ‘uses less of everything compared with mass production ’ (Womack,
2013). Specifically since that time, Lean has been extensively studied and described, both in
popular and academic formats.
The following section considers various production improvement initiatives, summarises some
historical developments around Lean, and discusses applications of Lean in the manufacturing
and other industries. Lean successes and failures are examined as well as the identified
reasons for these successes and failures. Lean philosophy and methods or tools are discussed
and the availability and themes of existing pipfruit and horticultural literature in relation to
Lean are discussed.
2.3.1. Enhancing productivity: Historical approaches, methods and
techniques
During the past century, production has improved significantly, mostly through technological
advancements. The world of science contributed to our understanding of the world and
numerous scientists are considered to have contributed ‘breakthroughs’ that enhanced

Page 44 of 372
productivity. Although this process has gone on for thousands of years, it is only recorded
history that facilitates tracking contributions to productivity improvement; in fact, the printing
press –facilitating historical record keeping and dissemination and thus indirectly innovation-
represents one of many technological breakthroughs. Since the nineteenth’ century industrial
revolution in the UK, productivity improved with most innovations being of a technological
nature. Wells describes the period as if the world had been developing production equipment
and saved deployment until just before the industrial revolution.
“The economic changes that have occurred during the last quarter of a century or
during the present generation of living men have unquestionably been more important
and varied than during any former corresponding period of the world's history.”
(Wells, 1889, pv)
This technological drive has continued to develop at a continued acceleration, not seen before
(Oram, 2012). The focus of this inquiry is however in the socio-technical field, a field that links
people and technical knowledge and skills in order to manage supply variability, processing
time and demand (Shah and Ward, 2007). It has a focus on how people and processes
improve production.
2.3.1.1. The world of socio-technical and related production improvement
The early pioneers: An arbitrary point to start looking at manufacturing paradigms is the
works of Gilbreth (1919) and Taylor (1919). Gilbreth and his wife, industrial engineers in the
late 1800’s, studied the bricklaying process in order to improve bricklaying output. Their time
and motion studies focussing on ‘flow’ (1911) helped make numerous process improvements
and increased productivity.
Taylor studied production from an efficiency perspective. His focus was on finding the best
way to do a job through analysing the process steps and recognising that workers would only
do the minimum required to keep their jobs. His introduction of piece rates and ‘standard
best practice’ changed productivity markedly. Although his work became known as scientific
management, Taylor originally called his work ‘process management’ (Pryce, in Nelson, 1992)

Page 45 of 372
Since Gilbreth and Taylor, a number of socio-technical system have been developed. Henry
Ford developed a moving assembly line in which he created ‘flow’ by aligning manufacturing
equipment at each assembly step to produce needed parts at a set production speed (Arnold
and Faurote, 1915). Ford’s multiple improvements in a time when mass consumption started
to develop set the scene for years to come (Stamm et al, 2009). Mass production remained
relevant until the 1970s, when the USA found that the Japanese were producing better
products with more variety than the USA could produce (Vogel, 1979). It became the start of a
mini avalanche of new production management systems, the most well-known of which are
discussed briefly in the following section in a more or less chronological order.
Just-In-Time (JIT) and Toyota production System (TPS): During the 1950s, Ohno developed the
Kanban system based on Toyoda’s idea of Just-In-Time (JIT). The Kanban system is a practical
method to order stock as and when needed. Sugimori et al (1977), regard JIT and ‘Respect for
Human’ as pivotal to the Toyota Production System (TPS). The lack of natural resources in
Japan led to a system where stocks were kept low as principle, leading to delivery ‘just -in-
time’ for production to remain uninterrupted. Allowing workers to run and improve their own
workshops through active participation was another main principle of the TPS. TPS is
discussed in more detail later in this section. JIT was overtaken as approach by the more
holistic Lean approach (which included JIT) which reflected the TPS.
Total Quality Management (TQM): The term Total Quality Management (TQM) has been
attributed to Feigenbaum (1957, in Ishikawa, 1985) although Ishikawa (1985) makes the point
that Feigenbaum adopts the western approach of having quality specialists, whereas in the
Japanese philosophy all departments and all employees are involved to achieve an integration
of quality control. TQM involves organisation-wide efforts to deliver high-quality outputs to
customers (e.g. Deming, 1986) and became widely accepted as a production improvement
paradigm in the early 1980s. Ishikawa makes the point that in broad terms, quality control
means management control (1985). While there is no widely agreed-upon definition, Bounds
et al (1994) argue that TQM involves people, management systems in a total management
approach, customer satisfaction, lower real costs and extends horizontally and vertically,
forwards and backwards through the supply chain. TQM efforts typically draw heavily on the
previously developed tools and techniques of quality control.
Theory Of Constraints (TOC): Theory of constraints focusses on enhancing production by
removing constraints from production systems, based on the axiom that there is always one

Page 46 of 372
constraint to achieving the end-goal of making profit, otherwise production would be infinite.
By removing the constraint, the system improves and exposes the next constraint to be
addressed in an ongoing cycle of removing constraints (Goldratt & Cox, 1986).
Six Sigma: Six Sigma was the result of a 1986 initiated improvement drive by Bill Smith and
Bob Galvin, both of Motorola. Six Sigma uses a set of quality management tools to reduce the
number of defects to a theoretical 3.4 per one million. It is a quality improvement initiative
with a focus on decision making processes based on measurements (e.g. Linderman et al,
2003). Six Sigma is seen by some as a progression from TQM considering a number of
similarities between the two (Näslund, 2009). Gershon (2010) argues that all of the Fortune
500 companies have implemented Six Sigma. Comparing a number of process improvement
methods, he believes that Six Sigma encompasses all that TQM does and removes some of the
TQM weaknesses such as management not participating, group project work not being
promoted and the lack of implementation methodology. He believes that most paradigms fall
under the TQM/Six Sigma umbrella with the exception of Lean.
Benchmarking: Benchmarking compares business practices with other company’s business
practices, often after comparing numerical measurements. Using a successful firm’s practices
that have led to the success in that area, the benchmarking company then learns what these
companies do that makes them successful and initiates improvement of its own processes
(e.g. Camp, 1989).
Lean: Lean developed from Toyota’s inception as a car manufacturer in the late 1930s
because Toyota identified that the market for their vehicles was smaller and more demanding
than the US market in which Ford manufactured, requiring production on demand to
customer variety. Lean developed as a management system where production was assisted by
involving people, solving problems, introducing JIT, autonomation and supplier integration
and many tools. Lean is doing more with less for the customer by focussing on waste
reduction at all levels of product manufacturing. Lean focusses on reduction of variation, flow,
inventory reduction through Just-In-Time, continuous improvement through people
involvement and is people and process oriented (e.g. Womack and Jones, 2003).
Business Process Reengineering (BPR): In 1990, Hammer (1990) described how companies
tend to use technology to mechanise old ways of doing business. Hammer believed that this
was only speeding up outdated processes, based on unarticulated rules. He believed that

Page 47 of 372
processes had to be redesigned from scratch to improve production, ignoring the historical
reasons for old processes because the environment has changed. Business Process Re-
engineering (BPR) intended to make organisations re-think how they were doing things,
simplify processes and reduce the waste in those processes. BPR soon became a ‘fad’ (Carson
et al, 1999), used to reduce the number of employees, which was missing Hammer’s point.
Agile: Agile manufacturing, ‘the next logical step’ (Hormozi, 2001), recognises that reaction
time is an important competitive factor in meeting customer demand in a fast changing
environment, and Agile’s focus on manoeuvrability and respons iveness extends to the supply
chain (Christopher, 2000).
Leagile or Leagility: A combination between Lean and Agile leads to the term ‘Leagile’ (e.g.
Mason-Jones et al, 2000). Others, such as Ben Naylor et al (1999) make a case for the
combination of Lean and Agile, using the strengths of each in a synergistic approach to a
market environment: Agile Manufacturing is tailored to satisfy volatile markets, while Lean
has a focus on eliminating waste and creating flow. Relevant in their discussion is the insert ion
of a decoupling point at the transition point between Lean and Agile.
Lean Six Sigma: Lean Six Sigma has been described as the latest improvement ‘fad’ to be
discussed (Näslund, 2008), although Snee (2010) describes it as a natural evolution of business
improvement methods. Schonberger (2007) discusses Lean Six Sigma without actually defining
the concept while George and George (2003) summarise the use of Lean speed and Six Sigma
quality in a combination of the two. Lean Six Sigma is said to provide the concept, methods
and tools to change processes, many of which improve flow and involve human resources
(Snee, 2010).
Material Requirement Planning (MRP) and Enterprise Resource Planning (ERP) : Material
Requirement Planning (MRP) is a time-phased planning technique that calculates and
prioritises material requirements and schedules the supply of materials to manufacture
products on-time with low inventories (Orlicky, 1975). Orlicky’s system was re-developed into
‘Manufacturing Resource Planning’ (MRP-II) by Wright (1995) in order to include other
concepts such as capacity planning and particularly to use software to assist businesses with
their planning processes. A further development continued with Enterprise Resource Planning
(ERP) software as a way to speed up the supply chain process, but the implementation of ERP
as a system is complicated (Wang et al, 2014) and requires specialist involvement.

Page 48 of 372
2.3.1.2. Summarising productivity improvement initiatives
Table 2-2 provides a brief overview of several productivity improvement initiatives that
emerged during the past century, referring to the driving factors leading to each initiative and
the initiative’s attributes.
TABLE 2 -2 : HISTORICAL PRODUCTIVITY IMPROVE MENT INITIATIVES, DRIVERS AND
ATTRIBUTES
Year Paradigm Driving Factors Attributes
1911 onwards
Scientific Management
Efficiency Piece rate, process steps, standard best practice
1910 onwards
Early Fordism Consumption increase, price
Line flow, produce parts in-line as needed (Highland Park only), reduce waste
1922 onwards
Mass Production
Mass Consumption, price
Line flow, batch and queue production
1940 onwards
JIT, TPS, start of Lean
Consumer variation demand pulls production
Toyota Production System including JIT, respect for people and continuous improvement at all levels
1980 onwards
TQM Underperformance in the US
Organisation wide implementation of quality tools/culture
1984 onwards
TOC Productivity through systematic constraint removal
Maximise effectiveness of constraint; adjust all else to the constraint
1986 onwards
Six Sigma Quality drive to improve Motorola’s performance
Tools/techniques for process improvement based on statistics
1989 onwards
Benchmarking Focus on best practice learning
Process improvement through comparison with best practices
1990 onwards
Lean popularised
Produce to customer demand, enabling product variation
Focus on customer, using flow, pull, waste removal through continuous improvement
1990 onwards
BPR Importance of process re-generation as environment changes
Focus on completely re-designing processes to achieve the mission and rethink trend of buying technology
2000 onwards
Agile Response to rapid change in demand
Focus on quick adaptation in volatile environment
2000 onwards
Lean and Agile (‘Leagility’)
Respond to fluctuating demand, reducing waste
Quick adaptation to volatile environment and achieve stable production
2002 onwards
Lean-Six Sigma
Systematically reduce waste, using Six Sigma methods
Using Lean flow and speed combined with Six Sigma quality tools

Page 49 of 372
It is not in the interest of this inquiry to expand on the various production improvement
initiatives, however some observations may be useful to share. As the pipfruit industry has a
large human resource component (Grigg and Doevendans, 2011), any productivity
improvement initiative has to take this into account. This is exacerbated by the fact that the
industry is not a mechanistic producer of goods; it is subject to natural, i.e. uncontrollable
influences; standards such as Six Sigma have not been designed for this type of industry.
Similarly, the Agile concept is less suitable because trees take years to grow fruit while Agile
responds to volatile market demands; this may be useful for exporters. TOC is largely
unknown to the industry, as is BPR and some others such as Material Requirement/Resource
Planning (MRP) and Enterprise Resource Planning (ERP), which span across the business and
are not restricted to production. Some process reengineering takes place by individual
companies, while others attend to some identified constraints; this happens organically and is
not a focus on the paradigm or method. The intra-industry competition after deregulation
prevented effective benchmarking. TQM had some intention in recent years (Doevendans,
2010) but remained ignored as paradigm by the industry.
Lean as a holistic approach to production improvement appears a reasonable fit for the
industry considering its focus, its all-pervading approach and its wide application.
From the brief outline above, it is evident that there is no single best management or
production paradigm. It appears more sensible to argue that although all improvement
programmes share a number of common tools, it is the direction of the philosophy that leads
the way for an organisation that intends to improve. Andersson et al (2006) agree that TQM,
Six Sigma and Lean share many parallels, including methodologies, tools and effects. They opt
for the simple suggestion that organisations could combine the three paradigms as they are
partly overlapping and partly complementary.
There has been some discussion about ‘fashionable’ management methods. Carson et al
(1999) comment on the life cycle of innovative management methods (fads) and discuss the
transition point from ‘fad’ to permanent method. They discuss fifteen ‘fads’ ranging from the
1950s to the 1990s. Interestingly, neither JIT nor Lean are included in the list despite the fact
that Lean was well established in the 1990s. In a different paper, Carson et al explore several
psychogenic influences that drive leaders to move organisations into specific paradigms
(Carson et al, 2002).

Page 50 of 372
Because New Zealand has been placed low on the productivity index of the OECD over the
past twenty years (e.g. OECD, 2013), both government and industries have engaged in Lean to
improve productivity (Goodyer et al, 2011). As the New Zealand NZTE has endorsed and
supported development of Lean production systems (Wilson et al, 2008), and several pipfruit
organisations demonstrated an interest in Lean, this inquiry will focus on Lean as a paradigm
for improving the productivity of the pipfruit industry.
2.3.2. Antecedents to the Lean paradigm
This section briefly touches on the early development of what today is called ‘Lean’. Frederick
W. Taylor and Henry Ford both produced seminal works which form a source where Lean
elements are clearly identifiable. In order to exemplify the relevance of their work, it is useful
to select several quotes from their work.
Although Lean as a word is ascribed to Krafcik by Womack et al (1990), the actual philosophy
and paradigm appears to have been much longer in the making. As early as 1919, Taylor
describes as purpose of his paper on scientific management the intention
“…to point out ‘the great loss which the whole country is suffering through
inefficiency in almost all of our daily acts” (Taylor, 1919, p7).
In his influential work, Taylor examines the earlier motion and time and fatigue work of Frank
and Lillian Gilbreth (1911 and 1919) to which he refers a number of times, each time analysing
in detail Gilbreth’s deductive steps. Important to note is that until Taylor developed his theory
of scientific management, there was little interest in establishing management as a discipline
(Slack et al, 2004). Taylor makes several fundamental statements indicating that, in the future,
‘the system must be first’, and that
‘…the fundamental principles of scientific management are applicable to all
kinds of human activities, from our simplest individual acts to the work of our
great corporations.’ And……. ‘that whenever these principles are correctly
applied, results must follow which are truly astounding’ (Taylor, 1919, p7).
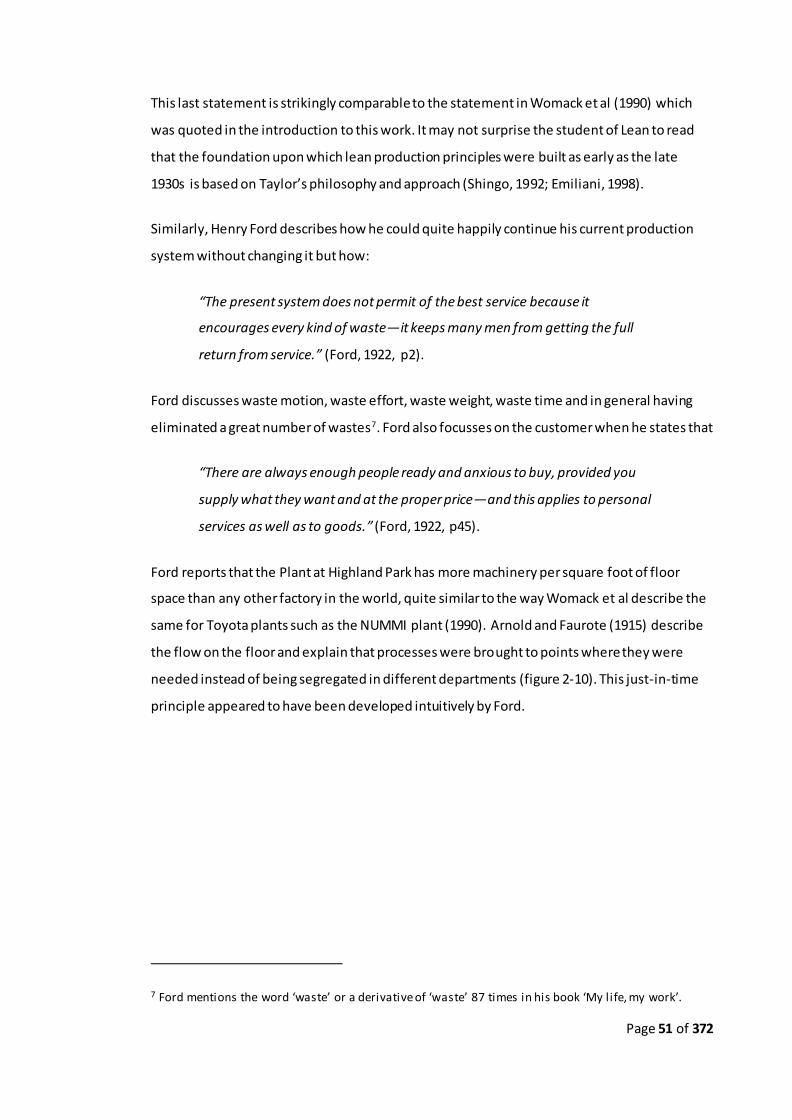
Page 51 of 372
This last statement is strikingly comparable to the statement in Womack et al (1990) which
was quoted in the introduction to this work. It may not surprise the student of Lean to read
that the foundation upon which lean production principles were built as early as the late
1930s is based on Taylor’s philosophy and approach (Shingo, 1992; Emiliani, 1998).
Similarly, Henry Ford describes how he could quite happily continue his current production
system without changing it but how:
“The present system does not permit of the best service because it
encourages every kind of waste—it keeps many men from getting the full
return from service.” (Ford, 1922, p2).
Ford discusses waste motion, waste effort, waste weight, waste time and in general having
eliminated a great number of wastes7. Ford also focusses on the customer when he states that
“There are always enough people ready and anxious to buy, provided you
supply what they want and at the proper price—and this applies to personal
services as well as to goods.” (Ford, 1922, p45).
Ford reports that the Plant at Highland Park has more machinery per square foot of floor
space than any other factory in the world, quite similar to the way Womack et al describe the
same for Toyota plants such as the NUMMI plant (1990). Arnold and Faurote (1915) describe
the flow on the floor and explain that processes were brought to points where they were
needed instead of being segregated in different departments (figure 2-10). This just-in-time
principle appeared to have been developed intuitively by Ford.
7 Ford mentions the word ‘waste’ or a derivative of ‘waste’ 87 times in his book ‘My life, my work’.

Page 52 of 372
And further on, Ford points towards continuous improvement when he states that:
“Hardly a week passes without some improvement being made somewhere
in machine or process, and sometimes this is made in defiance of what is
called "the best shop practice." (Ford, 1922, p85).
As for keeping finished product stock, Arnold and Faurote state the following:
FIGURE 2 -1 0 : LEAN? CLOSE MACHINE PLACING AND FLOW CONCEPT AT HIGHLAND
PARK ( SOURCE: ARNOLD AND FAUROTE, 19 15, P3 9).

Page 53 of 372
“No car is ever stored at the Highland Park plant for a single day, because
this plant has absolutely no place to store its products save in railway cars…
(Arnold and Faurote, 1915, p31).
Both Taylor and Ford are original authors who report on their own work. Both appear to
identify principle elements of what we call ‘Lean’ today. These great men discuss inefficiency,
forms of waste, flow, team work, continuous improvement, standard processes and
applicability of their principles to all types of firms, astounding results, and satisfying the
customer with the right product at the right price. However, the early process-oriented
production methods from Taylor and Ford have substantially collapsed into output-focused,
short-term, results-oriented production systems that strictly dominate most of the
manufacturing businesses in today’s environment (Emiliani, 1998).
It appears that, unless we qualify Lean as something quite unique and specific, and despite the
fact that Womack et al (1990) in their original work appear to propose that Lean was
pioneered by Toyota in the twenty years after the end of World War II, Lean as it is recognised
today was in fact substantially in existence in the early 1900s. Womack et al confirm that in an
afterword to their 2007 edition of ‘the Machine’ in which they state:
“Toyota’s achievement in creating continuous flow in conditions of high
variety, market volatility and short product lives was truly brilliant, but it
rested more firmly on Henry Ford’s shoulders at Highland Park than we
realized.” (Womack et al, 2007, p290).
There is sufficient evidence that generic best work practices lead to good results. Ichniowski et
al (1996) and Pil and MacDuffie (1996), focus on actual and generic work practices rather than
a specific holistic paradigm and point towards success as a result of those work practices.
Fujimoto and Tidd (1994) and Scaffede (2002) also argue that TPS is not completely original,
rather it is a system that mixed lessons learned from others such as Ford with inspired ideas.
It is apparent that there have always been work practices that lead to better performance. A
name for a set of practices is in itself not necessarily relevant, although paradigms such as
Lean tend to come with certain associations and focus the embracer’s direction and approach,
including focal points for employees.

Page 54 of 372
2.3.3. Emergence of the Lean paradigm
During the decade before Lean emerged, several publications (e.g. Sugimori et al, 1977,
Schonberger, 1982, Monden, 1983) described the Toyota Production system and Just-In-Time
(JIT). Shah and Ward (2007) describe how, for a short period of time during the 1980s, JIT
became the production system in the U.S. During this period of time, the US was already
starting to realise that the Japanese production systems were superior. A 1979 book by Vogel,
called ‘Japan as Number 1’ (Schonberger, 2007) and a NBC documentary called “If Japan can…
Why can’t we?”, shown on television in the US in 1980 (Martinez-Lorente, 1998), detailed
Japanese and US quality differences and aroused attention because it showed domestic
production of inferior products and import of superior Japanese products (Martinez-Lorente
et al, 1998). This may have been a pivotal point in the willingness to look at other paradigms.
The US had been comfortable for too long and grown complacent; it had become unable to
change as rapidly as the environment, one of the prerequisite conditions to episodic change
(Weick and Quinn, 1999). The national ego had been shaken and the identified crisis led to the
US being ready for change (Gersick, 1991). Quality management and production systems
started getting more attention in the US from 1980 onwards as is evidenced by the creation of
the Malcom Baldrige awards in 1987 (Bounds et al, 1994) and the increased volume of Lean
publications. Both Total Quality Management (TQM) and ‘JIT’, which soon became ‘Lean’ were
two emerging paradigms in the US because the time was right. Schonberger adds a third area
of interest as the area of employee involvement. He also points to the outpouring of articles
during the early 1980s (Schonberger, 2007) as evidence that the US was looking for change. It
is questionable if these paradigms would have been considered if the gap had not been that
wide.
During the same 1980 period, Schonberger discussed ‘frugal manufacturing’ (Schonberger,
1987). His description of ‘frugal manufacturing’ substantially parallels the Toyoya approach as
he describes that equipment replacement programmes are not necessarily the right answer.
Schonberger is critical about the school of thought focussing on bigger and faster machines.
Instead, his recommendation is to maximise conventional equipment effectiveness and focus
on capability to modify and customise machines. Schonberger also made a case for continual
modification instead of large scale automation projects (1987). Ohno himself stated as early
as 1983 that TPS was born out of Toyota’s efforts to catch up with the west ‘without the
benefit of funds or splendid facilities’ (Monden, 1983). Monden ‘westernised’ TPS with his

Page 55 of 372
1983 explanation of the Toyota Production System and his seminal work made Lean more
accessible to the manufacturing industries (Monden, 1983). All the prerequisites for the
adoption of a new paradigm were present. It was just a matter of introducing a catalyst.
When Krafcik termed the Toyota production system a ‘fragile production system’ in contrast
to ‘robust production systems’ (Krafcik, 1988a), it was because the Just-In-Time (JIT) process
could easily lead to system breakdowns as opposed to conventional ‘robust’ manufacturing
which was based on large stocks, long runs, large spaces and singly skilled employees. Robust
production systems were presumed to be less likely to break down. Fragile required more
investment in people and training for flexible multi-skilled staff. However, it was expected
that the word ‘fragile’ would not sit well with business managers and during a meeting at
Womack’s office, the term ‘Lean’ was proposed by Krafcik and remained ( A chat with James
Womack- 2013).
2.3.3.1. Introduction of Lean
‘The machine that changed the world’ (Womack et al, 1990), became ‘a management classic’
and one of the most cited references in operations management (Holweg, 2007). Realising
this, the authors, in a 2007 reprint acknowledge the value of the exemplar work and decided
to leave the original text as it was, adding a number of lessons learned since the original
publication in 1990 in an afterword (Womack et al, 2007). The book and an earlier article by
Krafcik in the Sloan Management Review (1988b) can be considered primarily responsible for
the introduction and promulgation of the term ‘Lean’ and making Lean a trend or fashion.
Benders and van Bijsterveld (2000) point out the relevance of fashionable management
concepts. They believe that the impact of fashionable management concepts on actual
organisations cannot be ignored. In their view, fashionable concepts trigger changes and may
contain ideas that organisations find useful and can have a lasting influence. They also point
out that fashionable concepts may be misinterpreted, and may be subject to corporate
influences, possibly typifying mindless implementation of these without adaptation to new
environments.
Forty years of Lean articles followed, with Lean being gradually tested outside the world of
manufacturing. Stone refers to the emergence of Lean as the final part of the discovery stage,

Page 56 of 372
the first of five stages deducted from research in Lean over a period of forty years of literature
(Stone, 2012). In his view, Lean was next disseminated, implemented at strategic levels,
expanded to other industries and measured—a gradual progression of the new paradigm. He
deducts these phases from a review of scholarly articles on Lean over a period spanning forty
years. Stone’s review shows that Lean as a paradigm was there to stay, and it is still quite
relevant in many more ways than it was intentionally designed for.
2.3.4. Definitions, philosophy and tools
2.3.4.1. Definitions of Lean
It is interesting that Lean has conjured up a number of different attempted definitions and,
interestingly, a number of non-attempts to define the paradigm. Stone (2012) believes that
the term ‘Lean’ is ill-defined jargon, raising associations with ‘meat’ and to a person’s
physique. He probably has a following in that respect but the name of the paradigm has been
set. Womack, when asked if he could rename ‘Lean’ today answered that he doesn’t relive the
past (A chat with James Womack, 2013). But that aside, it is important to define what it is that
is encompassed by the word representing the paradigm. In Lean terms, a definition is
standardisation. No definition means that it may be difficult to check that an organisation is
actually Lean. In contrast, Hines et al (2004) move that Lean is still evolving and that it may be
difficult to accurately define lean.
As the launchers of the term, Womack, Jones and Roos do not actually define the term; they
define the identified steps involved in Lean (Womack et al, 1990), although Womack refers to
the etymology of the word as a comment by Krafcik that it is:
‘Doing more with less’ (Womack, 2010).
Shah and Ward (2007) point out that there is no common definition of Lean. They also point
out that some substantive disagreement about what Lean production is, has led to confusion.
Despite copious publications, there is still no precise and agreed upon way of defining (and
measuring) lean production. Shah and Ward (2007, p791) propose the following definition:

Page 57 of 372
‘Lean production is an integrated socio-technical system whose main objective is to
eliminate waste by concurrently reducing or minimising supplier, customer, and
internal variability.’
James-Moore and Gibbons (1997, p900) believe that Womack et al did define Lean as follows:
• Integrated, single piece production flow, small batches, just-in-time giving low
inventory;
• Defect prevention not fault rectification;
• Production pull not push with smoothed demand;
• Flexible, team-based work organization with multi-skilled workforce and few in-
directs;
• Active involvement in root cause problem solving to maximize added value;
• Close integration from raw material to customer through partnership.
They believed that one further ingredient had to be added, based on the work of Clark and
Fujimoto (1991, in James-Moore and Gibbons, 1997, p900):
• Greatly reduced overhead burden by the use of matrix teams, simplifying
information flow and processing, enabling flatter organisation structures.
This is not so much a definition as a set of features of lean. Interestingly, in this adopted
definition there is no mention of customer focus or waste reduction, something so important
that it was captured in the five principles of Lean. James-Moore and Gibbons (1997) go on to
deduct a non-quantified vision of a Lean company as showing five characteristics: Flexibility,
waste elimination, optimisation, process control and people utilisation. This view is relevant as
they discuss the universal applicability of lean, something this research project strongly relates
to.
A definition of Lean in the healthcare environment is proposed by Radnor et al (2012, p365)
as:
‘Lean is a management practice based on the philosophy of continuously improving
processes by either increasing customer value or reducing non-value adding activities
(muda), process variation (mura), and poor work conditions (muri). ’

Page 58 of 372
The attempted definitions above have some similarities but vary significantly and lead to
confusion. Pettersen (2009) researched the twenty most cited articles quoting ‘lean
production’ or ‘lean manufacturing’ and the therein identified most influential books, and
concludes that there is no consensus on a definition for Lean amongst examined authors,
despite efforts to do so. He also concludes there is no consensus on the characteristics that
define Lean. He arranges all Lean characteristics identified by the authors in the selected Lean
articles into a new set of groups, characterising Lean in an attempt to achieve some consensus
on Lean characteristics, ending up defining Lean in operational terms (Pettersen, 2009).
Pettersen (2009) also establishes that Lean is a concept on its own and not to be confused
with TQM, using discriminant validity assessment.
It is apparent that there is confusion surrounding the definition of Lean. This includes the
definition of Lean for other industries (e.g. Jørgensen and Emmitt, 2008). The lack of definition
is concerning for several reasons. How can any scholar of Lean know that they truly
understand Lean? How can any organisation that is trying to implement Lean know that they
are on the right track? And, in the case of this thesis, how can we know that the intended
research heads in the right direction?
The lack of definition highlights several important suppositions:
Lean can be different things in different environments; there is no single definition.
Lean is a fluid concept, changing as time goes by and we attempt to implement and
adapt Lean to new environments (e.g. Hines et al, 2004).
The two suppositions above is what will , amongst others, drive the direction of this further
research.
2.3.4.2. Lean philosophy, methods and tools making up the paradigm
The debate about Lean philosophy and tools has been ongoing for some time. A number of
articles differentiate between the two; philosophy being the underlying dri ver of lean and
tools being the practical and operational methods used to achieve the Lean position. Hines et
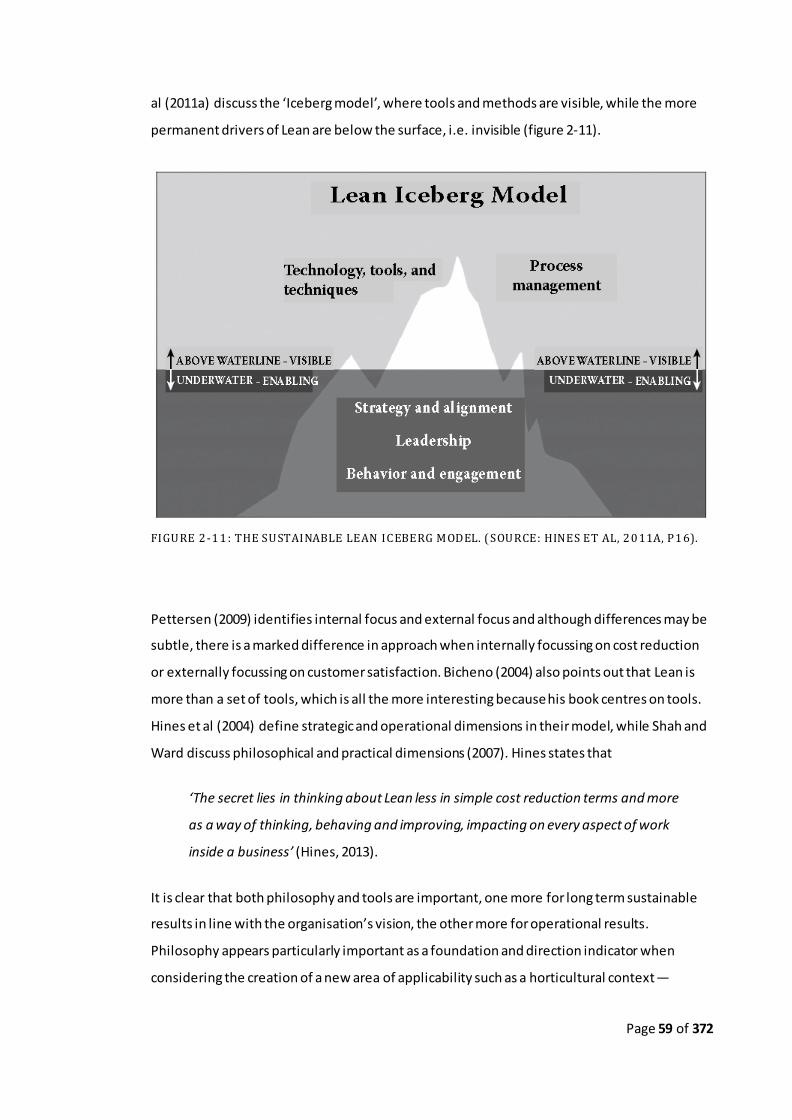
Page 59 of 372
al (2011a) discuss the ‘Iceberg model’, where tools and methods are visible, while the more
permanent drivers of Lean are below the surface, i.e. invisible (figure 2-11).
FIGURE 2 -1 1 : THE SUSTAINABLE LEAN ICEBERG MODEL. ( SOURCE: HINES ET AL, 2 0 11A, P1 6).
Pettersen (2009) identifies internal focus and external focus and although differences may be
subtle, there is a marked difference in approach when internally focussing on cost reduction
or externally focussing on customer satisfaction. Bicheno (2004) also points out that Lean is
more than a set of tools, which is all the more interesting because his book centres on tools.
Hines et al (2004) define strategic and operational dimensions in their model, while Shah and
Ward discuss philosophical and practical dimensions (2007). Hines states that
‘The secret lies in thinking about Lean less in simple cost reduction terms and more
as a way of thinking, behaving and improving, impacting on every aspect of work
inside a business’ (Hines, 2013).
It is clear that both philosophy and tools are important, one more for long term sustainable
results in line with the organisation’s vision, the other more for operational results.
Philosophy appears particularly important as a foundation and direction indicator when
considering the creation of a new area of applicability such as a horticultural context—

Page 60 of 372
specifically tree crops—that are primary, seasonal and are logically significantly detached from
assembly operations. Since new methods and tools may have to be identified or developed,
these need a strong foundation as basis, and that is the philosophy. It is therefore the
philosophical elements of Lean that will drive this study before methods and tools .
2.3.4.3. Lean models and model theory
The literature produces several Lean models attempting to capture Lean. Hines et al (2011a)
propose the sustainable Lean iceberg model where aspects such as strategy, alignment,
leadership, behaviour and engagement are not visible but form most of the substance of the
iceberg. Tools, techniques and process management are visible and above the water surface
(Figure 2-11). The model is a symbolic way of highlighting that not everything to do with Lean
is clearly visible; and that the tools and techniques that are visible do not necessarily indicate
a Lean organisation. This view is similar to the 4-P model proposed by Liker (2004).
Liker (2004) studied Toyota for 20 years and captured fourteen principles in a pyramid model,
dividing the principles into four groups, each starting with the letter ‘P’. The 4-P model shows
degrees of ‘Leanness’ and moves an organisation to a higher level of Lean as i t climbs through
the principles (Figure 2.-12).
FIGURE 2 -1 2 : TOYOTA'S 4 P MODEL (LIKER, 2 004 )

Page 61 of 372
Sohal and Egglestone (1994) propose the core characteristics of a lean production model in a
study of Australian organisations to be:
Team-based work organization with flexible, multi-skilled staff;
Active shop-floor problem-solving structures, central to kaizen activities;
Lean manufacturing operations, low inventories, JIT, jidoka;
High commitment human resource policies, encouraging a sense of shared destiny;
Close, shared destiny relations with suppliers, much smaller supply bases;
Cross-functional development teams; and
Retailing and distribution with close links to the customer and make-to-order strategy.
FIGURE 2 -1 3 : 'THE HOUSE OF LEAN', FROM LIKER ( 2004 , P33) .

Page 62 of 372
Other models involve ‘the house of Lean’, developed by Fujio Cho to represent the Toyota
Production System (TPS) as a system (e.g. Liker, 2004). Each element has its place to hold up
the house and in addition, elements reinforce each other (Figure 2-13).
Finally, Krafcik (1988) describes Toyota’s 4-M model (figure 2-14) as a model helping with
problem solving. The 4-M model can be used at any level, from worker to entire organisation.
In broad lines, the model looks at human factors and at hardware factors.
FIGURE 2 -1 4 : 4-M MODEL FOR PROBLEM SOLVING ( FROM K RAFCI K, 1 98 8, P15) .
Each model attempts to identify in some form what happens in reality (i.e. Key Lean
characteristics) and shows these in a way that is easy to understand and makes sense to the
reader.
A summary of several Lean models is presented in table 2-3.
TABLE 2 -3 : SUMMARY OF LEAN MODELS
Toyota 4P model
(Liker, 2004)
Sohal & Egglestone (1994)
House of Lean (Liker, 2004)
4M model (Krafcik, 1988)
Iceberg model (Hines et al,
2011a)
Philosophy (long-term thinking)
Team-based work organization with flexible, multi -skilled
Just-in-time Takt time Continuous flow
Hardware vs human factors
Enabling: Strategy and alignment

Page 63 of 372
staff Pull system Quick change-over Integrated logistics
Process (eliminate
waste)
Active shop-floor problem-solving
structures, central to kaizen activities
Jidoka Automatic stops
Andon Person-machine separation
Error proofing In-station quality control Root cause problem
solving
Man Skil l
Culture Education
Enabling: Leadership
People & partners (respect, challenge &
grow them)
Lean manufacturing operations, low inventories, JIT, jidoka
People & Teamwork Selection Common goals Ringi decision making
Cross-trained
Method Production management Policy
Enabling: Behaviour and engagement
Problem solving (Continuous improveme
nt & learning)
High commitment human resource policies, encouraging a sense
of shared destiny
Waste reduction Genchi Genbutsu 5 Why’s Eyes for waste
Problem solving
Machine Scale Space use Level of
technology
Visible: Technology Tools Techniques
Close, shared destiny relations
with suppliers, much smaller supply bases
Continuous improvement
Material Visible: Process
management
Cross-functional development teams
Levelled production (heijunka)
Manufacturability Model mix
Retail ing and
distribution with close links to the customer and make-to-order strategy
Stable and standardised
processes Visual management Toyota way philosophy
2.3.5. The focus of Lean
It is both interesting and concerning that the focus of Lean is not unanimously agreed by the
numerous researchers that have studied the subject over the years. For this inquiry, it is
relevant to summarise the dominant tenets of the literature. We have discussed the five
principles espoused by Womack and Jones (2003). Ohno himself believes that there are two
principles that formed the TPS: JIT and Autonomation (Ohno, 1988). Other writers have
similar but discriminate views and identify more than two or different pillars, depending on
the environment (e.g. Skorstad, 1994; Radnor, 2010, Barraza et al, 2009).

Page 64 of 372
2.3.5.1. Focus on the customer and customer value
Pettersen (2009) finds that there is little focus on the customer in all the articles and books he
used for his attempt to find a universal definition for Lean. In his findings however, he does
include the supply chain from supplier to customer as a focus point for Lean. In contrast, Total
Quality Management (TQM) referred to both internal and external customer requirements as
a constant theme. Schonberger (2007) discusses the shift from JIT and inventory reduction to
quick response times to satisfy the customer, e.g. by reducing waiting times; Dell being a
typical example. The quick response time was identified as adding value for the customer.
Customer value in the Lean philosophy is the opposite of waste in the factory and, in fact, the
entire supply chain (Hines et al, 2004). But Hines et al also point out that there is a risk in
focussing solely on the removal of waste in order to create customer value. They point out
that other tangible and intangible factors such as brand, image, environment and local
production also play a role in the customer value proposition (figure 2-15). Jones and Sasser
(2001) would agree with Hines et al, pointing out that only ‘totally satisfied customers’ make a
difference; if the customers have alternatives, ‘satisfied customers’ will stray the very moment
they are not completely satisfied; ‘totally satisfied customers’ will remain loyal.
FIGURE 2 -1 5 : RELATION BETWEEN CUS TOMER VALUE, COST AND WASTE ( SOURCE: HINES ET AL, 2 0 04 , P9 97) .

Page 65 of 372
Although the customer is of obvious importance, no matter what paradigm is adopted by the
organisation, the customer focus in the Lean philosophy should not be seen in isolation.
Instead, the customer value proposition forms part of the integrated value model.
2.3.5.2. Focus on removing waste
Numerous articles reiterate Ohno’s seven wastes (e.g. Hines & Rich, 1997; Jones et al, 1997;
Schonberger, 2007; Hines et al, 2004), ascribed to Ohno and identified as waste in processing,
time, defects, motion, overproduction, inventory and transportation. Over the years, these
have been interpreted and several articles point towards an eighth waste, being human
potential or knowledge (e.g. Womack and Jones, 2003; Kilpatrick, 2003; Liker, 2004). Others
added a different eight waste, e.g. Emiliani and Stec (2004) who add ‘behaviours that do not
add value’ as eight waste. Koskela (2004) makes a case for adding ‘making do’, i.e. doing a job
despite the fact that not all prerequisite conditions are fulfilled, as eighth waste.
Schneiderman (1988) places nine wastes identified by Ryuzaburo Kaku (Canon) next to Ohno’s
seven wastes: Kaku identifies wastes in rejects, parts inventory, indirect labour, equipment
and facilities, expenses, design, human resources, operations, and waste in production (start -
up) of new products. Hines goes one step further when he transforms the conventional
wastes into ‘green wastes’ (Hines, 2009).
In a recent presentation to the ‘New Zealand Lean Leadership Network’ (NZLLN), Mark Powell,
CEO of the Warehouse Group of companies, explained how retail has its own challenges and
presented a table of ten wastes identified for the Warehouse Group. As an aside and in a
personal conversation, Powell, whose thinking has been strongly influenced by his studies
under Jones at the Cardiff Business School, confirmed that his thinking relates substantially to
Lean principles, but that the retail sector had done very little in studying its applications in
that sector. He prefers the term ‘Value Stream Management’ over the term ‘Lean’ (personal
conversation with Mark Powell, CEO of the Warehouse Group, 25-10-2013). In order to
contribute to knowledge, he undertook to present his views on retail value stream
management academically (Powell and Childerhouse, 2010).
Table 2-4 summarises a number of different approaches from literature towards identifying
waste.

Page 66 of 372
TABLE 2 -4 : SUMMARY OF DIFFERENT WASTE PERSPECTIVES .
Ryuzaburo Kaku, Canon (in Scneiderman, 1998)
Taiichi Ohno, Toyota
Hines (2009) Koskela (2004) Hines (2009b) Womack and Jones (2003)
Hines and Rich (1997)
Emiliani and Stec (2004)
Powell and Childerhouse (2010)
The Nine Wastes The Seven Wastes
Eight Wastes including 'making-do’
Eight Green Wastes
Lean thinking Warehouse environment
Retail environment
Waste in rejects Waste in processing itself
Over-production Over-production Greenhouse gases
Over-production Faster-than-necessary pace
Over-production
Lost sales & customers
Waste in parts inventory
Waste of time Defects Defects Eutrophication Defects Waiting Defects Excessive ‘push’ stocks
Waste in indirect labour
Waste of making defective parts
Unnecessary Motion
Unnecessary Motion
Excessive resource Usage
Unnecessary Motion
Conveyance Unnecessary Motion
Excessive ‘pull’ stocks
Waste in equipment and facilities
Waste of motion Unnecessary Inventory
Unnecessary Inventory
Excessive Water usage
Unnecessary Inventory
Processing Unnecessary Inventory
Delay & waiting
Waste in expenses Waste of overproduction
Inappropriate processing
Inappropriate processing
Excessive Power usage
Inappropriate processing
Excess stock Inappropriate processing
Unnecessary transportation
Waste in design Waste of inventory
Transportation Transportation Pollution Transportation Unnecessary motion
Transportation
Excessive movement & handling
Waste in human resources
Waste of transportation
Waiting Waiting Rubbish Waiting Correction of mistakes.
Waiting Unnecessary processes or layers
Waste in operations
Lost People Potential
Making-Do Poor Health & Safety
Knowledge
Behaviours Defects, errors and poor process reliability
Waste in production start-up of new products
Rigidity , the lack of flex ibility & responsiveness
Unnecessary complex ity

Page 67 of 372
It is fascinating that Ohno himself states:
“I don’t know who came up with it but people often talk about ‘the seven types of
waste‘. This might have started when the book came out, but waste is not limited to
seven types. There is an old expression: ‘He without bad habits has seven’, meaning
even if you think there is no waste, you will find at least seven types. So I came up with
overproduction, waiting etc., but that doesn’t mean there are only seven types. So
don’t bother thinking about ‘what type of waste is this?’ Just get on with it and do
kaizen” (Ohno, 2013, p175).
Essentially, it appears that the attempts at cataloguing waste have come about by not
completely comprehending what Ohno had in mind when he came up with the seven so well -
known wastes. From the attempts at grouping wastes in different environments, and from
Ohno’s own words, it is quite clear that any identified waste, any situation that does not add
value and is unnecessary, can be categorised as waste and it becomes rather irrelevant how
many waste groups there are. Regardless of focus on removing waste to increase customer
value (e.g. Dennis, 2002; Bicheno, 2004), or removing waste to reduce costs (e.g. Ohno, 1988;
Monden, 1998; Shingo, 1989), it is this approach that will further be adopted during the
ensuing industry research.
2.3.5.3. Focus on Just-In-Time
A clarification of terms may be helpful to avoid a reasonably common confusion in
terminology. The term ‘Lean’ will be used for the combined philosophies, methods and tools
that are used to reduce waste and increase customer value. The term Just-In-Time (JIT) will be
used for the method where the focus is on reducing wasteful inventory by delivering only
what is needed, when it is needed and how it is needed (Ohno, 2013), with all the direct and
indirect consequences.
Just-In-Time (JIT) was an early US adoption of Lean methodology but soon overtaken by the
term Lean, rightly or wrongly. Shah and Ward (2007) point out that, for a period in the early
1980s, JIT became the production system in the US. JIT in today’s terminology is not
considered synonymous with the term Lean. It encompasses a substantial proportion of the
Lean paradigm in that it focuses on small lot productions which then implies quick change-
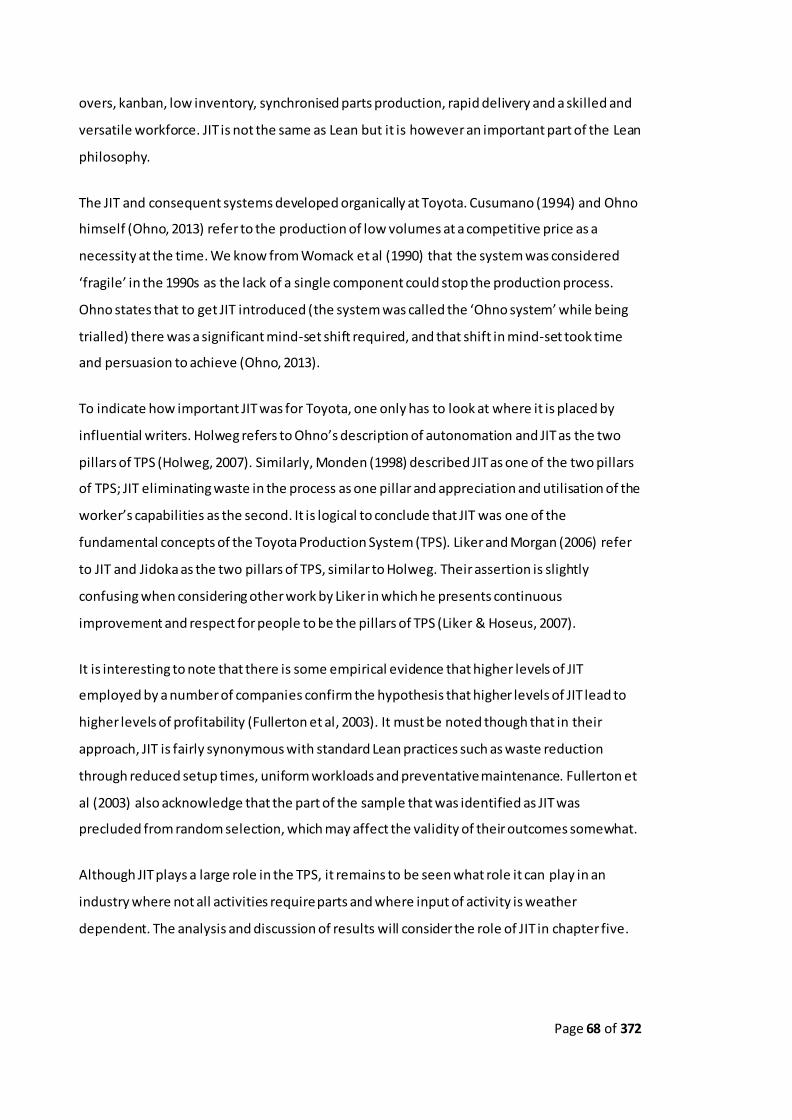
Page 68 of 372
overs, kanban, low inventory, synchronised parts production, rapid delivery and a skilled and
versatile workforce. JIT is not the same as Lean but it is however an important part of the Lean
philosophy.
The JIT and consequent systems developed organically at Toyota. Cusumano (1994) and Ohno
himself (Ohno, 2013) refer to the production of low volumes at a competitive price as a
necessity at the time. We know from Womack et al (1990) that the system was considered
‘fragile’ in the 1990s as the lack of a single component could stop the production process.
Ohno states that to get JIT introduced (the system was called the ‘Ohno system’ while being
trialled) there was a significant mind-set shift required, and that shift in mind-set took time
and persuasion to achieve (Ohno, 2013).
To indicate how important JIT was for Toyota, one only has to look at where it is placed by
influential writers. Holweg refers to Ohno’s description of autonomation and JIT as the two
pillars of TPS (Holweg, 2007). Similarly, Monden (1998) described JIT as one of the two pillars
of TPS; JIT eliminating waste in the process as one pillar and appreciation and utilisation of the
worker’s capabilities as the second. It is logical to conclude that JIT was one of the
fundamental concepts of the Toyota Production System (TPS). Liker and Morgan (2006) refer
to JIT and Jidoka as the two pillars of TPS, similar to Holweg. Their assertion is slightly
confusing when considering other work by Liker in which he presents continuous
improvement and respect for people to be the pillars of TPS (Liker & Hoseus, 2007).
It is interesting to note that there is some empirical evidence that higher levels of JIT
employed by a number of companies confirm the hypothesis that higher levels of JIT lead to
higher levels of profitability (Fullerton et al, 2003). It must be noted though that in their
approach, JIT is fairly synonymous with standard Lean practices such as waste reduction
through reduced setup times, uniform workloads and preventative maintenance. Fullerton et
al (2003) also acknowledge that the part of the sample that was identified as JIT was
precluded from random selection, which may affect the validity of their outcomes somewhat.
Although JIT plays a large role in the TPS, it remains to be seen what role it can play in an
industry where not all activities require parts and where input of activity is weather
dependent. The analysis and discussion of results will consider the role of JIT in chapter five.
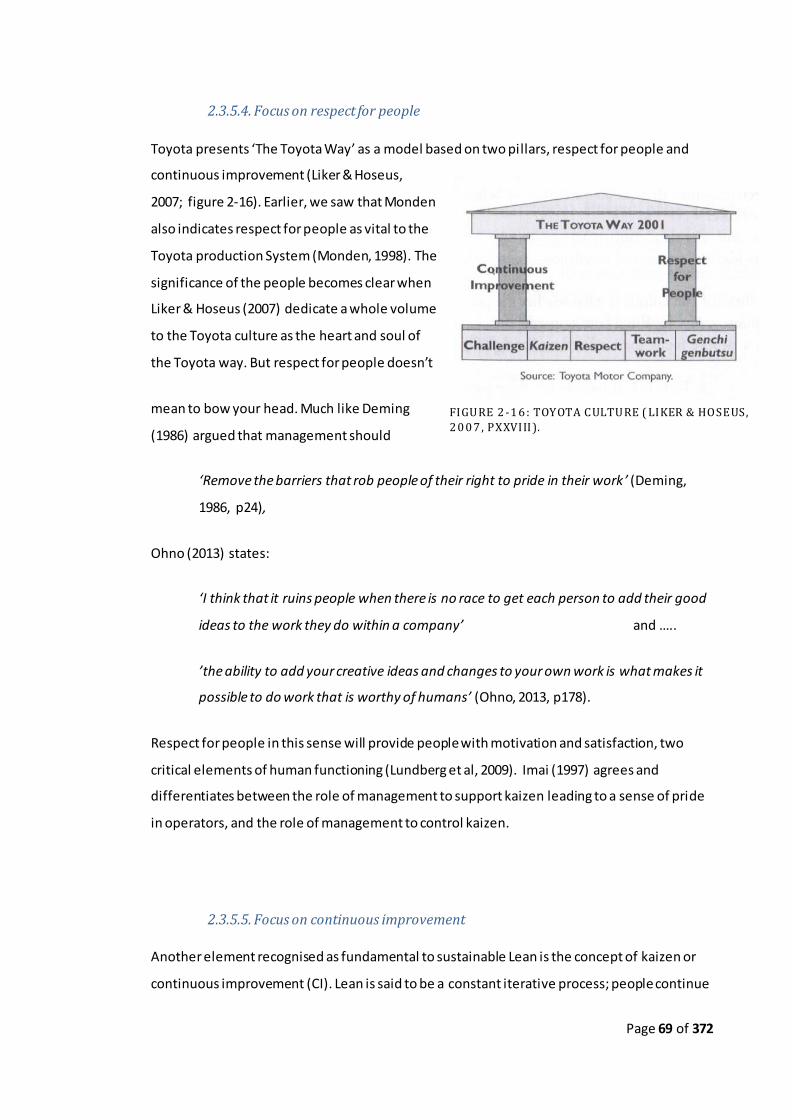
Page 69 of 372
2.3.5.4. Focus on respect for people
Toyota presents ‘The Toyota Way’ as a model based on two pillars, respect for people and
continuous improvement (Liker & Hoseus,
2007; figure 2-16). Earlier, we saw that Monden
also indicates respect for people as vital to the
Toyota production System (Monden, 1998). The
significance of the people becomes clear when
Liker & Hoseus (2007) dedicate a whole volume
to the Toyota culture as the heart and soul of
the Toyota way. But respect for people doesn’t
mean to bow your head. Much like Deming
(1986) argued that management should
‘Remove the barriers that rob people of their right to pride in their work ’ (Deming,
1986, p24),
Ohno (2013) states:
‘I think that it ruins people when there is no race to get each person to add their good
ideas to the work they do within a company’ and …..
’the ability to add your creative ideas and changes to your own work is what makes it
possible to do work that is worthy of humans’ (Ohno, 2013, p178).
Respect for people in this sense will provide people with motivation and satisfaction, two
critical elements of human functioning (Lundberg et al, 2009). Imai (1997) agrees and
differentiates between the role of management to support kaizen leading to a sense of pride
in operators, and the role of management to control kaizen.
2.3.5.5. Focus on continuous improvement
Another element recognised as fundamental to sustainable Lean is the concept of kaizen or
continuous improvement (CI). Lean is said to be a constant iterative process; people continue
FIGURE 2 -1 6 : TOYOTA CULTURE ( LIKER & HOSEUS,
2 0 0 7 , PXXVIII ).

Page 70 of 372
to learn as they continue to be engaged and improve their processes. Toyota presents ‘The
Toyota Way as a model based on two pillars, respect for people and continuous improvement
(Liker, 2004). Womack and Jones (2003) recognise continuous improvement as the last link in
the chain of Lean principles: ‘Perfection’. It is the concept of continuous innovation or
perfection that provides the Lean employer with an extra source of improving his
organisation. It is often argued that western people prefer to have technological
breakthroughs and innovations, while Japanese people are used to small incremental
improvements (figure 2-17). Imai (1986) depicts quite clearly where innovation fits in relation
to kaizen and that they can easily go hand-in-hand.
Imai (1986) differentiates between the process of innovation and the process of Kaizen.
Figures 2-18, 2-19 and 2-20 illustrate the difference between both processes.
FIGURE 2 -1 8 : INNOVATION AS IMAI SEES IT (IMAI, 1 98 6, P26) .
Science Market Production Design Technology
Innovation Kaizen
FIGURE 2 -1 7 : RELATION BETWEEN INNOVATION AND KAIZEN ( IMAI, 19 86) .

Page 71 of 372
FIGURE 2 -1 9 : THE COMBINATION OF I NNOVATION AND CONTINUOUS IMPROVEMENT AS IMAI
SEES IT ( IMAI, 1 98 6, P27 ).
Ohno believes that kaizen ideas are infinite; each kaizen idea provides the basis for another.
Continuous improvement should take place, particularly when times are good. Ohno warns
against complacency and states that in bad times, all people can do is cut costs, most often by
reducing staff; in poor times, people do not have the mind-set for continuous improvements
(Ohno, 2013). Liker and Morgan (2006) believe that kaizen is rarely practiced in most
organisations. Problems that surface are only valuable if the workers have the tools and are
allowed and encouraged to deal with the problems themselves and then solve them at the
root cause. Continuous improvement is therefore an endless journey of improvement and an
essential element of any Lean culture. Particularly when we start attempting to develop a
Lean approach in a new industry, it will be the people and incremental improvements that will
add up to better results and a more prosperous sector.
2.3.6. A critical look at lean manufacturing
This section provides critical and alternative views on Lean to balance the view on Lean.

Page 72 of 372
2.3.6.1. Evidence for Lean
There is a body of evidence that Lean works and works well. Womack et al (1990) present
tables and numbers that demonstrate the successful impact of Lean. When they compare the
traditional General Motors (GM) plant and the New United Motor Manufacturing Inc.
(NUMMI) ‘transplant’ (a term used for US-based plants, driven by Japanese management
paradigm) in Fremont, California, the numbers show staggering results such as in table 2-5.
TABLE 2 -5 : COMPARISON BETWEEN J APANESE/US 'TRANSPLANT' AND US CAR ASSEMBLY PLANT ( SOURCE: WOMAC K, JONES AND ROOS, 19 90) .
GM Framingham
Toyota Takaoka
NUMMI Fremont
Assembly hours per car 31 16 19 Assembly defects per 100 cars 135 45 45
Assembly space per car 8.1 4.8 7 Inventories of parts (average) 2 weeks 2 hours 2 days
These numbers also demonstrate that Lean is not nationally bound, but is the result of a
company culture and management system that is based on a different philosophy. In
following years, Womack and Jones present multiple case studies of different medium and
large manufacturing environments (Womack and Jones, 2003), and how these companies
transformed into Lean companies. Byrne published several of his practitioner successes in
which he explains how companies completed the transformation successfully (Byrne, 1995;
Byrne and Womack, 2012). There can be little doubt that Lean can achieve excellent results,
going by the numerous cases presented over the years.
2.3.6.2. Success factors and pitfalls
Several reports quote success- and failure-rates and causes, commonly for failures to
implement Lean. The reasons for success and failures are often the same; e.g. projects partly
fail through poor communication or partly succeed through effective communication. Liker
and Rother (2013) quote the 2007 Industry Week survey that found that only 2% of
companies that implemented Lean achieved their anticipated results. Bhasin (2012)

Page 73 of 372
summarises that less than 10 per cent of UK organisations have been successful in
implementing Lean. Although the positive effects of a successful implementation have been
adequately described (e.g. Womack and Jones, 2003, Byrne, 2012), it is useful to investigate
the critical factors further.
Several studies identify success factors and pitfalls when implementing Lean. Scherrer-Rathje
et al (2009) report how Lean can both fail and succeed in the same company. Their case
studies indicate which factors contributed to failure at the first attempt and how the company
succeeded the second time. Despite a number of internal successes, a first Lean project was
terminated due to the lack of organisational support and a senior management re -
organisation. The bottom-up approach suffered from lack of team autonomy, lack of senior
management commitment and lack of communication in Lean. A senior employee also
reported a degree of ‘change fatigue’ as the company had introduced a number of other
changes before its attempt at Lean.
Nine years later, the company recognised the necessity to introduce Lean and management
remembered the lessons from the earlier attempt. Despite not communicating the overall
goal during the first six months, an initial pilot project headed for success and was soon
followed by others. The recognition of the need for employee autonomy and the introduction
of ‘Just-Do-It’ daily process meeting rooms facilitated the process. The company which
originally failed to introduce Lean now reported a five-fold improvement in production. An
important observation was that staff adopted a culture of improving themselves.
Bhasin and Burcher (2006) use mixed methods to investigate Lean implementation. After
thorough discussion of Lean implementation and philosophy, they find that the philosophy
must be embedded before successful implementation can be claimed. The low number of
successful Lean initiatives is also linked to ineffective human resource management (HRM),
with organisations often not understanding what ‘respect for people’ entails. In addition, they
observe the need to have the supplier base included and –interestingly- also discuss the
inclusion of accounting. A misalignment of accounting methods may eventually lead to dis-
continuation of the Lean implementation effort.
Both the academic and popular literature provide a number of summaries of critical factors
which may become pitfalls or can be used to assist the Lean implementation process. A
number of these are summarised in table 2-6. Emiliani’s list (Emiliani, 2012) is taken from a

Page 74 of 372
satirical ‘blog’, but he is a sufficient authority and to be taken seriously. Seddon’s work (2007
and 2010) has been taken from his writings as consultant, however he is considered to be
both a successful practitioner and writer. Hines’s summary (2010) was taken from a white
paper, however Hines is considered sufficient a Lean authority to be able to justify his
findings. Liker and Rother (2013) also summarised their pitfalls on a website, but they too are
considered sufficiently authoritative in the subject to be quoted. All other lists have been
taken from academic papers. Kallage’s list (2006) is presented by the Fabricators &
Manufacturers Association in the USA.
Several approaches group the critical factors. Common themes are the importance of an
understanding of Lean, the commitment of senior management, the willingness to cooperate
with change, the culture, the communication process, the implementation method or model,
the monitoring and evaluation and the general approach towards the people in the
organisation. Although it is helpful to have an understanding of the different views on success
factors and pitfalls, one could argue that they are essentially the same, e.g. proper
management commitment will contribute positively, while negative management
commitment will endanger a Lean implementation process. For the purpose of this inquiry,
there is little doubt that a number of the critical factors will be re-addressed during the
discussion of the results.
Page 75 of 372
TABLE 2 -6 : GROUPING OF CRITICAL ELEMENTS FOR LEAN IMPLE MENTATION.
Emiliani (2012)
Liker and Rother (2013)
Seddon (2007 & 2010)-Service industry
Pedersen and Huniche (2009)
Scherrer-Rathje et al, 2009) Implementation failure followed by success
Radnor et al (2006) Scottish public sector
Achanga et al (2006)
Hines (2010) Lean failures Kallage (2006)
Pitfalls Pitfalls Pitfalls Pitfalls Lessons learned Pitfalls Critical element Pitfalls Pitfalls
Ignorance of Lean Fundamental
misunderstanding what Lean is
Lack of
understanding
Management: Lack
of management awareness and support
Lean will not succeed
without visible management commitment
Lack of
resources to implement changes
Leadership &
Management
Lack of clear
executive vision
Management/ Leadership:
Insufficient Understanding of Lean and Its Elements
Short term thinking
Lack of skill to systematically and i teratively
improve the process
Lack of flexibility
Resources: Insufficient resources
(technical, financial, human)
Develop formal mechanisms to encourage and enable
autonomy
Res istance to change from staff and
management
Strategy Lack of effective communication s trategy
Management/ Leadership: Poor Development of the Bus iness Case for Lean
Zero-sum (win-lose) ‘Fake Lean’
Ignorance of invisible purpose
of tools
Bl ind application of
tools
Communication: Poor
Openly disclose mid- to long-term lean goals
Post Rapid Improvement
Event; lack of
ownership of the activity
Vis ion Fa i lure to create & communicate
a rea l sense of
urgency
Management/ Leadership: Communications: Too Little,
Too Complex, Too Simple
Senior management
ineptitude
Lack of skills to develop solutions
Managing activi ties as
costs
Objective: Cost-cutting, layoffs
Ensure mechanisms are in place for long-term
sustainability of lean
Lack of commitment
to the change process
Funding Poor consultation
with s takeholders
Management/ Leadership: Insufficient Focus and
Involvement
Lean introduced to benefit the
company at the
expense of workers
Lack of routine to improve work
Fragmentation of the work
Link to s trategy: Misalignment
Ownership: No ownership
Communicate lean wins from the outset
Slow pace of change in the
public sector.
Organisational cul ture
Lack of s tructured
methodology
and project management
Management/ Leadership: Poor Organizational and
Leadership Development
Demand for immediate cost-
savings
Lack of use of people’s creative
ta lents
No focus on demand
Employees: No buy-in
Continual evaluation during the lean effort i s
cri tical
Ski lls & Expertise
Fa i lure to monitor and
evaluate the
Management/ Leadership: Lack of Proper Metrics to
Determine Performance and

Page 76 of 372
Emiliani (2012)
Liker and Rother (2013)
Seddon (2007 & 2010)-Service industry
Pedersen and Huniche (2009)
Scherrer-Rathje et al, 2009) Implementation failure followed by success
Radnor et al (2006) Scottish public sector
Achanga et al (2006)
Hines (2010) Lean failures Kallage (2006)
outcome Isolate Challenges
Management not trusting workers
No focus on learning ability
and attitude of people
No focus on processes
Need for change but Change more
an obstacle than Lean
People & soft i s sues
Fa i lure to mobi lise change
champions
People issues: Lack of Middle-Management Buy-in
Lay-offs s tymie improvements
Too great a focus on tools
Competencies: lack of change management
Productivity improvement
Fa i lure to engage employees
People issues: Not everyone is a leader
Lack of ‘respect for people’,
employees, customers,
suppliers etc.
Lack of learning to
resolve problems
Staffing: poor change agents and
improvement teams
Resource ava ilability
Absence of a dedicated and
ful ly resourced implementation
team
People issues: Management or Employee Capabilities a re
Lacking
Lack of root cause thinking
Loss of focus on waste
Time Plan: Slow pace of change
Wi l lingness to learn
Lack of sympathetic and supportive HR pol icies
Deployment Methods: Failure to Learn proper CI Methodology—Reliance on Kaizen Blitzes.
Ass igning blame culture
Competence bui lding:
Inadequate training
Technology development
Deployment Methods: Rel iance on a Single In-house
Champion or Expert Rewards:
Recognition & rewards missing
Deployment Methods:
Insufficient or Inappropriate Tra ining
Cul ture: culture change required
Deployment Methods: Weak Deployment Strategy
Dominant mind-set: Si lo thinking
Knowledge transfer: lacking
Page 77 of 372
2.3.6.3. Criticism on lean.
There has been criticism of Lean by a number of authors. This should not be surprising as
Ohno, in his introduction to Monden’s work (1983 and 1998), expresses his interest to see if
the TPS works for other companies and countries. In his view it was developed solely by
Toyota for Toyota, and even Japanese companies had trouble picking it up. Cusumano (1994)
agrees with the restrictions to the TPS and tables a number of limitations to Lean. He quotes
e.g. the Japanese government’s efforts to reduce the effects of JIT-caused traffic congestion,
and observes issues with the integration of suppliers and lack of blue collar workers.
Cusumano clarifies that what is good for Toyota is not necessarily good for others (1994).
Schonberger (2007) reports on longitudinal research data that are based on inventory trends
and provide insight into diffusions and uneven results by the Japanese Management Systems
(JPMs). Evidence of confusing system lapses and disappointments, both amongst Japanese
and Western companies, raise questions about the sustainability of Lean, as well as some of
its changed manifestations. An area of weakness is argued to be the lack of design
recommendations for capturing and analysing implications of customer value (Piercy and Rich,
2004).
Emiliani (2012) uses a different approach and goes so far that he publishes a mock report of
Lean Failure at an undisclosed company. The report has several blank spaces in which the
reader can complete the company’s name, as Emiliani expresses the standard reasons for
failure to be the drive to cut costs, leading to ‘zero-sum’ outcomes (Emiliani, 2012). Seddon
(2007) makes the case that often organisations implement tools and that this rarely results in
changes to the system. His view is that the system needs to change and then the tools will
follow. Lewis (2000) provides a critical look at Lean and concludes that Lean does not
necessarily result in improved financial performance. In addition Lewis (2000) considers that
there is a radically shifted power distribution once a company goes Lean.
Seddon too is quite rigorous in his condemnation of the standard use of Lean in different
environments (Seddon, 2010). In his view, Ohno warned against codifying his system because
that would remove all flexibility and turn it into the use of a set of tools without learning. In
fact, Ohno did state that we are ‘walking misconceptions’ (Ohno, 2013). Seddon makes an
interesting case for ‘failure demand’, demand caused by the failure to provide correct service

Page 78 of 372
the first time (Seddon and Caulkin, 2007). Liker and Rother (2013) quote Robert Miller,
executive director of the Shingo Prize, who in 2010 stated that a large percentage of the prize
Shingo Prize winners over the previous 19 or 20 years had not been able to sustain Lean and
had regressed to implementing tools rather than embedding the culture. So, despite the fact
that a 2007 study by Industry Week in the US showed that 69.6 % used Lean manufacturing as
improvement methodology, there is a question about its sustained success.
It is evident from the literature, as it should have been from Ohno’s own assertions (Monden,
1983), that Lean is not the omnipotent panacea for manufacturing. Lean has to be moulded
and shaped to fit and suit the environment into which it is introduced, and it requires
philosophical changes that are difficult to fit into a short-term profit thinking environment. It
is this criticism that may be helpful moulding pipfruit industry organisations into ‘Lean-
readiness’.
2.3.6.4. National and organisational culture
It is by now clear that the right organisational culture is a prerequisite for successful Lean
implementation. The question may be asked if national or societal culture affects
organisational culture. Womack et al (1990) deal with this briefly when they compare the
results of the NUMMI plant with the results of other US plants. The NUMMI plant in Fremont
was substantially manned with ex-employees from the de-commissioned General Motors
(GM) plant. Despite the fact that these workers were predominantly US born, the NUMMI
plant outperformed all other US car manufacturers and, by inference, the result could not be
tied to the Japanese societal culture. Krafcik concludes the same for several other plants in
the US and points at production management policy as having a greater bearing than
Japanese parentage (Krafcik, 1988a).
Wagner explored group cultures in implementing continuous improvement (CI), and found
that new initiatives such as CI became meaningful to workers depending on the individual’s
perceptions (Wagner, 2011). In his view, societal culture was strongly linked to organisational
culture similar to Jung’s theory of groups (Jacobi, 1973), where people can belong to many
groups, each influencing the person’s ego awareness and behaviour but still displaying
separate group cultural norms and values. This may not be the case where a ‘foreign’

Page 79 of 372
organisational culture is introduced in a national or societal context in which case the
different cultural contexts may precipitate conflicts (Mwaura et al, 1989), or where
managerial adaptation is required to fit the organisational culture into the societal culture
(Newman and Nollen, 1996). As Hofstede argues, national or societal cultures are a given,
while organisational cultures can be managed up to a point (Hofstede, 1994). Wagner (2011)
concludes that the individuals’ participation in continuous improvement (CI) was largely based
on self-motives and a feeling of self-worth.
This last observation relates to Maslow’s hierarchy of needs (e.g. Inkson and Kolb, 2003) and
transcends national and societal boundaries. Culture can therefore be influential but there is
no reason to assume that it is the Japanese culture that made Lean a successful
manufacturing paradigm.
2.3.6.5. Universal applicability of Lean
It is interesting that one of the founding fathers of TPS (Ohno, in Monden, 1983) believes that
that even in Japan, it was difficult for people of outside companies to understand TPS. Ohno
expresses the expectation that it must be even harder for ‘foreign’ people, and that includes
westerners. Since 1983, however, a lot has changed in societies around the world. We have
already seen earlier that the US was ready for a philosophical change in quality and
production systems in the early 1980s. Cusumano (1994) points out that even in Japan, Lean is
not the same for the users. He points out that Honda and Toyota had unique historical and
geographic settings that facilitated Toyota’s JIT and Honda’s product development system.
Nissan discovered in the early 1970s that Toyota’s kanban system did not work very well in
urban areas with traffic congestion and found different solutions. According to Lewis (2000),
individual firms tend to follow a more or less unique Lean implementation trajectory.
Although the TPS tools may not be universally applicable to all sectors and industries, there is
a body of evidence that the Lean philosophy, principles and tools can be adapted sufficiently
to other environments to help improve performance. The following paragraphs discuss some
of these.

Page 80 of 372
2.3.6.6. Low-volume high-value goods
Lean production was typically designed for a relatively high volume environment where
different products are produced. There are also products of which only few are produced with
high levels of customisation. Jina et al (1997) discuss the question of whether Lean principles
can be applied directly or in adapted form to High Variability Low Volume (HVLV) producers.
They observe that it is evident that the type of methods and tools used in such a firm when
attempting to be Lean will depend on the product and its environment. Aircraft producer
McDonald Douglas is reported to implement fundamental principles specifically to their
development and manufacturing arms (Jina et al, 1997). James-Moore and Gibbons (1997)
refer to these as Super Value Goods (SVG) and investigate an aircraft manufacturer. They
conclude that the general Lean principles have distinct applicability in a SVG industry but that
only some 65 % is used. They also conclude that certain areas of SVG industries need to adapt
those Lean principles, or adopt fundamentally different approaches.
The specific research into HVLV or SVG goods points towards the question whether
production and variability of product are drivers for different Lean principles, tools and
implementations. The definitions of high and low volume and high and low variability would
need expanding before some clarity could be created. It is however not in the scope of this
inquiry to develop a model for goods categories based on volume and variability (e.g. figure 2-
20). Such an exercise would immediately result in more and different categorisations, e.g.
relating to the physical or service aspect of the product.
High Volume Low Volume
High Variability Clothing retailing Advertising, custom engineering, ship, design-and-built house
Low Variability Stationary, e.g. paperclips, grocery items
Power poles, car trailers
FIGURE 2 -2 0 : HIGH AND LOW VARIABI LITY VERSUS HIGH AND LOW VOLUME.

Page 81 of 372
2.3.6.7. SMEs and Lean
In the context of this research, it is relevant to establish if pipfruit organisations must be
related to Lean research in Small and Medium Enterprises (SMEs). SMEs are defined slightly
differently in different parts of the world, but in New Zealand SMEs are defined as enterprises
with fewer than 20 employees (table 2-7). These organisations include micro organisations
and account for an average of approximately 31% of all employment in New Zealand over the
past ten years (SMEs in New Zealand, 2011). European SMEs are taken to include ‘Micro-
Enterprises and Medium sized Enterprises have a maximum number of 250 employees (EU
Commission Recommendation 2003/361/EC).
A problem with the NZ data is that they are taken in February each year and may or may not
include seasonal workers, skewing the SME status of the organisation. Doevendans (2010)
reports that responses to his survey indicate an average of 21 permanent employees and 147
seasonal employees. However, this survey was targeting a segment of each of small, medium
and large companies defined by turnover, and a closer look reveals that 55% of respondents
fall into the NZ SME group, while all respondents fall into the European SME group.
Consequently, SME research is considered to apply to the NZ pipfruit industry.
TABLE 2 -7 : NUMBER, PERCENTAGE, AND CUMULATIVE PERCENTAGE OF ENTERPRISES BY SIZE
IN FEBRUARY 2 0 1 0. ( S OURCE: SMES IN NEW ZEALAND, 2 01 1).
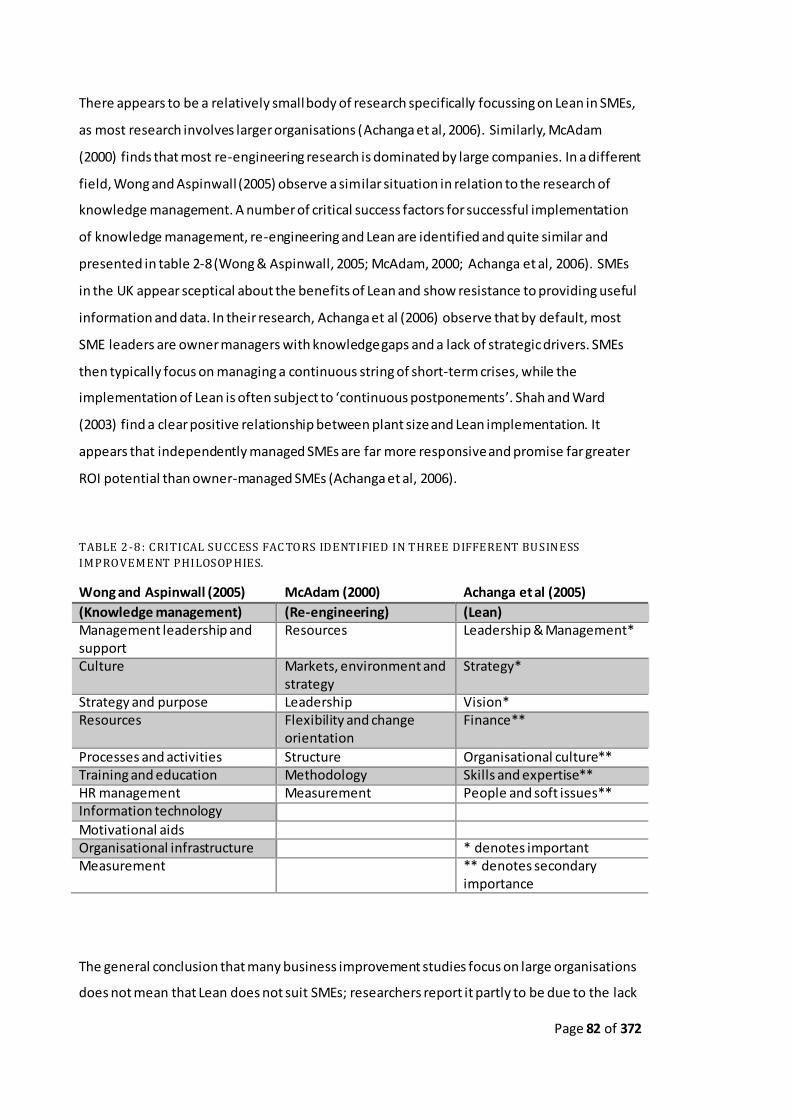
Page 82 of 372
There appears to be a relatively small body of research specifically focussing on Lean in SMEs,
as most research involves larger organisations (Achanga et al, 2006). Similarly, McAdam
(2000) finds that most re-engineering research is dominated by large companies. In a different
field, Wong and Aspinwall (2005) observe a similar situation in relation to the research of
knowledge management. A number of critical success factors for successful implementation
of knowledge management, re-engineering and Lean are identified and quite similar and
presented in table 2-8 (Wong & Aspinwall, 2005; McAdam, 2000; Achanga et al, 2006). SMEs
in the UK appear sceptical about the benefits of Lean and show resistance to providing useful
information and data. In their research, Achanga et al (2006) observe that by default, most
SME leaders are owner managers with knowledge gaps and a lack of strategic drivers. SMEs
then typically focus on managing a continuous string of short-term crises, while the
implementation of Lean is often subject to ‘continuous postponements’. Shah and Ward
(2003) find a clear positive relationship between plant size and Lean implementation. It
appears that independently managed SMEs are far more responsive and promise far greater
ROI potential than owner-managed SMEs (Achanga et al, 2006).
TABLE 2 -8 : CRITICAL SUCCESS FAC TORS IDENTIFIED IN THREE DIFFERENT BUSINESS
IMPROVEMENT PHILOSOP HIES.
Wong and Aspinwall (2005) McAdam (2000) Achanga et al (2005)
(Knowledge management) (Re-engineering) (Lean) Management leadership and support
Resources Leadership & Management*
Culture Markets, environment and strategy
Strategy*
Strategy and purpose Leadership Vision* Resources Flexibility and change
orientation Finance**
Processes and activities Structure Organisational culture** Training and education Methodology Skills and expertise** HR management Measurement People and soft issues** Information technology
Motivational aids Organisational infrastructure * denotes important Measurement ** denotes secondary
importance
The general conclusion that many business improvement studies focus on large organisations
does not mean that Lean does not suit SMEs; researchers report it partly to be due to the lack

Page 83 of 372
of available resources within SMEs. Lean may be different for SMEs, but the Lean philosophy is
equally relevant to small organisations, particularly considering the percentage of the
economy they represent.
2.3.7. Assessing Lean in organisations
An intriguing issue arises when we start to examine assessment of the Lean state of
organisations. Traditionally, assessment in business is aimed at standardisation (e.g.
engineering) and performance (e.g. operations and finance). Drucker has been quoted to say
that ‘If you can’t measure it, you can’t manage it’ (Hesselberth, 2008). Perhaps atypical and in
contrast Deming, cited in Graff (1991) states that "It is nonsense to say that if you can’t
measure it, you can’t manage it". Deming quotes an example of productivity measurement
and makes the case that productivity measurement does not improve productivity (Deming,
1986). This appears quite contrary to his philosophy of measurement. Deming was after all a
statistician and promoted statistics to improve quality and performance (Deming, 1975). The
apparent contradiction does not devaluate Deming’s statements to the scholars of his work
and are quite reconcilable.
A brief preamble on the use of the words ‘measurement’, ‘assessment’ and ‘evaluation’ may
clarify the use during this brief discourse. It is accepted that ‘measurement’ is often but not
exclusively used in an accounting context, where ‘assessment’ and ‘evaluation’ are more often
used as an appraisal of non-financial indicators. For the purpose of this section, this common
use is mostly maintained, however there may be some cross-over between the terms where
they relate better to original texts or appear more appropriate.
In the true Lean philosophy it may not be important to assess how Lean the organisation is as
long as it continues to improve the system and its processes to create value for the customer.
In reality however, business managers like to know where they are. Neely provides ample
reason for performance measurement (1999) in a rapidly changing world. Evaluation of Lean
and indeed, if a company measures as Lean, is no guarantee that the business performs. There
may be correlational and even causal effects that need addressing. Bourne et al (2000) and
Kaplan and Norton (1998) assert that measurement results serve as a tool to assist refocusing
on the organisation’s strategy. The principle for performance measurement should be based

Page 84 of 372
on the philosophy that improvements in non-financial measures drive financial performance,
while financial performance indicators are ‘lag’ indicators, reporting on the past (Kaplan and
Norton, 2001).
A simple truth is that businesses generally tend to assess the annual or quarterly bottom line,
and that is quite harmful to Lean transformation (Maskell and Kennedy, 2007). Maskell and
Kennedy (2007, p63) quote Fiume and Cunningham, both CFOs of effective lean
manufacturers, who state that
“The average recipient of a standard cost-based profit and loss statement does
not understand the document in his hands. It communicates nothing. Worse
still, for those few that do understand it, these statements fail to give
meaningful information about what is really happening in the operation.”
The reasons for the failure of conventional measurement are exquisitely summarised by
Bhasin (2008). Because financial statements tell the story too late, we need to address Lean
measurement. Lean assessment intends to give regular information on what is really
happening. Mahidhar (1998) emphasises the importance of properly designed measurements
to support Lean enterprise transformation.
A number of philosophies and tools have been developed over the years. Bhasin (2008)
believes that organisations must adopt more holistic performance assessment systems as
Lean benefits are not always obvious. He looks at several different assessment systems and
combines these into a Dynamic Multi-Dimensional Performance (DMP) model which considers
success dimensions and balanced scorecard dimensions in four different time perspectives
from very short term to very long term. He follows this up with a table representing both
technical and cultural elements (Bhasin, 2008), without transforming the table into an actual
tool. Shah and Ward (2007) develop a multi-dimensional model of Lean, using three
underlying constructs (supplier related, customer related and internally related) as main
groups for a restricted number of defined Lean elements. They too develop a model but do
not transform it into a usable instrument.
For organisations that are adopting the Lean paradigm, it is important to have regular
indications of being on the right track. It would be futile to wait for the end-of-year financial

Page 85 of 372
performance or even regular financial performance numbers. These organisations need
assessment methods that are readily observable and can be made visual on very short terms
to affect employees’ behaviour. Although non-financial measures are difficult to establish
(Allio, 2006, in Bhasin, 2008) and there is a lack of established and validated instruments for
measuring ‘leanness’ within an organisation (Grigg et al, 2010) , there are several useful
instruments to assist the organisation.
Kobayashi developed ‘20 Keys to Workplace Improvement’ (1995) which combines twenty
inter-related areas that impact quality and costs for organisations and provides descriptive
and five-point rateable steps within each of the 20 keys. The keys are based on his ‘Practical
Program of Revolutions in Factories’ (PPORF) and the book itself provides useful
recommendations to move from one level within a key to the next. Although the 20 keys have
been designed as very practical steps, Kobayashi emphasises the need for a broader base and
commitment within the whole organisation. An example of the model is found in figure 2-21,
while Appendix 4 provides a relational summary of all 20 keys.
CHECKSHEET: KEY 1: CLEANING & ORGANISING TO MAKE WORK EASY
No. Category Level Evaluation Criteria Judgement Calls / 1 Putting away
unneeded items
2
No unneeded items lying around. There are no cigarette butts, pieces of scrap paper, tools, files, machines, materials and parts that are not used for months or years.
2 Floor cleaning Cleaning equipment is stored neatly / everything has its place.
Cleaning tools are stored near the shop floor. Brooms are hung properly so that the edges are not touching the
floor. 3 There is no garbage, dirt or paper on the floor.
There is no danger of slipping and no trash in floor wells.
The floor is clean of iron scraps, water and oil so that the operators do not have to walk in the dirty areas. There is no danger of slipping.
4 Display boards No outdated, torn, or soiled announcements are displayed. Papers are straight and neat. There are no torn corners or tape marks left over from old displays.
There are no outdated, torn or soiled announcements on the display board. All announcements are clearly displayed.
5 Emergency access
Nothing is obstructing the access to fire extinguishers and water hoses. Nothing is in front of emergency exits or corridors. Location and use of switches and breakers are posted. Zebra marks are painted on safety risk areas.
Nothing obstructs access to fire extinguishers, water hoses, emergency exits, walkways and crossings. Fire extinguishers can be seen from 20 metres away. Use of switches and breakers are indicated. There are no foreign objects in electrical switchboards, ashtrays or garbage cans.
6 Items on the floor
Work-in-process and tools are not placed directly on the floor.
Operators do not have to bend over to load up materials on the cart to go to the next operation.
Large materials are placed on pallets.
FIGURE 2 -2 1 : SAMPLE OF K OBAYASHI K EY WITH LEVEL AND JUDGEMENT CRITERIA

Page 86 of 372
Another useful instrument was designed by Tapping Luyster and Shuker (2002). They created
ten groups, much like Kobayashi, and provided descriptive criteria which are scored on a 5
point (0 to 4) scale. An example of commercial application of the scale is found in figure 2-22,
while the ten groups can be seen in summary table 2-9. Figure 2-23 shows an example from
the CD accompanying their book on value stream management.
FIGURE 2 -2 2 : EXAMPLE OF LEAN ASSE SSMENT BY TAPPING, LU YSTER AND SHUKER, 2 002 .
FIGURE 2 -2 3 : TAPPING ET AL ( 20 02) REVIEWED LEAN ASSESSMENT EXAMPLE (SIC.).

Page 87 of 372
Another Lean assessment tool was initially developed by MIT and the Warwick Manufacturing
Group under auspices of the UK and US Aerospace Initiatives (Nightingale & Mize, 2002). The
tool is primarily aimed at organisations intending to transform to a Lean organisation and can
be used as a guide and assessment simultaneously. Although comprehensive, the tool appears
complicated to use for smaller organisations that do not have dedicated specialists to
administer the tool (figure 2-24).
FIGURE 2 -2 4 : LESAT LEAN ASSESSMENT TOOL DEVELOPED BY MIT AND LAI (P7).
The Manufacturers’ section of Business New Zealand has a web-based programme called
‘Leanstep’ (http://www.leanstep.org.nz/) that can be used by operators to complete a Lean
self-assessment. The instrument (figure 2-25) is simple to use and automatically generates
reports such as the score per section, a graphical presentation of the results and a list of
recommended improvements.

Page 88 of 372
FIGURE 2 -2 5 : MANUFACTURING NZ'S LEANSTEP PROGRAMME.
Summarising, there are a number of Lean assessment tools available. Organisations that
intend to transform to a Lean paradigm may have to make an arbitrary decision to select an
instrument that can be understood and used by non-specialists or have restricted time
available. Although the Manufacturing NZ’s assessment is simplest in form, it does not point in
any specific direction until completed. For that reason and because of its simple form, this
research project considers that the first version of the Tapping et al Lean assessme nt form
would be useful for starting converts.

Page 89 of 372
TABLE 2 -9 : COMPARING LEAN ASSES SMENT CRITERIA.

Page 90 of 372
2.3.8. Lean in other industries and areas: Several examples
While Lean was mostly restricted to the operational manufacturing area in early 2000s, Lean
has since extended to other disciplines such as economics (e.g. Stone, 2012), human resources
(e.g. Holton, 2003), product development (e.g. Womack et al, 1990; Holweg, 2007), marketing
and sales (e.g. Piercy and Morgan, 1997), service (e.g. Arbos, 2002; Seddon and Caulkin,
2007), construction (e.g. Jørgensen and Emmitt, 2008), health (e.g. Joosten et al, 2009;
Aronsson et al, 2011), IT (e.g. Staats et al, 2011), government (e.g. Seddon and Brand, 2008;
Krings et al, 2006), supply chain (e.g. Holweg and Pil, 2001; Aronsson et al, 2011), aerospace
(e.g. Financial Post, 1999) and accounting (e.g. Hines et al, 2004). Lean as a concept had
evolved significantly since its origins with the older concepts around shop-floor improvement
in the car industry (Hines et al, 2004).
It is relevant to look at implementations of Lean in other industries and areas. For the purpose
of this paper, not all industries and areas can be discussed, but some selected elaborations
may further clarify the context within which the inquiry takes place.
2.3.8.1. Lean in the health industry
Hines et al report that research into Lean for the public sector is still in its infancy (2008). The
public health services can be considered part of the wider public services and offers numerous
studies and articles on implementation of Lean. These range from Lean in emergency
departments (e.g. Dickson et al, 2009), histological laboratories (Buesa, 2009), healthcare
(Radnor et al, 2012) and more. Lean healthcare emerges more frequently in articles in recent
years. Generally, health care has been under scrutiny across the world, and it appears that
health sectors understand that they must deliver more of a quality product while budgets are
restricted. This also supposes that implementation of Lean is partly in response to potential
crisis; possibly not the best reason to look at improving your organisation.
In all healthcare, there are two critical deviations from the assumptions in Lean: The customer
is the institute commissioning the health care facility, and healthcare is capacity led instead of
demand led (Radnor et al, 2012). The differentiation between the paying customer (e.g. the
government) and the consumer (the patient) must bring with it the inference that the
customer knows what is best for the consumer. This can be likened to the confounding

Page 91 of 372
relationship between exporter, packhouse and grower in terms of information flow,
ownership and product flow in the pipfruit industry. Radnor et al (2012) also consider the
traditional seven wastes and translate these into a health care environment in an attempt to
‘Lean up’ health care. They conclude that if these deviations from Lean suppositions are not
addressed, they could severely impact on the implementation effect of Lean in the industry.
Laboratories are also service providers. Buesa (2009) looks at adapting Lean for use in
histology laboratories. She describes the process and identifies the work flow as one of the
areas where improvements can be made, including re-arrangement of instruments.
Simultaneously, she recognises that not all Lean principles can be applied per se. In her view,
laboratories that have 20,000 or more tasks benefit more from her approach. The repetition
of small improvements in the process flows in laboratories can improve the organisations, but
do not necessarily make these Lean.
Dickson et al (2009) focussed on Lean implementation involving front line staff after a process
of education, Emergency Department (ED) observation, patient flow analysis, process
redesign, new process testing, and full implementation. Value Stream assessments visualised
processes and waste. Dickson et al report that the changes made were not special but made
good sense. Changes included visuals (improved signage), alignment of processes avoiding
duplication, re-defined job descriptions, early involvement of laboratory tests, X-rays and
other services. Staff accepted changes readily because the proposed changes came from staff;
Dickson et al (2009) indicate that staff were involved and empowered. Comparison of value
based and operational data before implementation with post-implementation data from
2006, resulted in improved patient satisfaction despite a 9.23% increase in patients (37,000
patients).
Lean theory is assessed by Joosten et al (2009), who adopt a more careful approach in that
they believe that a 100% positive message is not correct, and that Lean depends on a variety
of issues surrounding the health sector. Improvements are mostly operational and not socio-
technical. They clearly indicate that managers should focus on developing and improving their
workforce—creating synergies that lead to otherwise impossible results—not on making the
improvements themselves.
Kim et al (2006) report a number of successes and also tabulate some of the challenges for the
health industry in two categories: Culture and practical. Cultural elements include a silo

Page 92 of 372
mentality, a fear for lay-offs, and the argument that people are not cars. In their view, health
care shares the challenge of producing high-quality products (clinical outcomes) within an
environment of restricted resources, while managing a complex business operation and
maintaining the safety and satisfaction of workers and customers with manufacturing.
A number of studies have been completed in healthcare. It appears that reports are mostly
project based. There is little mention of boards endorsing or positively promoting Lean other
than on projects basis. This may be a useful approach as it at least generates success stories
that may be replicated elsewhere, leading to step-wise improvement of the healthcare
system. It may be too early to expect sustained Lean results in the healthcare industry.
2.3.8.2. Lean in accounting
Accounting can be seen both as a service industry as well as a professional activity. This
section approaches accounting mostly from the professional point of view, however it clearly
impacts on the state of accounting as a service industry whilst organisations opt for Lean
change.
It is commonly accepted today that the way in which companies work and produce results for
their customers has changed more rapidly in recent years than ever before as a result of how
the world is changing (e.g. Friedman, 2005; Womack and Jones, 2009). Theories such as agile
(e.g. Mason-Jones et al, 2000) and time-based pacing (Eisenhardt, 1998) are built for the fact
that environments change rapidly and organisations need to keep up. It should therefore not
be surprising that traditional accounting systems developed in different times should change
with the current times and demands (Kennedy & Brewer, 2006). In his seminal work called
‘Relevance lost: The rise and fall of management accounting’, Johnson (1991) finds that
accounting practices well established in the early 1900’s need revising because they were no
longer relevant to the way businesses were run in the 1990’s. Kaplan was also quite critical of
traditional accounting and in an attempt to provide a more holistic view, added several
dimensions to the financial perspective including customer, internal business processes and
innovation and learning (Kaplan and Norton, 1998).
Accounting can be understood to denote the reporting on financial performance of an
organisation, or the reporting on management control systems; two different interpretations
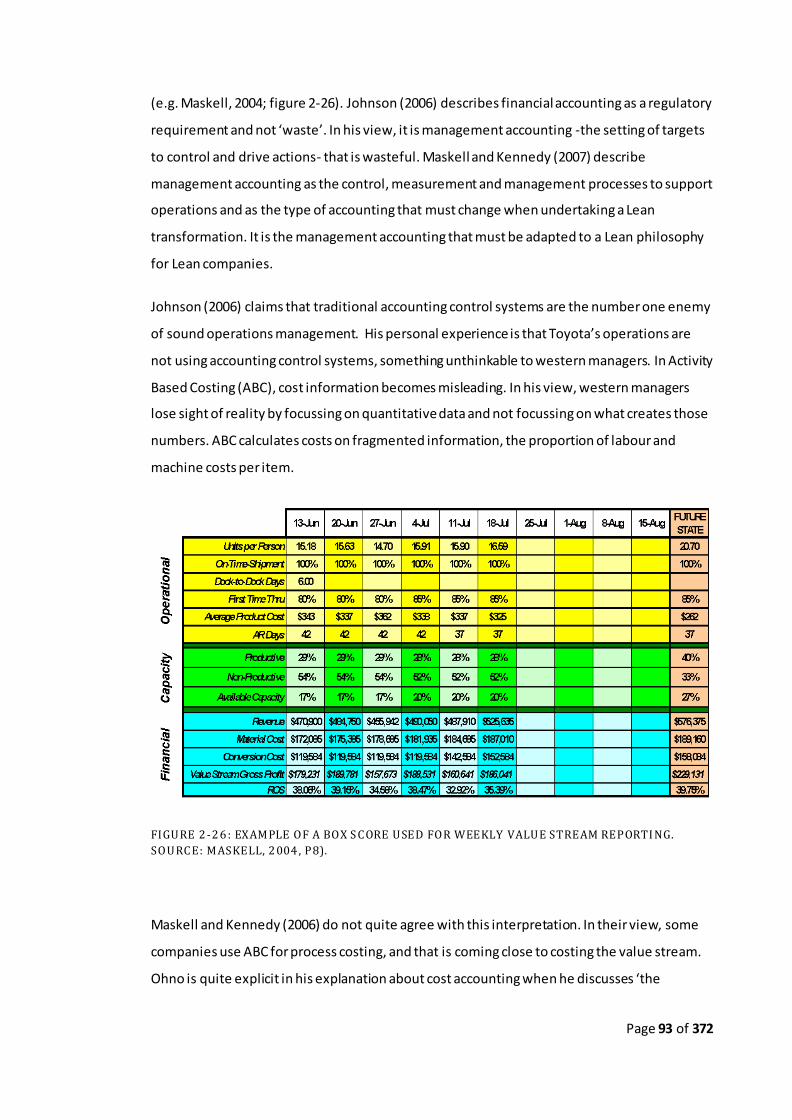
Page 93 of 372
(e.g. Maskell, 2004; figure 2-26). Johnson (2006) describes financial accounting as a regulatory
requirement and not ‘waste’. In his view, it is management accounting -the setting of targets
to control and drive actions- that is wasteful. Maskell and Kennedy (2007) describe
management accounting as the control, measurement and management processes to support
operations and as the type of accounting that must change when undertaking a Lean
transformation. It is the management accounting that must be adapted to a Lean philosophy
for Lean companies.
Johnson (2006) claims that traditional accounting control systems are the number one enemy
of sound operations management. His personal experience is that Toyota’s operations are
not using accounting control systems, something unthinkable to western managers. In Activity
Based Costing (ABC), cost information becomes misleading. In his view, western managers
lose sight of reality by focussing on quantitative data and not focussing on what creates those
numbers. ABC calculates costs on fragmented information, the proportion of labour and
machine costs per item.
FIGURE 2 -2 6 : EXAMPLE OF A BOX S CORE USED FOR WEEKLY VALUE STREAM REPORTI NG.
SOURCE: MASKELL, 2 004 , P8).
Maskell and Kennedy (2006) do not quite agree with this interpretation. In their view, some
companies use ABC for process costing, and that is coming close to costing the value stream.
Ohno is quite explicit in his explanation about cost accounting when he discusses ‘the

Page 94 of 372
misconception that mass production is cheaper’ (Ohno, 2013). He condemns cost calculations
based on isolated thinking. Maskell (2013) tables a number of these, including labour
efficiency, machine utilisation, purchase price variance and overhead absorption variance. He
argues firmly that the focus of Lean accounting must be on the value stream. Kennedy and
Brewer (2006) agree; in their view, decision making is assisted by analysing the effect of the
proposed changes on the profitability of the value stream as a whole, not the individual
products.
Kennedy and Brewer (2006) present the view that traditional accounting was designed to
support mass production type management with top-down command and control, a
departmental cost approach and a focus on shareholder value. When the philosophy changes
away from mass production, they believe that the accounting has to change as well. They
argue that traditional accounting systems can create organisational behaviours and attitudes
that are not synchronised with Lean thinking, a parallel to Emiliani’s ‘fat behaviours’. Emiliani
(1998) believes that increased competition during the late 20th century has led to a fixation on
data and performance measurements, resulting in a neglecting of ‘lean behaviours’,
behaviours that promote flow between people. Johnson and Kaplan (1987) in Ezzamel et al,
1990) and Grasso (2006) believe that management accounting lost relevance because of the
increased competition and fast economic changes in the late twentieth century. It is clear
then that Lean transformation requires a management accounting transformation.
A number of observations point at resistance to change from traditional management
accounting. Grasso (2006) argues that resistance to Lean accounting is primarily caused by
resistance to management system change. He goes as far as stating that management
accounting is still a barrier to implementing Lean. Bhasin (2008) finds that a new philosophy
will fail without an effective change management policy. Resistance to change is common
(Kotter, 1995). Most managers do not realise that change involves a process. So what is that
change that is required?

Page 95 of 372
FIGURE 2 -2 7 : PRINCIPLES, PRACTI CES & TOOLS OF LEAN ACCOUNTING ( SOURCE: MAS KELL &
BAGGALEY, 2 0 0 6 , P37 ).
Lean accounting is strongly based on the value stream as part of Womack and Jones’ (2003)
five Lean principles. Kennedy and Brewer (2006) state e.g. that performance to budget is a
traditional metric while performing to customer demand is the lean metric. Similarly,
traditional management oversees people, based on information provided to those managers,
while Lean accounting manages processes by providing real -time information to the people
who manage the processes. This is expressed in techniques such as Visual performance
measurement, continuous improvement, value stream costing and target costing (Maskell and

Page 96 of 372
Baggaley, 2006). Maskell & Baggaley (2006) offer a clear and concise table (figure 2-27),
setting out what entails Lean accounting in their view.
From the above, it is clear that a number of writers are critical about traditional management
accounting, especially where companies have decided to transform to the Lean paradigm. This
necessary transformation has consequences for both the accounting service industry as well
as the accounting profession, as both have to move with the times and be prepared to
present a different form of management accounting to their customers. This new professional
accounting requirement, combined with the described difficulty of adapting to change in type
of management accounting may well present a hindrance to those companies that embark on
a Lean transformation journey. They are nevertheless essential in promulgating Lean in
transforming organisations, including horticultural and pipfruit organisations.
2.3.8.3. Lean marketing and supply chain
Although marketing and sales are not per se a separate industry, there appears to be a
relatively important development that affects other industries implementing Lean, including
the horticultural sector. The two areas have been treated as separate entities for too long and
the interface between marketing and manufacturing has been discussed by a number of
researchers. Hausman et al (2002) conclude that inter-functional harmony appears to have a
strong influence on either section’s morale. Piercy and Morgan (1997) believe that marketing
has reacted poorly to new paradigms such as supply chain management, TQM and BPR and
that there is urgency required to address responsiveness to Lean thinking. They believe that
marketing will be subjected to a major test by the introduction of Lean thinking, including
Lean supply chains.
Both in the US and the UK, main supermarket supply chains participated in the Efficient
Consumer Response (ECR) programmes which apply Lean supply chain principles to the retail
business. This was the result of a number of conditions, including complex invoicing systems
to deal with complex deals; unacceptable high levels of damaged and unsalable goods;
excessive inventories and others. Claims are that between 5 and 6% of the costs can be taken
out of the supply chain using ECR strategies (Piercy and Morgan, 1997). The adoption of Lean
in marketing and sales and the wider supply chain is proposed to improve the competitive
position of that supply chain.

Page 97 of 372
In the past, there have been similar claims to improved efficiencies through paradigms such as
TQM (e.g. Deming 1986), BPR (e.g. Hammer and Champy 1993) and JIT (O'Neal 1989), all
suggesting that the elimination of unproductive waste and resources in organisations are the
basis for sustained competitive advantage. Lean authors propose the logic that the retailer
should collaborate with suppliers to produce the products required by customers and that the
retailer should remove waste by collaboration with suppliers to create the products necessary
to keep customers satisfied, based on purchase data collected at retail level (Piercy and
Morgan, 1997).
Dewell (2007) observes a shift from focus on individual IT systems to enterprise wide views of
marketing function and associated processes. He defines Lean marketing as
‘a systematic continuous improvement process that will eliminate waste and
inefficient processes, speed up production cycles and increase the professionalism of
the people in every aspect of marketing. The emphasis is on process with supporting
technology instead of technology led improvement.’ (p24).
He believes that Lean marketing is only just emerging (Dewell, 2007).
If marketing consist of the four ‘Ps’ (Product, Packaging, Price and Promotion), it is almost
inescapable to look at the supply chain. Vargo and Lusch (2004) argue that marketing is no
longer restricted to the 4 Ps, but argue that the focus has shifted from tangible resources,
embedded value and transactions (goods-centred model of exchange) to intangible resources,
value co-creation and relationships (service-centred model of exchange). Service provision
rather than goods is fundamental to economic exchange; it is customer focussed and market
driven (Vargo & Lusch, 2004). In their view, the shift moves from the provision of goods to the
provision of the competency or value of the goods.
Piercy and Rich (2004) argue production efficiency alone is not enough to arm the
organisation with tools needed to differentiate its business from its competitors at times
when supply chain management has developed organisationally to ‘come of age’ and
traditional marketing is in ‘mid-life crisis’. In a time when traditional marketing is losing
corporate influence, there are opportunities to bring together the successful qualities of
marketing and operations approaches to form innovative, organisation-wide approaches to
value chain management. They argue that the positive comparison between Lean and
traditional manufacturing stimulated interest in copying the Lean model over and above the

Page 98 of 372
technical contingencies of car production and in moving the model from East to West. Piercy
and Rich (2004) also maintain that there is a vacuum between operational management and
meaningful marketing involvement during the design of the Lean business system. They point
toward the SERVQUAL instrument (Zeithaml et al, 1990) as identifying key dimensions of
service that far exceed the lean definition of quality. They give an excellent example through
James Womack who mentioned becoming a ‘lean realist’ when, after leaning up his custom-
made bike factory, the custom made bikes could be produced inside two days, severely
affecting the value perception of the customer.
They propose to take the superior aspects of marketing (i.e., customer analysis,
understanding) and the superior aspects of the lean enterprise (i.e., process-quality
improvement) and form a lean value chain which promises organisations a substantially
superior position in terms of the marketplace. They go on to produce a list of marketing and
production issues and combine these into general Lean solutions in eight areas varying from
capacity planning and long term forecasting to after-service.
FIGURE 2 -2 8 : PROCESS SWAPS TO FACILITATE BUI LT-TO-ORDER.
As the process was…..
Process after first swap
Final Process Flow
Page 99 of 372
Sharma and LaPlaca (2005) propose a shift from the traditional business sequence to a more -
Lean concept in a Build-to-order (BTO) approach (Figure 2-28). They propose to build as a last
process and move design and marketing forward. Such a move should improve both customer
loyalty and marketing efficiency. Like others, they argue that future companies will thrive if
they have an intimate understanding of their customers. The practice of BTO has little
relevance to the inquiry at hand, however the marketing and supply chain section
demonstrates that there are many sides to Lean, all of which deserve consideration when
adapting the current system to a new environment.
2.3.8.4. Lean and the Process Industry
King (2009) finds that the one area where Lean is lagging behind in being applied is the
process industries. This group includes consumer goods, food and beverage, canned foods,
frozen foods, pulp and paper, plastics, chemicals and so on. King quotes others who believe
that there is constant flow in these areas or that Lean simply does not fit—that process
industry processes are too different from manufacturing and assembly.
King’s work is not academic; his reference section spans 1 ½ pages and offers some of the
traditional works. Nevertheless, his work at DuPont gave him a long period of experience in
world class manufacturing and knowledge of process industries, and he writes with
practitioner’s authority on the subject.
King quotes as the basis for his findings the five principles espoused by Womack et al (1990)
and Ohno in saying that the basis for TPS is the absolute elimination of waste and the two
pillars of the house are JIT and autonomation. He goes on to describe fourteen tools and later
in his work he describes how these tools may work in the process industry. In his view,
manufacturers produce parts and components, while process industries are characterised by
processes including mixing, blending, extrusion, baking and so on. Umble and Srikanth (1995)
differentiate four process groups in manufacturing:
1. Basic producers use natural resources as inputs and process these into products used
as inputs by other segments;
2. Converters transform materials into end goods or end items;

Page 100 of 372
3. Fabricators produce consumer goods or parts or components for assembl ers;
4. Assemblers combine parts and components to produce finished goods.
Although the differentiation makes sense, it does not quite describe primary production
where the natural resources are the inputs.
King believes that there is a significant lack of l iterature on application of Lean in process
industries and this may be one of the reasons why people may assume that Lean does not
apply (King, 2009). He covers several distinguishing characteristics of process industries in
order to understand the application of Lean better. These include:
High volume, variety and variability
Capital intensive versus labour intensive
Throughput limitation through equipment rather than people
Large and difficult to relocate equipment
Processes are difficult to start and stop
Product changeover issues are complex
Finished product inventory versus WIP
Hidden WIP
Material flow processes converge versus diverging in processing plants
King largely follows the standard Lean theory and tries to link process industry features to the
Lean theory. He takes e.g. the seven wastes and describes what these would look like in the
process industry. King also introduces a section describing Lean tools that may need a
different approach. These include bottlenecks (caused by equipment in the process industry
and by people in manufacturing) for which he recommends the Theory of Constraints
approach (Goldratt and Cox, 1986). Using virtual work cells for cellular manufacturing, using
product wheels instead of Heijunka cells for planning, postponement combined with Finish-to-
Order. He refers to ‘A’ and ‘V’ type processes where the ‘A’ type process typically is assembly
or conversion of parts and ‘V’ type is the reverse, a typical divergence of raw product. This is
representative of a packhouse situation. Packhouse processes include divergence and
assembly, and there are differentiation points which become critical because incorrect
decision making results in unwanted product and thus waste (King, 2009).

Page 101 of 372
Melton (2005) discusses Lean in the process industries. He summarises the Lean domain by
trying to highlight the most salient components. Melton too tries to capture Lean components
and give process industry examples, e.g. the seven wastes and a Lean toolkit. He continues
with a small case study, highlighting a value stream process. His paper, presented at the 7th
World Congress of Chemical Engineering, is more a summarised account of how lean could be
implemented and the theoretical advantages. It has little significance for horticultural
industries.
Pool et al (2011) differentiate between lean in discrete manufacturing and semi-process
industry as caused by the resource characteristics of each. They believe that in most semi -
process industries there is a transformation point where process production turns into
discrete manufacturing. Downstream of the transformation point, Lean can be implemented
in a straightforward way, but upstream requires a more liberal interpretation. The case study
concerns a Sara Lee plant redesign where both process production and discrete production
take place. A cyclic scheduling process is designed, improving production regularity, simpler
planning, apparent yield, quality and energy-use numbers.
Mahapatra and Mohanty (2007) discuss why Lean has not been implemented more than it is
around Mumbai and Eastern India. They differentiate between continuous process (CM)
industries and discrete manufacturing industries (DM). They produce tables showing different
ratings by DM and CM organisations for various tools. They produce tabl es showing the
impact of various tools on maintenance, production, quality, materials and inventory and
product and process design with production and quality being affected the most positive.
Unfortunately the selection of participants is not discussed. It appears that a survey has been
responded to by Lean manufacturers while the introduction states that there is a low level of
acceptance.
Abdulmalek and Rajgopal (2007) describe how lean, particularly value stream mapping was
implemented in an integrated steel mill. They also describe that there are few applications in
the process industry. They used simulation to convince managers of gains to be made and
indicate that this is a useful tool (Abdulmalek & Rajgopal, 2007).
Borbas (2011) produces an article focussing on a Lean change-over project for a bagging
machine in a fresh salad packaging plant. Although the project takes place in a process

Page 102 of 372
environment for a horticultural product, it is primarily a standard Lean change -over
improvement process with positive results.
Xu looks into the Lean and Agile paradigms in a supermarket environment (Xu, 2006). He
argues that Lean and Agile can combine in an effective hybrid approach to the supply chain.
Xu (2006) and Jones & Towill (1999; figure 2-29) focus on the different groups of products and
proposed floating decoupling points in a virtual product pipeline for the various groups of
products. Agile supply relates more to volatile markets with high product variety and short life
cycle, high profit margins and high marketing costs (Mason-Jones et al, 2000).
FIGURE 2 -2 9 : REPRESENTATION OF THE MATERIAL DECOUPLING POINT ( SOURCE: MASON-
JONES & TOWILL, 1 99 9, P17) .
All of these studies relate to the process industry which has not much in common with the
pipfruit industry or the wider horticultural industry. Some interesting questions can be raised
when discussing continuous manufacturing (CM) versus discrete manufacturing (DM). Are
orchards either one or the other? Where do packhouses fit in? It is the researcher’s
contention that orchards are neither CM nor DM. Orchards do not have raw material available
all the time; growth cycles mean that they have variable activities that lead to a short period
of harvesting (production). Packhouses provide a seasonal packing service and coolstores

Page 103 of 372
provide a seasonal coolstore service, and neither can be compared to any form of processing
or manufacturing. This is the approach that will be taken forward into the research section.
2.3.8.5. Lean in the horticultural industry
A variety of articles describes lean in horticultural settings. The Food Chain Centre in the UK’s
vision is ‘to create the most efficient UK food chain supported by the most effective flow of
information’ (www.foodchaincentre.com). Research in partnership with Cardiff Business
School and the industry forum leads to published guides about Lean in the dairy, red meat and
fresh produce industries. The publications are easy to read and aimed at the person in each
industry.
There is no referencing. Some significant claims are made such as the horticultural industry
can save around £400 million annually (Applying Lean Thinking in the Fresh Produce Industry,
2007). Guides discuss waste, Lean principles and pilot cases from which data were taken to
produce the guides. A similar guide describing an apple packhouse claims savings of £28,000
annually by removing a simple wasteful exercise (Saving Money by Better Workplace
Organisation, 2007).
Hines et al (2011b) research contingent approaches to quality based pricing within the agri-
food industry by two parallel case studies (imported canned pineapple and local potatoes) and
note that the industry is typically featuring trading activity and is subject to commodity
TABLE 2 -1 0 : PROPOSED COMPARISON BETWEEN LEAN MANUFACTURING AND LEAN AGRIFOODS
( FROM HINES ET AL, 2 0 11B).

Page 104 of 372
pricing. Three of the four factors identified as hindering intercompany pricing are mitigated by
stabilising input costs, improving supplier Quality, Cost and Delivery (QCD) performance and
encouraging collaborative approaches from a supplier group on the basis of withheld power.
Although the paper has a focus on quality based pricing, Hines et al produce an interesting
table (table 2-10) comparing traditional Lean environments with the agri-food industry
environment, pointing at some of the challenges that agri-food faces when implementing
Lean.
The Value Chain Management Centre of the George Morris Centre in Canada produced a
guide to Food Waste in Canada (Gooch et al, 2010), in which it referred to some Lean
elements, including a table (table 2-11) translating the traditional seven Lean wastes into Food
wastes. The focus was on food waste and not on Lean elements, but Lean features in the
guide as a way of looking at and reducing waste. Gooch et al (2010) produce a cause and
effect fishbone diagram from Cranfield University (figure 2-30) in which they identify a
number of causes of waste in the food chain.
In New Zealand, Scarrow discusses Lean in an orchard context, specifically related to Kiwifruit
in New Zealand (Scarrow, 2010). Scarrow relates Lean to Deming’s ‘ten Kaizen principles’,
believes that the positive productivity shift is caused by continuous improvement as
TABLE 2 -1 1 : GOOCH ET AL ( 201 0, P4) TRANSLATION OF TRADITIONAL WASTE INTO AGRI-
WASTE.

Page 105 of 372
presented by the Deming PDCA cycle, and tables a number of questions relating to choices
made by the orchardist. The focus of his article is on customers, continuous improvements,
openly dealing with problems, creating cross-functional teams and informing and enabling
employees. This is not a robust narrative but rather a scrambled collection of Lean and quality
management maxims with the intention to convince readers that Lean works but without the
benefit of empirical evidence.
A further Canadian research report quantifies customer satisfaction and effectiveness of
current industry practices of the Ontario Pipfruit, stonefruit and grape industries ( Gooch et al,
2009). The study is not specifically focussed on Lean but found that orchard, post-harvest, and
grading/packing practices often negatively impact the quality and value of fruit from
customers’ and consumers’ perspectives. In addition, grower and packer practices in
particular incurred unnecessarily high costs that affect their own and the whole value chain’s
profitability.
FIGURE 2 -3 0 : CRANFIELD UNIVERSITY FOOD WASTE ISHIKAWA DIAGRAM ( GOOCH ET AL, 2 0 10,
P9 ) .
A value chain map shows the process from orchard to customer but levels of waste are not
indicated. Nonetheless, in their approach, they have created a list of recommended actions to

Page 106 of 372
improve the value chain, and linked these to three practitioner considerations:
Implementation difficulty, Cost of implementation and Return on investment. Figure 2-31
shows a section of this table which may be useful from a practitioner’s viewpoint, as it allows
the horticultural operator to make decisions, based on some form of prioritising.
FIGURE 2 -3 1 : APPLE VALUE CHAIN RECOMMENDATIONS FOR ONTARIO. VINELAND RE SEARCH
REPORT, GOOCH ET AL 2 0 09, P15 6).
2.3.9. Core themes within Lean literature
The literature review shows that Lean, as a socio-technical system (Shah and Ward, 2007), is
typified by basic themes. These include characteristics from various definitions from the
literature review, as well as characteristics considered to be critical for successful Lean
implementation. The literature from the review was coded manually, using keywords that link
to Lean, were repetitive, or appeared significant, to create a table of Lean characteristics.
Table 2-12 captures, and broadly groups the identified Lean characteristics into themes,
asking the question ‘what thematic construct captures the differences between Lean and not-
Lean for the identified characteristic?’ The themes range from what Hines determines to be
below the waterline and ‘enabling’ such as leadership, strategy, alignment and engagement
(Hines, 2011a)—similar to the philosophy ‘P’ in Liker’s model—to the more practical system
and process group, including processes, technology, tools and techniques.

Page 107 of 372
TABLE 2 -1 2 : CHARACTERISTICS OF LEAN, GRO UPED IN THEMES AND REFERENCED BY AU THOR
Themes Characteristic Reference:
Environment Changing environment
Hammer (1990); Hormozi (2001); Mason-Jones et a l (2000); Hines et al (2004)
Di fferent environments Radnor et al (2012); Skorstad (1994); Hines and Rich (1997); Powell and
Chi lderhouse (2010); Seddon (2010)
Customers Identify customer value Womack et al (1990); Radnor et al (2012); Sohal & Egglestone (1994); ;
Seddon (2007)
People involvement
People involvement
Active involvement James-Moore & Gibbons (1997); Ohno (2013)
Behaviour Hines et al (2011a); Emiliani (1998)
Change Radnor et al (2006); Pedersen and Huniche (2009) ; Ka l lage (2006)
Communication Pedersen and Huniche (2009); Scherrer-Rathje et al, 2009)
Culture Liker (2004); Krafcik (1988) ; Pedersen and Huniche (2009); Achanga et al (2006)
Defect prevention James-Moore & Gibbons (1997)
Engagement Hines et al (2011a); Ohno (2013)
Flexibility James-Moore & Gibbons (1997); Sohal & Egglestone (1994); Seddon (2007)
Improve continuously Womack et al (1990); Radnor et al (2012); Hines et al (2011a); Sohal & Egglestone (1994); Ohno (2013); Imai (1986); Ohno (1988)
Leadership; management commitment/support
Hines et al (2011a); Liker (2004); Emi liani (2012); Pedersen and Huniche (2009); Scherrer-Rathje et al, 2009); Radnor et al (2006); Achanga et al (2006); Ka l lage (2006)
Multi -skilling James-Moore & Gibbons (1997); Sohal & Egglestone (1994); Krafcik (1988); Achanga et al (2006)
Reduce poor work conditions
Radnor et al (2012)
Respect for people Liker (2004); Sohal & Egglestone (1994); Ohno (2013) ; Bhasin & Burger (2006); Emi liani (2012); Achanga et al (2006)
Root cause problem
solving
James-Moore & Gibbons (1997); Liker (2004); Emiliani (2012); ; Seddon
(2007)
Shared destiny Sohal & Egglestone (1994)
Shop-floor problem solving
Liker (2004); Sohal & Egglestone (1994)
Socio-technical Shah & Ward (2007)
Team-based James-Moore & Gibbons (1997); Sohal & Egglestone (1994); Liker (2004)
Systems and processes
Autonomation Sohal & Egglestone (1994); Liker (2004); Ohno (1988)
Create flow Womack et al (1990); James-Moore & Gibbons (1997); Liker (2004)
El iminate waste Shah & Ward (2007); James-Moore & Gibbons (1997); Radnor et al
(2012); Liker (2004); ; Seddon (2007); Ohno (1988)
Identify Value stream Womack et al (1990)
Integrated Shah & Ward (2007); James-Moore & Gibbons (1997); ; Seddon (2007)
Just-In-Time (JIT) James-Moore & Gibbons (1997); Sohal & Egglestone (1994); Liker (2004);
Ohno (1988)
Process control James-Moore & Gibbons (1997); Radnor et al (2012); Liker (2004); Krafcik (1988); ; Seddon (2007)
Pul l Womack et al (1990); James-Moore & Gibbons (1997)
Reducing variability Shah & Ward (2007); Radnor et al (2012)
Supply/value chain Pettersen (2009); Hines et al (2004); Holweg and Pil, (2001); Piercy and Rich (2004)
System Shah & Ward (2007)
Tools & techniques Hines et al (2011a)
Suppliers James-Moore & Gibbons (1997); Liker (2004); Sohal & Egglestone (1994) ; Bhasin & Burger (2006)
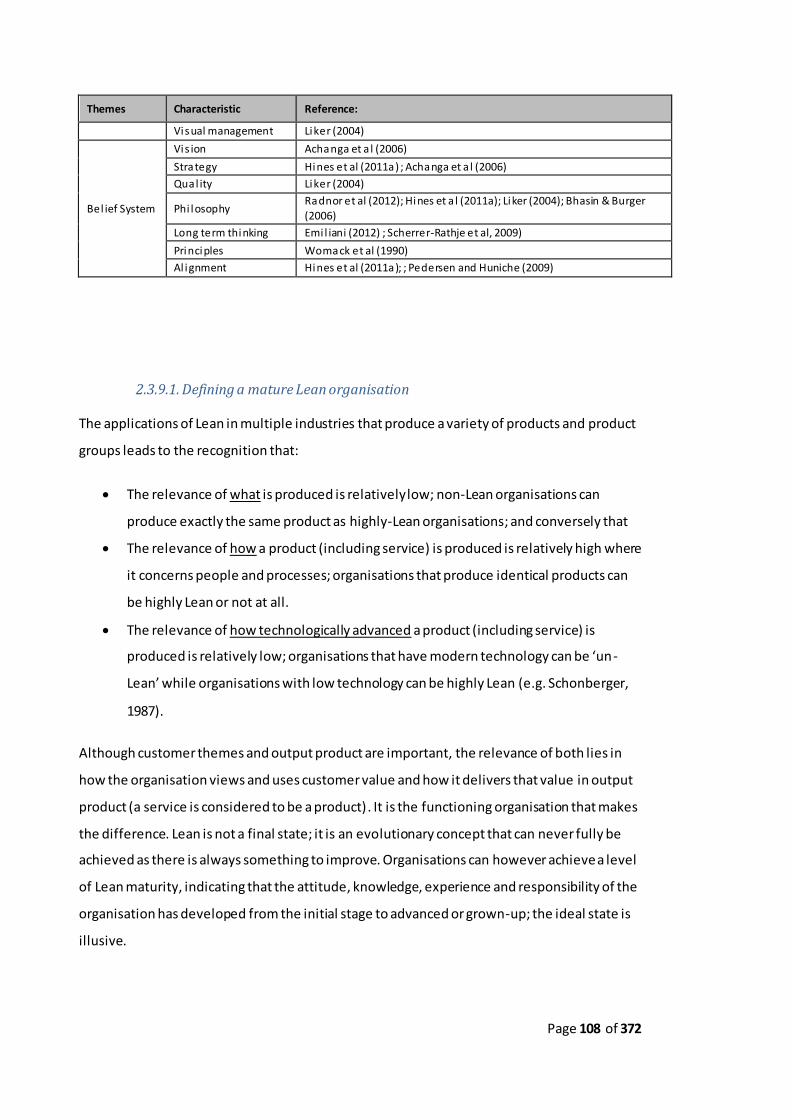
Page 108 of 372
Themes Characteristic Reference:
Visual management Liker (2004)
Bel ief System
Vis ion Achanga et a l (2006)
Strategy Hines et al (2011a) ; Achanga et a l (2006)
Qual ity Liker (2004)
Phi losophy Radnor et al (2012); Hines et a l (2011a); Liker (2004); Bhasin & Burger (2006)
Long term thinking Emi l iani (2012) ; Scherrer-Rathje et al, 2009)
Principles Womack et al (1990)
Al ignment Hines et al (2011a); ; Pedersen and Huniche (2009)
2.3.9.1. Defining a mature Lean organisation
The applications of Lean in multiple industries that produce a variety of products and product
groups leads to the recognition that:
The relevance of what is produced is relatively low; non-Lean organisations can
produce exactly the same product as highly-Lean organisations; and conversely that
The relevance of how a product (including service) is produced is relatively high where
it concerns people and processes; organisations that produce identical products can
be highly Lean or not at all.
The relevance of how technologically advanced a product (including service) is
produced is relatively low; organisations that have modern technology can be ‘un -
Lean’ while organisations with low technology can be highly Lean (e.g. Schonberger,
1987).
Although customer themes and output product are important, the relevance of both lies in
how the organisation views and uses customer value and how it delivers that value in output
product (a service is considered to be a product). It is the functioning organisation that makes
the difference. Lean is not a final state; it is an evolutionary concept that can never fully be
achieved as there is always something to improve. Organisations can however achieve a level
of Lean maturity, indicating that the attitude, knowledge, experience and responsibility of the
organisation has developed from the initial stage to advanced or grown-up; the ideal state is
illusive.

Page 109 of 372
This leads to the extraction of the following definition of a mature Lean organisation as:
Having a holistic, integrated approach to production of goods and/or services,
starting with vision and leadership, and pervading the organisation from top to
bottom and into the supply chain/value stream to achieve common goals in a shared
destiny,
involving and empowering people to continuously improve the processes they are
involved in to eliminate unevenness, overburdening and all other forms of waste to
the customer, endorsing positive change,
creating smooth production flow, substantially based on what needs to be produced
and when, able to absorb variable customer demand,
producing quality products (value) to customer demand,
using the tools they have learned,
and creating an adaptive sustainable culture to continue doing so in an ever-changing
environment.
2.3.9.2. Lean as a viable organisational system
Organisations are conceptually ‘alive’, continuing their existence by interacting with the
environment and continued adaption to their customer requirement e.g. through continuous
improvement in producing customer value; this applies particularly to Lean organisations.
A broad comparison can be drawn with Beer’s
Viable Systems Model (Beer, 1979). The
viable systems model is based on three
interacting constituents, the organisation’s
environment, the organisation’s meta-level
and the organisation’s operational level
(figure 2-32). The system responds to the
environment by having a thinking ‘meta-
system’ (vision, philosophy, principles and
strategy) and an operational system that
‘executes’ (people involved in systems and process execution). The meta-system includes
three different thinking levels that steer the operational activities from hierarchical functions
Meta-Level
Environment
Operational System
FIGURE 2 -3 2 : ESSENCE OF BEER'S VIABLE SYSTEM

Page 110 of 372
of policy (vision and philosophy), below which there is strategy and adaptation/planning
aimed at the outside world and an internal optimisation level (systems and process thinking).
A fourth level communicates from and to the operational (fifth) level. The system is recursive,
meaning that there can be systems within systems, following the same model. Importantly for
the discussion of the model, Beer argues that the meta-system (vision, philosophy, principles
and strategy) belongs inside the operational system, which is surrounded by the environment
(Beer, 1979).
2.3.10. Synthesising a Lean model from the literature
The models from the literature review do not clearly express the lessons learned from the
review. As an example, Krafcik includes machines and material, while it appears that neither
machines nor material impact on how Lean an organisation is. This section attempts to
consolidate the learnings into a different model. Taking the data from the literature review, a
model of Lean can be conceptualised, based on the themes that emerged. The five themes
(i.e. environment, customers, people involvement, systems & processes, belief system)
identified from the literature review each form part of the model. Each interacts with other
parts as follows:
Although not specifically discussed, the changing and different environments influence the
customer to develop a need for a specific product (arrow 1 in figure 2-33). The customer
develops a product ‘value expectation’ (Zeithaml et al, 1990), influenced by the environment
(arrow 2). As with Beer’s model, the elements of the value expectation in figure 2-33 are
pictured separately to show how the elements interact.
In a more real sense, the customer should logically be surrounded by the environment (figure
2-34). The customer is shown with a dotted line to symbolise the accessibility to influences
FIGURE 2 -3 3 : DEVELOPMENT OF CUS TOMER VALUE EXPECTATION
Environment Customer
Product Value
Expectation
1. 2.
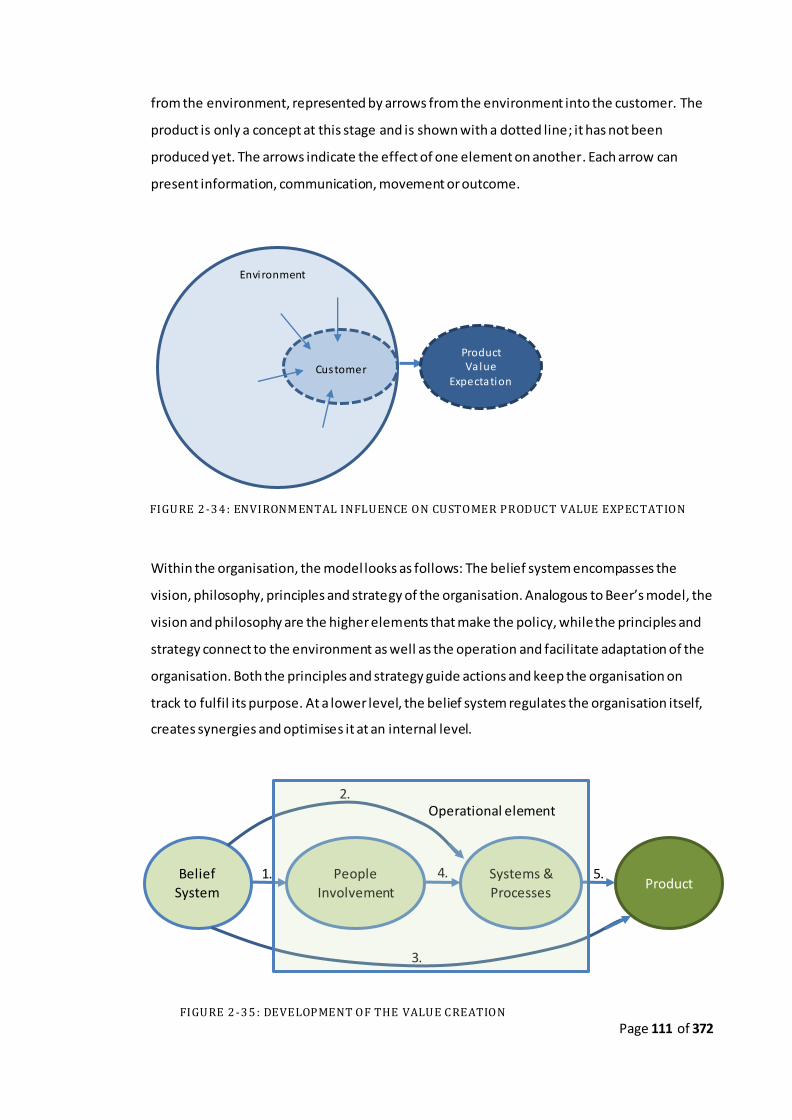
Page 111 of 372
from the environment, represented by arrows from the environment into the customer. The
product is only a concept at this stage and is shown with a dotted line; it has not been
produced yet. The arrows indicate the effect of one element on another. Each arrow can
present information, communication, movement or outcome.
Within the organisation, the model looks as follows: The belief system encompasses the
vision, philosophy, principles and strategy of the organisation. Analogous to Beer’s model, the
vision and philosophy are the higher elements that make the policy, while the principles and
strategy connect to the environment as well as the operation and facilitate adaptation of the
organisation. Both the principles and strategy guide actions and keep the organisation on
track to fulfil its purpose. At a lower level, the belief system regulates the organisation itself,
creates synergies and optimises it at an internal level.
Product Value
Expectation
Environment
Customer
FIGURE 2 -3 4 : ENVIRONMENTAL INFLUENCE ON CUSTOMER PRODUCT VALUE EXPECTATION
FIGURE 2 -3 5 : DEVELOPMENT OF THE VALUE CREATION
5. 4.
3.
2.
1. Belief
System
People
Involvement
Systems &
Processes Product
Operational element

Page 112 of 372
It is the belief system that is critical to the integration of the themes; the people involvement,
systems and processes that produce the product (arrows 1, 2 and 3). The people, systems and
processes form the operational element, the element that creates the product. Within the
operational element, it is the people that create the processes, based on the philosophy and
principles of Lean (arrows 4 and 2). As a result, the product is created (arrow 5). The whole of
this is the organisational value creation (figure 2-35). Themes are pictured separately in figure
2-35 to show how the elements interact.
The materials and machinery have been deliberately omitted from the model as these do not
affect the maturity state of the Lean organisation. The product is drawn with a solid line as
this represents the actual output product; i.e. the value created for the customer. The product
as an outcome, i.e. the value creation, is significantly influenced by the Lean belief system that
influences the people involvement and the systems & processes that produce the product.
Here too, the arrows indicate the effect of one element on another. Each arrow can present
information, communication, movement or outcome. The belief system pervades the
organisation in that it enables the people involvement, focusses on systems and processes
and their improvement and drives towards a product outcome that matches the customer
expectation as in figure 2-35. In a more real sense, the people involvement and systems and
processes should logically be surrounded by the belief system (figure 2-36) and are pictured as
FIGURE 2 -3 6 : BELIEF SYSTEM AFFE CTS PEOPLE INVOLVEME NT AND SYSTEMS AND PROCESSES
Belief System
People
Involvement
Systems &
Processes
Product

Page 113 of 372
dotted lines to symbolise the effect of the pervasive belief system. The belief system is
pictured as a larger font to indicate its relevance to the Lean organisation.
2.3.10.1. Integrating the value expectation and the value creation
Integrating the customer value expectation and the organisational value creation then leads
to the following conceptual model of Lean (figure 2-37). In figure 2-37, the environment
influences the customer who develops a product need and expectation—the value
expectation (in dark blue with dotted blue outline).
The organisations’ belief system pervades the people involvement that creates systems and
processes that lead to product creation—the value creation. Similarly, the value expectation
has a bearing on the people and processes that they develop to create the product to
expectation. For clarity, the product expectation (dotted line in dark blue) and created
product (solid line in dark green) are deliberately shown as not overlapping in figure 2-37 for
clarity, however in the model of the mature Lean organisation, the value creation would
overlap the value expectation completely. The two arrows pointing upward indicate the
matching of the value expectation (dotted line and dark blue) by the value creation (solid line
and dark green).
Product Value Expectation
Environment Customer
Systems and processes
People Involvement
Bel ief System
Product Va lue Creation
FIGURE 2 -3 7 : CONCEPTUAL MODEL O F LEAN, SHOWING VALU E EXPECTATION BEING MATCHED
BY VALUE CREATION

Page 114 of 372
The model in figure 2-37 can be depicted as an integrated model by placing the customer
within the environment and placing the people involvement and systems and processes
within the belief system (figure 2-39). Arrows indicate the influence of the environment on
the customer’s value expectation and the influence of the belief system on the people
involvement and systems and processes that facilitate the value creation. An arrow between
the people involvement and the systems and processes indicates that effective systems and
processes are created through people involvement. Although it could be argued that the
organisation is surrounded by its supply chain, the model displays the connection to the
supply chain as included in systems and processes theme, referring to table 2-12.
Customer value expectation and organisation value creation connect in the product. The
product is depicted as dark green with a solid line to represent the product value creation,
while the line is coloured blue to symbolise the value creation (dark green) embedding the
product value expectation (dark blue in figure 2-38).
2.4. Literature conclusion
During the past century, a number of productivity improvement paradigms, methods and
techniques have been described and used. Several of these are socio-technical and
substantially include the human element that is so prevalent in the pipfruit industry. These are
FIGURE 2 -3 8 : WHERE VALUE EXPECTATION AND VALUE CREATION MEET: THE PRODUCT
Belief System
People
Involvement
Systems &
Processes
Product
Environment
Customer

Page 115 of 372
more suitable to the industry and include Lean as a reasonably logical preference, also
considering NZTE’s interest in spreading Lean to the NZ pipfruit industry.
The literature research shows that particularly little scientific material has been produced that
focuses on the implementation of Lean in the horticultural sector and specifically the NZ
pipfruit industry. Interestingly, there appears to be no explanation for this lack of literature,
i.e. the literature research did not uncover evidence of failed attempts to introduce Lean in a
seasonal horticultural setting. If there would have been a small body of evidence, empirically
satisfying that Lean does not fit seasonal horticultural industries, research could look at
different improvement methodologies or paradigms for this sector. However, little evidence
could be found that serious research has been attempted in this area. The few government
papers that were written for the wider public do not satisfy the academic need.
The reason for the lack of Lean implementation in the industry appears to be a combination of
pipfruit and general industry related circumstances. Within the pipfruit industry, the literature
review uncovered:
1. The dependence of growers and packers on ENZA—before deregulation in 2001;
2. The small to medium owner/operator composition of many businesses within the
industry, often led by:
a. Hard workers (Mannering, 1999) who left school early with little formal
management education or training;
3. Fragmented industry with infighting, and a focus on short-term annual monetary
returns—after deregulation;
4. No stakeholder supply chain involvement and therefore knowledge until limited
involvement started to develop well after deregulation;
5. The lack of similarity between early Lean principles (Womack et al, 1990) and the
pipfruit industry which had no manufacturing flow and was a ‘push’ industry.
NZ businesses in general, including the pipfruit industry were reported to:
6. Lack leadership, commitment and abilities, education or training and culture (Goodyer
et al, 2011);
7. Have trouble with change strategy and the change management process (e.g.
employee resistance), possibly through adoption of the ‘3-B’ approach (Wilson et al,
2008);

Page 116 of 372
8. Be weak in understanding customer value, particularly when getting closer to the
shop floor (Goodyer et al, 2011);
9. Focus on short term goals and lacking long term strategies (Kennedy, 2000; Green et
al, 2011).
Some of the possible reasons for a lack of Lean implementation in the pipfruit industry align
themselves with table 2-6 (Grouping of critical elements for Lean implementation) as well as
some of the common themes that emerge from the literature review. These common themes
are general in nature; they relate to both applicability and success/failure factors for Lean
implementation. Themes include major and minor themes. Major themes (significant but
broad concepts or ideas) include:
Lean is fluid and adaptive to its environment; different forms of Lean apply to
different industries, organisations, locations and times (figure 2-39);
Lean is challenging to implement. There are numerous cases of failed implementation:
Critical factors that lead to success or failure have been identified;
There is an apparent thematic continuum from general to specific, general being less
perceptible and tangible, while specific is more perceptible and tangible:
o The general theme includes vision, leadership (including support), philosophy,
strategy, behaviour, engagement;
o The specific theme includes methods and tools (best practices) such as 5-S,
training, visual management.
Minor themes (frequently recurring meaningful elements) across most industries align with
principles of the philosophical elements of the definition and include:
Identifying customer value;
Integration of production;
Reducing waste;
Reducing stressing of the system;
Evening of flow;
Producing small batches;
Reducing inventory through just-in-time;
Defect prevention;
Production pull;

Page 117 of 372
Smoothing demand;
Flexibility, multi-skilling and team work;
Problem solving—going to the root problem.
The literature review shows that there is an issue with the NZ pipfruit industry and points at a
gap between the NZ pipfruit industry and Lean; this gap may be attributable to some or all of
the factors mentioned in this summary. Lean may offer an opportunity for the NZ pipfruit
industry to improve operations. But as there is no standard template for introducing Lean in
the pipfruit environment, the applicability and transferability of Lean must be studied. This
void is of considerable concern and it is the pivotal driver for the research presented in this
thesis.
FIGURE 2 -3 9 : DOES THE LEAN PARADIGM SUIT A SEASONAL HORTICULTURAL INDUSTRY SUCH
AS THE NZ PIPFRUIT I NDUSTRY?
Lean Principles
Manufacture
Horticulture
Supply Chain Others
Tree crops
Human
Resources
Marketing
Accounting
Equipment
Cars
Service
Trader
Pack house
Lean fit?

Page 118 of 372
3. Methodology
3.1. Introduction to methodology
Chapter 1 of this thesis discusses the aim of this inquiry as ‘research the concept of Lean and
its theoretical ‘fit’ and practical applicability in a horticultural setting, specifically the New
Zealand (NZ) pipfruit industry’. The aim determines the scope for the inquiry. It also sets the
boundaries: There is no primary interest in business improvement paradigms other than Lean.
Similarly, there is no primary interest in other agricultural or industrial sectors. It is noted that,
although the fourth objective considers the applicability of a conceptual pipfruit model for the
wider horticultural sector, this is deemed to be an objective of secondary relevance.
This methodology chapter details how the aim and objectives from chapter 1 are intended to
be achieved. The selected methodology guides the researcher throughout the inquiry. The
chapter first describes some general methodology theory, followed by a description of the
elected approach for each of the four research objectives, including strategy, population and
sample selection and data collection methods. It then discusses the proposed data analysis
methods, summarises the research design and completes discussing issues of trustworthiness
and ethical considerations. The chapter is completed with a conclusion justifying the
appropriateness and relevance of the proposed methodology to achieve the objectives of this
inquiry.
3.2. Methodology: An overview
The following paragraphs deliberate on some elements of general theoretical research
approaches and discuss briefly how these research approaches are considered to best suit the
inquiry and methodology design.
3.2.1. The nature of knowledge: Ontological and epistemological footing
Knowledge is an abstract construct that lies at the root of human development.
Philosophically, the very root questions are questions such as ‘What exists?’ or ‘What is real?’

Page 119 of 372
to lead to shared understanding (Uschold and Grunninger, 1996). Ontology asks what is
existing; what is real (‘onto’ meaning existence or being real, and ‘logia’ meaning science or
study). In a more academic context, ontological questions are relating to what exists
specifically within a pre-determined subject area and includes questions about relationships
and hierarchy, describing parts and processes to understand structures that affect that subject
area. Poor ontology leads to poor communication (Uschold and Grunninger, 1996).
The ontological question in this inquiry becomes then how real Lean is as an idealistic concept
(however with materialistic consequences) and if it can exist in the pipfruit industry. What
parts and processes can be described that help us understand the structures affecting pipfruit
organisations in their productivity? How do the people experience Lean?
The next question is how we can learn about Lean in the pipfruit industry. The epistemological
paradigm concerns itself with the theory of knowledge (‘episteme’ meaning knowledge or
understanding, and ‘logia’ meaning science or study). Similar to the philosophical and non-
philosophical distinction within ontology, epistemology can also be viewed in a philosophical
and non-philosophical context where the latter concerns itself with the formal identification
of how we know that something is true (e.g. using empiricism or rationalism) while in the
current inquiry simultaneously focussing on the human and social aspects of knowledge
(Creswell, 2002). This is appropriate as the literature review identified Lean as a socio-
technical construct, involving people in their production environment.
3.2.2. The need for tailored research; discussing the research options
The spectrum of research options offers a wide range of methodologies. Conrad and Maul
(1981) rank quantitative and qualitative methods according to the level of control that each
method is seen to exert through the researcher (Figure 3-1). Each method has different
construct, internal and external validity and reliability. Each method however is described as
an isolated approach towards answering a specific research question or hypothesis.

Page 120 of 372
FIGURE 3 -1 : RESEARCH OPTIONS BAS ED ON DEGREE OF CONTROL (CONRAD AND MAUL, 1 9 81,
SIC .) .
Saunders et al (2011) present research as ‘an onion’ with different layers, each layer having to
be ‘peeled’ before the next. In their model, layers respectively include research philosophy,
approaches, strategies, time-horizons and data collection methods (Figure 3-2).
Neither Conrad and Maul (1981) nor Saunders et al (2011) discuss the structuring of the
specific research design. In order to formulate the research model, there is the additional
need to clarify if the research is exploratory research (unstructured), descriptive research or
causal research (both structured) (Ghauri & Grǿnhaug, 2005). Similarly, Yin (2012) uses the
terms exploratory, descriptive and explanatory. Creswell (2014) offers four philosophies
instead of the three offered by Saunders et al (2011). These include Postpositivism
Philosophy: Interpretivism Positivism
Realism
Approach: Inductive Deductive
Time- Horizon: Cross-
Sectional Longitudinal
Strategy: Quantitative: Survey Experiment
Qualitative: Case Study
Action Research Grounded Theory
Ethnography
Data collection: Questionnaires
Interviews Observation
Sampling Secondary Data
Design: Exploratory Descriptive
Causal
FIGURE 3 -2 : RESEARCH PROCESS STRATA ( MODELLED AFTER SAUNDERS ET AL ( 20 11) AND GHAURI
AND GRǾNHAUG ( 2 0 05 ) .

Page 121 of 372
(quantitative, based on empirical observation and measurement), Constructivism (often
combined with interpretivism and making sense of historically or socially shaped meanings of
others, inductively developing meaning), Advocacy/Participatory (a practical and collaborative
change-oriented empowerment) and Pragmatism (problem-centred focus on what works).
Inquiry paradigms are not mutually exclusive as Patton (1990) and Saunders et al (2011)
clearly state; they provide options to researchers.
Considering the uncertainty around the subject area, it is relevant that the research
methodology is structured by the ontological and epistemological questions mentioned at the
start of this chapter and by the research strata presented in figure 3-2 to guide the researcher
in the design of his methodology. These include the ontological question how real Lean is; the
epistemological position that Lean exists as knowledge and is empirically proven to exist ,
while the current inquiry focusses on the socio-technical aspects of this knowledge along a
constructivist/interpretivist approach. This approach appears justified as the literature review
showed that Lean is people orientated; in order to study Lean in the industry , the researcher
must embed himself into the industry and listen to peoples’ views of their reality, rendering
positivism as an inappropriate paradigm. This approach is then leading to an inductive route
because of the many unknowns. It is considered appropriate when considering Lean as a
socio-technical construct, involving people in their production environment.
3.2.3. Linking research strategies to objectives
The following sections discuss for each of the objectives the strategies deployed to achieve
the research objectives, the data collection methods and the population and sample.
3.3. The first objective: Strategy, method and sample.
The first objective of this inquiry is to ‘Identify common theoretical themes for the Lean
philosophy, methods and tools, that are not industry or contextually bound and that may be
transferable to the pipfruit industry.’

Page 122 of 372
3.3.1. Strategy to achieve the first objective
In order to identify common theoretical themes that are not industry or contextually bound it
appears logical that a substantial body of literature must be researched as it is impractical to
attempt collecting data from field work in a number of different industries or contexts. Too
much time would be involved in collecting that data. There is a substantial body of academic
work concerning Lean in different environments available. This makes a literature review a
logical and primary source to search for common theoretical themes that are not industry or
contextually bound.
A literature review is innate to most forms of inquiry. Ghauri and Grǿnhaug (2005) propose
that a literature review helps to:
Frame the problem under investigation
Identify relevant concepts
Position the inquiry
An additional method to obtain such data could be to find out if there are consultants
practicing Lean implementation in different industries. Such consultants may have identified
common themes across industries and contexts that may be transferable to the pipfruit
industry. Consultants can be surveyed or interviewed to complement findings from the
literature review.
3.3.2. Literature review method
The literature review took place prior to other elements of this inquiry and focused on the NZ
pipfruit industry and on Lean. Throughout the literature review, the researcher concentrate d
on the identification of developing themes for the Lean philosophy, methods and tools across
different industries and contexts. These themes are summarised to help assess the
transferability to other industries such as the NZ pipfruit industry.

Page 123 of 372
3.3.3. Consultant method
A primary reason for approaching consultants was to complete a very early and basic
assessment to indicate the ‘Lean state-of-the-industry’ and determine if consultants believed
that Lean could fit the pipfruit industry before setting out on a substantial body of field work.
Consultants and practitioners generally have experience with a reasonably broad range of
industries. This potentially provides consultants with a body of rich data. A contribution of
data from consultants is therefore considered to offer additional value in that it may
complement the literature review to achieve the first objective. The initiative to include
consultants to contribute to the first objective is therefore considered justified. The
consultant interviews took place during the first year of the inquiry.
3.3.3.1. Consultant population and sample
The population of Lean consultants was established with the assistance of NZTE, Pipfruit NZ
and a web-based search for Lean consultants in NZ. This resulted in a list of twenty-six
consultants operating across New Zealand, i.e. the population. Considering the relatively low
number of consultants and the relative simplicity of this complementary component of the
inquiry, it is justified to survey all consultants. The list of consultants is presented as appendix
5.
3.3.3.2. Consultant interviews or survey?
The number of consultants in New Zealand is relatively small, and a survey through interviews
is practically possible. Interviews offer the interviewer the option to adjust questions and
react to data provided by the interviewee. Although questionnaires are a possible data
collection approach, questionnaires do not offer the plasticity that interviews offer to adapt
the learning experience during the interview. Consequently, a decision was made to attempt
interviewing all consultants, using a questionnaire that could also serve as a survey for those
that could not be interviewed.

Page 124 of 372
3.3.3.3. Constructing the questionnaire
The purpose of the consultant interview is descriptive, rather than analytic, i.e. the interview
is attempting to find out from consultants what experience they have with Lean
implementation, in particular in horticulture or pipfruit (Ghauri and Grǿnhaug, 2005).
Interviews can be unstructured, semi-structured or structured. DiCicco-Bloom and Crabtree
(2006) argue that semi-structured interviews provide basic protocol consistency, but allow in-
depth elaborations. They observe that semi-structured interviews are the most widely used
interviewing format in qualitative research. Structured interviews would not allow probing for
additional data and were rejected as instrument. Unstructured interviews would not allow
protocol consistency, leading to a decision to elect the use of semi-structured interviews.
The questions were developed during the literature research and collected minor
demographic data, followed by open-ended questions concerning four typical horticultural
characteristics that ostensibly appear to be conflicting with Lean philosophy and principles in
the literature review. These characteristics were identified as push, seasonality, perishable
goods and consignment sales (not knowing the customer). Additional questions inquired
about familiarity with academic work and asked consultants to estimate the level of Lean
companies in New Zealand and in the horticultural industry.
The questionnaire was discussed with supervisors and not tested further prior to the
interviews as the semi-structure would allow the researcher to adapt the line of inquiry during
interviews. A copy of the semi-structured interview guideline is attached as appendix 8.
3.4. The second objective: Strategy, method and sample
The second objective of this inquiry is to ‘Identify and analyse the current Lean deployment
within the NZ pipfruit industry.’
3.4.1. Strategy to achieve the second objective
The literature review demonstrated that there was no evidence of pipfruit organisations that
had engaged in Lean. Three organisations had attempted Lean in 2008, but personal
conversations with all three organisations in 2011 evidenced that none was pursuing Lean.

Page 125 of 372
As the second objective relates purely to industry organisations and can only be determined
by investigating the industry itself it is axiomatic that primary data must come from the
industry. The industry consists of approximately 400 growers, 65 packhouse and coolstore
combinations and approximately 90 exporters; a total of approximately 555 direct
stakeholders (FreshFacts 2012). This population size is unsuitable for observation or interview
as the size of a representative sample would become impractical. Instead, a survey method
appeared suitable to obtain primary data from industry stakeholders and was elected as first
method of the strategy.
A personal conversation with Pipfruit NZ in November 2011 led to the supposition that no
companies within the industry were Lean but that there might be some elements of Lean that
could have developed organically. This conversation confirmed that there was no literature
about any organically developed Lean elements within the industry and the researcher
decided that his experience in the industry would merit the writing of a reflective practitioner
review which could contribute to the objectives by documenting some of the unrecorded
observations. The practitioner review was added as second method of the strategy.
In addition to the primary survey strategy, the consultant interviews might provide data that
could be converged with the survey data, providing the third method of the strategy.
The literature review and the three methods involved in the strategy to achieve the second
objective (survey, consultant interviews and practitioner review) combine into the first phase
of this inquiry.
3.4.2. Stakeholder survey: The first method for objective two
3.4.2.1. Data collection through stakeholder questionnaire
Several studies (Manfreda et al, 2002; Sheehan, 2006) show that long and web-based surveys
have lower response rates than traditional methods. A sample questionnaire was composed in
relation to Lean implementation. The questionnaire included several sections including
organisation demographics, a descriptive appreciation of how each organisation currently
operates using the 20 Kobayashi keys (but requiring no specific Lean knowledge from the

Page 126 of 372
respondent); and an appreciation how familiar each organisation is with common Lean tools.
Each question provided a 5 point Likert scale for the respondent to use. Data collection took
place towards the end of the first year of the inquiry.
3.4.2.2. Building the questionnaire
A number of Lean assessments have been discussed in the literature review. The instruments
are similar and have common themes but show different presentations. One instrument was
arbitrarily selected for use in the questionnaire. The Kobayashi criteria were selected as a
suitable instrument because they integrate 20 areas in an organisation and provide a step-
wise programme for achievement. This was considered potentially helpful for participants
post-inquiry. Considering that the complete Kobayashi criteria would be too long and onerous
for respondents to assess, the researcher created summary statements with elements of each
of the five levels for each of the Kobayashi keys. The logic was that truly Lean companies
would have implemented all levels of each key, but the opportunity needed to be given to
non-Lean respondents to identify some of their actions as Lean. In addition, the researcher
selected twenty common Lean principles, methods and tools with the intention to explore
familiarity and use within the industry. These were taken from the literature and both the
Japanese name and the English name were detailed.
The survey was discussed with supervisors and several industry stakeholders to ensure that
the content would provide an industry baseline. The survey was then sent to a small pilot
group with a request to complete the survey. This was followed up with a phone call to elicit
responses to the use of the instrument. Responses from the pilot group indicated that the
survey was too long and took considerable time to respond to. This led to an original and
unique approach to increase response rate through what the researcher called a ‘perceived
diminished participant effort’ approach (PDPE). This consisted of the researcher emailing a
single question or statement each working day to the sample, allowing a response within a
minute. Responses were collected daily and recorded. On completion of the survey, the
researcher provided feedback to each respondent, including any ‘missed’ questions, offering
the opportunity to complete those and increasing the response rate. Appendix 7 includes a
copy of the industry survey.

Page 127 of 372
3.4.3. Population and sample
3.4.3.1. Establishing the population and sample for the questionnaire
All elements of the industry, i.e. growers, packers, coolstores and exporters are forming the
population, a total of approximately 555 direct stakeholders. The assistance of the industry’s
governing body (Pipfruit NZ Inc.) was asked to provide a database with email addresses of
their members and select 150 of those members to represent the strata of growers,
packhouse/coolstore combinations and exporters. The resulting stratified random sample
(Saunders et al, 2011) included several suppliers and customers to the industry who were also
are a member of Pipfruit NZ. The sample of 150 was reduced by 4 double-ups (two
stakeholders of one organisation in the database) and 6 members asking to be excluded from
the questionnaire. The sample was confirmed as follows:
TABLE 3 -1 : DISTRIBUTION OF SAMPLE BY INDUSTRY ACTIVITY.
Membership position Number
Grower (dedicated) 71
Packhouse/coolstore 2
Grower/packhouse/coolstore 24
Packhouse/coolstore/exporter 3
Grower/packhouse/coolstore/exporter 14
Exporter (dedicated) 18
First tier supplier 5
First tier customer 3
Total 140
This stratified sample size and mix (table 3-1) was considered sufficient and representative of
the industry population for the purpose of the survey validity.
3.4.4. A practitioner review: The second method for objective two
A number of developments within the NZ pipfruit industry have not been documented. As
independent practitioner, the researcher has reflected on the industry from his professional
perspective and this reflective review is added as appendix 1.

Page 128 of 372
3.4.5. Complementing consultant interviews. The third method
The consultant interviews were considered potential contributions to establish how Lean the
pipfruit industry currently was. At the time of the research design, it was unknown how many
consultants had experience with the pipfruit industry or the wider horticultural industry. The
consultant interviews have been presented under the first objective and it is considered
unnecessary to reiterate the method, population and sample.
3.5. The third objective: Strategy, method and sample
The third objective of this inquiry is to ‘Analyse the applicability and any implementation
approaches of the Lean philosophy, methods and tools within the NZ pipfruit industry’.
3.5.1. Strategy to achieve the third objective—quantitative or qualitative?
In order to obtain data that would help with the third objective, it was axiomatic to research
organisations within the industry. The lack of literature prevented a grounded research
approach which was excluded as methodology. The researcher was fortunate that
synchronously with the start of this inquiry, several pipfruit organisations started
implementing Lean. As the lack of Lean organisations at the start of this inquiry precluded a
quantitative method, the methodological options were restricted to qualitative methods. This
suited the inquiry, as Lean is probing intangible aspects of organisations such as vision,
leadership, engagement and culture. These elements are difficult to measure and a qualitative
approach was decided to be more suitable to obtain rich data without requiring a large
sample. A qualitative inquiry obtains a deeper understanding, and the small number of
companies engaging in Lean suited the selection of a qualitative methodology to achieve
objective 3.
3.5.1.1. Options within qualitative research methodology
Relatively few options are available within qualitative research; these include grounded
theory and ethnography, as well as case study and action research. Ethnography was not

Page 129 of 372
considered a practical solution as it would engage the researcher wholly, while grounded
theory was considered possible but impractical due to lack of data. One of the problems
encountered was that at the very start of this inquiry, no known organisations engaged in
Lean. For this reason, the only option to research Lean in the pipfruit industry appeared to be
action research, where the researcher can engage with a willing organisation that intends to
adopt a new paradigm. Two such organisations were found, one being an orchard group and
one being a packhouse. The emergence of two packhouse organisations that had unbeknown
to the researcher started to implement Lean at the time of start of the inquiry offered the
researcher the opportunity to engage with these two companies as case studies. It appeared
therefore that action research, combined with case study would offer the best opportunity to
collect rich data from different implementation methods to achieve the third objective. These
two options are now expounded after discussing measurement instruments and the protocol .
3.5.1.2. Measurement instruments used
Because the action research orchard and packhouse—as well as the two case study
packhouses—started implementing Lean at the start of this inquiry, it offered an opportunity
to measure progress during the course of the inquiry. The researcher considered the
measurement instruments from the literature review and selected the Tapping et al (2002)
instrument as applicable and reasonably easy to understand by the research companies. The
research companies were asked to complete a self-assessment at the start of their Lean
programme; again after one year and again at the end of the second season which was the
end of the research period.
During the course of the investigation, the research orchards and packhouses expressed
curiosity about their standing in relation to the industry and asked to complete the industry
survey at similar intervals to relate their position to the wider industry. This would add data
and was promptly added to the protocol.
3.5.1.3. Researcher embeddedness inside the research
Lean as a socio-technical system involves people in their environment. The researcher was in a
unique position, knowing both the industry and being a student of Lean. As Lean is
Page 130 of 372
significantly people-oriented, involvement of the researcher in studying Lean by engaging with
the people attempting to adopt Lean was imperative.
Accordingly, the researcher recognised the possibility of active and passive bias
(Onwuegbuzie, 2003), respectively the effect of the researcher on the people being
researched and the reverse. Miles and Huberman (1994) called this ‘Bias A’ (the effect of the
researcher on the participants) and ‘Bias B’ (the effect of the participants on the researcher).
Researcher bias is a very common threat to legitimation in constructivist research because the
researcher usually serves as the person (i.e., instrument) collecting the data (Onwuegbuzie
and Leech, 2006). Guba recommends insulating the researcher e.g. by double blind
procedures (Guba, 1981), however this was not a possibility. Instead, the researcher used
standard methodologies to ensure that the research was not contaminated by bias; these
included the protocol design, offering transcripts to participants for feedback and discussing
discoveries with participants. Safeguards to mitigate researcher bias are discussed in the
trustworthiness section and the effect of the embeddedness of the researcher is repeated in
the limitations to the inquiry.
3.5.1.4. The protocol; providing guidance and consistency
Case study requires strict protocols in order to provide robust research results (Yin, 2009).
Stake (2013) and Yin (2009) observe that use of a protocol ensures accuracy. The case study
protocol follows a number of considerations. Yin (2009) emphasises the importance of
researcher preparation and protocol design before the actual data collection phase starts. In
case of multiple researchers, the protocol gives guidance to each researcher and will result in
reliable findings across researchers based on consistent research questions and aims. In
addition, and particularly in case of a single researcher—as is the case in this inquiry—a
protocol ensures that the researcher stays ‘on track’ and firmly focuses on the rese arch
questions and the way in which his research will be analysed and reported (Yin, 2009). The
protocol for the case study phase of the research project provides guidance for the following:
1. Basic information: Establishing the case study questions and propositions including
validity and reliability considerations.
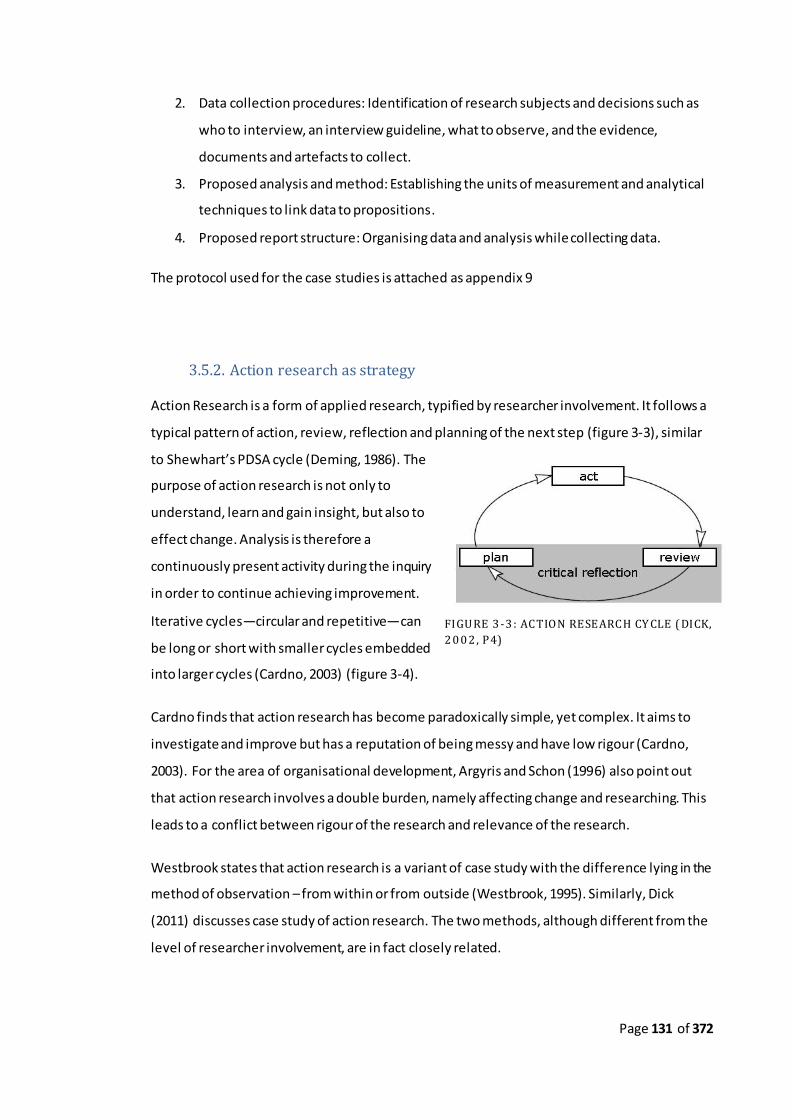
Page 131 of 372
2. Data collection procedures: Identification of research subjects and decisions such as
who to interview, an interview guideline, what to observe, and the evidence,
documents and artefacts to collect.
3. Proposed analysis and method: Establishing the units of measurement and analytical
techniques to link data to propositions.
4. Proposed report structure: Organising data and analysis while collecting data.
The protocol used for the case studies is attached as appendix 9
3.5.2. Action research as strategy
Action Research is a form of applied research, typified by researcher involvement. It follows a
typical pattern of action, review, reflection and planning of the next step (figure 3-3), similar
to Shewhart’s PDSA cycle (Deming, 1986). The
purpose of action research is not only to
understand, learn and gain insight, but also to
effect change. Analysis is therefore a
continuously present activity during the inquiry
in order to continue achieving improvement.
Iterative cycles—circular and repetitive—can
be long or short with smaller cycles embedded
into larger cycles (Cardno, 2003) (figure 3-4).
Cardno finds that action research has become paradoxically simple, yet complex. It aims to
investigate and improve but has a reputation of being messy and have low rigour (Cardno,
2003). For the area of organisational development, Argyris and Schon (1996) also point out
that action research involves a double burden, namely affecting change and researching. This
leads to a conflict between rigour of the research and relevance of the research.
Westbrook states that action research is a variant of case study with the difference lying in the
method of observation – from within or from outside (Westbrook, 1995). Similarly, Dick
(2011) discusses case study of action research. The two methods, although different from the
level of researcher involvement, are in fact closely related.
FIGURE 3 -3 : ACTION RESEARCH CY CLE ( DICK,
2 0 0 2 , P4)
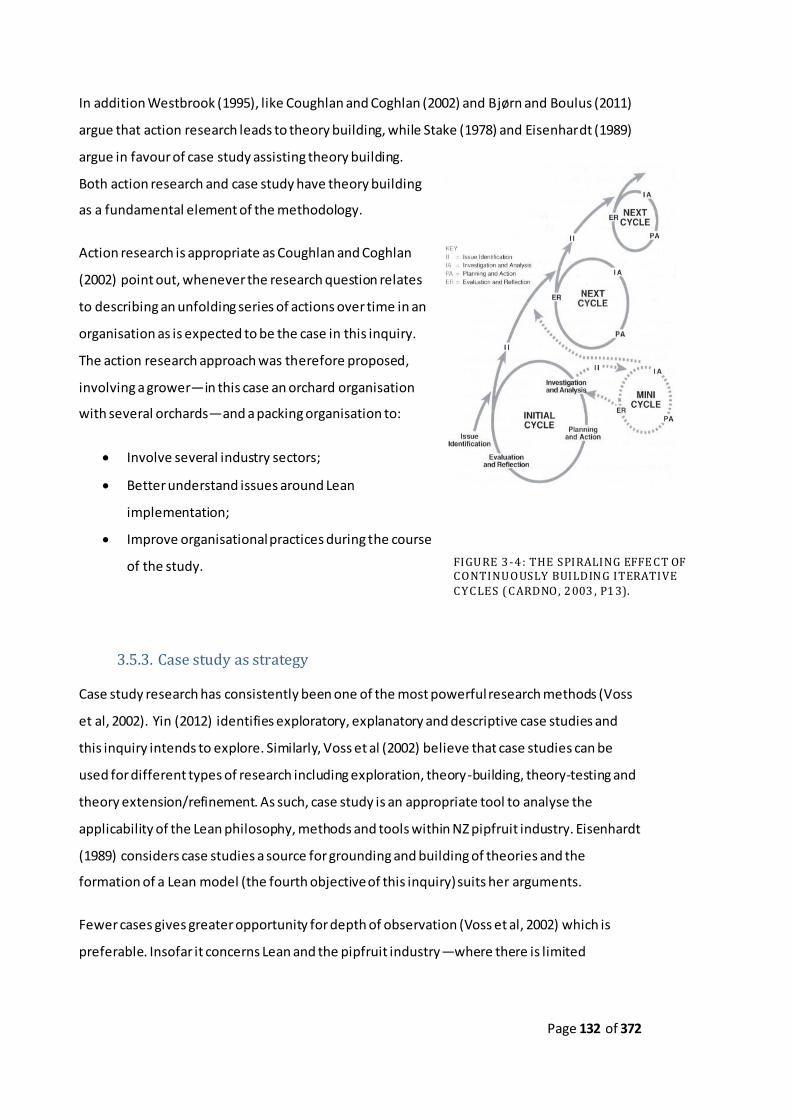
Page 132 of 372
In addition Westbrook (1995), like Coughlan and Coghlan (2002) and Bjørn and Boulus (2011)
argue that action research leads to theory building, while Stake (1978) and Eisenhardt (1989)
argue in favour of case study assisting theory building.
Both action research and case study have theory building
as a fundamental element of the methodology.
Action research is appropriate as Coughlan and Coghlan
(2002) point out, whenever the research question relates
to describing an unfolding series of actions over time in an
organisation as is expected to be the case in this inquiry.
The action research approach was therefore proposed,
involving a grower—in this case an orchard organisation
with several orchards—and a packing organisation to:
Involve several industry sectors;
Better understand issues around Lean
implementation;
Improve organisational practices during the course
of the study.
3.5.3. Case study as strategy
Case study research has consistently been one of the most powerful research methods (Voss
et al, 2002). Yin (2012) identifies exploratory, explanatory and descriptive case studies and
this inquiry intends to explore. Similarly, Voss et al (2002) believe that case studies can be
used for different types of research including exploration, theory-building, theory-testing and
theory extension/refinement. As such, case study is an appropriate tool to analyse the
applicability of the Lean philosophy, methods and tools within NZ pipfruit industry. Eisenhardt
(1989) considers case studies a source for grounding and building of theories and the
formation of a Lean model (the fourth objective of this inquiry) suits her arguments.
Fewer cases gives greater opportunity for depth of observation (Voss et al, 2002) which is
preferable. Insofar it concerns Lean and the pipfruit industry—where there is limited
FIGURE 3 -4 : THE SPIRALING EFFE CT OF CONTINUOUSLY BUILDING ITERATIVE CYCLES ( CARDNO, 2 003 , P1 3).

Page 133 of 372
information due to a lack of literature—the selected cases must however cover the industry
and the number is therefore partly determined by the objectives of this inquiry.
3.5.4. Data collection for action research and case study
Data collection took place during a 20 month period, the researcher visiting each research
company on a number of occasions and interviewing management, supervisors and floor staff
while recording multiple observations. Evidence was collected throughout the process. This
included but was not restricted to forms, meeting notes and photographs. Notes were kept by
the researcher from these meetings and interviews. These notes were generally transcribed in
situ as a combination of descriptive and verbatim records and were presented to the sample
organisation for feedback in order to eliminate researcher bias.
Because orchard managers could not always get together, several visits were restricted to the
technical manager who would then put new approaches in place with the assistance of the
individual orchard managers. As the Lean theory knowledge of the orchard managers was low,
sessions would regularly include explanations of Lean principles and methods, often followed
by a discussion on how this might apply to the orchards (e.g. figure 4-7). Regular smaller
iterative cycles were completed, complemented by end-of-season reflective cycles. The
distinct iterative cycles related to the main activities during a one year season. These were
pruning, spraying, thinning and harvesting with several associated lesser activities.
The data collection in the action research packhouse was similar to the action research
orchards, completing several iterative cycles relating to identifying waste, visual management,
leading, and staff involvement. Here too, transcripts were presented to the sample companies
for feedback in order to eliminate researcher bias.
3.5.5. Population and sample
The established population included approximately 550 organisations, however finding
volunteers for the research project proved problematic. Although the study was announced
by email in 2011, and again in the industry’s monthly newsletter in April 2012 (Pipfruit NewZ,
April 2012; Appendix 6), the number of companies that volunteered for participation in the

Page 134 of 372
research project was low with only seven companies responding. Several of these withdrew
participation within months from the initial expression of interest. In addition, none of the
volunteers was an exporter, the third important industry segment.
3.5.5.1. Establishing the sample for action research and case studies
One orchard and one packhouse volunteered for participation without having any prior
interest in Lean. These two organisations were selected by default for action research and
were committed to participate.
Two packhouses volunteered for case studies. One packhouse had engaged a consultant to
assist with lean implementation. The other packhouse had hired a manager with Lean
experience, specifically to implement Lean in the organisation. Both packhouses were
distinctly interested in participation and were selected as case studies.
The developed protocol required a representation of the industry; exporters presented a
relevant component of the within-industry supply chain and were missing in the sample. In
May 2013, the situation was discussed with Pipfruit NZ, and a decision was made to approach
a number of suitable and representative exporting companies directly. Several of the top
fifteen exporting companies which had not replied earlier were shortlisted and approached
using emails, phone calls and personal meetings to explain the purpose of the research and
attempt to diffuse any concerns that might exist. Most of these exporting companies did not
answer or declined. Reasons for not participating were quoted as being too busy and not
wanting to share information. One exporter agreed to restricted and conditional participation
and one exporter granted an interview with follow up. These two exporters are considered
mini case studies but have been included to provide some entirety to the inquiry.
3.6. The fourth objective
The fourth objective of this inquiry is to ‘Develop a conceptual Lean model for the NZ pipfruit
industry and consider if the model is applicable to the wider horticultural sector’.

Page 135 of 372
3.6.1. Strategy to achieve the fourth objective
Converse to determining the requirements for the model, lessons will have been learned
during the inquiry that may be useful in order to build a model as in the fourth objective. For
this reason, both inductive and deductive reasoning is used to arrive at an industry model.
Inductive reasoning establishes the requirements for the model while deductive reasoning
establishes what can be used from lessons learned during the inquiry to build new theory
(Mintzberg, 1979; Eisenhardt, 1989), where a new model is considered new theory (Figure 3-
5).
Findings from the literature review were used to build a conceptual Lean model which can be
aligned with the inquiry’s empirical findings (figure 2-38). The findings of the inquiry will assist
with the development of a conceptual Lean model for the NZ pipfruit industry .
3.6.2. Industry model requirements
In order for a Lean industry model to be meaningful to the industry, the following
requirements are considered:
The model must be grounded in a set of transferable Lean principles, methods and
tools in order to be valid.
The fundamental model emerging from the literature review in chapter two can serve
as the basis for a more typical industry model.
Inductive reasoning: What is required? What should it look like?
How would it work?
Deductive reasoning: What have we learned? What can we use?
How do we use it?
Lean Model for
pipfruit industry with
wider horticultural
applications
FIGURE 3 -5 : INDUCTIVE AND DEDUCTIVE REASONING TO LEAD TO A MODEL.

Page 136 of 372
Principal industry sectors (growing, packing/storing and exporting) each may require a
variation on the fundamental model. Several other horticultural industries have
similar organisational structures and the pipfruit model may be transferable for that
reason.
New theory must be added where possible to form Lean industry models.
The model must clarify the ‘visible’ and ‘invisible’ levels to ensure that industry
organisations understand the relevance of Lean as a holistic and integrated paradigm
rather than a set of tools.
3.6.3. Using the literature review model as basis for industry models
Several Lean models have been discussed in the literature review. These are summarised in
table 2-3 of chapter two. Keywords from these models and Lean literature were used to
extract a list of characteristics that were grouped in themes; these themes were used to
construct a model, representing Lean as it emerged from the literature review (figure 2-38).
Lessons learned during the inquiry may add to or change the Lean model from chapter two
(figure 2-38) to make it applicable to the pipfruit industry.
3.6.4. Synthesising findings of the inquiry with the literature review model
The observations that emerge during the inquiry are grouped in themes, reflecting specific
industry influences that are relevant to the development of an industry-specific model. Where
justified, the model can be different by industry sector, in line with the conclusion from
chapter two that Lean is both fluid and adaptive.
3.6.5. Summarising the strategy
A separate chapter—chapter six—synthesises the Lean model from the literature review
chapter with the findings from chapter four to develop a pipfruit industry model.

Page 137 of 372
3.7. Quantitative and qualitative methods combined—a mixed method
approach
The different objectives and the involved strategies lead to a mixed method approach
(Creswell, 2003). In a mixed method approach, quantitative and qualitative elements can
combine purposefully to increase robustness of the current inquiry (Greene et al, 1989):
1. Triangulation involves corroboration or convergence and increases construct validity;
2. Complementing involves elaboration, enhancement or clarification and increases
interpretability of constructs as well as their validity;
3. Development allows the result of one method to assist to develop or inform another
method;
4. Initiation can uncover paradoxical or contradicting information to increase the depth
of the enquiry; and
5. Expansion can extend the range of inquiry by using different methods for different
inquiry elements.
FIGURE 3 -6 : PURPOSES FOR MIXED METHODS EVALUATION DESIGN ( MODELLED AFTER GREENE
ET AL, 1 9 8 9 ) .

Page 138 of 372
For this reason, the investigation uses several independent methods which are mixed where
value can be added to the outcome of the investigation (Figure 3-6). Creswell and Miller
(2000) and Snow and Anderson (1991, cited in Tellis, 1997) suggest that triangul ation can take
place across data sources, theories, methods and among investigators, each potentially
adding robustness to the inquiry results. The most important point they make however lies in
the fact that each of the different methods used in mixed method research can add specific
forms of depth to each other method in the research method mix (Figure 3-6). Validity will be
discussed in the trustworthiness section (section 3.10), which follows later in the methodology
chapter.
Longitudinal or cross-sectional: The time period within which the research must take place to
complete this PhD study allows the length of at least one full season and part of a second
season. A longitudinal approach including a minimum of a one-year cycle is therefore
selected. Simultaneously, there is a cross-sectional element in looking at various organisations
and organisation types (growing, packing/storing and exporting). For the purpose of this
inquiry, both longitudinal and cross-sectional elements apply.
3.8. Data analysis and synthesis
Data analysis took place for each individual section of the inquiry, after which cross-sectional
data analysis took place. The following section explains how data were analysed within each
form of inquiry and between forms of inquiry.
Saunders et al (2011) table the differences between quantitative and qualitative data as
follows (table 3-2):
TABLE 3 -2 : DISTINCTIONS BETWEEN QUANTITATIVE AND QUALITATIVE DATA ( SAUND ERS ET
AL, 2 0 1 1 ).
Quantitative data Qualitative data
Based on meanings derived from numbers
Based on meanings expressed through words
Collection results in numerical and standardised data
Collection results in non-standardised data, requiring classification into categories
Analysis conducted through the use of diagrams and statistics
Analysis conducted through the use of conceptualisation

Page 139 of 372
Although there is a strong movement to keep quantitative and qualitative data analysis
segregated, Onwuegbuzie et al (2009) point out that these datasets can be jointly analysed.
While data analysis is discussed separately for the quantitative and qualitative elements of the
inquiry, final synthesis of results will enhance the rigour of the inquiry.
3.8.1. Quantitative and qualitative data analysis
3.8.1.1. Analysing stakeholder survey
Data from the questionnaire was assessed to determine if data editing was required to
eliminate obvious errors (Ghauri & Grǿnhaug, 2005). No data editing was required. Survey
questions were closed questions, eliminating the need for coding of questions. Questions had
been grouped in the survey in four categories (demographic data, management thinking,
descriptive Lean assessment and tool knowledge and use), each category allowing
quantitative analysis using measures of central tendency such as mode, median and mean and
using a measure of dispersion in standard deviation. A confidence interval was determined at
0.5% significance level. The data allowed for analysis of level of Lean implementation and
knowledge of Lean principles, methods and tools. Survey data allowed for presentation in
tables and graphs.
3.8.2. Qualitative data analysis
The nature and complexity of qualitative data determines substantially how data are collected
and analysed. Miles and Huberman (1984; 1994, in Ghauri & Grǿnhaug, 2005) differentiate
between three analytical elements:
1. Data reduction (selecting, focussing, simplifying, abstracting and transforming data
from field notes and other forms of data collection);
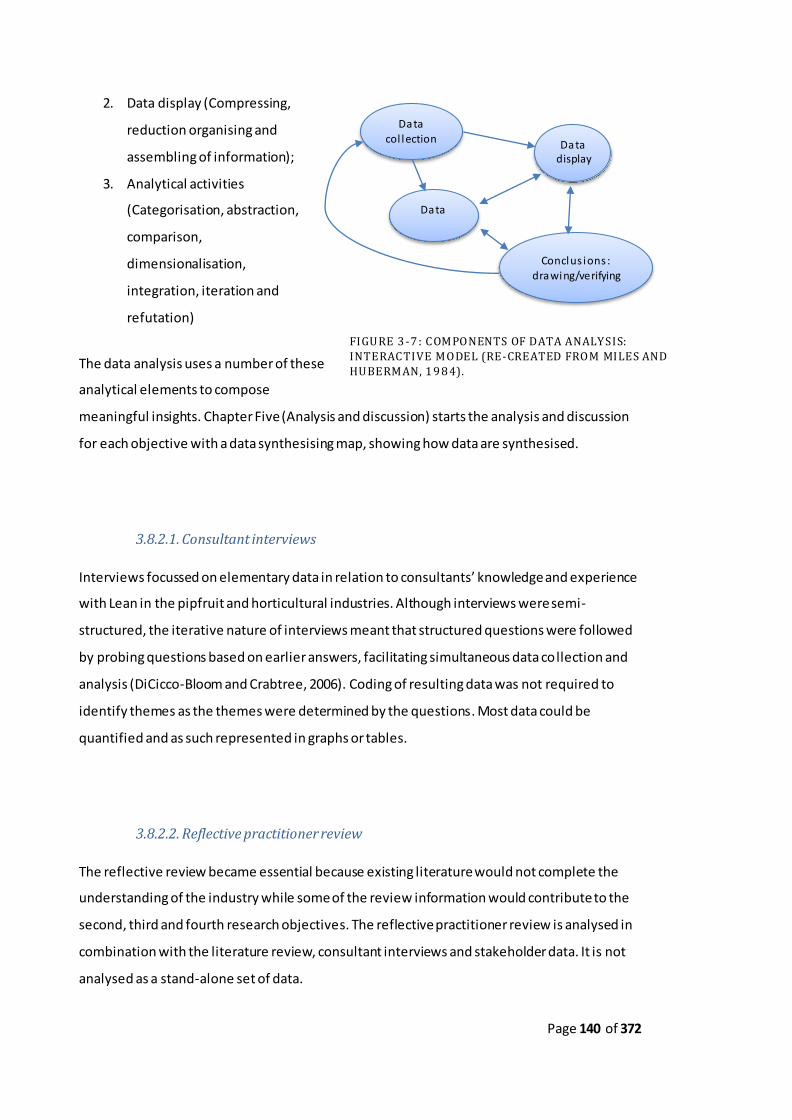
Page 140 of 372
2. Data display (Compressing,
reduction organising and
assembling of information);
3. Analytical activities
(Categorisation, abstraction,
comparison,
dimensionalisation,
integration, iteration and
refutation)
The data analysis uses a number of these
analytical elements to compose
meaningful insights. Chapter Five (Analysis and discussion) starts the analysis and discussion
for each objective with a data synthesising map, showing how data are synthesised.
3.8.2.1. Consultant interviews
Interviews focussed on elementary data in relation to consultants’ knowledge and experience
with Lean in the pipfruit and horticultural industries. Although interviews were semi-
structured, the iterative nature of interviews meant that structured questions were followed
by probing questions based on earlier answers, facilitating simultaneous data collection and
analysis (DiCicco-Bloom and Crabtree, 2006). Coding of resulting data was not required to
identify themes as the themes were determined by the questions. Most data could be
quantified and as such represented in graphs or tables.
3.8.2.2. Reflective practitioner review
The reflective review became essential because existing literature would not complete the
understanding of the industry while some of the review information would contribute to the
second, third and fourth research objectives. The reflective practitioner review is analysed in
combination with the literature review, consultant interviews and stakeholder data. It is not
analysed as a stand-alone set of data.
Data
Data col lection
Conclus ions : drawing/verifying
Data display
FIGURE 3 -7 : COMPONENTS OF DATA ANALYSIS:
INTERACTIVE MODEL (RE-CREATED FROM MILES AND HUBERMAN, 1 9 8 4).

Page 141 of 372
3.8.2.3. Action research
Analysing action research is different but paradoxically similar to analysing case studies. The
purpose of action research is not only to understand, learn and gain insight, but also to effect
change. Analysis is therefore a perpetually present activity during the inquiry in order to
continue achieving improvement (Cardno, 2003). At the end of the inquiry however, final
reflection on the action research project can be captured in a report very similar to a case
study report. With action research, the process is steered more by the participants than by
the researcher, but the researcher does have bearing on what eventuates. Where action
research has a focus on learning during the process (Kolb, 1984), more traditional views claim
that learning takes place as a result of passing information or research findings. In the current
inquiry, analysis is proposed to follow the iterative cycle but the analysis also places the action
research in a case study jacket with case study analysis instruments tested.
3.8.2.4. Case studies
Gaining understanding and insight was the key purpose of qualitative data collection to assist
with constructing explanations and/or theory development. The case study protocol
prescribes a predetermined focus and the protocol key words can be used for analysis,
however word counts are not sufficient; the researcher needs to determine if meaningful
patterns are emerging (Yin, 2009). Miles and Huberman (1994) offer a set of data
manipulation techniques that assist analysis, looking at data from different perspectives.
Yin (2009) relates pattern matching case information to a priori assumptions, systematic
patterns that confirm suppositions. The protocol presented several suppositions that are
compared with the empirical pattern, irrespective of the purpose of the study (expl oratory or
descriptive). The inclusion of rival explanations is used to confirm or disconfirm patterns
within outcomes. Similarly, explanation building can assist with the data analysis. Yin (2009)
further discusses time-series analysis, logic models and cross-case synthesis as patterns for
analysis. Of these, cross-case synthesis is used to analyse the collected data.
The analysis considers two case study packhouses but includes the case of the action research
packhouse as there are many overlaps between case study and action research. The
exporters’ mini case studies are analysed using pattern analysis and cross-case synthesis.

Page 142 of 372
3.8.2.5. Coding and categorising data
All records from meetings and interviews during the action research and case studies are
analysed using a coding and categorisation technique that includes several steps as follows:
a) Records are coded manually, using keywords that link to Lean, are repetitive or
appear significant.
b) Keywords are then assessed on meaning and grouped in a second analysis of the data.
c) The keyword/codes are then factored into three groups of categories.
o The first group is looking for all comments and observations that link to the
applicability of Lean for the pipfruit industry which is part of the third
objective.
o The second group is looking for all comments and observations that link to the
implementability8 of Lean for the pipfruit industry which is part of the third
objective.
o The third group categorises all other comments and observations according to
repetitiveness or significance.
2.1.4
1. Applicability group. This group uses the ten Tapping et al (2002) categories to help
determine if Lean is applicable for pipfruit organisations (objective 3); data are
clustered to- and counted within predetermined Lean themes to analyse applicability
(Miles & Huberman, 1994). The ten categories were taken from Tapping et al (2002) to
offer triangulation options.
2. Implementation group. This group uses ten categories to capture all those keywords
that are linked to the implementability of Lean for pipfruit organisations (objective 3);
here, data are clustered to, and counted within emerging implementation themes
(Miles & Huberman, 1994). Categories were established by generalising all comments
made in relation to implementation of Lean into ten categories.
3. Other elements group. Other patterns or themes emerge that inductively form
categories (Miles & Huberman, 1994). This group captures key words/codes that
8 The word ‘implementability’ is not commonly found in dictionaries but has been observed in academic l iterature, e.g. Green and Laffont (1987) and Kashyap et al (2005), and is considered self -explanatory.
Page 143 of 372
indicate typical industry issues, researcher typical codes or repetitive but
uncategorised keywords.
Frequency of codes are graphed to display the counts of each in order to assess what emerges
within pre-determined categories, to assess what emerges outside of those predetermined
categories, and to protect against bias (Miles & Huberman, 1994).
3.8.2.6. Synthesising the data
Collected data are synthesised where such synthesis would lead to more purposeful findings.
Case study, for example, is using cross-case synthesis and pattern analysis to analyse the
collected data and add validity to findings. Consultant interviews and stakeholder survey are
synthesised with literature review and reflective practitioner review. Data are synthesised to
summarise (integrative synthesis) and to develop concepts and theories (interpretive
synthesis) (Dixon-Woods et al, 2005). The different data collected are assessed to determine
where they are complementary or provide other forms of added value to findings.
After completing the literature review in phase one of the research design (figure 3-8), phase
two of the research design concerns the data collection structure for qualitative data through
field work. In phase three of the research design, the data collected in phase one and phase
two are coded where required, analysed, synthesised and discussed to arrive at a meaningful
conclusion.
3.8.2.7. Wider horticultural industry
Data collected from other horticultural industries was both quantitative and qualitative. Some
numbers were obtained relating to the industries (e.g. FreshFacts, 2010) to place these in
context with the subject industry of the inquiry. Several stakeholders within other
horticultural industries were interviewed and summary data analysed for broad similarities.
Analysed data were then used for comparative purposes between the pipfruit industry and
these other horticultural industries. The comparative analysis has too few cases to permit the
proper use of techniques of statistical control (Smelser, 1976; in Ragin, 2007) and comparative

Page 144 of 372
analysis was based on identified themes. This was then used to assess if the conceptual
pipfruit model would be suitable for these other horticultural industries.
3.9. Summary of the research design
3.9.1. Deducting the theoretical approach options
The following section reasons through the spectrum of research process strata presented in
figure 3-2, to arrive at the proposed research approach.
Philosophy: The expectation is that the industry will present to be quite complex. Results can
be ambiguous and unlikely to be turned into laws of nature, eliminating the positivist
philosophy. A holistic approach is expected to result in improved insights and the
interpretivist approach (Saunders et al, 2011) appears to be a sound philosophical basis for
the progression of the research approach.
Design: The next gradation focusses on the research design. Considering that relatively little is
known about the research area, it is accepted that the research design will predominantly be
exploratory with some descriptive elements rather probable (e.g. Patton, 1990).
Approach: Because of the uncertainty about what will be found, there is a strong likelihood
that arguments will be inductive, i.e. findings are likely to lead to formation of theory, perhaps
through ‘creative leaps’ as Mintzberg argues (1979). In fact, Mintzberg refers to induction as
exploratory research “as opposed to ‘rigorous’ research methodologies” (1979).
Strategy: The next layer requires us to select between quantitative and qualitative strategies.
A surveyed assessment of the baseline is typically quantitative whereas an in-depth case study
is typically qualitative. Creswell (2003) argues that a researcher may claim knowledge based
on ‘pragmatic grounds’, and that quantitative and qualitative data may be collected
simultaneously or sequentially in those cases where it is judged the best strategy to
understand a research problem. Mixed methods are argued to use both quantitative and
qualitative approaches interactively with a clear view of synthesising through triangulation,
complementarity, development, initiation, and expansion (Greene et al, 1989). The objectives

Page 145 of 372
stated in chapter one require both quantitative and qualitative data and a mixed method
approach is used to collect data (table 3-3).
TABLE 3 -3 : RESEARCH STRATEGIES AND QUALITATIVE/QUANTITATIVE EMPHASIS .
Research strategy
Qualitative or quantitative
Survey: Stakeholder questionnaire Quantitative Consultant interviews/questionnaire Qualitative Reflective practitioner review Qualitative Case studies Qualitative
Action Research Qualitative
Time-horizon: As the primary data collection is expected to take place over time and across
industry elements, the inquiry is expected to have both longitudinal and cross-sectional
elements.
Data collection: Data collection involves the use of sampling and questionnaires as
quantitative elements, while interviews and observations present qualitative elements.
Secondary data are expected to complement specifically collected data.
The research strata ‘onion’ (figure 3-2) is now peeled and the research strata have been
considered, resulting in an overall research pathway and guiding from the wider philosophical
perspective to the specific detail.
Following Conrad and Maul’s scale of certainty, it is expected that the degree of control of
variables during the research is low; the inquiry is expected to be relatively fluid.
3.9.2. Available population, sample selection and data collection
This section examines the sample selection and data collection methods in more detail. For
clarity it is noted that the first objective (‘Identify common theoretical themes for the Lean
philosophy, methods and tools, that are not industry or contextually bound and that may be
transferable to the pipfruit industry’) is achieved through the literature review with some data

Page 146 of 372
from consultant interviews complementing the findings. Table 3.4 summarises the research
strategy and data collection by organisation type. Subsequent paragraphs expound on the
summary in table 3-4.
TABLE 3 -4 : RESEARCH ORGANISATIO N GROUPING BY RESEARCH STRATEGY AND ORGANISATION
TYPE.
Quantitative research component:
Orchards P/H 1 P/H 2 P/H 3 Exp. 1 Exp. 2 Survey 2012 --------------------------- Industry-wide -------------------------- Survey 2013/14 Yes Yes Yes Yes No No
Qualitative research component: Consultant Interviews 2012
Consultants across all industries
Practitioner Reflection
--------------------------- Industry-wide --------------------------
Action Research Yes Yes Case Study Yes Yes Mini case study Yes Yes
3.9.3. The overall research design
Considering the elected research strata and the research objectives, it is approriate to draw an
overall research design map bringing all elements of this inquiry together (Figure 3-8). The
objectives described in Chapter 1 are repeated here for clarity:
1. Identify common theoretical themes for the Lean philosophy, methods and tools,
that are not industry or contextually bound and that may be transferable to the
pipfruit industry.
2. Identify and analyse the current Lean deployment within the NZ pipfruit industry.
3. Analyse the applicability and any implementation approaches of the Lean
philosophy, methods and tools within the NZ pipfruit industry.
4. Develop a conceptual Lean model for the NZ pipfruit industry and consider if the
model is applicable to the wider horticultural sector.

Page 147 of 372
FIGURE 3 -8 : RESEARCH DESIGN & METHODOLOGY MAP .
Page 148 of 372
The inquiry is designed in three mostly sequential phases, each contributing to completion of
specific objectives:
Phase 1 is exploratory and necessary to understand if Lean fits theoretically (objective
1) and if the industry currently is Lean (objective 2).
Phase 2 is necessary to obtain meaningful and rich data that help analyse the
applicability and implementation approaches of Lean into the industry (objective 3),
and requires substantial field work.
Phase 3 is necessary to analyse the data using triangulation and other forms of data
analysis (e.g. Greene et al, 1989) and determine reliability and validity of the data,
leading to completion of objective 3. Objective 4 can only follow after completion of
objective 3.
The research design and methodology map in figure 3-8 also points at thesis chapters
reporting on specific parts of the inquiry.
3.9.4. Issues of trustworthiness: Reliability and validity
“Without rigor, research is worthless, becomes fiction, and loses its utility.”
This quote from Morse et al (2008, p14) epitomises the essence of rigour. Reliability and
validity have been synonymous with rigour (Seale, 1999) and as such two of the cornerstones
of science. Patton (1990) states that validity and reliability are two factors which qualitative
researchers should be concerned about when designing a study, analysing the results and
judging the quality of the inquiry. In a qualitative inquiry, he argues that the researcher is the
instrument, and validity relies substantially on the skill and competency of the researcher.
Similarly, Yin (2009) appears clear in his assessment that reliability and construct-, internal-
and external validity are commonly used to establish the quality of empirical research. This
section summarises the reliability and validity design constructs employed by the researcher
(table 3-5). Reliability and validity are further discussed in chapter 5, ‘Analysis and discussion’.
The theoretical assessment of rigour has led to confusing debate about constructs of validity
(e.g. Morse, 2008; Golafshani, 2003; Guba and Lincoln, 1994; Maxwell, 1992; Altheide and
Johnson, 1994), and the debate is unlikely to lead to more rigour in future research. The

Page 149 of 372
debate may more likely lead to more variability in terminology and inconsistency across
inquiries. This is not helpful. Rigour for this inquiry is therefore primarily sought in reliability
and construct-, internal- and external validity.
The rigour of the inquiry’s concepts was tested by peer reviewed papers and presentations at
the following international forums:
The World Business Capability Congress (WBCC) 2012 (Doevendans et al, 2012);
The European Operations Management Association (Euroma) conference 2014
(Doevendans et al¹, 2014);
The Performance Management Association (PMA) conference 2014 (Doevendans et
al², 2014); and the
Australia New Zealand Academy for Management (ANZAM) supply chain symposium
2014 (Doevendans et al³, 2014), where the paper was awarded shared ‘best paper’.
Questions during these presentations generally focussed on parallels with other primary
industries with no critique on the methodology or robustness of the presented papers.
Similarly, the reliability and validity of the reflective practitioner review was tested through
review by a number of industry peers and is not included in table 3.5.
3.9.5. Reliability
Reliability relates to the degree in which measured outcomes are free from errors of
measurement; measurement errors reduce the generalizability of the outcomes of the inquiry
(Moss, 1994). The use of a single researcher also provides for consistency. Despite some
misgivings, Morse et al (2008) confirm that verification through participant verification adds
reliability. Table 3-5 presents how reliability is intended to be achieved.
3.9.6. Validity
Validation strategies include theoretical sampling and sampling adequacy, methodological
coherence, investigator responsiveness, an active analytic position and saturation. A good
qualitative researcher oscillates between design and implementation to ensure congruence

Page 150 of 372
among elements of the methodology, including question formulation, literature, lot and
sample selection, data collection strategies, and analysis (Morse et al, 2008). Validating means
investigating, checking, questioning, and theorizing (Kvale, 1995). Table 3-5 presents a
summary of design tests in relation to research methods and objectives.

Page 151 of 372
TABLE 3 -5 : RELIABILITY AND VALI DITY DESIGN.
Design Test Consultant Interviews
Stakeholder survey
Case study approach
Action research
Objective Identify common themes of Lean
deployable to industry
Identify current Lean deployment and
implementation approaches
Analyse current Lean deployment and
Lean applicability; identify model
Analyse current Lean deployment
and Lean applicability; identify model
Reliability: the extent to which
the s tudy’s data (observations) are cons istent and can
be repeated, producing the same results.
Use of semi-s tructured
interviews Coding of replies
Identifying themes
Use of questionnaire with
Liker scale Strati fied sample
selection to represent industry
Increased response rate through single question approach
Use of a protocol Use of a single
researcher for cons istency
Coding and identification of themes
Participant veri fication
Use of a semi-protocol,
congruent to case s tudy
Use of a single researcher for cons istency
Coding and identification of themes
Participant veri fication
Construct validity: The extent to which the inquiry
measures what it cla ims to be
measuring. Convergent & Discriminative:
Degree to which theoretical
relation is actual relation (C) or not (D)
Establishment of experience of
consultants in pipfruit and horticultural
industries Use of specific
lean element
questions
Ski lled interviewer
Questionnaire des ign allowing
convergence and discrimination between questions
Cross -referencing of s ingle-day questions
Use of published a l ternative
implementations of lean in the construction of the
case s tudy protocol
Use of multiple sources of evidence within cases, allowing triangulation
Ski lled interviewer
Use of multiple sources of
evidence within action research, a l lowing internal
triangulation Achieve
Recoverability
Internal validity: The extent to
which causal relationships are justi fied by
minimizing systematic error. Inferences are va l id if a causal relationship can be demonstrated
Sample of all known
consultants Establishment of
experience of consultants in pipfruit and horticultural industries
Strati fied sample selection to
represent industry Val idation of
respondents Val idating
cons istency
between direct and indirect questions
Speci fication of unit of analysis
Within case and cross -case
comparisons of case data
Cross -case analysis between case s tudy and action research cases
Cross -case analysis between
case s tudy and action research
cases
Achieve Recoverability
External validity:
The extent to which this study’s findings can be
generalised beyond the immediate sample to the wider populations (of pipfruit and horticultural
organisations).
Sample of all
known consultants
Establishment of other known consultants from
consultants
Representative
sample of the industry
Differentiation between sub-samples of industry
activi ties Establishment of
s imilarities between pipfruit and horticulture
Replication logic
used in case s tudy selection
Having a focus group review prel iminary cross-
case findings. Compare with
known theory and empirical evidence on Lean implementation
Having a focus
group review prel iminary
action research findings.
Compare with
known theory and empirical
evidence on Lean implementation
Achieve Recoverability

Page 152 of 372
3.10. Ethical considerations
Initial ethical considerations were prompted by Massey University’s Code of ethical conduct
for research, teaching and evaluations involving human participants (MUHEC) (2010). The
university provides an ethics screening questionnaire which assist the researcher to
preliminary assess whether a low risk notification is applicable or a full application to the
ethics committee should be made. A low risk application was made and approved, based on
the fact that:
All participants were fully informed adult volunteers and organisations;
All details that might identify participants would not be included in the thesis;
No harm of any kind could be foreseen for participants or researcher.
The possible conflict caused by action research is well documented and a case study and
action research protocol (appendix 9) mitigates ethical risks. The researcher made it general
practice to inform the participants of the research, its purpose and methods of data
collection, reinforcing the confidential nature of the inquiry. Participants—both organisations
and individuals—were made aware of their rights in participating, including to remain
unnamed and the right to withdraw. Interestingly, and despite the reluctance to participate,
organisations without exception were unconcerned about identification and none withdrew.
Nevertheless, the research presented in this inquiry suitably protects the participants in the
survey, interviews and the participating organisations. Special consideration was given to the
action research component, but no ethical dilemmas were encountered.
3.11. Chapter conclusion
Section 3.1 of this chapter introduced the methodology employed to achieve the objectives of
this inquiry. A general approach was discussed in section 3.2, funnelling from the broad
philosophical to methodological details. The methodology deployed in this inquiry follows a
standard literature review with a mixed method survey and interview element to lay the basis
for achieving objectives 1 and 2 during phase 1 of the inquiry (Section 3.3 and 3.4). This initial
part of the inquiry is followed by an unorthodox combination of parallel action research and
case study in phase 2 of the inquiry to collect rich data (Section 3.5 of this chapter). Section

Page 153 of 372
3.6 discusses the methodology to achieve the fourth objective, while sections 3.7 to 3.9
present qualitative and quantitative methods, data analysis and a summary of the
methodology.
This methodology is justified as a logical approach when considering the four objectives of the
inquiry and the environment, being an industry with few Lean organisations to use for
research purposes. Several industry segments, specifically orchards and exporters, had no
organisations embarked on the implementation of Lean whereas some packhouse/coolstore
organisations had decided or very recently started to implement Lean. Offering action
research to research volunteers motivated one packhouse/coolstore and one orchard group
to participate in the research which they would not have done otherwise. The orchard group
decided to become the first in New Zealand to attempt implementing Lean, providing
potentially valuable insights in the applicability of Lean in that industry segment (growing
pipfruit).
This mixed methods approach places some demands on the analysis of data and the
trustworthiness or rigour of the inquiry. These are discussed in some detail in section 3.10 of
this chapter respectively. Section 3.11 of the chapter discusses ethical considerations to
ensure that the inquiry is safe for sample companies and researcher alike.
The methodology chapter has clarified how the aim and objectives from chapter one are
intended to be achieved and why the deployed methodology is relevant.

Page 154 of 372
4. Results
4.1. Introduction to results
In previous chapters, we have seen an introduction to the pipfruit industry and the research
problem (chapter 1). A literature review then examined Lean and the pipfruit industry
(chapter 2), followed by a research design and methodology chapter (chapter 3). This chapter,
‘Results’, presents results from the several investigative strategies and data collection
methods that were discussed in the methodology chapter. For the purpose of this inquiry, the
words ‘results’ and ‘findings’ are interchangeable. Chapter 4 reports on the following:
Findings from the literature review (section 4.2)
Findings from the reflective practitioner review (section 4.3)
Findings from consultant interviews (section 4.4)
Findings from the stakeholder survey (section 4.5)
Findings from action research (section 4.6)
Findings from case studies (section 4.7)
The results and findings are reported without analysis; the following chapter (chapter 5)
analyses and discusses the findings in the context of the research objectives. Each of the
reported findings connects to one or several of the objectives identified in chapter 1.
4.2. Findings from literature review and the first objective
The literature review demonstrates that Lean principles, methods and tools are not unique.
Gilbreth, Ford and Taylor had ideas that align substantially with what we today define as Lean,
well before Lean was identified in the Japanese automotive industry by Krafcik (1988b),
Womack et al (1990) and others.
The literature review shows that within Japan, automotive companies that followed Toyota
adapted Toyota’s TPS in order to suit their environment (Cusumano, 1994). It also presents a
number of examples from the health industry, marketing and sales, the processing industry,
accounting and others. Principles such as critical elements for Lean implementation and

Page 155 of 372
defining waste are presented from different perspectives and demonstrate that Lean can be
adapted to, and implemented in, multiple ‘other-than-manufacturing’ environments. Diligent
application of best practices, people empowerment, Just-In-Time and continuous
improvement principles are transferable success enablers. Lean is not a uniquely Japanese
concept.
The literature review identifies common theoretical themes for the Lean philosophy methods
and tools that have proven to be transferable to numerous industries and environments.
Major themes included the fluidity and environmental adaptability of Lean, the challenge of
implementation and the continuum from general, less perceptible themes such as leadership,
strategy behaviour and engagement to specific more perceptible themes such as methods and
tools. These may be adapted to specific production or service environments but they are
applicable nonetheless. The literature review therefore substantially achieves the first
objective of this inquiry.
4.3. Findings from reflective practitioner review
4.3.1. The need for a reflective practitioner review
A number of developments within the NZ pipfruit industry have not been documented. As
independent practitioner, the researcher has reflected on the industry from his professional
perspective and this reflective review is added as appendix 1. The following section
summarises findings from the reflective practitioner review.
4.3.2. Reflective practitioner review synopsis
The practitioner review reflects on some historical developments that have shaped the
industry into its current model. The formation of a large number of exporters since
deregulation has affected the value stream insofar as that was understood by the industry. It
has also contributed to a sharpening of practices to assist the cost/value proposition.
The reflective practitioner review points at the following themes:

Page 156 of 372
The interpretation of customer value and the dualistic position of the exporter
An unsettled industry, resulting in multiple supply chain and value stream changes,
creating an uneven system with overburdening;
A general unawareness of Lean as evidenced by the attendance to three regional
workshops;
Poorly timed communication of customer requirements to growers (often around
December whereas the grower generally prunes from May to October;
Consignment sales are sales of product pushed into the market and not pulled by a
customer programme.
There is waste caused by market requirements, lost market opportunities and internal
competition, and this waste has gone largely unmeasured.
A number of methods and new thinking developed organically through within-industry
competition that would distinctly fall within the Lean paradigm. Although these are not
identified as ‘Lean’ by the industry, it shows that there are several Lean methods and
practices that have been deployed intuitively within the industry, while other principles and
methods or tools are intrinsically problematic (table 4-1).
TABLE 4 -1 : INTUITIVE AND PROBLEMATIC LEAN PRACTICES WITHIN THE PIPFRU IT INDUSTRY
Intuitively developed methods/practices Problematic methods/practices
Exporter customer value identification Customer identification (grower or consumer) Growing larger/smaller fruit with higher/normal colour
Disconnect between grower pack-out and customer value
Quick change-over in orchards during harvesting and packhouses during packing
Just-In-Time (JIT) production for seasonal industry with a one year production cycle
Load-levelling, reducing overburdening Even flow and overburdening
Walking the shop floor Adapting to the market with lead-times of 12 years for new varieties
Mistake/error proofing Exporter communication of customer requirements after pruning and thinning
Manipulating natural resources
Conversely, the review evidences that the industry has both necessary and unnecessary waste
through regulatory requirements. A generally accepted example is the protocol to get access
to the Australian market which industry stakeholders find unrealistic, demanding a number of

Page 157 of 372
steps that do not contribute to phytosanitary security. If the regulator is unaware of Lean
principles, it is not within his/her purview to bring these into bearing, affecting a number of
industry processes by introducing regulatory waste. Regulatory waste is outside the scope of
this inquiry and is only discussed where it impacts industry operations.
4.4. Findings from consultant interviews and the second objective
Twenty-six consultants were approached using the list of consultants established with the
help of NZTE, Pipfruit NZ and a web-based search (Appendix 5). All consultants are in the
public domain. Some consultants preferred to receive the questions in advance and were sent
the semi-structured interview questions (Appendix 8) by email or traditional mail (one
consultant). Relevant findings are presented in the following paragraphs and discussed in
chapter 5.
4.4.1. Consultant response rate
Twenty-one consultants out of the group of twenty-six were prepared to answer questions, a
response rate of 80.77%. Of the twenty-one respondents, sixteen respondents were happy to
be named in the study in relation to their responses, while one respondent preferred to
remain anonymous and two would prefer to read the report first. Two respondents did not
answer the question and are considered to prefer anonymity for their protection. None
objected against being on a list as per appendix 5.
4.4.2. Consultant responses
The following tables summarise the responses
from consultants in key words. Where
elaboration is considered useful, more complete
answers are tabled. Table 4-2 shows how
consultants saw their activities in relation to
training, consulting, coaching, and supporting, assessing and researching.
TABLE 4-2: ACTIVITY FOCUS OF CONSULTANTS.
Does your business train, consult, do both or different?
Train 20 Consult 14
Coach 5
Support/assessment/research 1
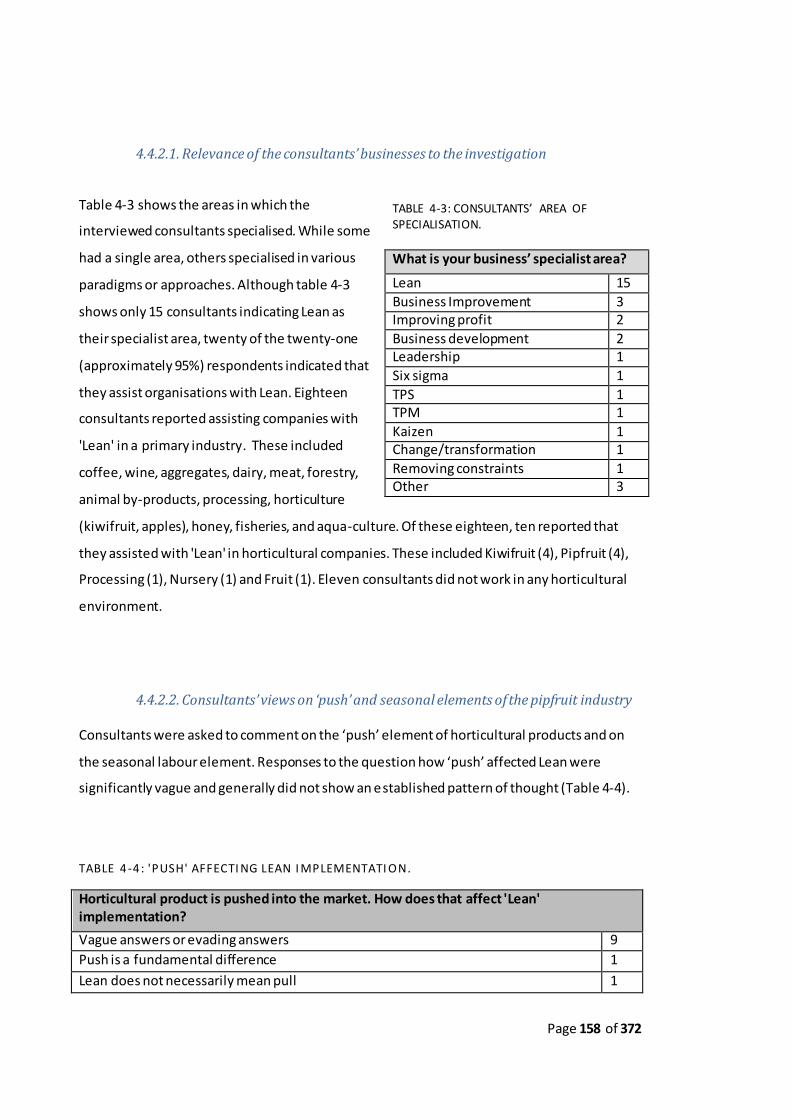
Page 158 of 372
4.4.2.1. Relevance of the consultants’ businesses to the investigation
Table 4-3 shows the areas in which the
interviewed consultants specialised. While some
had a single area, others specialised in various
paradigms or approaches. Although table 4-3
shows only 15 consultants indicating Lean as
their specialist area, twenty of the twenty-one
(approximately 95%) respondents indicated that
they assist organisations with Lean. Eighteen
consultants reported assisting companies with
'Lean' in a primary industry. These included
coffee, wine, aggregates, dairy, meat, forestry,
animal by-products, processing, horticulture
(kiwifruit, apples), honey, fisheries, and aqua-culture. Of these eighteen, ten reported that
they assisted with 'Lean' in horticultural companies. These included Kiwifruit (4), Pipfruit (4),
Processing (1), Nursery (1) and Fruit (1). Eleven consultants did not work in any horticultural
environment.
4.4.2.2. Consultants’ views on ‘push’ and seasonal elements of the pipfruit industry
Consultants were asked to comment on the ‘push’ element of horticultural products and on
the seasonal labour element. Responses to the question how ‘push’ affected Lean were
significantly vague and generally did not show an established pattern of thought (Table 4-4).
TABLE 4-4 : 'PUSH' AFFECTI NG LEAN I MPLEMENTATI ON.
Horticultural product is pushed into the market. How does that affect 'Lean' implementation?
Vague answers or evading answers 9
Push is a fundamental difference 1
Lean does not necessarily mean pull 1
TABLE 4-3: CONSULTANTS’ AREA OF SPECIALISATION.
What is your business’ specialist area?
Lean 15
Business Improvement 3 Improving profit 2
Business development 2 Leadership 1
Six sigma 1
TPS 1 TPM 1
Kaizen 1 Change/transformation 1
Removing constraints 1 Other 3

Page 159 of 372
Upstream activities are still pulled 1
Apply only what makes sense 1
The supermarket concept helps with pull 1
There can be pull from the orchards to avoid stressing the packhouse/coolstores 1
Lean accepts push and buffers to smooth the flow 1
Lean principles apply in every industry 1
You cannot be Lean and push 1
Focus on waste, not on push 1
Push industries should consider their process as high peak pull and focus on improving that
1
Don’t know 1
Consultants agreed substantially on Lean elements that could be emphasised in a seasonal
environment. These elements were standardisation, training and visual management (Table 4-
5).
TABLE 4-5: SUMMARY VIEW OF LEAN EMPHASIS FOR SEASONAL INDUSTRIES.
Similarly, consultants agreed substantially when asked to give a ‘weight’ to philosophy or
tools. Only one consultant stated that tools were more important than philosophy. All others
felt that philosophy was an absolute requirement or needed to be integrated with tools, but
without philosophy Lean would fail (table 4-6).
TABLE 4 -6 : PHILOSOPHY OR TOOLS/METHODS?
WHAT WORKS BETTER: PHILOSOPHY OR TOOLS/TECHNIQUES?
Integrated 13
Philosophy 7
Tools/techniques 1
Horticultural industries have some 80% seasonal workers. How does that affect 'Lean' implementation?
Call for Standardisation 10 Call for Training 9
Call for Visual management 4 Other responses (not mentioning standardisation, training or visual management) 4

Page 160 of 372
4.4.2.3. Consultants’ views on Lean and other business improvement models
Of the twenty-one respondents, twenty agreed
that Lean could add value to the NZ pipfruit
industry. Almost without exception responses
were definitive, mostly phrased as ‘absolutely’
and ‘without a doubt’.
Asked if there were other models that they
would recommend to be used by horticultural
organisations rather than or in addition to
'Lean', a number of models were mentioned
(table 4-7). Lean and Six Sigma appeared to be
the obvious preferences by consultants,
followed by Kaizen, TQM and TOC. A number of
consultants (7) recommended no other approach but Lean.
4.4.2.4. Consultants estimates on Lean implementation in NZ and the pipfruit
industry
Consultants were asked what proportion of NZ companies would be ‘seriously Lean’. This
question was narrowed down asking consultants which proportion of NZ horticultural
companies was ‘seriously Lean’. The definition of ‘seriously Lean’ was deliberately left open to
provoke rich answers rather than merely a percentage. Consultants agreed that a low
percentage (averaging 3.3%) might be seriously Lean. The range of these estimates was
between 0% and 10%. Focussing on the horticultural industry, consultants agreed that an
even lower percentage of these was ‘seriously Lean, averaging 1.3% with a range from 0% to
5%.
4.4.2.5. Consultants closing comments
Finally, consultants were asked if they had any closing comments. A summary of closing
comments is presented in table 4-8. Comments are random and flowed from the interview’s
line of questions and the consultant’s responses.
Table 4-7: OTHER MODELS RECOMMENDED BY CONSULTANTS.
Other recommended models?
None 7
Six Sigma 5
Kaizen 3
TQM 3
TOC 3
TPM 2
Eclectic approach 1
Best Practice 1
Supply Chain 1

Page 161 of 372
TABLE 4-8: CONSULTANTS’ CLOSING COMMENTS.
Closing comments
Engaging management can be a problem 3
Some companies do 5-S and call themselves Lean 1
Small & medium size companies are easier to engage; the relative cost benefit is lower 2
NZ needs all the help it can get to compete with mass producers; Lean and agile are key 1
Significant opportunity once over the ‘seasonal’ issue and changed attitude 1
Lean is a complete paradigm; tools alone will not work 1
Removing waste through training and maintenance is key 1
The level of training in NZ is rather thin 1
Kaizen to improve waste and flow offers significant opportunities 1
4.4.3. Consultant synopsis
Generally, all respondents assisted customers with Lean implementation. Several assisted
companies in the primary industry but further questioning established that most of these
were active in the food processing section. Some consultants responded that they had worked
in the kiwifruit and apple industries. Further investigation resolved that three consultants had
actively worked in the kiwifruit industry, one as trainer and two as consultant. Similarly, while
several consultants claimed to have done some work in the pipfruit industry, only two
consultants actively worked in the pipfruit industry. Both of these consultants and their work
are known to the researcher. Other consultants had done minor assessments and did not
claim to have affected the companies that they visited.
The interviews with consultants show that there is little knowledge of positive
implementation of Lean in the NZ pipfruit industry and the wider horticultural industry. The
outcome from the consultant interviews confirm the ‘state -of-the-industry’ and contribute to
achieve objective two: ‘Identify and analyse the current Lean deployment within the NZ
pipfruit industry’.
Of the 500+ stakeholders, there are very few companies that are implementing Lean, while all
consultants agree that Lean will add value to each operation.

Page 162 of 372
4.5. Findings from stakeholder survey and the second objective
A sample of 150 Stakeholders were approached via email, receiving a single multiple -choice
question each day to respond to. 140 Stakeholders were counted as the sample due to
double-ups and stakeholders requesting to be withdrawn. The following section summarises
the responses from the stakeholders.
4.5.1. Stakeholder response rate
The initial response rate to the industry-wide survey averaged 23.88%. This response rate is
considered satisfactory given the length of the questionnaire, the relevance of the subject and
the declining response rates to surveys over the years (Sheehan, 2006). On completion of the
survey, feedback was given to participants including the missed questions. Several
participants then returned answers to the missed questions. This helped to increase response
rates (Heberlein & Baumgartner, 1978), lifting the response rate to 24.56%.
4.5.2. Stakeholder responses
4.5.2.1. Respondent company management intent
Ten questions inquired about current Lean knowledge of each respondent company, intent of
the company and some of the company’s beliefs concerning change. One question concerning
Lean knowledge was used as a pre- and post-survey question to measure if the questionnaire
itself had made a difference in respondent perception. The result of the pre - and post-survey
question is presented in figure 4-1. Results indicate that respondents rated their knowledge of
Lean relatively higher before the survey than they did on completion of the survey.

Page 163 of 372
4.5.2.2. Kobayashi criteria
The 2012 industry stakeholder survey showed a low level of realisation of the Kobayashi
criteria within the broader industry.
23%
34%
23%16%
5%
29%
52%
16%3%
0%0%
10%
20%
30%
40%
50%
60%
No ‘Lean’ knowledge
Li ttle ‘Lean’ knowledge
Moderate ‘Lean’ knowledge
Reasonable level of ‘Lean’
knowledge
Extens ive ‘Lean’ knowledge
Stakeholders' own assessment of their Lean knowledge pre-survey and post-survey (2012)
Pre-survey self-assessment Post-survey self assessment
FIGURE 4 -1 : STAKEHOLDER PRE- AND POST-SURVEY SELF-ASSESSMENTS OF LEAN K NOWLEDGE.

Page 164 of 372
FIGURE 4-2: KOBAYASHI KEYS LEVEL OF IMPLEMENTATION – WIDER INDUSTRY STAKEHOLDER SCORES (2012).
Table 4-9 shows the relative distribution of responses to the Kobayashi statements, indicating
a low level of achievement of the Kobayashi keys.
TABLE 4-9 : PERCENTAGE DI VI SI ON OF RESPONSES TO KO BAYASHI STATEMENTS .
All Kobayashi self-assessments, all responses
1. No, not at all
2. We do this sometimes or do some of this
3. We are truly halfway organised as in the statement above
4. We usually do this or we do most of this
5. Yes, always 100%
29.9% 45.1% 12.9% 10.2% 2.0%
0
1
2
3
4
5
6
Industry stakeholder scores: 20 Kobayashi keys (2012)
5- Yes, always, 100% 4- Usually or most of this 3- Truly halfway 2- Sometimes or some of this 1- No, not at all

Page 165 of 372
4.5.2.3. Lean principles, methods and tools
The industry survey from 2012 presented a list of 20 common Lean principles, methods and
tools to assess knowledge and use of these within the wider industry. The mean industry
results are presented in figure 4-3.
FI GURE 4-3 : LEAN TOOLS KNOWLED GE AND USE: WI DER I NDUSTRY STAKEHOLDER SCORES
(2012).
A more defining picture is displayed in table 4-10. Table 4-10 shows the percentage of
responses to indicate the percentage of the industry that is familiar and uses principles,
methods and tools. Of the 20 principles, methods and tools, only 8.6% were used regularly or
all the time. 81.7% of all principles, methods or tools was either unknown or not used. This
indicates that the industry is largely ignorant of Lean or does not see the benefit of
implementing Lean principles, methods and tools.
0
1
2
3
4
5
Industry stakeholder scores: Lean methods & tools (2012)
4- Use a ll the time
3- Use regularly
2- Use sometimes
1- Never used
0- Don't know what i t i s

Page 166 of 372
TABLE 4 -1 0 : SK EWING TOWARDS ‘ NOT KNOWING ’ LEAN PRINCIPLES, METHODS AND TOOLS.
All principles, methods and tools, self-assessment, all responses
Don't know what it is
Never Used Use sometimes Use Regularly Use all the
time
62.2% 19.5% 9.7% 6.7% 1.9%
4.5.3. Stakeholder survey synopsis
It is clear from the initial industry survey that the level of Lean implemented in the NZ pipfruit
industry was relatively low at the time the inquiry started. This includes any organically
developed methods and tools as the Kobayashi criteria simply described a state of
organisation with which respondents could agree or disagree using the 5-point Likert scale.
These findings confirm that the level of Lean deployment within the NZ pipfruit industry is low
at the time of the survey, and it substantially achieves the second objective of the inquiry.
4.5.4. Findings from action research and the third objective
This section reports on the findings from the two action research (AR) organisations
participating in the inquiry. The action research orchard group is abbreviated as ARO, while
the action research packhouse is abbreviated as ARP. Findings relate to survey results,
interviews and observations.
4.5.5. Guideline for reading the graphs in the results section
This section contains a number of graphs that present results. The graphs relating to the
progress of the research company—in relation to the baseline—are standardised as follows:
The baseline is a double continuous line, representing either the start of the inquiry
for the research company (company colour) or the industry position in 2012 (blue)
The 2013 result is a blocked line
The 2014 result is a dotted line
The Action Research Orchards (AROs) are represented by the colour green

Page 167 of 372
The Action Research Packhouse (ARP) is represented by the colour orange
The Case Study Packhouse with a champion (CSP) is represented by the colour blue
The Case Study Packhouse with Consultant (CSPC) is represented by the colour red.
Other graphs, not representing the progress of research companies to the baseline, may use
the colours relating to the research companies.
Note regarding the use of graphs: Bar graphs are commonly used to compare positions
between different elements while line graphs are commonly used to indicate trends and
developments. However in the next section, the scores for the Lean assessments are
expressed as line graphs which are considered to provide a better overview. All coded and
categorised items from the action research and case study interviews are expressed in
horizontal bar graphs.
4.5.6. Action research orchards
Data collection for the action research companies involved multiple visits. Visits were typically
one to two hours during which information exchange took place and the researcher could
offer Lean knowledge or suggestions and the company could respond through undertaking
action.
4.5.6.1. Action Research Orchards (ARO) progress measurement
The industry stakeholder survey from the end of 2012 showed a low level of realisation of the
Kobayashi criteria within the wider industry. The same criteria from the survey were used to
assess the action research and case study orchards and packhouses (including their
coolstores) after the first full season of engagement (2013), and again at the end of the
harvest and packing season in the following year (2014). The results are presented in figure 4-
4.
It is clear from figure 4-4 that the research orchards made solid progress, up from the broader
industry status. The continued progress in the second year of engagement gives rise to the
supposition that Lean works for orchard organisations.

Page 168 of 372
Similar to the Kobayashi criteria, respondents indicated their familiarity and use of a set of
common Lean principles, methods and tools. The progress of the research ARO in relation to
the wider industry is presented in figure 4-5.
FIGURE 4 -4 : ARO K OBAYASHI K EYS- COMPARISON BETWEEN INDUSTRY AND ACTION RESEARCH
ORCHARD PROGRESS ( 201 2-201 4).
The action research orchards demonstrated an increased knowledge and use of the common
Lean principles, methods and tools in relation to the wider industry surveyed one and two
years earlier (figure 4-5).
0
1
2
3
4
5
ARO vs Industry: Kobayashi keys (2012-2014)
Industry Mean 2012 ARO 2013 ARO 2014
5- Yes, always, 100% 4- Usually or most of this 3- Truly
halfway 2- Sometimes or some of this 1- No, not at all

Page 169 of 372
FIGURE 4 -5 : ARO K NOWLEDGE AND US E OF LEAN PRINCIPLES , METHODS & TOOLS -
COMPARISON BETWEEN I NDUSTRY AND ACTION RESEARCH ORCHARD PROGRESS (2 012 -20 14) .
The ARO was assessed using the Tapping et al (2002) Lean assessment at the start of the
inquiry, at the end of the first season and again at the end of the second season. Scores for
the three assessments are found in figure 4-6.
FIGURE 4 -6 : ARO WEIGHTED LONGITU DINAL LEAN ASSESSMENT IN 2 012 , 20 13 AND 2 01 4.
0
1
2
3
4
5
ARO vs Industry: Principles methods and tools (2012-2014)
Industry Mean 2012 ARO 2013 ARO 2014
02468
10121416
Wei
ghte
d sc
ores
Lean assessment criteria (Tapping et al, 2002)
ARO scores Pre-Lean (2012), 2013 & 2014 (Tapping et al, 2002)
ARO Pre-Lean ARO 2013 ARO 2014
4- Use all the time 3- Use regularly
2- Use sometimes 1- Never used 0- Don't know what it is
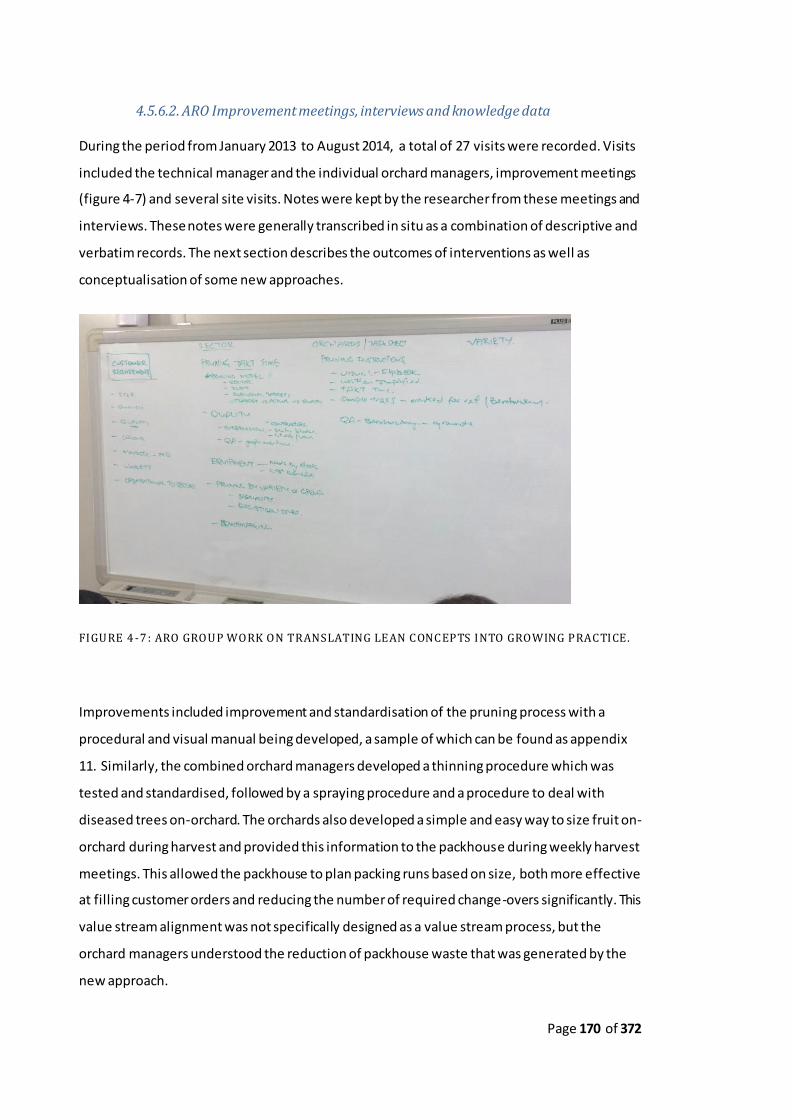
Page 170 of 372
4.5.6.2. ARO Improvement meetings, interviews and knowledge data
During the period from January 2013 to August 2014, a total of 27 visits were recorded. Visits
included the technical manager and the individual orchard managers, improvement meetings
(figure 4-7) and several site visits. Notes were kept by the researcher from these meetings and
interviews. These notes were generally transcribed in situ as a combination of descriptive and
verbatim records. The next section describes the outcomes of interventions as well as
conceptualisation of some new approaches.
FIGURE 4 -7 : ARO GROUP WORK ON TRANSLATING LEAN CONCEPTS INTO GROWING PRACTICE.
Improvements included improvement and standardisation of the pruning process with a
procedural and visual manual being developed, a sample of which can be found as appendix
11. Similarly, the combined orchard managers developed a thinning procedure which was
tested and standardised, followed by a spraying procedure and a procedure to deal with
diseased trees on-orchard. The orchards also developed a simple and easy way to size fruit on-
orchard during harvest and provided this information to the packhouse during weekly harvest
meetings. This allowed the packhouse to plan packing runs based on size, both more effective
at filling customer orders and reducing the number of required change-overs significantly. This
value stream alignment was not specifically designed as a value stream process, but the
orchard managers understood the reduction of packhouse waste that was generated by the
new approach.

Page 171 of 372
4.5.6.3. Coding and categorising ARO data
All records from meetings and interviews were coded manually, using key words that linked to
Lean, were repetitive or appeared significant. After the coding, the individual codes were
tabulated and key themes emerged. A number of codes were associated with applicability of
Lean, while another group of codes was associated with implementation of Lean. A third
group of codes was more related to industry issues and the inquiry itself. Consequently, the
researcher decided to group the codes in three groups of categories:
1. Applicability group, aiming to support the third objective and possibly complementing
the second objective;
2. Implementation group, aiming to support the third objective;
3. Other key elements group that was formed inductively and sorted iteratively.
After the records of meetings and interviews had been coded and keywords identified, the
keywords were then grouped to the three groups in table 4-11.
TABLE 4 -1 1 : K EYWORD GROUPS ESTABLISHED TO ASSIST ANALYSIS
A: Lean elements to triangulate with applicability using Tapping et al (2002)
I: Lean elements to triangulate with implementation
O: Other elements
1 Cultural Awareness Change Finance, cost, budget
2 WP Organisation & Visual Management
Difficulty & Failure Lean theory development
3 Standardised Work Achievement Complexity of the industry 4 Flexible Operations Knowledge, Experience &
Training Measurement, Indicators
5 Continuous Improvement Method (champion, consultant, researcher)
Competition
6 Error Proofing Management, commitment
Customer
7 Quick Changeover Capability People (staff) Technology, mechanical failure
8 Total Productive Maintenance
Motivation Operational issues
9 Material Control Communication Researcher, intervention
10 Level Production Season, effect of Undefined

Page 172 of 372
An example of the coding system is given in table 4-12. Names and identifying features have
been removed from the recorded notes. Notes are from observations, interviews and
meetings. Each number in the three right-hand columns corresponds with the identically
numbered element in the keyword groups (table 4-11), where ‘A’ is applicability etc.
TABLE 4 -1 2 : SAMPLE OF RECORDS, ALLOCATED K EY WORDS OR CODES AND CATEGORISATION
( ALL ACTION RESEARCH AND CASE STUDY SAMPLES)
Recorded notes (sample) Key words / Codes
‘A’ ‘I’ ‘O’
He describes a management area where Royal Gala (an apple variety) is retained for harvest management. This is done purely to even the flow for labour.
Flow of labour 10
One orchard manager mentions that they need to know the customer requirements in June, possibly in May. All agree!! It is then proposed that the customer is the exporter; that the exporter is the link between the final customer and the grower. So they are going to consider the exporter to be the customer. They need to know variety, size, colour, quality and market status at the time of pruning, in June.
Customer value, integration of information, complexity, value stream
1 3, 6
They come with a suggestion to use new bins for sensitive varieties because there is less chance of damaging the apples in a new bin.
8
Over the next few weeks, orchards are very busy with harvest. The question is how much time there will be for any improvement trials.
Overburdening implementation difficulty
10 2
They have thought of a simple idea, i.e. clipboards that can be hung from a bin in the coolstore. Right now they staple information sheets to the front bin, but every time there is a movement of bins, they have to remove the sheet and staple it to the next front bin. Clipboards that can be hung will make this process much quicker. One of the problems they are having is that (because of the extra effort required), the forklift drivers are not keeping the sheets up to day which then makes it harder to find bins in a coolstore where regular movements are required.
Visual management, improvement
2, 5
This year has been fantastic in terms of locating bins. Last year we lost between 300 to 400 bins. We don’t hear any more that we have lost bins. We have improved our process and this year, I have only heard it once that they could not find bins.
improvement, lost bins
5
We have learned a lot about how to operate our plant e.g. Kanban has been very successful. It has made ordering easy and is visual.
Kanban, knowledge increase, visual
9, 2
4

Page 173 of 372
Not much waiting at the moment. It is not as bad as it was so has improved. They improved their line changes from say 5 minutes to 1 minute. Exporter changes used to be 10 or 15 minutes and are now 5 minutes. The operator broadcasts the times of line changes.
Quick change-over, waste reduction
7
Now that they are doing preventative maintenance, they have found out that they are lacking a lot of information because they relied on people’s memories. Now they are recording the maintenance they do. The recording is an extra effort because they have to go and wash their hands before recording and that is an extra effort.
TPM, standardising
3, 8
Applicability Group: The ARO showed the following graph (figure 4-8) for the applicability
group:
FIGURE 4 -8 : ARO LEAN APPLICABILITY ELEMENTS FROM MEETINGS AND INTERVIEWS ( 201 3-
2 0 1 4 ) .
The ARO showed a significant focus on improvement and workplace organisation. The
majority of workplace organisation scores related to 5-S items, particularly visual
management and developing procedures. The procedures were then standardised, creating a
relevantly high score. The level production score was relatively high because all comments
11
33
22
14
54
1
0
6
6
16
0 10 20 30 40 50 60
Cultural Awareness
WP Organisation & Visual Management
Standardised Work
Flexible Operations
Continuous Improvement
Error Proofing
Quick Changeover Capability
Total Productive Maintenance
Material Control
Level Production
Frequency
App
licab
ility
ARO applicability elements from meetings and interviews (2013-2014)
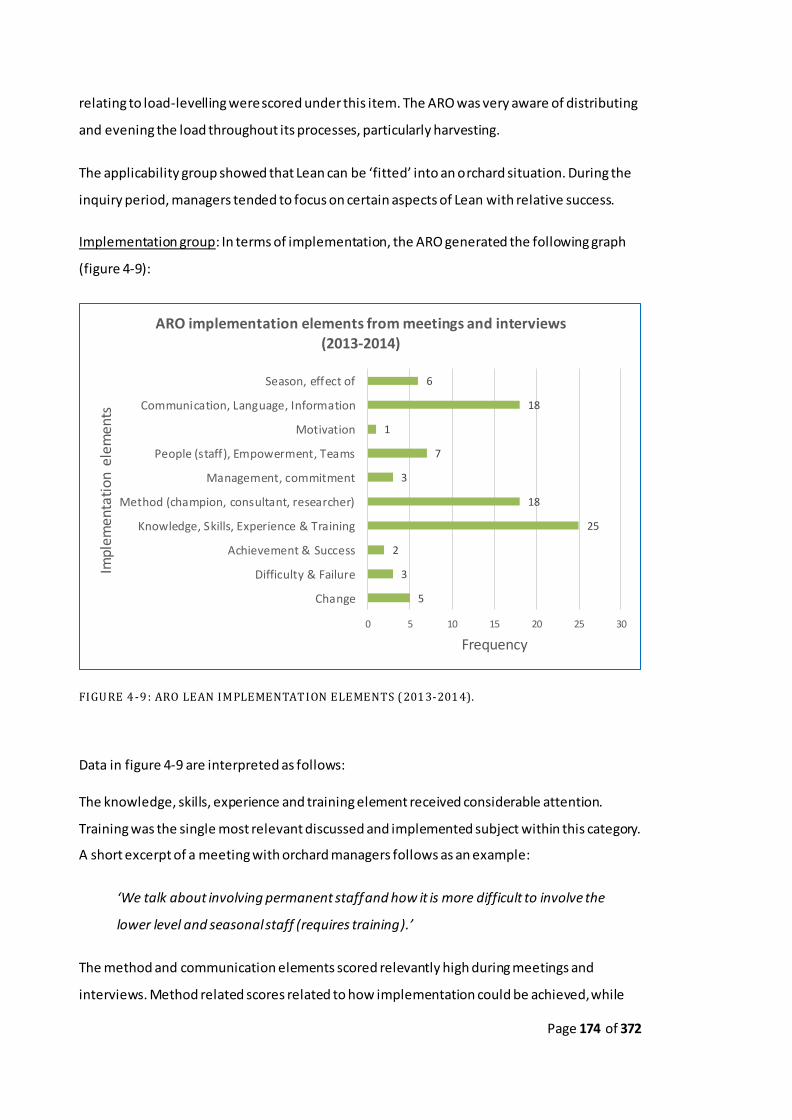
Page 174 of 372
relating to load-levelling were scored under this item. The ARO was very aware of distributing
and evening the load throughout its processes, particularly harvesting.
The applicability group showed that Lean can be ‘fitted’ into an orchard situation. During the
inquiry period, managers tended to focus on certain aspects of Lean with relative success.
Implementation group: In terms of implementation, the ARO generated the following graph
(figure 4-9):
FIGURE 4 -9 : ARO LEAN IMPLEMENTATION ELEMENTS ( 201 3-201 4).
Data in figure 4-9 are interpreted as follows:
The knowledge, skills, experience and training element received considerable attention.
Training was the single most relevant discussed and implemented subject within this category.
A short excerpt of a meeting with orchard managers follows as an example:
‘We talk about involving permanent staff and how it is more difficult to involve the
lower level and seasonal staff (requires training).’
The method and communication elements scored relevantly high during meetings and
interviews. Method related scores related to how implementation could be achieved, while
5
3
2
25
18
3
7
1
18
6
0 5 10 15 20 25 30
Change
Difficulty & Failure
Achievement & Success
Knowledge, Skills, Experience & Training
Method (champion, consultant, researcher)
Management, commitment
People (staff), Empowerment, Teams
Motivation
Communication, Language, Information
Season, effect of
Frequency
Impl
emen
tati
on e
lem
ents
ARO implementation elements from meetings and interviews (2013-2014)

Page 175 of 372
communications related scores related to actual information flow between grower, packer
and exporter, use of information software and geographical separation of the orchards.
‘Season’ was scored six times, all in relation to the difficulties caused by seasonality of the
industry. ‘Difficulty & Failure’ was scored at times when the orchard managers did not
manage to implement what was discussed, while ‘Achievement and Success’ was scored when
there was a significant achievement. Improvements were generally scored under the
‘applicability’ group to indicate that methods or tools were cons idered or worked.
The implementation group showed that Lean can be implemented in orchards and that
training, communication and method appeared to get relatively high attention.
Other elements group: The ‘other elements’ group scored items that appeared to have some
relevance for the inquiry (figure 4-10). The researcher intervention scored relatively high as
training and ideas were scored each time as researcher intervention.
FIGURE 4 -1 0 : OTHER ELEMENTS CO DING GROUP SCORES (2 013 -2 014 ).
Of interest is the Lean theory development category that signifies that the ARO and
researcher were attempting to develop Lean theory from the meetings and discussions
around Lean in the orchard. These discussions merit a separate heading and are found in
14
42
12
17
0
4
1
4
50
0
0 10 20 30 40 50 60
Finance, cost, budget
Lean theory development
Complexity of the industry
Measurement, Indicators
Competition
Customer
Technology, mechanical failure
Operational issues
Researcher, intervention
Undefined
Frequency
Oth
er e
lem
ents
ARO 'other elements' from meetings and interviews (2013-2014)

Page 176 of 372
paragraph 4.6.2.5. Other categories such as finance, measurement and industry complexity
returned regularly and play a role in any pipfruit business.
4.5.6.4. ARO observations
The general observations demonstrated that managers worked on improvement during the
off-season but were absorbed almost entirely by the harvest season during which
improvements were found difficult to implement. Several examples are presented:
One orchard manager observed that on half a dozen occasions each ye ar, tractors needed to
fill up diesel only to find out that all four tanks on the orchard were empty, leading to
significant delays in harvesting and a lot of frustration. Having discussed this with his staff,
they came up with a simple system to show the status of the tank and which tank should be
used for refuelling (figure 4-11). Although nothing special, without the Lean implementation
efforts, the system would have remained unchanged. It is noteworthy that one of the
supervisors for this thesis asked what the colours meant. Having passed this on to the orchard
manager, he replied “I understand what you mean. To improve it further a key would be a
great idea. It’s all about constant improvement.”
Another orchard manager had an attachment built for his on-orchard forklift to unload bins of
trucks twice as fast. In his estimation, the time saving is around 65% ( figure 4-12). A third
FIGURE 4 -1 1 : THE INFLUENCE OF LEAN - A SIMPLE MONITORING SYSTEM AVOIDING WASTE.
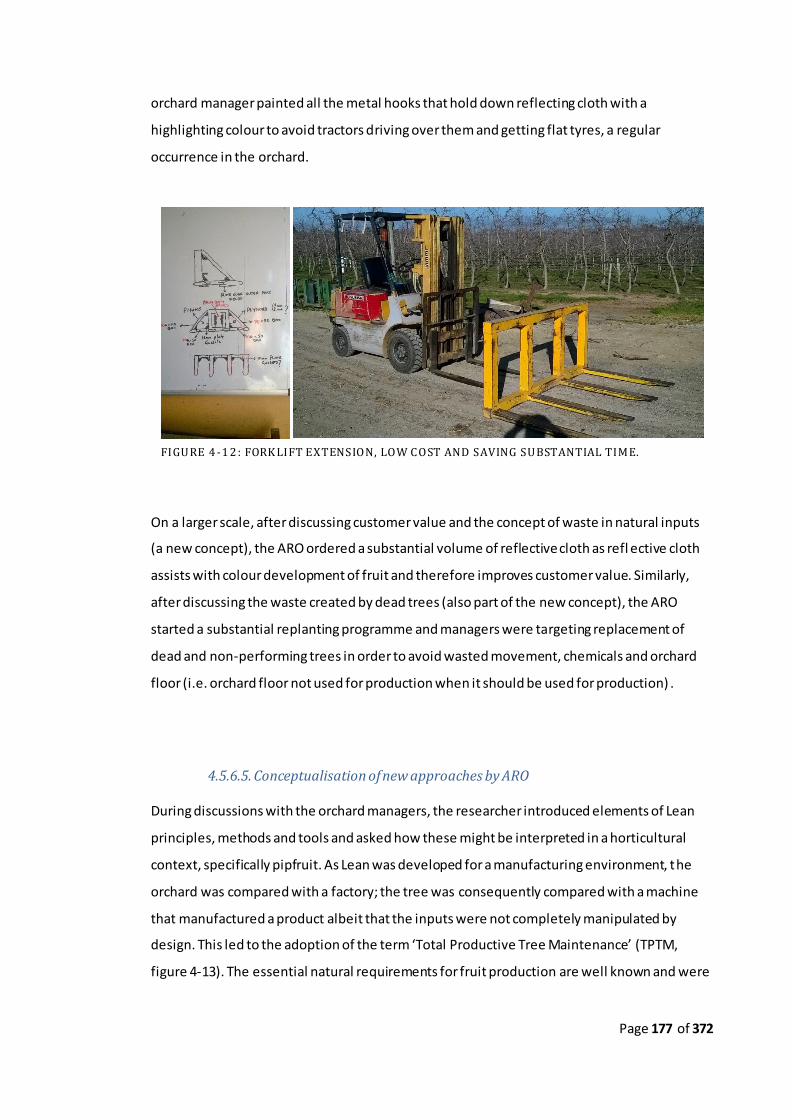
Page 177 of 372
FIGURE 4 -1 2 : FORK LIFT EXTENSION, LOW COST AND SAVING SUBSTANTIAL TIME.
orchard manager painted all the metal hooks that hold down reflecting cloth with a
highlighting colour to avoid tractors driving over them and getting flat tyres, a regular
occurrence in the orchard.
On a larger scale, after discussing customer value and the concept of waste in natural inputs
(a new concept), the ARO ordered a substantial volume of reflective cloth as refl ective cloth
assists with colour development of fruit and therefore improves customer value. Similarly,
after discussing the waste created by dead trees (also part of the new concept), the ARO
started a substantial replanting programme and managers were targeting replacement of
dead and non-performing trees in order to avoid wasted movement, chemicals and orchard
floor (i.e. orchard floor not used for production when it should be used for production) .
4.5.6.5. Conceptualisation of new approaches by ARO
During discussions with the orchard managers, the researcher introduced elements of Lean
principles, methods and tools and asked how these might be interpreted in a horticultural
context, specifically pipfruit. As Lean was developed for a manufacturing environment, the
orchard was compared with a factory; the tree was consequently compared with a machine
that manufactured a product albeit that the inputs were not completely manipulated by
design. This led to the adoption of the term ‘Total Productive Tree Maintenance’ (TPTM,
figure 4-13). The essential natural requirements for fruit production are well known and were

Page 178 of 372
identified. The managers were challenged to think to what degree these natural elements
could be managed and if any use of these was not optimised. Waste was therefore discussed
in the traditional sense but also related to wasted sunlight, water, ‘real estate’ and soil (figure
4-13).
Managers were already aware of new high-density growing methods that increased
production per hectare. Managers also discussed the waste element of having a dead or low
production tree in a row of productive trees (figure 4-14). Every single pass while pruning,
thinning, spraying and harvesting was potentially a form of waste. This related to the use of
the ‘real estate’ and to wasted motion, chemicals, irrigation, sunlight and more.
FIGURE 4 -1 3 : THE ORCHARD AS A FAC TORY WITH MACHINES (TREES) REQUIRING
MAINTENANCE.
Managers already used a tool to increase the sunlight reflection but only to increase colour;
they started discussing the use of reflecting cloth to increase production. Irrigation, drainage
and soil nutrients had long been discussion points but were now seen from a waste
perspective. The concept of Total Productive Tree Maintenance (TPTM) started to take shape.
This discussion showed the beginnings of original thinking but the period of the inquiry was
not long enough to make measurable progress of any significance along these lines .

Page 179 of 372
FIGURE 4 -1 4 : ARO SHOWING DEAD TREES AS LEAN WASTE THAT MUST BE CORRECTE D.
4.5.6.6. ARO Lean audit
During the second year of the inquiry, the technical manager and the researcher discussed the
opportunity of creating a Lean audit to help orchard managers assess their development. The
researcher then developed a Lean orchard audit instrument, based on well accepted audit
formats commonly known to the industry such as BRC (British Retail Consortium) and
GlobalGAP, and adapting ideas from the measurement instruments from the literature review
such as Tapping et al (2002).
TABLE 4 -1 3 : LEAN ORCHARD AUDIT S CORING CRITERIA.
2 Visual Performance Measurement
Score
Scores to be used: Not present anywhere: 0 Found in some areas or sometimes (<25%): 1 Commonly found but not embedded (<60%): 2
Typically used with some exceptions (<85%): 3 Found everywhere, always with no exceptions (100%): 4
1
The orchard has a system that monitors, measures and records Lean performance criteria and makes these
visible to orchard staff.
Observation, documented, recorded, other
evidence (circle)
Reason for score:

Page 180 of 372
Important was the inclusion of some newly developed ideas such as orchard and tree
maintenance which are new to Lean measurement. 20 Elements, each with between one and
six criteria were formulated using standard Lean terminology from the literature review and
new elements. Each criterion was scored ranging from 0 to 4 as in table 4-13. Criteria were
weighted for relevance and the degree of manager influence by both the technical manager
and the researcher independently, and the average weight was used for the audit criteria
weights. Weights assessed between orchard manager and researcher were almost identical.
Weights varied between 1.3 and 1.5. The instrument was then tested towards the end of the
inquiry. A sample of the Lean orchard audit, the audit categories and the audit report is
attached as appendix 12.
Table 4-14 summarises the first draft audit results. With a maximum raw score of 276 and a
maximum weighted score of 395.7, the achieved scores showed a distinct level of Lean
deployment. Interestingly, the scores can also be used as benchmarks for future development.
The total score for the combination of all highest measured (weighted) scores (combining the
highest score by any orchard in any of the audit criteria) was 230.55.
Audit criteria Orchard 1 Orchard 2 Orchard 3 Orchard 4 Orchard 5 Orchard 6 Mean score
1 Visual Management 13.28 16.23 8.85 17.70 10.33 11.80 13.03
2 Visual Performance Measurement 1.50 0.00 0.00 3.00 3.00 6.00 2.25
3 Workplace Organisation (Sort, Straighten, Shine) 13.28 13.28 2.95 14.75 8.85 7.38 10.08
4 Standardising Work 4.43 5.90 2.95 5.90 7.38 11.80 6.39
5 Orchard Lay-out 2.60 1.30 1.30 1.30 0.00 1.30 1.30
6 Improvement of the Lean Orchard Concept 2.80 1.40 0.00 4.20 1.40 2.80 2.10
7 Error Proofing (Preventing Human / Method Errors) 10.50 6.00 1.50 12.00 3.00 1.50 5.75
8 Quick Change-over (Quick Set-up) 20.63 20.63 20.63 20.63 20.63 20.63 20.63
9 Operational Flexibility (Process and Employee) 16.50 16.50 16.50 16.50 16.50 16.50 16.50
10 Orchard and orchards Team work 8.85 7.38 4.43 11.80 8.85 11.80 8.85
11 Total Productive Equipment Maintenance 22.13 22.13 22.13 22.13 22.13 22.13 22.13
12 Total Productive Tree Maintenance 8.85 7.38 7.38 11.80 8.85 8.85 8.85
13 Total Even Production Orchard 8.55 7.13 7.13 8.55 7.13 8.55 7.84
14 Production Information flow and accuracy 13.05 13.05 13.05 13.05 13.05 13.05 13.05
15 Pull Systems (Material and People) 11.60 11.60 11.60 11.60 11.60 11.60 11.60
16 Waste 1.45 1.45 0.00 2.90 1.45 4.35 1.93
17 Lean Disciplne 4.50 1.50 0.00 6.00 3.00 3.00 3.00
18 Continuous Improvement (Small, Regular, by all) 9.00 4.50 0.00 16.50 7.50 12.00 8.25
19 Work-Culture Awareness (Customer Focus-Awareness) 4.28 2.85 4.28 4.28 4.28 14.25 5.70
20 Management Support 4.35 1.45 1.45 4.35 4.35 4.35 3.38
182.10 161.63 126.10 208.93 163.25 193.63 172.60
TABLE 4 -1 4 : RESULT OF INITIAL LE AN ORCHARD AUDIT ( FIRST DRAFT).

Page 181 of 372
The Lean orchard audit instrument was analysed after the conclusion of the field work period
and it is the intention of the orchard group to simplify the instrument and make it easier to
understand and implement to guarantee its future value to the orchard group, however this
could not be accomplished during the course of this inquiry.
4.5.6.7. ARO, a final orchard manager questionnaire
At the end of the inquiry, a final questionnaire was answered by orchard managers to relay
their experience and thoughts about the implementation of Lean in their field. Orchard
managers answered free-text questions about their experiences and indicated on a 5 point
Likert scale (table 4-15) to what degree they found a number of Lean elements suitable and
implementable in an orchard environment.
Key findings of the final survey of orchard managers were:
1. Orchard managers believed that there was a definite place for Lean on orchards.
2. The greatest benefits were found in tidiness, error proofing and waste reduction, as
well as team culture through a focus that everyone can help to improve.
3. The greatest downfalls were believed to be the seasonal staff and general buy-in but
also trying to fit Lean principles that do not fit.
4. Orchard managers generally experienced the action research period as ‘pretty good’,
with some struggles as well as benefits.
5. Orchard managers believed that it might take between a few years and a number of
years to achieve the 85% audit mark. A comment was made that Lean had to be
embedded before getting some traction.
6. The seasonality of the industry plays a significant role; some indicated that this can be
mitigated or is sometimes used as an excuse.
7. The orchard managers agreed with the new interpretations of Lean for the orchards.
They believed that Lean had offered a different perspective to help improve their
operations.
8. The audit was found to be too long and in need of simplification but orchard
managers also decided that the instrument could be developed further.

Page 182 of 372
TABLE 4 -1 5 : ARO - APPLICABILITY AND IM PLEMENTABILITY SCORE S.
Applicability score: Implementability score: 0 – Not suitable 1 – Marginally suitable 2 – Reasonably suitable 3 – Very suitable 4 – 100% Suitable
0 – Cannot be implemented 1 – Difficult to implement 2 – Reasonably implementable 3 – Relatively easy to implement 4 – Extremely easy to implement
The results of the final questionnaire are listed in figure 4-15.
FIGURE 4 -1 5 : ARO – ORCHARD MANAGERS’ SC ORES FOR ON-ORCHARD APPLICABILITY AND
IMPLEMENTABILITY OF LEAN ELEMENTS ( 201 4).
4.5.6.8. ARO conclusion
All indicators point towards a positive Lean deployment during these early stages of
implementation. Sustainability of results was not assessed. Results are further discussed in
chapter 5, ‘Analysis and discussion’. These findings support the third objective, ‘Analyse the
0.0 2.0 4.0 6.0 8.0
5-S: Sort, Straighten, Shine, Standardise, Sustain (C.I.)Permanent staff empowerment
Continuous improvementWaste identification & elimination
Create even production (TPTM: Total Productive…Error Proofing
Takt timeJust-in-time supplyRoot cause analysis
Visual ManagementQuick change-over
Value Stream MappingSeasonal staff empowerment
Interaction with packhouse, coolstore, exporterLoad levelling
Preventing overburdeningOverall equipment effectiveness
Problem solving, e.g. using the Plan, Do, Check Act…Toolbox meetings
Cross training
ARO - applicability and implementability of Lean elements (2014)
Applicability Implementability

Page 183 of 372
applicability and any implementation approaches of the Lean philosophy, methods and tools
within the NZ pipfruit industry’. The conceptualisation of TPTM may assist with the
development of a Lean model for the industry, the fourth objective. Similarly, the
development of a Lean orchard audit instrument may be helpful to assist orchard managers
with Lean implementation in the future.
4.5.7. Action research packhouse
4.5.7.1. Action Research Packhouse (ARP) progress measurement
Similar to the action research orchards, the action research packhouse was assessed using the
20 Kobayashi keys, 20 common Lean principles, methods and tools and Tapping et al (2002)
Lean assessment. Results are presented in figures 4-16, 4-17 and 4-18 respectively.
FIGURE 4 -1 6 : KOBAYASHI KEYS: COMP ARISON BETWEEN INDUSTRY AND ACTION RE SEARCH PACK HOUSE PROGRESS (2 012 -2 014) .
The action research packhouse (ARP) demonstrated an improved level of Kobayashi best
practices, particularly after the second packing season (figure 4-16). The ARP also
demonstrated an increased knowledge and use of the common Lean principles, methods and
0
1
2
3
4
5
6
ARP vs Industry: Kobayashi keys (2012-2014)
Industry Mean 2012 ARP 2013 ARP 2014
5- Yes, always, 100% 4- Usually or most of this 3- Truly halfway 2- Sometimes or some of this 1- No, not at all

Page 184 of 372
tools in relation to the wider industry surveyed one and two years earlier (figure 4-17).
Progressing through the inquiry, the ARP demonstrated similar progress on the Tapping et al
(2002) instrument (figure 4-18).
FIGURE 4 -1 7 : ARP KNOWLEDGE AND USE OF LEAN PRINCIPLES , METHODS & TOOLS ( 2012 -
2 0 1 4 ) .
0
1
2
3
4
5
6
ARP vs Industry: Principles methods and tools (2012-2014)
Industry Mean 2012 ARP 2013 ARP 2014
5- Use all the time
4- Use regularly
3- Use sometimes
2- Never used
1- Don't know what it is

Page 185 of 372
FIGURE 4 -1 8 : ARP WEIGHTED LONGITUDINAL LEAN ASSESSMENT IN 2 01 2, 2 013 AND 201 4.
4.5.7.2. ARP Improvement meetings, interviews and knowledge data
Thirty-two action research visits to the packhouse took place between February 2013 and
August 2014. Visits included meetings with management, supervisors and workers as well as
regular observations. Visit notes were transcribed in situ as a combination of descriptive and
where relevant, verbatim records. On several occasions, planned visits did not proceed due to
seasonal pressures on the organisation. The ARP had little knowledge and understanding of
Lean and consequently sessions would regularly include explanations of Lean principles and
methods, often followed by a discussion on how this might apply to a packhouse/coolstore
organisation.
The researcher tried to maintain a cycle of discussing an issue, challenging for and
contributing to solutions, implementing these and then reflecting on the result. Several
iterative cycles were completed, relating to the implementation selection by the ARP staff.
Iterative cycles related to identifying waste in the process (e.g. appendix 16), identifying value
adding activities, implementing improvements and reflecting on their effectiveness.
0
5
10
15
20
25
We
igh
ted
sco
res
Lean assessment criteria (Tapping et al, 2002)
ARP scores Pre-Lean (2012), 2013 & 2014 (Tapping et al, 2002)
ARP Pre-Lean ARP 2013 ARP 2014

Page 186 of 372
Interview and meeting notes were coded, categorised and grouped as before, resulting in the
following three graphs (figures 4-19, 4-20 and 4-21 respectively). An example of coding of
action research and case study research organisations was presented in table 4-12.
FIGURE 4 -1 9 : ARP APPLICABILITY CODES AND RESULTS ( 20 13-201 4).
The ARP generally found workplace organisation easy to implement and it was the Lean
element most discussed, followed by discussions of continuous improvement (figure 4-19).
Level production is emphasised because all load-levelling is scored under level production.
Other elements appear to have low focus. TPM and flexible operations appear of low
relevance to the organisation.
Implementation elements (Figure 4-20) showed that knowledge, skills, experience & training
was an item of relative interest, followed by communication and information. The effect of
the season is also worth mentioning. Interest in failure appeared more frequent than interest
in achievement.
4
55
12
2
43
8
5
2
8
16
0 10 20 30 40 50 60
Cultural Awareness
WP Organisation & Visual Management
Standardised Work
Flexible Operations
Continuous Improvement
Error Proofing
Quick Changeover Capability
Total Productive Maintenance
Material Control
Level Production
Frequency
App
licab
ility
ARP applicability elements fom meetings and interviews (2013-2014)

Page 187 of 372
FIGURE 4 -2 0 : ARP IMPLEMENTATION CODES AND RESU LTS ( 201 3-201 4).
Of the other elements (figure 4-21), it appears that operational issues were discussed or
attributed regularly while researcher and intervention featured regularly as one can expect
during action research. Industry complexity also featured while no Lean theory development
took place.
FIGURE 4 -2 1 : ARP 'OTHER ELEMENTS' AS THEY FEATURED IN INTERVIEWS AND MEETI NGS
( 2 0 1 3 -20 14) .
3
10
5
24
3
4
8
1
12
8
0 5 10 15 20 25 30
Change
Difficulty & Failure
Achievement & Success
Knowledge, Skills, Experience & Training
Method (champion, consultant, researcher)
Management, commitment
People (staff), Empowerment, Teams
Motivation
Communication, Language, Information
Season, effect of
Frequency
Impl
emen
tati
on e
lem
ents
ARP implementation elements from meetings and interviews (2013-2014)
6
0
15
4
0
1
5
36
23
0
0 5 10 15 20 25 30 35 40
Finance, cost, budget
Lean theory development
Complexity of the industry
Measurement, Indicators
Competition
Customer
Technology, mechanical failure
Operational issues
Researcher, intervention
Undefined
Frequency
Oth
er e
lem
ents
ARP 'other elements' from meetings and interviews (2013-2014)

Page 188 of 372
4.5.7.3. ARP observations
The next section describes the outcomes of some of the interventions.
A number of improvements were made during the research period. These were mostly related
to the tools and techniques available. Although management started to understand
intellectually what Lean entailed, the organisation was very much dependent on external
suppliers and decision makers and found it difficult to adopt a complete Lean philosophy. This
was reinforced by the fact that during the off-season, less than a handful of people would be
involved with maintenance.
FIGURE 4 -2 2 : ARP INSTALLATION OF TRAFFIC LIGHT SYSTEM TO CORRECT GRADING.
Improvements included the direct feedback to the organisation’s graders about the quality of
the graded fruit by means of a traffic light system (figure 4-22). This was reinforced by a visual
display of the results of a day’s work (Figure 4-23).
FIGURE 4 -2 3 : ARP VISUAL FOR GRADI NG FEEDBACK.

Page 189 of 372
At one of the very first meetings, the researcher witnessed a production delay because the
operator could not get the equipment started due to the fact that there was no standard
operating procedure. Having discussed the incident, the team decided to work on simple
visual start-up instructions that were attached to the wall in the right locations (figure 4-24).
A number of improvements, particularly in the 5-S area tidied the organisation up
substantially while making work easier. Other improvements involved daily stand-up
meetings. Although discussed several times, the organisation did not manage to introduce
these successfully. The researcher then arranged a visit to a different Lean organisation to
witness three 5 minute stand-up meetings at different levels after which the ARP successfully
introduced their own version of this coordination and information tool.
The ARP produced an annual ‘end-of-season report and reports from 2013 and 2014 consisted
of reports from individual supervisors. A sample of comments concerning Lean are shown in
table 4-16. The comments from supervisory staff and management show some positive
experiences as well as the observation that the implementation could improve. Comments
focussed mostly on the visual aids. Little was stated about improvements by the reporters
themselves.
FIGURE 4 -2 4 : DRAFT AND COMPLETED STANDARD PROCEDURE FOR FLUME FILLING.

Page 190 of 372
TABLE 4 -1 6 : SELECTED COMMENTS FROM ARP END-OF-SEASON REPORTS (SIC .).
1 Lean: A great tool, we need to follow up and continue with this. Feedback has been positive.
2 We have put a number of new ideas into place over the season and have a lot to put in place over the off-season.
3 The lean initiative introduced during the season has already paid dividends with many small changes making things a lot easier.
4 Lean/Simple: Daily floor meetings were a great success, helped create a tighter supervisors team as well as disseminating information amongst themselves and then out to the wider team.
5 It could be an extension of the tool box meetings we have daily. It could also act as an extension of our Lean production board.
6 Lean management - Started with a hiss and a roar however it lost enthusiasm as the season progressed. I think more drive needs to come from management especially in regards to the boards and OFI’s. Simple meetings were really effective and found them useful.
7 Lean: Toolbox meetings were good for all concerned, took approximately 5 minutes and everyone knew what was happening for the day
4.5.7.4. ARP conclusion
For the action research packhouse, indicators point towards a positive Lean deployment
during these early stages of implementation but the organisation appeared to be hamstrung
by others in the value stream. Most Lean principles, methods and tools appear to find their
place comfortably within a packhouse situation despite the season-forced build-up of stock
that is partly pushed into market. Sustainability of results was not assessed. Results are
further discussed in chapter 5, ‘Analysis and discussion’. These findings support objective 3,
‘Analyse the applicability and any implementation approaches of the Lean philosophy,
methods and tools within the NZ pipfruit industry’.

Page 191 of 372
4.5.8. Action Research Lean Pipfruit Cluster
4.5.8.1. Formation of the Pipfruit Lean Cluster
As a result of the researcher’s investigation, the NZ pipfruit industry’s governance body asked
the researcher to co-ordinate a Lean pipfruit cluster in 2013. The cluster would consist of
volunteer companies that would like to practice ‘Lean’.
The industry approached a number of likely candidates and six companies joined the cluster of
which some of the researcher’s action research and case study companies. Potential members
formed a steering group which created a programme based on the researcher’s Lean Pipfruit
Cluster summary (appendix 13). A meeting calendar was created aiming for ‘on-the-job’
sessions at each of the members’ locations, focussing on different areas and sharing ideas
(table 4-17).
TABLE 4 -1 7 : INITIAL LEAN PIPFRUIT CLUSTER CALENDAR.
Date Times Weekday Location Who Activity
17-10-2013 8.30-10.00 AM Thursday Pipfruit NZ Steering group
Setting up cluster
25-10-2013 8.30-12.00 PM Friday Pipfruit NZ Steering group
Finalizing cluster & 3 Lean indicators per operational area
22-11-2013 8.30-12.00 PM Friday Company 1 Orchard What is Lean pruning December 24-1-2014 8.30-12.00 PM Friday Company 2 Orchard What is Lean thinning 21-2-2014 8.30-12.00 PM Friday Company 3 Orchard What is Lean
harvesting 21-3-2014 8.30-12.00 PM Friday Company 4 Packhouse Lean packing 25-4-2014 8.30-12.00 PM Friday Company 5 Coolstore Lean coolstore 23-5-2014 8.30-12.00 PM Friday Company 1 Exporting Lean exporting 27-6-2014 8.30-12.00 PM Friday Company 2 Packhouse Lean visual
management 25-7-2014 All day Friday To be seen SG and
interested Field visit outside industry
29-8-2014 8.30-12.00 PM Friday Company 3 Orchard Lean spraying 26-9-2014 8.30-12.00 PM Friday Company 1 Packhouse Lean people 31-10-2014 8.30-12.00 PM Friday Company 4 Coolstore Lean shipping 28-11-2014 8.30-12.00 PM Friday Company 2 Orchards Lean pruning December

Page 192 of 372
The cluster would send operational people to each of the on-location meetings in order to
learn how Lean could be implemented in practice. No single member proclaimed to be truly
Lean. All understood that each on-site visit would show the area of interest ‘warts-and-all’;
where companies were underprepared, an opportunity existed to help by making suggestions.
4.5.8.2. The Lean pipfruit cluster in operation
At the time of the recording of this section of the thesis, the cluster has had five steering
group meetings with the frequency of these meetings decreasing as the format became more
established. The cluster had eight operational on-site meetings which were well attended by
selected managers and operational staff. Feedback from attendants at the end of each visit is
collated by the cluster co-ordinator (the researcher) and sent to all member companies to
assist the iterative process. An example of feedback is attached as appendix 14. Some
meetings were short (e.g. one hour) and to-the-point; others took several hours. Members are
invited to make photographs and pick up ideas and use these in their own operations (refer
figure 4-25). The researcher states here that this attitude is in stark contrast to the paranoia
that had developed since the industry’s deregulation in 2001; it is more in line with Toyota’s
philosophy and a promising attitude change for the industry’s future.
FIGURE 4 -2 5 : LEAN PIPFRUI T CLUSTER COOLSTORE VISIT - STAND-UP MEETING BOARD .

Page 193 of 372
4.5.8.3. Lean Pipfruit Cluster synopsis
The Lean pipfruit cluster has been founded and meetings are organised and attended by
appropriate staff from cluster members. Feedback from participants to cluster sessions
indicates that they learn to interpret Lean from visits to other organisations (appendix 14). A
summary of Lean pipfruit cluster observations by participants assists validating the third
objective of this inquiry through complementary data (table 4-18).
TABLE 4 -1 8 : SUBJECTS OBSERVED DURING CLUSTER MEETING FEEDBACK
Lean indicator Visit 1 Visit 2 Visit 3 Visit 4 Visit 5 Visit 6 Visit 7 Visit 8 Long journey Yes
Reduced rework Yes Visuals make things easy
Yes Yes Yes Yes
Simple Kanban works Yes Yes Stand-up meetings and visuals
Yes Yes
No complacency for improvement
Yes Yes Yes
Information to all workers
Yes Yes Yes
Small things cause big downtimes
Yes
Waste interpretation Yes Yes
Small things make a difference
Yes
Staff participation; great culture
Yes Yes
Buy-in from bottom Yes
Buy-in from top Yes Crop load management
Yes Yes
Exporter/customer Yes Yes Thinning counts to achieve right size apples
Yes Yes
Tagging non-productive trees
Yes Yes
Importance of live data Yes Yes
5S Yes Yes Yes Quick change-over Yes Yes Yes
Maintenance Yes Yes Yes

Page 194 of 372
4.5.9. Action research summary results supporting objectives
Although the action research period covered only two seasons, most indicators point towards
a positive Lean deployment during these early stages of implementation. Orchards developed
new interpretations of Lean that are being tested; these are discussed in chapter 5, ‘Analysis
and discussion’. The action research packhouse had a similar result. Sustainability of both
results was not assessed due to the relatively short inquiry period. The Lean pipfruit cluster
has been founded and meetings are organised and attended by operational staff from cluster
members. Feedback indicates that the cluster is considered valuable by its members.
These findings support objective 3, ‘Analyse the applicability and any implementation
approaches of the Lean philosophy, methods and tools within NZ pipfruit industry ’. The results
are considered useful in assisting with objective 4, ‘Develop a conceptual Lean model for the
NZ pipfruit industry and consider if the model is applicable to the wider horticultural sector’.
4.6. Findings from case studies and the third objective
This section reports on the findings from the two case studies (CS) packhouse organisations
participating in the inquiry and the mini case studies of two exporters. The case study
packhouse using a Lean champion is referred to as CSP, while the case study packhouse using
a consultant is referred to as CSPC. The mini exporter case studies are limited by the
restrictions imposed by the two exporters and are referred to as CSE1 and CSE2. Findings of
the exporter mini case studies are derived from interviews and some observations.
4.6.1. Packhouse with Lean champion (CSP)
The CSP senior management had shown continued interest in developing staff and had hired a
packhouse manager who had Lean experience from a different industry. Considerable
empowerment was given to the packhouse manager and staff to improve packhouse setup,
systems and processes. The case study covers a period of 2 packing seasons, essentially 1 ½
years. During this period, the packhouse was visited on a number of occasions and interviews
were conducted in addition to evidence collected. Lean progress was measured pre -Lean,

Page 195 of 372
after one season and after the second season, using Kobayashi criteria, common Lean
principles, methods and tools and a Tapping et al (2002) assessment.
4.6.1.1. Case Study packhouse with Lean champion (CSP) progress measurement
The case study packhouses were assessed using instruments identical to those used for the
action research organisations—excluding the Lean cluster. Results are shown in figures 4-26,
4.27 and 4.28 respectively.
FIGURE 4 -2 6 : KOBAYASHI KEYS: COMP ARISON BETWEEN INDUSTRY AND CSP PROGRESS .
0
1
2
3
4
5
6
CSP vs Industry: Kobayashi keys
Industry Mean 2012 CSP 2013 CSP 2014
5- Yes, always, 100% 4- Usually or most of this 3- Truly halfway 2- Sometimes or some of this 1- No, not at all

Page 196 of 372
The CSP made considerable progress over the research period measured by the Kobayashi
keys as seen in figure 4-26.
Figure 4-27: CSP KNOWLEDGE AND USE OF LEAN PRINCIPLES, METHODS & TOOLS.
Similarly, the CSP made considerable progress over the research period in the knowledge and
use of Lean principles, methods and tools (figure 4-27). Similar to the ARO and ARP, progress
was not consistent throughout the measured criteria. In several areas, the CSP scored lower at
the end of the second season than it did at the end of the first season. Results showed
significant progress at the end of the first season and generally showed continued—but to a
lesser degree—progress at the end of the second season.
0
1
2
3
4
5
6
CSP vs Industry: Principles methods and tools
Industry Mean 2012 CSP 2013 CSP 2014
5- Use all the time
4- Use regularly
3- Use sometimes
2- Never used
1- Don't know what it is

Page 197 of 372
FIGURE 4 -2 8 : CSP WEIGHTED LONGITUDINAL LEAN ASSESSMENT IN 2 012 , 20 13 AND 2 01 4.
Progress was also measured with a pre-Lean assessment and an assessment after the 2013
and 2014 season using the Tapping et al (2002) instrument and results are presented in figure
4-28. Here too, results show significant improvement at the end of the first season and
continued progress—but to a lesser degree— at the end of the second season.
4.6.1.2. CSP Interviews, meetings and knowledge data
The case study packhouse was visited 25 times, during which interviews meetings and
observations were recorded. Interviews and records of meetings were transcribed in situ,
both summarising information and recording verbatim where useful. Records were grouped in
three groups of categories to sort transcriptions that assisted in determining the applicability
and implementation of Lean in the pipfruit industry (objective three). Figures 4-29, 4-30, and
4-31 respectively show the coded and grouped results. The coverage of all ten applicability
categories gives an indication of the applicability of those ten categories. The stand-out
categories are continuous improvement and Workplace Organisation & Visual Management,
02468
1012141618
Wei
ghte
d s
core
s
Lean assessment criteria (Tapping et al, 2002)
CSP scores Pre-Lean (2012), 2013 & 2014 (Tapping et al, 2002)
CSP Pre-Lean CSP 2013 CSP 2014
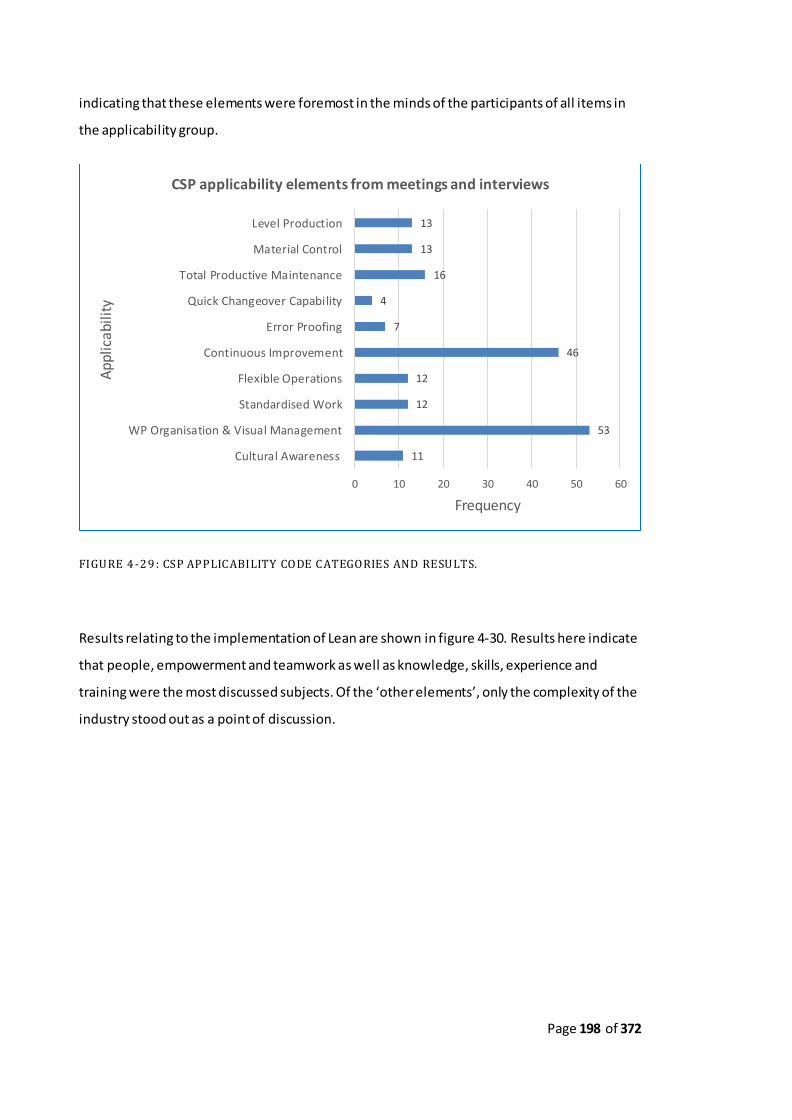
Page 198 of 372
indicating that these elements were foremost in the minds of the participants of all items in
the applicability group.
FIGURE 4 -2 9 : CSP APPLICABILITY CODE CATEGORIES AND RESULTS.
Results relating to the implementation of Lean are shown in figure 4-30. Results here indicate
that people, empowerment and teamwork as well as knowledge, skills, experience and
training were the most discussed subjects. Of the ‘other elements’, only the complexity of the
industry stood out as a point of discussion.
11
53
12
12
46
7
4
16
13
13
0 10 20 30 40 50 60
Cultural Awareness
WP Organisation & Visual Management
Standardised Work
Flexible Operations
Continuous Improvement
Error Proofing
Quick Changeover Capability
Total Productive Maintenance
Material Control
Level Production
Frequency
App
licab
ility
CSP applicability elements from meetings and interviews

Page 199 of 372
FIGURE 4 -3 0 : CSP IMPLEMENTATION CODE CATEGORIES AND RESULTS .
Results relating to other elements affecting Lean implementation are shown in figure 4-31.
FIGURE 4 -3 1 : CSP OTHER ELEMENTS C ODE CATEGORIES AND RESULTS.
5
2
12
33
13
8
34
6
9
9
0 5 10 15 20 25 30 35 40
Change
Difficulty & Failure
Achievement & Success
Knowledge, Skills, Experience & Training
Method (champion, consultant, researcher)
Management, commitment
People (staff), Empowerment, Teams
Motivation
Communication, Language, Information
Season, effect of
Frequency
Impl
emen
tati
on e
lem
ents
CSP implementation elements from meetings and interviews
4
0
9
4
0
2
3
0
0
5
0 2 4 6 8 10
Finance, cost, budget
Lean theory development
Complexity of the industry
Measurement, Indicators
Competition
Customer
Technology, mechanical failure
Operational issues
Researcher, intervention
Undefined
Frequency
Oth
er e
lem
ents
CSP 'other elements' from meetings and interviews

Page 200 of 372
4.6.1.3. CSP observations
The next section describes the outcomes of some of the interventions.
The CSP manager had a very good and practical understanding of Lean. The CSP business
owners were very aware of the importance of ongoing training and progressing in terms of
production and management models and invested time and money accordingly.
FIGURE 4 -3 2 : CSP EXAMPLE OF VALUE STREAM MAPPING EXERC ISE.
Consequently, the packhouse made considerable progress in changing
the culture and functioning of the packhouse. A number of
improvements were made during the research period. These were
related to principles, methods and tools and included value stream
mapping (figure 4-32).
The packhouse introduced numerous visual aids to make the
operation simple, both in value-added departments as in the
necessary waste departments. Staff were involved in the process and
initiated a number of improvements without much further thought.
FIGURE 4 -3 3 : SIMPLE
REVERSIBLE VISUAL.

Page 201 of 372
Their thinking had developed around waste removal, ‘making things simple’ (Figure 4-33).
The CSP included maintenance in their programme and one of the supervisors developed a
visual maintenance board where preventative and improvement maintenance were colour
coded on post-it notes which were folded when the maintenance was completed. This
provided flexibility in design and management of maintenance Figure 4.34).
The CSP displayed an ongoing drive to implement Lean and the drive of management was
easily picked up by supervisory staff who displayed an equal enthusiasm and pride in their
achievements.
4.6.1.4. CSP synopsis
The CSP made considerable progress over the measured period. Most of the Lean principles,
methods and tools appeared applicable and fitted without much adaptation. Some common
FIGURE 4 -3 4 : MAINTENANCE PLANNING—VISUAL, FLEXIBLE, PRIORITISED, SEGREGATED, EASY
TO UNDERSTAND.

Page 202 of 372
principles, methods and tools were less or not applicable. The pull principle was not entirely
applicable in the value stream but it was understood. Tray and packaging manufacturers were
not set up for production to demand and built up considerable stocks of the most common
items during the ‘off-season’. Some arrangements were made to pull these into inventory but
packaging production clearly did not have the capacity to produce to demand. Similarly, bins
with fruit were harvested when the fruit was at the right maturity level and then stored until
required to be packed. Once decided, bins were pulled from inventory and packed to exporter
order. TAKT time was not used. The CSP achieved improved flow by coordinating in-field
measured fruit specifications with packing requirements. Flow was also improved by
significant packhouse layout changes between the first and second season, reducing
overburdening—which is typical for the industry. Interviewed staff demonstrated a number of
continuous improvement results and were engaged in the process.
4.6.2. Packhouse with Lean consultant (CSPC)
The second case study packhouse (CSPC) had engaged a consultant at the start of the inquiry,
offering an opportunity for triangulation and complementation. CSPC staff initially struggled
somewhat with the concepts and coaching presented by the consultant. During the first year,
the consultant returned on an almost monthly basis and presented a mixture of training
sessions, gemba walks with individual staff, visual aids, documentation aids and assessments.
Although not a horticultural specialist, the consultant worked diligently with numerous staff
and encouraged, suggested and assisted where required. After a number of months,
packhouse staff reported a shift in mind-sets and started to take some initiative.
The case study covers a period of 2 packing seasons, essentially 1 ½ years. Here too, the
packhouse was visited on a number of occasions and a number of interviews were conducted
in addition to evidence collected. Lean progress was measured pre-Lean, after one season and
after the second season, using Kobayashi criteria, common Lean principles, methods and tools
and a Tapping et al (2002) assessment. These results are discussed in the following
paragraphs.

Page 203 of 372
4.6.2.1. Case Study packhouse with Lean consultant (CSPC) progress measurement
The case study packhouse was assessed using identical instruments to the action research
organisations (survey of 20 Kobayashi criteria and 20 common principles, methods and tools,
as well as pre- and post-inquiry assessment using Tapping et al (2002)). Results are shown in
figures 4-35, 4-36 and 4-37 respectively.
FIGURE 4 -3 5 : KOBAYASHI KEYS: COMP ARISON BETWEEN INDUSTRY AND CSPC PROGRES S.
The packhouse made significant progress in the area of the Kobayashi criteria during the first
year of the inquiry and progressed only a little during the second year (figure 4-35). A similar
result resulted in the area of knowledge and tools (figure 4-36). The Tapping et al (2002)
assessment showed a very similar result, indicating consistency across measurements (figure
4-37).
0
1
2
3
4
5
CSPC versus industry Kobayashi Criteria
Industry Score 2012 CSPC 2013 CSPC 2014
5- Yes,
always, 100%4- Usually or most of this
3- Truly halfway2- Sometimes
or some of this
1- No, not at all

Page 204 of 372
FIGURE 4 -3 6 : CSPC KNOWLEDGE AND U SE OF LEAN PRINCIPLE S, METHODS & TOOLS .
FIGURE 4 -3 7 : CSPC WEIGHTED LONGITUDINAL LEAN ASSESSMENT IN 201 2, 2 01 3 AND 20 14.
0
1
2
3
4
5
6
CSPC vs industry: Knowledge and use of Tools
CSPC Industry Mean CSPC CSPC 2013 CSPC CSPC 2014
5- Use all the time
4- Use regularly
3- Use sometimes
2- Never used
1- Don't
0
2
4
6
8
10
12
14
16
18
Wei
gh
ted
sco
res
Lean assessment criteria (Tapping et al, 2002)
CSPC scores Pre-Lean, 2013 & 2014 (Tapping et al, 2002)
CSPC Pre-Lean CSPC 2013 CSPC 2014

Page 205 of 372
4.6.2.2. CSPC Interviews and knowledge data
During meetings and interviews, the CSPC organisation also demonstrated a focus on
workplace organisation and continuous improvement (Figure 4-38). In addition, the
organisation developed material control systems they had not before enjoyed. The introduced
Kanban system was used as an example by several other organisations in the Lean pipfruit
cluster. Most elements were addressed by the CSPC with some elements having a lower focus.
FIGURE 4 -3 8 : CSPC APPLICABILITY CATEGORY SCORES .
Similarly, the implementation elements showed a broad focus on implementation. Of
particular interest is the high score in staff empowerment and the obvious recording of the
consultant’s activities. The high number of recorded ‘Difficulty and Failure’ events is
attributed to the fact that staff had learned to recognise their difficulties and discuss these
openly (Figure 4-39). An example of empowerment was the visit of a Lean cluster group where
the General Manager stated that the supervisors would ‘do’ the Lean tour, expressing
confidence in staff engagement and knowledge. To emphasise the relevance of this
7
45
14
3
43
7
6
2
16
15
0 5 10 15 20 25 30 35 40 45 50
Frequency
App
licab
ility
cat
egor
ies
CSPC applicability elements from meetings and interviews

Page 206 of 372
statement, the researcher states here that it is common in the industry for a reasonably senior
manager to lead visitors so that visitors would get the right information presented to them.
FIGURE 4 -3 9 : CSPC IMPLEMENTATION CATEGORY SCORE S.
The ‘Other Elements’ categories showed focus on measurement and costs and as with most ,
recognised the complexity of the industry (figure 4.40).
14
26
9
18
30
4
29
9
12
12
0 5 10 15 20 25 30 35
Frequency
Impl
emen
tati
on e
lem
ents
CSPC implementation elements from meetings and interviews

Page 207 of 372
FIGURE 4 -4 0 : OTHER ELEMENTS CATEGORY SCORES.
4.6.2.3. CSPC observations
The CSPC made solid progress during the period of the inquiry, aided by the consultant. A
number of improvements were introduced over time and the staff took considerable pride in
their achievements during the latter part of the inquiry. This culture change was noticeable
both within and from outside the organisation. Several visitors observed that the organisation
had undergone a transformation which was reflected typically in the visual perception of the
organisation. A few examples are shown in figures 4-41 and 4-42.
6
1
4
8
2
0
0
0
0
2
0 1 2 3 4 5 6 7 8 9
Finance, cost, budget
Lean theory development
Complexity of the industry
Measurement, Indicators
Competition
Customer
Technology, mechanical failure
Operational issues
Researcher, intervention
Undefined
Frequency
Oth
er e
lem
ent
cate
gor
ies
CSPC 'other elements' from meetings and interviews
FIGURE 4 -4 1 : A SIMPLE VISUAL SYSTEM FOR PUTTING PACKAGING IN ITS PLACE AND RE-
ORDERING.

Page 208 of 372
The start of mastering a Kanban system
was observed by several other
organisations during a Lean cluster visit.
One other company modelled their system
on the CSPC model.
Despite having difficulties adapting to the
Lean paradigm early into the Lean
programme, the CSPC got to the point
where people started ‘getting it’ and made
good progress from that point onwards.
During an open day in 2013, organised by
Pipfruit NZ Inc. (the pipfruit industry’s governing body) , the CSPC manager presented a graph
(figure 4-43) of the labour cost to pack a carton which showed that the company had been
reducing its cost during the first Lean implementation year to levels not experienced since
2007. The general manager explained that he could not empirically attribute the lower cost to
Lean but that Lean was the only change they had made; the transformation through Lean
appeared to create financial results.
FIGURE 4 -4 2 : CSPC KANBAN BOARD FO R RE-
ORDERING.

Page 209 of 372
FIGURE 4 -4 3 : LABOUR COSTS PER PACK ED CARTON (GRAPH REPRODUCED SIC - AS PROVIDED)
4.6.2.4. CSPC synopsis
The CSPC achieved considerable improvement during the period of the inquiry. The consultant
had intensive two-day visits where a mixture of training, education, assistance and challenging
led to permanent staff being able to start thinking Lean. Although culture did not score high in
interviews, the company culture had changed considerably over the period of the inquiry as
was observed by the researcher. Some of the elementary tools were used well and when
asked, proved to be of high value. The CSPC case study points towards the suitability and
implementation validity of Lean in a pipfruit packhouse environment.
4.6.3. Exporter 1
Exporter 1 was highly concerned about the time involved in the inquiry and the sensitivity of
the information that might be released during the inquiry. A single interview was allowed,
specifying that the interview would be with a specific manager. The interview lasted 1 ½

Page 210 of 372
hours. Although the exporter granted a second interview late in the inquiry, the timing of this
was too late to contribute to the findings.
4.6.3.1. Exporter 1 interview
FIGURE 4 -4 4 : CODES AND FREQUENCIE S IDENTIFIED IN MINI CASE STUDY EXPORTER 1 .
The interview was transcribed in situ and analysed from the generated document. This was
later coded, where possible matching verbatim terms, used by the participant, with existing
theory. The researcher used Lean terminology for coding where Lean was evident but Lean
terms were not used by the interviewee, e.g. the interviewee did not use the word ‘waste’ but
1
1
1
1
1
1
1
1
2
2
2
2
2
2
2
2
3
3
3
4
4
10
0 2 4 6 8 10 12
Complex
Exporter instruction
Flexibility
Future state
Market
Relations
Stabilise
Value stream
Differentiate
Grower dictates supply
Pareto customer
Plan
Quality
Size curve
Supplier
Variety mix
Constraint
Market
Variety
Supply
Waste, Overproduction
Customer
Code frequency
Cod
es re
late
d to
Lea
n
CSE1 - elements from meetings and interviews

Page 211 of 372
identified overproduction of undesirable sizes as an issue. Thirty codes were identified,
twenty-two of which could be interpreted as directly or indirectly related to Lean while the
balance was largely interpreted as related to trading. Results are presented in figure 4-44.
4.6.3.2. Exporter 1 synopsis
Although a single interview cannot be considered a case study, the contents gives some
indication of exporter thinking. During the interview, the customer featured significantly,
while waste and supply were the next highest frequency. It appears therefore that the
exporter had an intuitive understanding of some Lean principles but was not aware of this.
Important other Lean principles and methods did not arise during the interview.
4.6.4. Exporter 2
Exporter 2 agreed to interviews after presenting very similar concerns as exporter 1, these
being the time required and the commercial sensitivity of data. A total of four intervi ews took
place both at the head office and with one of the regional representatives.
4.6.4.1. Exporter 2 interview(s)
Interviews were transcribed in situ and analysed from the generated document. This was
coded later. Where possible, verbatim terms used by the participant were matched with
existing Lean theory. In order to categorise meaningfully, the researcher used Lean
terminology for coding and categorising where Lean was evident—but identifiable
terminology was not used by the interviewee. Fourteen categories were selected, one of
which was a collection of individually Lean terms. The balance was largely interpreted as
related to trading or technical issues. Results are presented in figure 4-45.

Page 212 of 372
FIGURE 4 -4 5 : CODES AND FREQUENCIES IDENTIFIED IN MINI CASE STUDY EXPORTER 2 .
It is evident that CSE2 pays significant attention to customers, customer demand and
customer value. Therefore, CSE2 appears to be conscious of the primary of the five Lean
principles without identifying it as the first Lean principle (Womack et al, 1990). Although the
individual Lean terms scored high, each term was used only once, thereby indicating that CSE2
was not very conscious of Lean thinking. Similarly, the ‘Supply, supplier’ category related more
to the logistics of supply than to the value stream. Information and communication were
considered important by CSE2, although most of the comments related to logistics, matching
supply with demand; the customer requirements were related to the grower supply in
December, allowing only late action by the grower to attempt to correct the supply size and
volume. CSE2 was conscious of waste, particularly where a grower produced fruit that had no
market, but also noting reworking as a possibly necessary waste. CSE2 also referred to
overburdening and improvement several times and mentioned standardising after
improvement once, although not aware of this as a Lean approach.
The researcher then considered his observations and knowledge of the exporter in relation to
the categorised outcomes of the interviews. The exporter is customer focussed but,
2
2
2
3
3
4
5
8
8
9
10
14
17
18
0 2 4 6 8 10 12 14 16 18 20
Agile
Standardising
Returns
Planning
Overburdening
Improvement
Right
Communication
Markets
Waste
Information
Supply, supplier
Individual Lean terms
Customer
Frequency
Cod
es re
lati
ng to
Lea
nCSE2 - elements from meetings and interviews

Page 213 of 372
considering that the exporter has upstream and downstream customers, also has a grower
focus. The customer focus is therefore related to maximising the return to the grower.
Throughout the interviews there was limited focus on process improvement of the value
stream as a deliberate and conscious approach.
4.6.4.2. Exporter 2 synopsis
This mini case study comprised four interviews and several observations and may only be seen
as potentially indicative of exporter approaches. CSE2 was clearly customer focussed,
predominantly to maximise returns to the grower. The supplier, communication and
information and waste reduction also featured in the interviews. The exporter appeared to
have some intuitive understanding of some Lean principles but was not aware of these as
Lean. Other Lean principles and methods did not emerge during the interview.
4.6.5. Interviews with stakeholders in kiwifruit and wine
Several interviews with stakeholders in kiwifruit and the grape and wine industry provided
elementary data about these industries, both larger than the pipfruit industry. Kiwifruit is
most synonymous with the pipfruit industry as it exports fresh fruit, however a difference is
that kiwifruit is exported under a single export desk. Grapes and wine are different in that
most grapes are exported as wine. In both cases, seasonal pressures are similar just as the
push element with wine not being subject to a restricted shelf life.
The kiwifruit organisation had started Lean five years before with the assistance of the
government, the single desk exporter and a consultant. While the growing side was difficult,
the post-harvest side of the organisation thrived on Lean and made substantial progress,
particularly in operations but also including the administrative side. The interviewed
organisation included seasonal staff in improvement ideas which resulted in some great ideas.
The organisation invests significantly in training, differentiating between permanent and
seasonal staff. Value stream mapping was introduced quite late in its programme.
Observations show an organisation that looks and feels Lean, meaning that it looks highly
organised and there is an atmosphere of calm professionalism.

Page 214 of 372
The wine organisation had several locations across the country. The main office displayed a
large Lean storyboard in the canteen, a board which was also available on other locations. The
board served both as educational tool and positive reinforcement, ce lebrating successes. The
organisation had appointed a continuous improvement specialist; somebody whose sole focus
was on visiting all locations and departments with a focus on improvement. The organisation
collated the information from its subsidiaries into a company newsletter, again telling the
story and celebrating successes. Improvements affected departments across the company,
including vineyards, winemakers, financial department, kitchen, laboratory and more. The
company invested significantly in training and value stream mapping was practiced by most.
Summarising, both kiwifruit and wine appeared similar to the pipfruit industry. The two
organisations had several years’ experience implementing lean and showed good progress
over that time.
4.6.6. Case study summary results supporting objectives
The case studies included two packhouse/coolstore combinations and two exporters, albeit
with a mini case study for the exporters. The packhouse case studies supported the suitability
of Lean in a pipfruit packhouse/coolstore environment. Similarly, it appeared that Lean can be
implemented in that environment with the exception of some specific Lean methods and
tools. The difficulties of implementing Lean in this environment are specifically linked to the
seasonal component of the industry, however case study packhouses have demonstrated that
most of the Lean principles, methods and tools can be implemented as they were designed
with minor adaptation. This supports the third objective of this inquiry.
The exporter case studies showed some intuitive understanding of principles, methods and
tools. The exporter volunteers however were not educated or trained in Lean and did not feel
that Lean would contribute to their performance. The other two horticultural organisations
were ahead in Lean progress but confirmed significant similarities between themselves and
the pipfruit industry; something that will prove helpful when considering the fourth objective.

Page 215 of 372
4.7. Chapter conclusion
This chapter presented results from a consultant survey, an industry stakeholder
questionnaire and action research and case study inquiries.
The literature review demonstrates that Lean principles, methods and tools are not unique to
the automotive industry and have been adapted to fit a number of diffe rent industries, not all
of which are involved in manufacturing. The common theoretical themes have proven to be
transferable to a number of industries and production or service environments. The literature
review therefore substantially achieves the first objective of this inquiry, ‘Identify common
theoretical themes for the Lean philosophy, methods and tools, that are not industry or
contextually bound and that may be transferable to the pipfruit industry ’.
The reflective practitioner review confirms that the industry has organically or intuitively
introduced some Lean or ‘approaching-Lean’ methods and tools, without conscious awareness
of the underlying principles. The survey of Lean consultants shows that there is very little
experience within the NZ pipfruit industry. Furthermore, the industry stakeholder survey
confirms that there is a low level of Lean understanding and deployment within the industry.
These results combined ‘identify and analyse the current Lean deployment with the NZ pipfruit
industry’, the second objective of this inquiry.
The action research of orchards demonstrates that a number of Lean elements are suitable
and can be implemented but, other Lean elements need new interpretation or simply do not
fit the orchard environment. A result of the action research orchards was the interpretation of
orchard maintenance which may lead to new theory.
The action research and case studies of packhouse/coolstore organisations and the Lean
pipfruit cluster demonstrate that Lean is both suitable and implementable using various
different implementation approaches in the packhouse/coolstore environment. These
findings assist with the third objective of this inquiry, ‘Analyse the applicability and any
implementation approaches of the Lean philosophy, methods and tools within the NZ pipfruit
industry’.
The results of the inquiry therefore appear to support the first three objectives of the inquiry.
The fourth objective is discussed later in this document.

Page 216 of 372
5. Analysis and Discussion
"Well, it may be all right in practice, but it will never work in theory." Warren Buffett in a
variation of a French proverb.
5.1. Introduction to analysis and discussion
In the introduction to this work (chapter one), the problem and objectives for this inquiry
were identified. This was followed by a chapter on the literature review, a chapter on
methodology and a chapter on results.
This chapter, ‘Analysis and Discussion’, intends to critically analyse and discuss the findings
presented in chapter four. Findings are discussed in l ine with the objectives from chapter one,
first examining the theoretical themes that may be transferable to the pipfruit industry. In the
next section, the current level of Lean deployment within the industry is examined, followed
by the discussion of the applicability and implementation approaches of Lean in the NZ
pipfruit industry. The development of a model for the NZ pipfruit industry (and ‘considering its
applicability to the wider horticultural industry’) requires the critical analysis and discussion to
be completed before it is given shape in chapter six.
A critical analysis of findings adds balanced value to the outcome of this inquiry.
“Whoever is careless with the truth in small matters cannot be trusted with
important matters”. “Truth never damages a cause that is just.” ― Combined
wisdom of Albert Einstein and Mahatma Gandhi.
5.2. Objective 1: Transferable common theoretical themes
The first objective proposed in chapter one is to:
‘Identify common theoretical themes for the Lean philosophy, methods and tools, that are n ot
industry or contextually bound and that may be transferable to the pipfruit industry ’.
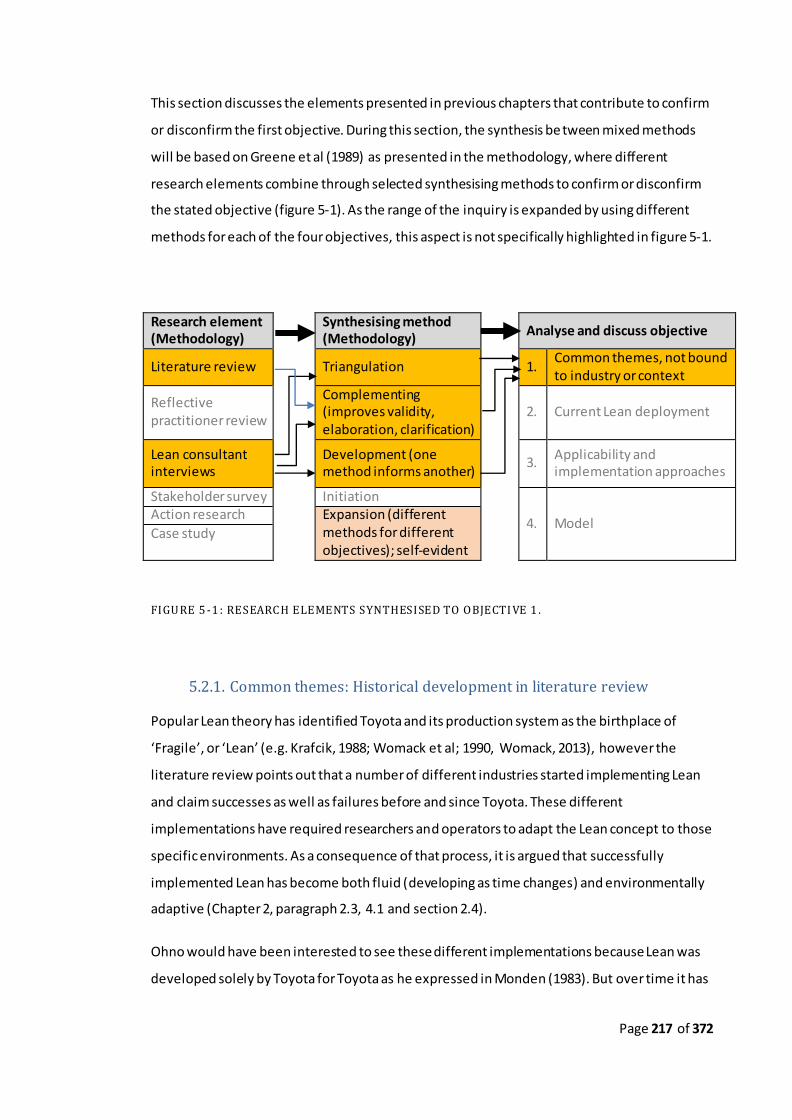
Page 217 of 372
This section discusses the elements presented in previous chapters that contribute to confirm
or disconfirm the first objective. During this section, the synthesis between mixed methods
will be based on Greene et al (1989) as presented in the methodology, where different
research elements combine through selected synthesising methods to confirm or disconfirm
the stated objective (figure 5-1). As the range of the inquiry is expanded by using different
methods for each of the four objectives, this aspect is not specifically highlighted in figure 5-1.
FIGURE 5 -1 : RESEARCH ELEMENTS SYNTHESISED TO OBJECTI VE 1 .
5.2.1. Common themes: Historical development in literature review
Popular Lean theory has identified Toyota and its production system as the birthplace of
‘Fragile’, or ‘Lean’ (e.g. Krafcik, 1988; Womack et al; 1990, Womack, 2013), however the
literature review points out that a number of different industries started implementing Lean
and claim successes as well as failures before and since Toyota. These different
implementations have required researchers and operators to adapt the Lean concept to those
specific environments. As a consequence of that process, it is argued that successfully
implemented Lean has become both fluid (developing as time changes) and environmentally
adaptive (Chapter 2, paragraph 2.3, 4.1 and section 2.4).
Ohno would have been interested to see these different implementations because Lean was
developed solely by Toyota for Toyota as he expressed in Monden (1983). But over time it has
Research element (Methodology)
Synthesising method (Methodology)
Analyse and discuss objective
Literature review Triangulation 1. Common themes, not bound to industry or context
Reflective practitioner review
Complementing (improves validity, elaboration, clarification)
2. Current Lean deployment
Lean consultant interviews
Development (one method informs another)
3. Applicability and implementation approaches
Stakeholder survey Initiation
4. Model Action research Expansion (different
methods for different objectives); self-evident
Case study

Page 218 of 372
become clear that Lean is not owned by any person or company; it developed over a long
period of time and took Ford and Taylor as inspiration as Womack (2013), Ohno (Monden,
1983) and Shingo (1992) agree. In fact, Ohno warned against codifying his system because
that would remove all flexibility (Seddon, 2010). Over time, common themes of successful
Lean have been the fluidity and adaptation to the environment within which it was
implemented.
Womack (2013) discusses how literature appears to be building a ‘lean tower of Babel’ and
falls back on the fundamental focus of Lean; to create a perfect process, i.e. perfectly
satisfying the customer’s requirement of value with zero waste. He quotes an example of his
own bicycle manufacturing plant and immediately acknowledges that none of us has seen
such a process, but that true Lean thinkers travel on a never-ending pathway toward that truly
Lean process. He emphasises that the original book was a catalyst for new ideas and in saying
that, acknowledged the fluidity of Lean.
“So, 25 years on, we know that the “The Triumph of the Lean Production System”
wasn’t perfect. But we believe that it was a watershed event in the history of the
lean movement and that it helped open a floodgate of new ideas for the world’s
managers. We continue to see its benefits today and we hope you will enjoy
reading the original article in light of what you have learned on your own lean
journey.” (Womack, 2013, Sic. location 3585, Kindle)
5.2.2. Common themes across industries in literature review
The diverse environments in which Lean has been implemented mean an almost equally
diverse interpretation and use of methods and tools across those environments. This
effectively means that specific methods and tools may apply to a certain industrial
environment and not to another. Common themes are broader than specific methods and
tools and contend that:
Lean is fluid and adaptive to its environment;
Lean is challenging to implement;

Page 219 of 372
There is an apparent thematic continuum from general to specific, general being less
perceptible and tangible—but fundamental—while specific is more perceptible and
tangible—and necessary for operationalising Lean.
Two examples follow to illustrate that Lean implementation is idiosyncratic to industry types
and therefore common themes are of a general nature.
Example one: In the health care discussion, Radnor et al (2012) point out that healthcare is
capacity led instead of demand led, deviating from Lean theory. Similarly, the customer (the
government) decides for the consumer (the patient). Radnor et al (2012) also translate the
classic seven wastes into waste in healthcare, deviating from standard Lean theory and in fact
state that if Lean is not translated for a specific environment, it could impact negatively on its
implementation effectiveness. This is confirmed by Radnor’s translation of the five Lean
principles (Womack et al, 1990) into six healthcare principles (Williams & Radnor, 2014).
Buesa (2009) and Dickson et al (2009) rationalise that they use certain Lean elements because
not all Lean elements can be applied per se. Dickson et al (2009) believe that medical
institutions or departments seeking to adopt Lean must concentrate on the core principles of
Lean rather than on copying specific process changes made at other institutions or
departments. Joosten et al (2009) also confirm that Lean depends on its environment;
however they select those elements that they see as applicable to their specific research.
Example two: Accounting is a service that spans most industries and, despite computerisation,
has not changed in essence and needs revising (Johnson, 1991). Over the years, management
accounting has become a driver for operations and this does not reconcile with Lean because
it accounts on fragmented information (Maskell, 2004). Operational decision-making must be
assisted by analysing the effect of any proposed changes on the profitability of the value
stream as a whole, not the individual products (Kennedy & Brewer, 2006). Visual management
with real-time data allows operators to make ‘running’ improvements which after-the-fact
financial reports do not facilitate. So depending on the type of organisation the product of
Lean accounting differs and does not specifically conform to generalised methods or tools.
An argument could be made that a common theoretical theme is that all types of industries
benefit from 5-S, which has become both a simple best practice tool, and a culture for the
advanced exponents of Lean (Gapp et al, 2008). Additionally, a valid question can be asked
whether tools such as 5-S belong to the Lean paradigm or are merely an introduction of a best

Page 220 of 372
practice which leads to better performance (e.g. Pil and MacDuffie. 1996 and Ichniowski et al
(1996). In New Zealand (and other English speaking countries) e.g. there is a saying ‘There is a
place for everything and everything is in its place’, depicting the intuitive use of 5-S elements
as best practice.
5.2.3. Common themes: The view by consultants
The consultants were strongly positive (95.2%) that Lean would benefit the NZ pipfruit
industry and all but one (also 95.2%) believed that philosophy was the common prerequisite
theme when looking at philosophy and tools as a crude distinction of Lean elements. A
common theme then appears to be that the Lean philosophy is more relevant for Lean success
than the Lean tools are. As one consultant indicated “…tools without philosophical support will
become isolated, while the right philosophy will lead to the introduction of the right tools;
philosophy is transferable to any industry”. The question was intended to get an idea of
consultants’ approaches and was not specific enough to extract more meaning than was
presented in the findings.
The consultants’ responses are presumed to be based on their wider industrial experience,
because only ten consultants reported experiences with horticultural companies, four of
which were pipfruit-related experiences. These four are further qualified: One consultant
worked with the same companies as another but with a different focus and at a different
time, while a second consultant had only engaged in a preliminary service delivery
assessment.
In terms of tools, consultants (when asked about the seasonal nature of the industry)
regarded standardisation, training and visual management as methods and tools that would
deal with the seasonal aspect of staff. Challenged to consider the impact of the ‘push’ concept
of the industry, the answers varied widely and there was little commonality amongst replies .
It appeared that consultants struggled somewhat with this aspect of the industry.

Page 221 of 372
5.2.4. Synopsis of analysis and discussion of the first objective
If well respected and quoted authors do not agree on a definition of Lean we have to ask
ourselves if there can be a single definition or if , perhaps like the Lean paradigm itself, the
definition must be adaptive to its environment and the chronological time in industrial
development. It is clear from the literature review on Lean manufacturing (e.g. Pettersen,
2009) that different authors consider largely similar but also different Lean characteri stics.
The wider group of authors focussing on other Lean implementation elements, essentially
‘pick and choose’ Lean elements that fit their specific environment, while in that process
agreeing on elements that appear to fit in most environments. These el ements include the
enabling ‘below the surface’ elements of the sustainable ‘Lean iceberg model’ (Hines et al,
2011a) such as philosophy, strategy, alignment, leadership, senior management support,
behaviour and engagement, and also a number of methods, techniques and tools that are
idiosyncratic to each different environment. The list of common theoretical themes that are
not industry or contextually bound but are applicable to the NZ pipfruit industry can therefore
not be perfect but its existence is undeniable.
The consultants corroborate the view that philosophy is universally applicable and
complement that with several ideas of approaching the seasonal staff issue.
5.3. Objective 2: Identification and analysis of current Lean deployment
The second objective proposed in chapter one is to:
‘Identify and analyse the current Lean deployment within the NZ pipfruit industry’ .
This section analyses and discusses the results of the stakeholder survey. The stakeholder
survey and reflective practitioner review triangulate to identify and analyse Lean deployment
within the NZ pipfruit industry (figure 5-2). The Lean consultant interviews assist with
development of the stakeholder survey and complements constructs, while the reflective
practitioner review also complements interpretability of constructs.

Page 222 of 372
FIGURE 5 -2 : SYNTHESISIGNG METHODS USED FOR OBJECTIVE 2 .
As the range of the inquiry is expanded by using different methods for each of the four
objectives, it is not specifically highlighted in figure 5-2.
5.3.1. Current Lean deployment: A consultant estimate
This section analyses and discusses the consultants’ estimate about Lean deployment in New
Zealand and in particular the NZ pipfruit industry.
Of the twenty-one consultants responding to questions, eighteen confirmed experiences with
the primary industry and ten confirmed experiences with the horticultural industry, four of
which were with the pipfruit industry.
When asked, consultants estimated that an average of approximately 3% of NZ organisations
might be ‘seriously’ Lean (described as ‘Dedicated to become Lean and having made
substantial inroads’) with a range from 0% to 10%. Focussing on the horticultural industry,
consultants estimated that an even lower percentage of these were ‘seriously’ Lean,
averaging approximately 1% with a range from 0% to 5%. There was no significant difference
between the mean score of all consultants and the mean score of consultants with
horticultural experience. Considering that only ten of the twenty-one respondents had
Research element (Methodology)
Synthesising method (Methodology)
Analyse and discuss objective
Literature review Triangulation 1. Common themes, not bound to industry or context
Reflective practitioner review
Complementing (improves validity, elaboration, clarification
2. Current Lean deployment
Lean consultant interviews
Development (one method informs another)
3. Applicability and implementation approaches
Stakeholder survey Initiation
4. Model Action research Expansion (different methods for different objectives); self-evident
Case study

Page 223 of 372
experiences with any form of horticultural industry, the estimate is relatively low in validity
and does not carry too much weight. The ranges of 0-10% and 0-5% respectively, also indicate
a level of uncertainty about the number of organisations that would fall into the ‘seriously
Lean’ category.
The 2013 statistical Annual of the NZ pipfruit industry refers to 370 growers for 2013, 61
packhouses/coolstores and 84 exporters, a total of 515 stakeholders (appendix 10). The
consultants’ estimate of approximately 1% might theoretically imply that approximately 7
pipfruit organisations would be seriously Lean, which is optimistic in the researcher’s view and
not validated because only half of the consultants had any experience in the area. However
the researcher never intended for the question to contribute high value to the analysis; the
consultants were approached very early in the research project to confirm or disconfirm some
basic facts about Lean in the NZ horticultural industry that might change the course of the
inquiry, and that purpose was served by the interviews. The results however converge with
the stakeholder results which are discussed in 5.3.2.
5.3.2. Current Lean deployment: A stakeholder survey
This section analyses the stakeholder survey and discusses the various responses to establish
the current level of Lean deployment within the industry.
5.3.2.1. Transition from unconscious incompetence to conscious incompetence
Stakeholders responded differently to an identical question asked at the beginning and at the
end of the ‘single-question-per-day’ questionnaire as shown in figure 4-1 in chapter 4
‘Results’.
Stakeholder respondents believed they had a fundamental knowledge of Lean before the
survey with an average score of 2.47 which places them between moderate and reasonable
Lean knowledge. Conversely, towards the end of the survey the number of respondents that
estimated their knowledge of Lean as being low increased with stakeholder respondents
scoring an average of 1.94 which places the group just below moderate Lean knowledge. The
inference here is that stakeholders confirmed a degree of unconscious ignorance at the start
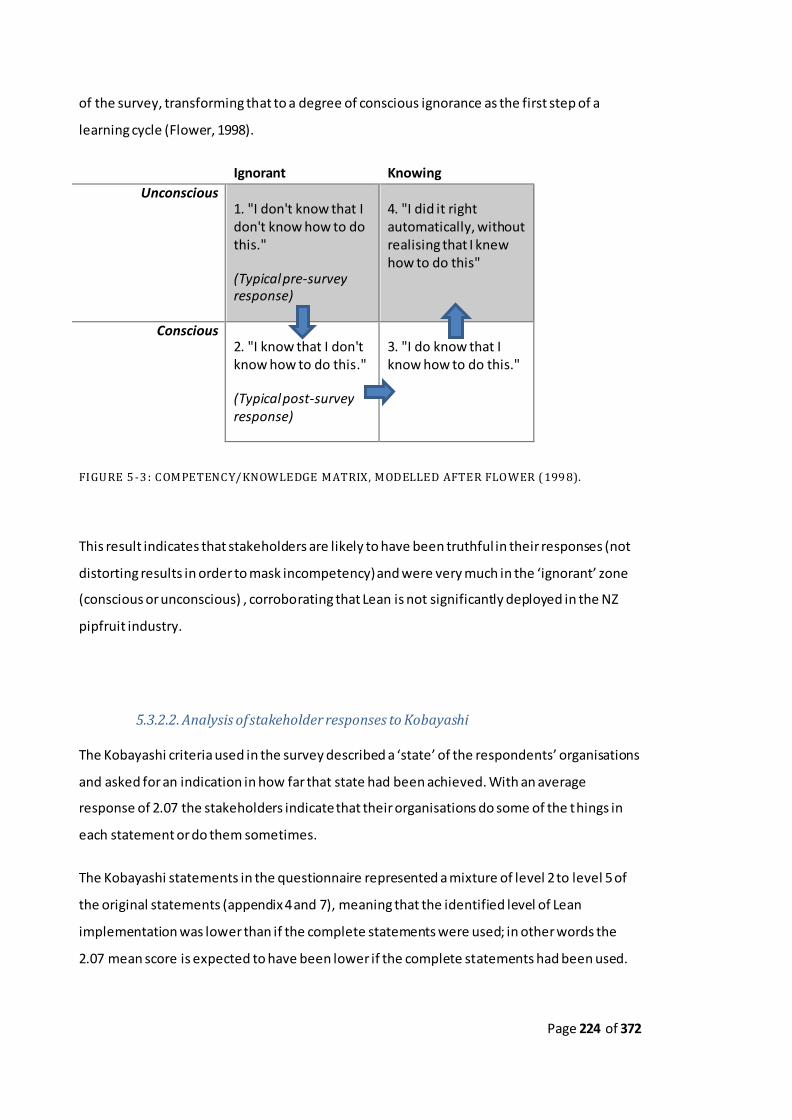
Page 224 of 372
of the survey, transforming that to a degree of conscious ignorance as the first step of a
learning cycle (Flower, 1998).
Ignorant Knowing
Unconscious 1. "I don't know that I don't know how to do this."
(Typical pre-survey response)
4. "I did it right automatically, without realising that I knew how to do this"
Conscious 2. "I know that I don't know how to do this."
(Typical post-survey response)
3. "I do know that I know how to do this."
FIGURE 5 -3 : COMPETENCY/KNOWLEDGE MATRIX, MODELLED AFTER FLOWER ( 199 8).
This result indicates that stakeholders are likely to have been truthful in their responses (not
distorting results in order to mask incompetency) and were very much in the ‘ignorant’ zone
(conscious or unconscious) , corroborating that Lean is not significantly deployed in the NZ
pipfruit industry.
5.3.2.2. Analysis of stakeholder responses to Kobayashi
The Kobayashi criteria used in the survey described a ‘state’ of the respondents’ organisations
and asked for an indication in how far that state had been achieved. With an average
response of 2.07 the stakeholders indicate that their organisations do some of the things in
each statement or do them sometimes.
The Kobayashi statements in the questionnaire represented a mixture of level 2 to level 5 of
the original statements (appendix 4 and 7), meaning that the identified level of Lean
implementation was lower than if the complete statements were used; in other words the
2.07 mean score is expected to have been lower if the complete statements had been used.

Page 225 of 372
These were not used because they were considered too long by the researcher and might
have reduced the number of responses and the intent of quick responses.
Because the survey statements described a state, there is no reason to suspect that responses
are inaccurate and here too, there is no reason to suspect largely inaccurate responses; the
results corroborating that Lean is not significantly deployed in the NZ pipfruit industry.
5.3.2.3. Analysis of stakeholder responses to Lean principles, methods and tools
Table 4-10 in chapter 4 shows a significant number of responses (62.2%) indicating ignorance
of the presented principles, methods and tools. Several of the presented principles methods
and tools were similar, e.g. Pull as a lean principle was mentioned, but so was ‘just-in-time’
and Kanban. All of the key words were taken from popular literature and where necessary
were presented with translation, e.g. ‘Poka Yoke (Error Proofing)’.
Most of the ‘use all the time’ responses came from the single company that had embarked on
the lean pathway, indicating that, once committed, all 20 principles methods and tools should
at least have been known, even if not used. A case could be made that if a respondent does
not know what a construct means, he or she cannot indicate if they are using it or not. The
argument is considered weak because the results of the principle method and tool question is
in line with the responses to the Kobayashi criteria statements, corroborating the state of the
industry within the context of the survey. The results, particularly when taking into account
the 62.2% ‘Don’t know what it is’ score, converge towards the position that the level of
current Lean deployment within the industry is poor.
5.3.3. Current Lean deployment: The reflective practitioner review
In the researcher’s experience, there may be no more than four organisations that are
dedicated to become Lean and have made moderate to significant progress. Several others
are currently showing interest, some individually and some through the Lean pipfruit cluster.
The industry does however use a number of practices that align themselves more or less with
Lean. These include understanding customer value, walking the shop-floor, load-levelling to
Page 226 of 372
prevent some overburdening, quick change-over, some error proofing and some use of just-
in-time. These practices appear to display a form of accidental unconscious competency,
which is closely aligned with unconscious incompetence or ignorance.
The practitioner review was sent to several industry stakeholders, each representing an
industry sector, for verification and validity. Stakeholders confirmed the practitioner’s review
as correct.
5.3.4. Synthesising the results towards the second objective
Results from the consultant survey and the stakeholder questionnaire converge with the
reflective practitioner review to deduce that the level of conscious or unconscious Lean
deployment within the NZ pipfruit industry is low. This is not surprising considering the low
level of Lean knowledge within the industry. Practitioner elaboration on some industry
practices that align themselves with Lean complements the view that, regardless of the lack of
Lean knowledge, certain practices organically emerge and prove their value in order to be
sustained by industry. The incontrovertible conclusion however, is that the NZ pipfruit
industry is not consciously Lean. The question now remains whether the industry should and
could be Lean. If Lean simply does not fit, then the results of interviews and survey match the
theoretical ‘fit’ of Lean into the industry. The following paragraph looks at the fit of Lean, both
in applicability and implementation.
5.4. Objective 3: Applicability and implementation approaches
The third objective proposed in chapter one is to:
‘Analyse the applicability and any implementation approaches of the Lean philosophy,
methods and tools within the NZ pipfruit industry’.
In this section, the literature review and reflective practitioner review complement and
enhance interpretability of constructs, while action research and case study triangulate to
corroborate and increase construct validity. The literature review assists with development of
the action research and case study strategies. As the range of the inquiry is expanded by using
different methods for each of the four objectives, it is not specifically highlighted in figure 5-4.

Page 227 of 372
Research element (Methodology)
Synthesising method (Methodology)
Analyse and discuss objective
Literature review Triangulation 1. Common themes, not bound to industry or context
Reflective practitioner review
Complementing (improves validity, elaboration, clarification
2. Current Lean deployment
Lean consultant interviews
Development (one method informs another)
3. Applicability and implementation approaches
Stakeholder survey Initiation
4. Model Action research Expansion (different methods for different objectives); self-evident Case study
FIGURE 5 -4 : SYNTHESISING METHODS USED FOR OBJECTIVE 3 .
5.4.1. Applicability and implementation: From the literature
This section summarises the analysis of the Lean literature towards establishing the
applicability and implementation approaches of Lean in relation to the NZ pipfruit industry
and presents a critical comment.
The literature review has revealed that there is no single definition for Lean and that the
definition in fact has been adapted to different environments. Similarly, the literature review
revealed different views on critical elements, forms of waste and implementations for various
industries. As Womack et al (1990) stated that they were ‘convinced that the principles of
Lean could be applied to every industry’, Womack and Krafcik believe (Womack, 2013) that
Krafcik’s landmark paper on ‘The Triumph of the Lean Production System’ (Krafcik, 1988b)
helped open up the floodgate of new ideas for the world’s managers.
Lean is not perfect and there is no single detailed model that determines its applicability or
implementation approaches across industries. Each organisation can benefit from
implementing selected elements of Lean theory that suit that organisation’s activities.
Literature provides a number of examples of implementation approaches, each particular to
individual organisations’ internal and external environment, culture, activities, timing and
other factors. Popular literature provides some articles on implementation approaches of

Page 228 of 372
Lean in a pipfruit environment (e.g. A Case Study of Adrian Cripps Ltd., 2007) but no academic
papers could be found.
The literature review therefore informs and complements other research methods to
determine the applicability and implementation approaches for the NZ pipfruit industry.
5.4.2. Applicability and implementation: Reflective practitioner review
This section uses the reflective practitioner review as a basis for a brief analysis and discussion
of the applicability and implementation approaches of Lean for the NZ pipfruit industry.
The practitioner has seen a number of pipfruit organisations over the years but none of these
were intending to become Lean before this research project started. A number of these
organisations displayed particularly ‘un-Lean’ behaviours, often based on old-fashioned
beliefs. These included for example the embedded belief that higher pack-outs lead to higher
returns and that the quality of the product merely had to be to the lowest specification.
As a result of the fact that there were no Lean organisations in the pipfruit industry at the
time this inquiry started, the practitioner could not report on applicability and
implementation in the NZ pipfruit industry from an empirical perspective. He can however
report on what he has observed and learned in other industries and what he observed in the
NZ pipfruit industry that offered opportunities for Lean implementation. Similarly, from the
practitioner’s perspective, not all Lean principles methods and tools are equally applicable to
the industry. Some simply do not fit this industry that conceptually differs vastly from
manufacturing cars.
The reflective review clarifies and elaborates on the intuitive applicability of Lean to the
pipfruit industry; in the practitioner’s view, there are Lean elements used with some
adaptation required (e.g. table 4-1).

Page 229 of 372
5.4.3. Applicability and implementation: Consultants complementary views
Two questions to consultants resulted in their view of the applicability of Lean for the NZ
pipfruit industry. Consultants were strongly positive (95.2%) that Lean would benefit the NZ
pipfruit industry. Consultants also pointed at philosophy or a combination of philosophy with
tools as preferred implementation approach (95.2%). Although this result has been qualified
earlier in section 5.2.3, it complements and converges with the results from other methods
which are described in the following sections to confirm the applicability and implementation
approaches for the NZ pipfruit industry.
5.4.4. Applicability and implementation: Action research component
This section analyses and discusses the action research results to assess the applicability and
implementation approaches of Lean for the NZ pipfruit industry. The action research method
was expected to provide some original data, particularly where it concerned an element of
the industry for which no academic literature had been found: The orchards or growing fruit.
5.4.4.1. Action research orchards (ARO) contribution to applicability and
implementation
Assessments: The pre-, middle- and post-inquiry period Lean assessments provide evidence
that orchards can implement Lean with a degree of success. The assessments also show a
movement upwards and downwards; there was no consistent upward trend across all
assessment criteria, and this was not expected considering the volume of extra information
that the orchard managers had to cope with. Some elements were scored higher at the end of
the first season than they were scored at the end of the second season. This may have been
caused by elements being neglected after the initial result or a form of ‘improvement fatigue’;
it may also have been caused by inaccuracies in the assessment or by ‘assessment fatigue’.
There is however relative consistency across cross-sectional assessments, indicating that the
general result of an improved Lean status is acceptably reliable.
Score consistency: Consistency of scores across the different measurement instruments also
indicates that the general results are reliable and valid. This indicates that the Lean principles,

Page 230 of 372
methods and tools that had been implemented by the ARO are applicable to the orchard
situation. A broader list of principles methods and tools was discussed as not all were
implemented, and the views and experiences of orchard managers can be found in a table as
appendix 15 (refer to table 5-1 for an example).
TABLE 5 -1 : SAMPLE OF APPENDIX 1 5 WITH 3 2 PRINCIPLE S/METHODS/TOOLS DISCUSSED
Principle/method/tool Use Grower/Orchard
Customer Value Current Not specifically communicated to orchards or communicated late, most commonly around December of January.
Future state
Growers can affect what is grown (production) if they know what the customer requires and in which country the customer is based (in order to get access to that market). The ideal state communicates customer value just before pruning.
Appendix 15 discusses the current state and the potential future state of thirty-three Lean
principles, methods and tools considering the findings from the inquiry and provides general
and specific examples that can be considered. The table is a volume of pages long and is
appended for that reason.
Managers’ experiences: Orchard managers expressed their views on the applicability and
implementation of Lean at the end of the inquiry. While during the inquiry the focus was on
the technical aspects of lean in an orchard situation, orchard managers expressed their beliefs
on the applicability and implementation as they had experienced Lean during the course of
the inquiry.
Applicability and implementation: The results shown in figure 4-15 show that some elements
are assessed by orchard managers as very suitable but relatively difficult to implement. These
included staff empowerment, continuous improvement, waste identification, even production
and load levelling. Orchard managers appeared to see the justification for using these
elements, but found the implementation harder. Responses to a question about the role that
the seasonality of the industry played, varied from ‘everything revolves around the season’
and ‘throws some curve balls’ to ‘each year is different from the last which is why there will be
some difficultly in implementing all parts of lean’. Responses also indicated that ‘we are able

Page 231 of 372
to act or re-act with careful planning and open discussion ’ and that ‘many orchardists have
blamed external factors for poor performances in the past’, indicating that the managers were
aware that the season cannot be blamed for everything and that the managers exerted a
certain amount of influence.
Low scoring elements: Several elements scored low in terms of applicability and
implementation. These included Just-in-time supply and value stream mapping. Just-in-time
supply is not practical for fruit that must be harvested at the optimum maturity level. Delaying
harvest until the fruit is required is a physiological impossibility if fruit quality must be
optimal. It is applicable, for example for the supply of chemicals, where JIT is used by the
managers. Value stream mapping scored low as well. The researcher considered the low score
to be the result of inadequate education and training of the orchard managers by the
researcher. Orchard managers were simply not in a position to judge the applicability and
implementation of value stream mapping as they did not have enough background to do so.
Some managers did not answer the specific question in the final questionnaire.
The orchard action research converges with other action research and case study results to
validate the third objective and is discussed in the synopsis to this chapter.
5.4.4.2. Action research packhouse (ARP) contribution to applicability and
implementation
Assessments: The action research packhouse/coolstore (ARP) also participated in different
assessments at the start of the inquiry, after one season and after the second season. The
results on the used Kobayashi criteria (figure 4-16) show significant progress across criteria
over the two-season inquiry period, with one criterion regressing, being technology. This is
not considered significant as the ARP continued improvement in general and technology is not
directly relevant to Lean. The slow progress after the first season is reflected by the scores
that are relatively similar as the wider industry scores. The first season presented little
progress in the state of the ARP, while the ARP reported improvement across the board after
the second season.
Applicability: Relevant are the areas where little progress has been made during the inquiry
period. These areas may not have a high level of applicability in a packhouse situation or may

Page 232 of 372
be difficult to implement and include people empowerment, conservation of energy and
materials and technology.
Effect of season: People empowerment is presenting to be an issue in seasonal activities
where the permanent employees—particularly supervisors—appear to have little time for
training and coaching while being the people that have the most knowledge of the operation
and its processes.
Methods and tools: On the more technical side, the ARP appeared to pick up methods and
tools with relative ease and make progress in their use of these (figure 4-17). Consultants
often refer to these as ‘the low hanging fruit’, a comparison that reflects a poor analogy in
fruit-technical terms; in orchards, it is not the low hanging fruit that must be harvested first—
it is the fruit approaching maturity that is ready for harvesting. The analogy will play a role in
the development of a model for the industry in chapter six.
A difficult start to implementation: The start of the inquiry appeared difficult for the ARP. The
manager had some knowledge of Lean but generally, staff had no knowledge of Lean. This led
to a number of sessions with explanations, followed by challenges by the researcher, e.g. to
identify waste (e.g. appendix 16). On a number of occasions, the ARP supervisors had not
been able or only partly been able to follow up, given the challenges of the packing season.
Working ‘in’ the business was considered more pertinent than working ‘on’ the business. This
made for slow progress and highlights the difficulty of getting an organisation to focus on
organisational change during periods of intense seasonal activity. During the off -season, it
appeared easier to introduce Lean elements than during the season itself when short term
daily pressures distracted from longer term gain efforts. This experience is consistent with the
experience of the ARO. Packhouse staff readily confirmed this to be the case and seasonal
pressures may be a distractor throughout Lean implementation during the season.
A number of the critical factors involved in implementing Lean (e.g. table 2-6) were readily
identifiable within the ARP, ranging from fundamental ignorance to lack of implementation
skills to company culture and the relationship between management, permanent staff and
seasonal staff.
The packhouse action research converges with other action research and case study results to
validate the third objective and is discussed in the synopsis to this chapter.

Page 233 of 372
5.4.4.3. The Lean pipfruit cluster; additional confirmation
The Lean pipfruit cluster offered an additional opportunity to exercise limited action research
and help achieve the third objective.
The cluster’s activities include orchard activities and packhouse/coolstore activities. Exporters
have not yet joined and here too, the absence of exporters is conspicuous. Each visit forms a
basic iterative cycle where the researcher can elaborate and complement the host
organisation’s information. The feedback loops through the steering group confirmed the
value of the operational sessions.
Before each visit, the coordinator clarified that feedback from participants is expected in
relation to what participants have learned and plan to implement in their own organisations,
as well as any recommendations they have for the host organisation. Host organisations have
reported that feedback has been valuable. Feedback has been informative and has focussed
on visual management and 5-S elements including stand-up meetings, flow and Kanban for
packhouses and coolstores. Orchards focussed on processes. Several orchard visi ts included
visits to orchards that had little knowledge of Lean. Some of these presented their process
and received feedback that could help them improve the presented process. On other
occasions, distinct Lean elements were recognisable despite the unconscious Lean ignorance.
No list of applicable Lean elements has been developed by the cluster as it progresses through
further meetings. Practical implementation is both shown and discussed at each session,
leading to validation of applicability and implementation through practice.
The ongoing results from the Lean pipfruit cluster converge with other action research and
case study results to validate the third objective and establish applicability and
implementation approaches.
5.4.4.4. Reflective cycles; reflection at long and short term intervals
Both the action research orchards and packhouse were subject to reflecti ve iterative cycles
within cycles; the Lean cluster was not. The iterative cycles included data gathering, feedback
of data, analysis and discussing new action (Coughlan and Coghlan, 2002). Meetings with staff
resulted in actions by staff which were reviewed at the next meeting and in an operational
context: Why did some things work? Why did some things not work? The researcher then

Page 234 of 372
reflected on the previous period before the next mini-cycle was started. Short term reflective
cycles provided some opportunity for learning and developing a problem solving mind-set
(Calhoun, 1993). Typical outcomes were that intended measures were not completed due to
time constraints. Seasonal pressures did not facilitate sometimes simple improvement tasks.
At the end of each of the two action research years, the researcher reflected on the year
gone-by and extracted broader lessons learned as a result of the longer iterative cycle. These
too were discussed with participants in order to continue the exploration of Lean in the
industry. Broader lessons learned included the realisation that the seasonality of the industry
demanded a different approach towards learning, training and improvement. Other lessons
are discussed as original theory in paragraph 5.4.4.5.
5.4.4.5. Original theory; Lean re-defined for pipfruit and horticulture
During the course of the action research component with the orchards, several original
interpretations of Lean emerged. These included a construct regarding the orchard as a
factory and trees as machines, producing product for a customer. Considering what made the
machines produce (and thus could be wasted), waste was not restricted to human activities
and processes but was also considered to include the in-process use of inputs such as
(wasted) sunlight, (wasted) water, (wasted) real estate, i.e. orchard floor space and (wasted)
soil qualities. These interpretations have not been encountered before in literature and it is
here that new theory is resulting from action research.
5.4.4.6. Action research synopsis
The action research component of the inquiry synthesises with elements of the literature
review and the reflective practitioner review to conclude that Lean i s applicable to the sample
organisations, albeit that not all Lean principles methods and tools were equally applicable.
This synchronises with Lean theory which has clarified in the literature review that different
industries adapt in different ways to Lean theory. Similarly, the implementation appears
challenging for certain principles methods and tools, particularly caused by the seasonal
nature of the industry which leads to a high volume of casual workers in a push environment.
Triangulation across data sources and methods adds robustness to the results (e.g. Creswell

Page 235 of 372
and Miller, 2000), and the action research component also complements through elaboration
and develops robustness of results by collaborating with other methods.
5.4.5. Applicability and implementation: Case study component
This section analyses and discusses the case study results to assess the applicability and
implementation approaches of Lean for the NZ pipfruit industry.
5.4.5.1. Case study packhouse (CSP) contribution to applicability and
implementation
Assessments: As with the action research companies, the CSP showed considerable progress
on all three measurements, the 20 Kobayashi keys, 20 Lean principles methods and tools and
the Tapping et al (2002) assessment. A number of tools were well understood and used. The
Lean packhouse manager had made sure that there was improved employee involvement and
empowerment and most of the interviewees showed an enthusiasm during interviews that
appeared to be a reflection of their involvement in Lean.
Applicability: The improvements measured during the assessments showed that most of the
assessment elements were applicable in a packhouse environment. Of all industry elements
(growing, packing, storing and exporting) a packhouse shows the most parallels with a
manufacturing environment and it is expected that the packhouse would demonstrate the
best ‘fit’ with traditional Lean principles methods an tools. A summary of the applicability of
lean principles methods and tools is attached as appendix 15. An example of appendix 15 is
given in table 5-2.
TABLE 5 -2 : SAMPLE OF APPENDIX 1 5 WITH 3 2 PRINCIPLES/METHODS/TOOLS DISCUSS ED
Principle/method/tool Use Packhouse/coolstore One Piece Flow Current A form of one piece flow applies; apples from 400 kg
bins are continuously packed into different cartons of 18 kg, which are packed sequentially.
Future or ideal state
Questionable if improvement can be made when assembly follows disassembly. One piece flow can be applied after pre-sizing, allowing packing to demand.
Page 236 of 372
Pull was used for bins from the coolstore in order to be packed but less so to comply with
customer orders. On a number of occasions however fruit was packed particularly for a non-
specific customer in a country with special access requirements. This is a well-known fact in
the industry because several countries ask for specific phytosanitary quality assurance
programmes which require registrations of orchards, packhouses and coolstores. Packing for
customers in these countries requires selection of bins of orchards that comply with strict MPI
requirements.
Implementation approach: The packhouse manager drew up a dedicated Lean transformation
programme with himself being the champion, and he was supported by senior management.
A number of fundamental Lean elements were listed by the champion with target dates for
achievement. These included 5-S split up in sequential target dates, daily stand-up meetings,
visual management improvement, Lean thinking and training. The manager reported after the
first season that staff had started to demonstrate behaviours along the lines of continuous
improvement to the point where they would no longer ask to change something but rather
effect the improvement and report afterwards. Emiliani (1998) refers to this behaviour as
‘Lean behaviour’ where people perform actions because of their intrinsic rewards; the
improvement results in pleasure that is worth repeating. A distinct culture change took place
in the packhouse.
During the second season, the CSP hired a consultant to attend for several days and practice
value stream mapping with a number of supervisory staff. These sessions were attended with
enthusiasm and the CSP staff was encouraged by management to continue to look at their
processes via the value stream mapping tool. During one of the Lean cluster visits, the staff
made a point of showing how they had improved a load-out process using value stream
mapping. This session was considered valuable by the packhouse manager as it presented a
new face to present new information, and staff responded well to the initiative.
The CSP case study corroborates with the CSPC case study and action research data to confirm
that the tested Lean principles methods and tools as in appendix 15 are largely transferable to
the packhouse/coolstore situation and thereby helps to validate the third objective of the
inquiry.

Page 237 of 372
5.4.5.2. Case study packhouse using a consultant (CSPC) contribution
Assessments: The CSPC showed a significantly improved Lean position on the assessment
using the 20 Kobayashi keys (Kobayashi, 1995). A similar result was evident with the scores on
the 20 Lean principles, methods and tools. Interesting was that the difference between the
post 2013 season and post 2014 season scores was relatively minimal. Scores on the Tapping
et al (2002) instrument followed a similar pattern with the 2014 score showing an
improvement on 2013 in seven criteria and a deterioration in one criteria. The total weighted
score for 2014 was slightly higher than for 2013 at 108.0 versus 98.7. The total weighted score
of the assessment before the inquiry started was 50.4, confirming that the organisation had
made significant progress but progress decelerated during the last half year.
Possible causes for the result were that the company had ‘dropped the ball’ perhaps because
the consultant stopped visiting monthly and started visiting quarterly in October 2013. Having
interviewed several people and seen the packhouse operating at the same time of the last
assessment, it appeared erroneous to believe that the operation had ‘dropped the ball’. The
researcher discussed the results with the packhouse manager and quality manager who both
agreed that there appears to be a significant drop in Lean activity, immediately fol lowing the
pressure of the export season. They personally experienced this and reported on ‘Lean
fatigue’ which lasted for between one and two months. This phenomenon is of some
significance as the sudden finish to the seasonal activities happens to most organisations
within the industry.
The organisation has improved its position from the start of the inquiry on all three scales.
Applicability: The organisation had made significant progress during the period of the inquiry
and indicated that the workplace organisation and continuous improvement had been
applicable and helpful. Material control, standardised work and level production all featured
during the interviews and the researcher’s observations confirmed the applicability of these
methods and tools. The fact that the Kanban system was taken as an example and copied by
other Lean cluster companies indicates that the tool can be applied effectively. Other tools
were also used successfully, confirming the applicability of these. These included some
problem solving skills, PDCA, coaching, Lean accounting and a number of other standard Lean
methods and tools.

Page 238 of 372
Implementation approach: The consultant’s monthly visits, combined with elements of the
Toyota coaching method such as agreeing on a timescale for reviewing the introduced
elements was very helpful. The consultant is an external champion, knowledgeable and
dedicated to the single task of Lean implementation. The company paying for the consultant
created an environment of getting the best value for money, leading to motivation to learn.
The consistent introduction of new Lean elements provided education, training but also
potential mental ‘overload’ of staff trying to implement what was understood while doing
their normal jobs the normal way. Reinforcement and encouragement by the consultant
meant that the organisation continued to make progress. In addition, the consultant would
provide an implementation activities plan, stating activities, people responsible for each and
when each was planned to be completed. This too appeared to be a helpful guide to continue
working ‘on’ the business aside from working ‘in’ the business.
During interviews, key staff explained that they worked more ‘on’ the business in the off -
season and this appears consistent with the experience at the action research orchard and
packhouse. Although the opportunity to work on continuous improvement may be easier to
take during the off-season, it appears imperative to continue with observations and
improvement during the season, when it matters.
5.4.5.3. Mini case studies Exporter 1 (CSE1) and Exporter 2 (CSE2) contribution
As reported in paragraph 3.5.5.1 of the chapter on methodology, exporters did not respond to
the call for research volunteers, and direct approaches to a number of export companies
eventually resulted in two exporters granting restricted cooperation. The researcher had to
use his personal influence and discuss the inquiry objectives in some detail before both
exporters agreed to participate as they did. The fact that out of more than eighty exporters,
there were no offers to volunteer and that only two exporters participated albeit with
caveats, may be taken as evidence of the exporters’ position in relation to the inquiry.
If nothing else, the inquiry was not considered relevant enough to volunteer participation.
Considering the earlier reported value stream breakthroughs from the ARO, it appears that
the opposite is evident. Contributing to the reluctance to contribute is the within-industry
competition between exporters for supply (growers) and the in-market competition for
customer sales as is evident from the practitioner review.

Page 239 of 372
Both exporters rated the customer very high in the interviews. The customer must be
qualified at this point in order to clarify exporters’ positions. The practitioner review clarified
that exporters deliver a sales and logistics administration service to the grower for which they
claim a commission or set fee per sold unit. The exporters sell the fruit to the customer. To
the exporter therefore, both the grower and the purchasing customer are customers for their
services. This is an important point as the exporter’s value stream is confused with one
customer at the end of the value stream and the other at the beginning of the value stream.
This dichotic relationship is unlikely to serve the end-customer as well as it potentially could,
and by inference, the same applies to the grower.
Notwithstanding the up- and downstream customer concept, the exporters both made clear
that they spend a lot of time in the market to discuss product and delivery options to the
purchasing customer. Exporters are therefore knowledgeable about the purchasing
customer’s requirements and intuitively maintain the first Lean principles of Womack et al
(1990). Although CSE2 was adamant that communication and information were very
important, relevant customer information was not relayed to the grower/supplier until such
time that less influence could be exerted by the grower on the product. CSE2 did
communicate to growers what varieties were in demand but growers would sometimes plant
a different variety because they needed to level the load during harvest.
The responses of exporters to requests for volunteers and the subsequent lack of exporter
volunteers may illustrate that there may be unconscious ignorance (Flower, 1998) amongst
exporters that prevents a more positive approach towards Lean in the industry. The exporter’s
position in the value stream is very much applicable as was shown by the ARO. Although not
exposed to any measurements, the researcher believes that exporters would benefit from
Lean supply chain and service delivery principles methods and tools. The exporter case studies
do not triangulate very well with the action research and case studies of orchards and
packhouses/coolstores. The mini case studies do complement our understanding of the third
objective by clarifying the difficulties in obtaining data about applicability and implementation
approaches from exporters. Exporters would do well to remember that it is the supply chains
that compete, not individual companies (Christopher & Towill, 2001).

Page 240 of 372
5.4.5.4. Case study synopsis
Both packhouse case studies demonstrated that Lean is applicable in a packhouse
environment and that Lean can be implemented in various ways. It is evident that seasonal
pressures distract from Lean implementation and packhouses would benefit from a dedicated
and regular reinforcement of Lean. It was also apparent that Lean cannot be implemented
inside a period of a few years and that continued attention is required to keep the positive
development going.
Exporters appeared to be aware of the relevance of their paying downstream customers but
were compromised by their dependence on upstream customers (growers) for supply. This
placed exporters in a position of balancing grower demand for high pack-outs with customer
demand for high quality fruit. In addition, case study exporters did not see that customer
requirements are best communicated before pruning, at the end of each harvesting season,
and not in December or January when the grower cannot change the quality of his fruit.
5.4.6. Synopsis of analysis and discussion of the third objective
The case study component of the inquiry synthesises with elements of the literature review,
the reflective practitioner review, the consultant interviews and the action research element
through triangulation, complementing and development to support the third objective of
chapter one and helps to provide a basis for achievement of the fourth objective; the model.
5.5. Chapter conclusion
5.5.1. Achieving objectives
This chapter analysed and discussed the results of the inquiry and supports the following:
Common Lean themes partly fit the orchard activity, substantially fit the
packhouse/coolstore activity and fit the exporter activity as service provider but
remains mostly untested. This confirms the first objective.

Page 241 of 372
The current level of Lean deployment in the industry is low; there are elements of
intuitive but intuitive unconscious knowledge in terms of Lean implementation. This
confirms the second objective.
A number of, but not all, Lean principles methods and tools are applicable to the
several industry sector activities of growing, packing, storing and exporting. Certain
principles methods and tools are affected by the seasonal nature of the industry; this
means that some are affected by the push component of the industry, some require
more emphasis (e.g. visual management, standardised procedures and training for
seasonal staff) while others such as the waste of natural resources, are new concepts
to Lean theory. The implementation appears more challenging during the season than
during the off-season and a dedicated champion may prove valuable when
implementing Lean.
This synchronises with Lean theory which has clarified that different industries adapt in
different ways to Lean theory.
This achieves the third objective.
5.5.2. Reliability and validity
Triangulation across data sources and the applied mixed methods adds robustness to the
results and supports the results accordingly (Creswell and Miller, 2000; Snow and Anderson
(1991, cited in Tellis, 1997)). The elements of table 3-5 of the methodology chapter have been
executed diligently to ensure reliability and validity of the inquiry results.
Although the results are the consequence of an inquiry into the pipfruit industry, numerous
references have been made to the wider horticultural industry. Applicability of results is
expected to cross reference with other horticultural annual tree crops and to a lesser degree
with annual horticultural crops such as vegetables. Horticultural crops, but specifically annual
tree crops, have similar dilemmas to the pipfruit industry. These include long lead times
before production, use of natural resources, seasonality of the industry and push of product
into the market.

Page 242 of 372
5.5.3. General comment
The number of research companies and the complexity of mixed research methodologies
resulted in a substantial volume of data. Outcomes were nonetheless both generalised and
detailed in terms of specific Lean principles, methods and tools because of the large number
of these involved. For specific information on applicability of principles methods and tools,
appendix 15 summarises thirty-three, indexing each to the three main industry sectors.

Page 243 of 372
6. Developing a Model, the fourth objective
“There is nothing quite as practical as a good model” (variation on Kurt Lewin, 1951)
6.1. Introduction to development of a model
Objective four of this thesis is to:
‘Develop a conceptual Lean model for the NZ pipfruit industry and consider if the model is
applicable to the wider horticultural sector’.
The next section analyses and discusses the development of an industry model as proposed
for the fourth objective.
FIGURE 6 -1 : SYNTHESISING FINDI NGS INTO INDUSTY MOD ELS
The deductive component synthesises between mixed methods following the format of
Greene et al (1989) where different research elements combine through selected synthesising
methods to support the stated objective (figure 6-1). The fifth synthesising method
Research element (Methodology)
Synthesising method (Methodology)
Analyse and discuss objective
Literature review Triangulation 1. Common themes, not bound to industry or context
Reflective practitioner review
Complementing (improves validity, elaboration, clarification)
2. Current Lean deployment
Lean consultant interviews
Development (one method informs another)
3. Applicability and implementation approaches
Stakeholder survey Initiation
4. Model Action research Expansion (different methods for different objectives); self-evident Case study

Page 244 of 372
(expansion) is not specifically highlighted as the range of the inquiry is expanded throughout
the inquiry by using different methods to achieve objectives.
The section will first reiterate the model extracted through the literature review at the end of
chapter two. A discussion follows on how results from the inquiry can be used to adapt the
model to industry-specific characteristics. The model is followed by the development of a
framework. The framework includes the lessons learned, including a future state Lean activity
planner with principles, methods and tools that supports the application of the conceptual
model. The relevance of the framework is discussed during the development of the industry-
specific model. A brief discussion on its applicability to other horticultural sectors follows,
after which a synopsis of the chapter captures the essence of the model and framework.
6.1.1. The Lean model
Several Lean models have been discussed and analysed in the literature review. These are
summarised in table 2-3 of chapter two. The fundamental model from chapter two is shown in
figure 6-2 with two text boxes added, summarising the critical e lements of the model.
The environment largely influences what the customers consider to be their need. The product considered by a customer is termed the
‘product value expectation’.
The organisation’s belief system largely influences the people’s involvement in systems and processes that create the customer product. The created product is termed the ‘product value creation’.
Product Value Expectation
Environment Customer
Systems and processes
People Involvement Bel ief System
Product Value Creation
FIGURE 6 -2 : FUNDAMENTAL LEAN M ODEL WITH SUMMARY EXPLANATIONS
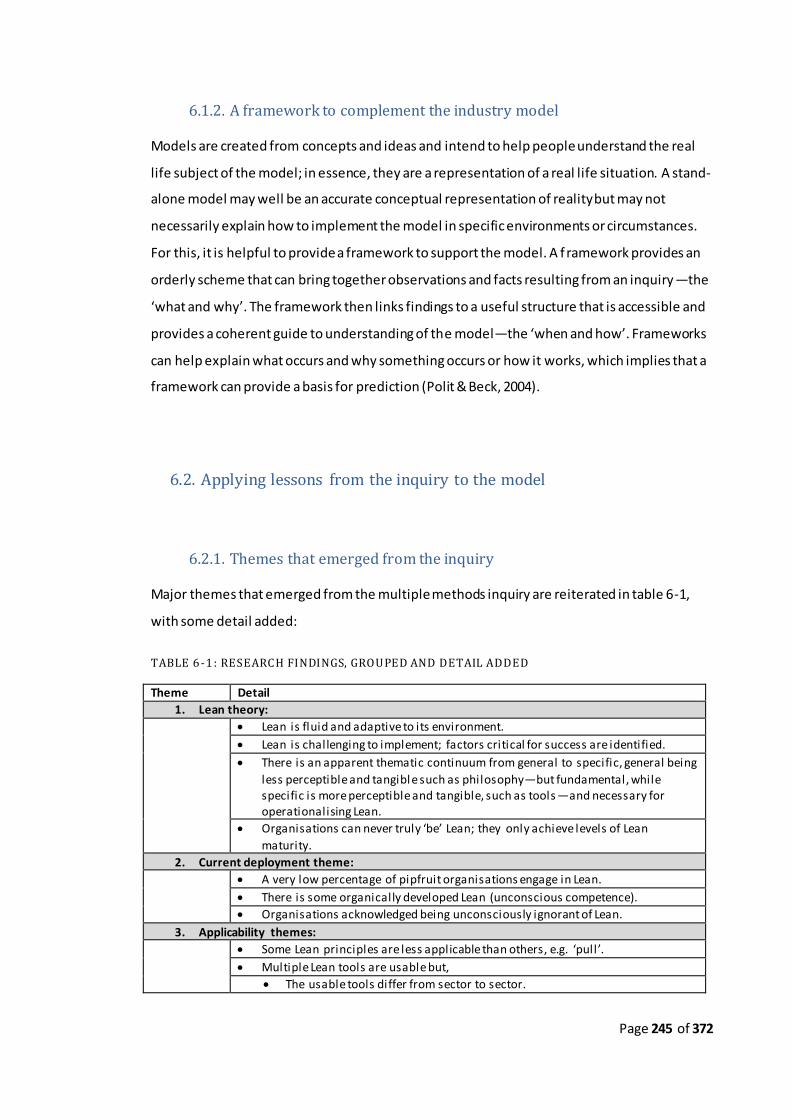
Page 245 of 372
6.1.2. A framework to complement the industry model
Models are created from concepts and ideas and intend to help people understand the real
life subject of the model; in essence, they are a representation of a real life situation. A stand-
alone model may well be an accurate conceptual representation of reality but may not
necessarily explain how to implement the model in specific environments or circumstances.
For this, it is helpful to provide a framework to support the model. A f ramework provides an
orderly scheme that can bring together observations and facts resulting from an inquiry—the
‘what and why’. The framework then links findings to a useful structure that is accessible and
provides a coherent guide to understanding of the model—the ‘when and how’. Frameworks
can help explain what occurs and why something occurs or how it works, which implies that a
framework can provide a basis for prediction (Polit & Beck, 2004).
6.2. Applying lessons from the inquiry to the model
6.2.1. Themes that emerged from the inquiry
Major themes that emerged from the multiple methods inquiry are reiterated in table 6-1,
with some detail added:
TABLE 6 -1 : RESEARCH FINDINGS, GROUPED AND DETAIL ADDED
Theme Detail
1. Lean theory:
Lean is fluid and adaptive to its environment.
Lean is challenging to implement; factors critical for success are identified.
There is an apparent thematic continuum from general to specific, general being
less perceptible and tangible such as philosophy—but fundamental, while specific is more perceptible and tangible, such as tools —and necessary for operationalising Lean.
Organisations can never truly ‘be’ Lean; they only achieve levels of Lean
maturity.
2. Current deployment theme:
A very low percentage of pipfruit organisations engage in Lean.
There is some organically developed Lean (unconscious competence).
Organisations acknowledged being unconsciously ignorant of Lean.
3. Applicability themes:
Some Lean principles are less applicable than others, e.g. ‘pull’.
Multiple Lean tools are usable but,
The usable tools differ from sector to sector.

Page 246 of 372
4. Implementation themes:
Lean is difficult to implement.
Having the Lean philosophy is a prerequisite of becoming Lean.
The use of a champion or consultant drives progress.
The relative level of progress decelerates over time.
5. Industry-wide themes
There is a lack of communication in the supply chain; exporters communicate
fruit quality demands too late (after all pruning and thinning has been completed, affecting colour and size of fruit).
Lean fruit type development is achieved by time-paced development.
The Lean pipfruit cluster encourages benchmarking.
6. Sector specific themes:
Lean applications differ by industry s ector.
Orchards compared manufacturing process with machines to growing process
with trees.
Orchards identified different forms of waste in the orchard such as (wasted)
sunlight, (wasted) water, (wasted) real estate, i .e. orchard floor space and (wasted) soil qualities
Packhouses packed fruit while customers (and export countries) were unknown
(‘on consignment’).
Country rules concerning pests and market access create instability/variable
packing outcomes for orchards, packhouses/coolstores and exporters.
Exporters had a focus on the customer but did not timely communicate
customer demand to the orchards.
7. Seasonal themes:
The seasonal pressures caused by high volume and little time creates
overburdening during the season.
This leads to a sudden 10-fold staff increase which requires:
Training
Is difficult to empower
Is difficult to cross-train
Organisations had different approaches for permanent staff and seasonal staff.
Seasonal pressures do not facil itate working on the organisation; press ures
allow only working in the organisation.
There is possibly a form of ‘improvement fatigue’ developing.
Weather variability determines production activities which vary to achieve
customer demand.
These grouped observations present challenges to the basic model from chapter two, and will
assist adapting the model to industry sectors and the associated framework.
6.2.2. Synthesising sector-specific applicability data to the model
The results of the literature review led to the fundamental Lean model that emerged in
chapter two. The model from chapter two is transparent for stakeholders as a meta-model.
Page 247 of 372
The question arises if this model is affected by the applicability of principles, methods and
tools for each industry sector as these emerged from the inquiry. This will be discussed in the
following paragraphs.
The supporting framework for the model includes the lessons concerning the implementation
of Lean in different types of industry sectors such as growing, packing/cool -storing and
exporting. The inquiry showed that not all Lean principles, methods and tools are equally
applicable to these different types of sector activities within the industry. Appendix 15
(‘Future state Lean activity planner’) elaborates on the level of current implementation and
future applicability. It is considered helpful to visually summarise the differences between
applicability of principles methods and tools to each of the different industry sector activities
(figure 6-3).
The results of the action research and case study demonstrate that most common Lean
methods and tools that were tested are applicable to a packhouse/coolstore situation. The
action research orchard evidenced that not all standard Lean methods and tools can be
readily implemented in an orchard environment. In addition, the action research orchard
started developing the theory that natural resources can be wasted when they should be
used, and this created the beginning of a new form of waste, followed by processes to reduce
that waste.
Figure 6-3 presents a comparison of the applicability of thirty-three Lean principles, methods
and tools for each of the industry’s sectors (growing, packing/storing and exporting). The
comparison resulted from the inquiry. Each of the principles, methods and tools was scored
using the following criteria:
• 0 = Not applicable,
• 2 = Partly or potentially fully applicable-if contextualised to industry,
• 4 = Highly applicable
Not all thirty-three principles, methods and tools were included in the inquiry for all industry
sectors and figure 6-3 shows several ‘blank’ areas where the inquiry did not provide data.
Where an item did not quite fit the descriptions above, the scores of 1 and 3 were used to
indicate the expected level of applicability.

Page 248 of 372
FIGURE 6 -3 : APLICABILITY OF LE AN PRINCIPLES, METHO DS AND TOOLS BY SECTOR
Although the thirty-three principles, methods and tools were not aligned with the
characteristics established in chapter two (table 2-12), they can be allocated to the themes of
people involvement or systems and processes and can be projected on the model from
chapter two—for each industry sector. The effect of this conceptual approach would be a
different radar graph for each industry sector inside the People Involvement and Systems and
Processes themes, resulting in different applicability models for each industry sector. Such
projection is expected to clutter the clarity of the model and it is proposed to reflect the
applicability of elements within the supporting framework.

Page 249 of 372
6.2.3. Effect of the inquiry findings on the model
This paragraph intends to discuss the effects that the inquiry findings have on the basic model
from chapter two and help shape the basic model into several industry models.
Paragraphs 6.2.1 and 6.2.2 discussed the findings which are summarised as follows:
1. Lean theory, where Lean was found to be challenging, fluid and adaptive.
2. Current deployment, where Lean was found to have a low level of deployment.
3. Applicability (6.2.2), where different tools were found to have different levels of
applicability for each industry sector.
4. Implementation, where Lean was found difficult to implement and instilling the
philosophy and the use of a transformational driver assisted implementation.
5. Industry-wide themes, such as lack of communication in the supply chain.
6. Sector-specific themes, such as new orchard waste identification, production without
knowing the customer, the customer’s value expectation and the customer’s country.
7. Seasonal themes, such as variability of production due to effect of the natural
environment (e.g. weather) in the orchard, high seasonal pressures leading to
overburdening and a 10-fold increase of staff with all its consequences.
The effect of the seven themes on the basic Lean model from chapter two is discussed here:
1. The fact that Lean theory was found to be challenging, fluid and adaptive is partly
evidenced by the fact that the Lean pipfruit industry model that follows is an
adaptation from the basic model. Lean continues to develop, posing challenges for
those who implement Lean, specifically in new environments.
2. The relatively low level of current deployment in the industry is an empirical fact and
has no effect on the creation of a new pipfruit industry model, other than confirming
the need for such a model to assist the industry with understanding Lean.
3. The different levels of applicability of selected tools for each industry sector may
affect the model, however as stated in paragraph 6.2.2, projecting the level of
Page 250 of 372
applicability of tools on the basic model would clutter the model and also finds a
better fit in the framework.
4. The difficulty implementing Lean showed the importance of the embedded
philosophy as already presented in the model from chapter two. The use of a
transformational driver such as a champion or consultant to assist deployment of
Lean is important. As implementation is difficult, it is apparent that a framework is
needed to assist implementation.
5. Industry-wide themes, such as lack of communication in the supply chain affect each
individual industry sector but specifically the value stream between sectors. The belief
system and systems and processes of the mature Lean organisation manage effective
communications between value stream partners and communications do not present
a new theme that would need to be introduced to an industry or sector-specific
model.
6. Sector-specific themes such as new orchard waste identification and production
without knowing the customer do lead to the potential to develop sector-specific
models.
7. Some seasonal themes are buffered by a Lean organisation, e.g. the natural
environment (e.g. weather) in the orchard cannot be changed but processes and
people involvement can mitigate such effects and therefore lead to improved
production. Other seasonal themes such as a 10-fold increase of transient staff will
affect the model, e.g. the Lean organisation may use the permanent workers during
the off-season to plan, prepare, simplify, enable and smooth the seasonal activities.
Summarising the effect of the inquiry findings, there are themes that affect the industry
model because they affect the people involvement, the systems and processes and the
product themes of the model. These are:
The fact that only a portion of the product is created to match the customer’s value
expectation while the balance is pushed into the market
The 10-fold increase of staff to the growers and the packhouse/coolstores; and

Page 251 of 372
The approach by orchards to identify new forms of waste in not maximising the use of
natural resources such as sun light.
This leads to the proposal that the models representing the exporter, packhouses/coolstores
and growers are adaptations from the fundamental mode from chapter two. The sector-
specific models will be discussed next.
6.2.4. A Lean pipfruit model for industry sectors
The model in figure 6-4 emphasises that the Lean vision, philosophy, principles and strategy—
captured by the concept of ‘Belief Systems’— are a vital prerequisite to reach the people
within the organisation and affect the systems and process design. Lean must be pervading
the organisation at all levels before it can call itself truly Lean. Similarly, the different
applicability of Lean principles, methods and tools (figure 6.3) shows that not all Lean applies
equally to the different industry sectors while other elements are new to the theory of Lean
(e.g. Total Tree Maintenance).
The model depicted in figure 6-4 shows an integrated and interacting connection between
people and processes to create products (services are considered to be a product) of value to
customers, independent of available machinery or material, and similar to Krafcik’s 4-M model
that differentiates between hardware and human factors (figure 2-14).
Belief System
People Involvement
Systems &
Processes
Product
Environment
Customer
FIGURE 6 -4 : FUNDAMENTAL LEAN MODEL
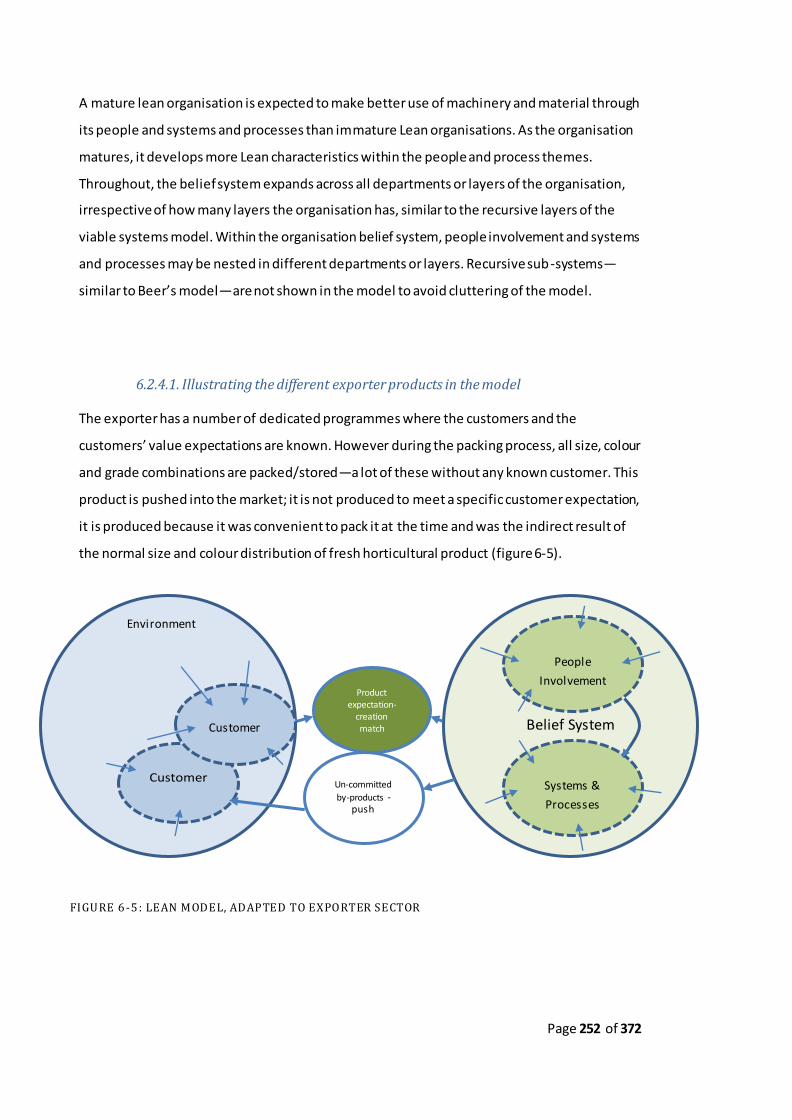
Page 252 of 372
A mature lean organisation is expected to make better use of machinery and material through
its people and systems and processes than immature Lean organisations. As the organisation
matures, it develops more Lean characteristics within the people and process themes.
Throughout, the belief system expands across all departments or layers of the organisation,
irrespective of how many layers the organisation has, similar to the recursive layers of the
viable systems model. Within the organisation belief system, people involvement and systems
and processes may be nested in different departments or layers. Recursive sub-systems—
similar to Beer’s model—are not shown in the model to avoid cluttering of the model.
6.2.4.1. Illustrating the different exporter products in the model
The exporter has a number of dedicated programmes where the customers and the
customers’ value expectations are known. However during the packing process, all size, colour
and grade combinations are packed/stored—a lot of these without any known customer. This
product is pushed into the market; it is not produced to meet a specific customer expectation,
it is produced because it was convenient to pack it at the time and was the indirect result of
the normal size and colour distribution of fresh horticultural product (figure 6-5).
Belief System
People
Involvement
Systems &
Processes
Product expectation-
creation match
Environment
Customer Un-committed
by-products -push
Customer
FIGURE 6 -5 : LEAN MODEL, ADAPTED TO EXPORTER SECTOR

Page 253 of 372
In the exporter sector-specific model, there is no significant increase of staff during the
season. The exporter however is faced with the production to customer demand, combined
with production to ‘push-to-customer’. This is caused by the packhouse packing all the apples
in the bin, including all sizes and all colours and defect grades; there i s no other option for the
packhouse unless a significant pre-sizing process is undertaken after which product can be
packed to demand. This process is not used in the NZ pipfruit industry except small scale
exceptions.
The exporter has a customer for the specific sizes, colours and defect grades that he/she has
pre-sold, but has no specific customer for the balance of the product. This product is pushed
into the market. Where the exporter can theoretically be Lean for the customers and products
known when growing and packing the product, the exporter can only be pushing the balance
of the product, finding customers that will accept the product as opportunistic value.
Although the model is poor in that it can only ever partly be Lean, it is also real in that it
reflects the current pipfruit export process.
6.2.4.2. Illustrating the effect of the seasonal staff increase on the model
The 10-fold increase of staff for the period of three to four months each year has an impact on
the basic model (figure 6-6). It is unreasonable to expect seasonal staff to adopt the Lean
belief system within the short period of employment and while being driven to focus on
productivity (productivity being output-volume focussed). Although seasonal staff will be
exposed to most of the visual Lean clues and some of the Lean influences on systems and
processes, seasonal staff are aware of their short-term involvement. Doevendans (2010)
identified a different focus between permanent and transient staff and the effect on the
organisation is different.
Seasonal staff is more short-term orientated and has a stronger focus on immediate financial
rewards. This is represented in a sector model, applicable to packhouses/coolstores—those
organisations that have a 10-fold staff increase for a short period of time, including the
grower section whose model is discussed next (Figure 6-6).
In figure 6-6, the seasonal people involvement and seasonal systems & processes have been
drawn separate to the -what is now termed- ‘stable’ people involvement and seasonal

Page 254 of 372
systems & processes. The term ‘stable’ signifies the permanency of the influence of the belief
system on the people involvement and seasonal systems & processes.
Within the organisation, few arrows show that there is some influence by the bel ief system on
the seasonal workers, both in their involvement and in the systems and processes, while more
arrows point at a greater influence of the belief system on the stable people involvement and
systems and processes. The two seasonal boxes (seasonal people involvement and seasonal
systems and processes) are drawn partly outside the influence sphere of the organisation’s
belief system as solid lines. The solid lines symbolise that there is no effect of the belief
system on part of the seasonal people involvement and seasonal systems & processes. They
overlap the stable people and process boxes as well as the belief system, as well as the non -
Lean outside world to show the influences to which they are exposed.
The second major theme is the production of product without known customer by growers
and packhouse/coolstores. This is shown in figure 6-6 as it impacts the grower and
packhouse/coolstore, however the explanation is found in paragraph 6.2.4.1 to avoid
repetition of the justification.
Customer
Un-committed by-products
push
Environment
Customer Belief System
Stable People
Involvement
Stable Systems & Processes
Product
Seasonal People
Involvement
Seasonal Systems &
Processes
FIGURE 6 -6 : LEAN MODEL, ADAPTE D TO PACKHOUSE/COOLSTORE SECTOR

Page 255 of 372
6.2.4.3. Illustrating the effect of new forms of waste on the model
Both the growers and packhouse/coolstores are significantly affected by the seasonal staff
increase, however only the grower results defined a new approach towards waste, identifying
the waste of free natural resources such as sun and rain. This new perception of waste
becomes an important part of the systems and processes theme for the orchard sector and is
highlighted within the systems and processes theme. The permeable border symbolises the
effect of the belief system on systems and processes, specifically the stable systems and
processes and particularly the new approach towards free resource waste such as sun and
water (figure 6-7).
6.2.5. Summarising the industry’s sector-specific models
The Lean model extracted from the literature research in chapter two is in essence a valid
model for all Lean organisations. The essence of Lean is not in the technology—all
organisations can purchase technology—and it is not in the materials. The essence of Lean lies
in what is done to the material inputs during the pre-production and production process by
the involvement of the people within the Lean organisation and the systems and processes
that they created and continue to improve to create customer value.
Customer Un-committed
by-products push
Environment
Customer Belief System
Stable People
Involvement
Stable Systems & Processes, incl. waste of natural
resources
Product
Seasonal People
Involvement
Seasonal Systems & Processes
FIGURE 6 -7 : LEAN MODEL, ADAPTE D TO THE GROWER SECTOR

Page 256 of 372
The generic Lean model from chapter two is taken and adapted into three specific industry
sector models; one being faced with the production of customer-value products combined
with non-customer products of which the value is unknown (exporters); one having a 10-fold
staff increase for a short period of time (packhouses/coolstores) and one having a 10-fold
staff increase for a short period of time and new forms of waste to consider (growers). In all
three sector models, the essence of the organisational model remains intact; it is the belief
system that creates Lean through people involvement and systems and processes (table 6-2).
TABLE 6 -2 : EFFECT OF THEMES O N INDUSTRY SECTOR MODELS
Exporters Packer/coolstores Growers
Product Affected Affected Affected
Staff increase Not affected Affected Affected
New forms of waste Not affected Not affected Affected
The models match the model requirements posed earlier in the methodology section, namely:
• The models are grounded in a set of transferable Lean principles, methods and tools.
• The fundamental model emerging from the literature review in chapter has served as
the basis for sector-specific models.
• New theory in the form of orchard natural resource waste have been added to the
grower sector-specific model.
• The model shows the effect of the ‘invisible’ Lean themes on the ‘visible’ ones and
displays Lean as a holistic and integrated paradigm.
However no claim can be made that the production of customer value and non-committed
product is similar for other horticultural industries, and this element of the industry models
must be individually assessed for those industries.
The models give rise to consider the suitability and implementation of Lean in the
horticultural industry sectors generally and in the pipfruit industry specifically.

Page 257 of 372
6.3. Building the framework
6.3.1. A living model and its place within a framework
The last of five principles identified by Womack et al (1990) is to continuously improve. The
same principle is referred to by Liker in the Toyota 4P model and it also returns in the Toyota
house of Lean (Liker, 2004). It is evident that continuous improvement is the last step in the
Toyota process; the process and tools can always be improved. This implies that no matter
how ‘good’ a company is, it can always get better. This potentially creates a problem for any
Lean model as follows. Models are reasonably static in how they mirror the real life situation.
Mitroff’s model, for example, creates more than 3000 options within the same model, but the
options are finite (Mitroff et al, 1974). Although the situations and solutions may change, the
model remains unchanged.
Earlier analysis proposed that Lean is both fluid in time and adaptive to its environment. The
continuous learning discussed by Liker (2004) parallels with action research models where
iterative cycles spiral until the inquiry is completed (e.g. Cardno, 2003) (figure 7-3). Lean
however is not a finite state. Lean is an endless process of improvement.
6.3.1.1. Forever learning and exploring
Axiomatically, a company can never be fully Lean because that would imply that no further
improvements could be made. Both from literature and from the inquiry it is clear that Lean
cannot be achieved in a short period of time, e.g. a few years. This implies that a Lean model
will have no finite end. In principle therefore, the Lean model is an infinite system with no end
once started. Another axiom is that initial steps lead to some improvement which will
facilitate improved production and further Lean steps to explore. In essence, a Lean model is
an infinite stair case (figure 6-8), forever ascending towards the ideal state but never quite
achieving that ideal state. Weick and Quinn (1999) confirm this with their belief that the
trajectory of change is often in the form of a spiral.

Page 258 of 372
FIGURE 6 -8 : FOREVER LEARNING AND IMPROVING, AN INFINI TE STAIRCASE
(Used by permission. All M.C. Escher works © 2014 The M.C. Escher Company - the Netherlands. All
rights reserved. www.mcescher.com)
It is therefore proposed that the model becomes part of a framework which considers both
what we have learned and how the model should be implemented. The model then, although
a static representation, becomes part of a holistic approach, where lessons learned mix with
requirements to lead to implementation and sustainability. The following paragraphs
elaborate on the second part of the framework, the ‘when and how’.
6.3.2. The implementation approach of the framework
Steps can be individual or combinations, as the organisation deems appropriate. The
sequence of steps is proposed to be very similar if not identical to Shewhart’s PDSA cycle, also
referred to as the Deming’s PDCA cycle (Deming, 1986), however corresponding to the inquiry
results, the first step needs to be education, transforming the sequence into EPDCA. Individual
steps must include education in Lean, training, discussing, trialling and anchoring. It is
important to maintain a step-wise approach to prevent overburdening and achieve positive
reinforcement through success (Catania, 1984) until the culture is established.

Page 259 of 372
Lean implementation continues while critical success factors are favourable. If critical success
factors are unfavourable, the literature review has shown that it is detrimental to continue
because the effort is likely to fail. In such a case, it is better to focus on consolidation and ‘live
to fight another day’.
It is appropriate at this point to discuss the effect of the overburdening season on Lean
implementation. One of the case study packhouses clearly indicated a deflated period
immediately following the end of the export packing season. Staff were tired and hesitant to
continuously improve for a period of approximately six weeks. At this point of the inquiry, it is
accepted that there may be some Lean implementation fatigue and that there may be merit
for a pre-determined period of lower drive to continue with continuous improvement. If Lean
were forced in such an environment, the negative reinforcement following failure to
implement would have a detrimental effect on the overall implementation strategy.
Once the culture is embedded, it is axiomatic that there is no urgent need to check that the
critical factors are still in place. This is the higher stage of lean implementation, effectively
Lean sustainability. An embedded Lean culture continues to learn and improve at all levels,
without the need for plateaus.
6.3.3. Framework adjustments for growing, packing/storing and exporting
Now that the fundamental model and the implementation phases have been established, the
only difference between industry sector activities lies within the applicability of different
principles, methods and tools. Not all principles, methods and tools will be equally applicable
or can be implemented similarly (refer figure 6-3). A single ‘detailed’ model for all sectors and
all sizes of organisation is not practically achievable. The following sections discuss several
specifics for the different industry sectors (refer also to appendix 15).
6.3.3.1. Orchard future state Lean activity planner
The orchard model differs from manufacturing because it involves manipulating nature in
order to produce. Growing natural products is philosophically new to Lean implementation.
The orchard model proposes to consider natural inputs as ‘standard’ inputs that can be used
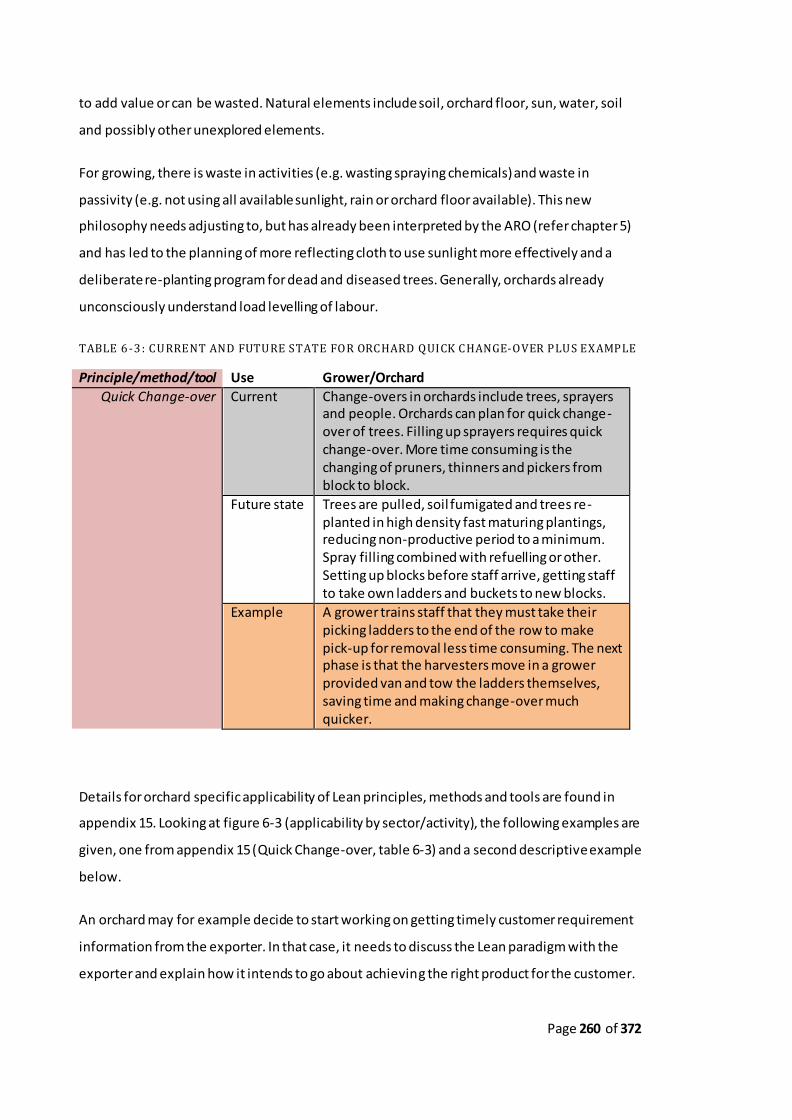
Page 260 of 372
to add value or can be wasted. Natural elements include soil, orchard floor, sun, water, soil
and possibly other unexplored elements.
For growing, there is waste in activities (e.g. wasting spraying chemicals) and waste in
passivity (e.g. not using all available sunlight, rain or orchard floor available). This new
philosophy needs adjusting to, but has already been interpreted by the ARO (refer chapter 5)
and has led to the planning of more reflecting cloth to use sunlight more effectively and a
deliberate re-planting program for dead and diseased trees. Generally, orchards already
unconsciously understand load levelling of labour.
TABLE 6 -3 : CURRENT AND FUTURE STATE FOR ORCHARD QUICK CHANGE-OVER PLUS EXAMPLE
Principle/method/tool Use Grower/Orchard
Quick Change-over
Current Change-overs in orchards include trees, sprayers and people. Orchards can plan for quick change-over of trees. Filling up sprayers requires quick change-over. More time consuming is the changing of pruners, thinners and pickers from block to block.
Future state Trees are pulled, soil fumigated and trees re-planted in high density fast maturing plantings, reducing non-productive period to a minimum. Spray filling combined with refuelling or other. Setting up blocks before staff arrive, getting staff to take own ladders and buckets to new blocks.
Example A grower trains staff that they must take their picking ladders to the end of the row to make pick-up for removal less time consuming. The next phase is that the harvesters move in a grower provided van and tow the ladders themselves, saving time and making change-over much quicker.
Details for orchard specific applicability of Lean principles, methods and tools are found in
appendix 15. Looking at figure 6-3 (applicability by sector/activity), the following examples are
given, one from appendix 15 (Quick Change-over, table 6-3) and a second descriptive example
below.
An orchard may for example decide to start working on getting timely customer requirement
information from the exporter. In that case, it needs to discuss the Lean paradigm with the
exporter and explain how it intends to go about achieving the right product for the customer.

Page 261 of 372
The exporter forms part of the value stream and the exporter’s assistance is a prerequisite for
the grower’s successful production of the right size, the right colour and the right
specifications for country access.
6.3.3.2. Packhouses and coolstores future state Lean activity planner
The packhouse and coolstore both provide a value-adding service. The literature review
clarified that the packhouse ‘dismantles’ a bin of apples and packs each size and colour variant
according to specifications obtained from the exporter. The coolstore receives bins with raw
product from the orchard and receives pallets with packed fruit (finished product) from the
packhouse and stores these at the appropriate temperature to maintain the quality before
packing and shipping the product. A packhouse is quite similar to a manufacturing
environment where product is called up just-in-time, packed to specification and stored in
inventory. A coolstore is similar to a distribution centre, although stock turnover differs and is
dependent on orders while the packhouse continues to pack regardless of whether the
customer is known. The packhouse continues to pack to level the load (e.g. figure 6-9).
FIGURE 6 -9 : RELATIVE LOAD-LEVELING IN THE PACKHOUSE COMPARED WITH HARVESTING

Page 262 of 372
Most Lean principles, methods and tools can be implemented in a packhouse. Most Lean
principles, methods and tools commonly used for distribution centres (e.g. Jones and Hines,
1997) can be implemented in a coolstore distribution centre. Details for packhouse and
coolstore specific applicability of Lean principles, methods and tools are found in appendix 15.
An example of a future state activity could be the following: A packhouse knows that it cannot
invest in computerised blemish grading to achieve consistency and uses human graders who
perform with variable outcomes. In order to achieve real time information to feed back to the
graders, the packhouse installs a traffic light system and introduces a process that checks the
quality of graded fruit immediately following grading, steering the traffic light and thus giving
immediate feedback to graders on their performance.
6.3.3.3. An early future state Lean activity planner for exporters
The limited lessons learned from the inquiry about exporters within the pipfruit NZ value
stream do not allow the Lean principles, methods and tools to be as specific as they have been
for the orchard and packhouse/coolstore environments. Nonetheless, the general model is
argued to apply to all pipfruit organisations that intend to implement Lean. Reichhart and
Holweg (2007) define lean distribution as minimising waste in the downstream supply chain,
and this forms part of the exporter activities. The reflective practitioner review discusses how
exporters are cost and supply focussed but in essence the exporter arranges all downstream
logistics from the coolstore door. It is essential that the area is explored further as will be
reiterated in the conclusion. Details for exporter specific applicability of Lean principles,
methods and tools are found in appendix 15.
An example of the use of the future state Lean activity planner for the exporter is to work in
close communication with the customer to determine the customer requirements in May of
each year, and then communicate those to the grower before the grower starts pruning.
Page 263 of 372
6.3.4. Summarising the framework
The proposed framework includes lessons learned, requirements, the model, implementation
and sustainability segments. The last two of these can be used by organisations that intend to
implement Lean.
The ‘what and why’ has been sufficiently explained. The ‘when and how’ includes
implementation and sustainability phases, methods and tools. The three phases are similar to
the NZTE phases as described in Wilson et al (2008). Phase one emphasises the importance of
the initial decision and commitment to implement Lean, while phase two focusses on the first
years of implementation, highlighting the step-wise implementation approach. The third
phase is the stage where Lean happens automatically as a result of a Lean culture that
sustains Lean.
Lean maturity appraisals assist organisations, reflecting where the organisations are in their
Lean development programme much like e.g. the Crosby quality management maturity grid
(Crosby, 1979). The Lean cluster provides an excellent platform for sharing knowledge and
experiences between similar organisations. Growers can see how other growers implement
Lean and learn from these experiences. This benchmarking opportunity—where the emphasis
is not on the numbers but on how the numbers are achieved (Camp, 1998) —forms an
additional mechanism within the framework to advance the model and implement it
successfully within the industry.
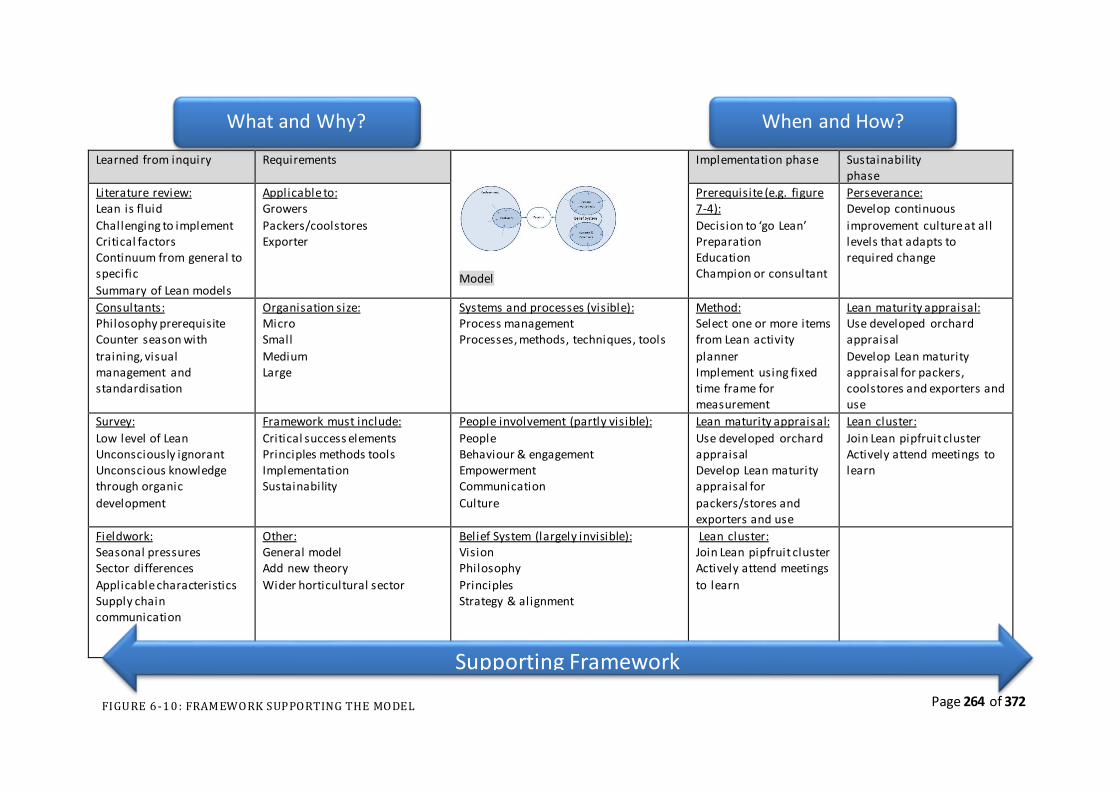
Page 264 of 372
Learned from inquiry Requirements
Model
Implementation phase Sustainability phase
Literature review: Lean is fluid
Challenging to implement Critical factors Continuum from general to specific
Summary of Lean models
Applicable to: Growers
Packers/coolstores Exporter
Prerequisite (e.g. figure 7-4):
Decision to ‘go Lean’ Preparation Education Champion or consultant
Perseverance: Develop continuous
improvement culture at all levels that adapts to required change
Consultants: Philosophy prerequisite Counter season with
training, visual management and standardisation
Organisation size: Micro Small
Medium Large
Systems and processes (visible): Process management Processes, methods, techniques, tools
Method: Select one or more items from Lean activity
planner Implement using fixed time frame for measurement
Lean maturity appraisal: Use developed orchard appraisal
Develop Lean maturity appraisal for packers, coolstores and exporters and use
Survey:
Low level of Lean Unconsciously ignorant Unconscious knowledge through organic
development
Framework must include:
Critical success elements Principles methods tools Implementation Sustainability
People involvement (partly visible):
People Behaviour & engagement Empowerment Communication
Culture
Lean maturity appraisal:
Use developed orchard appraisal Develop Lean maturity appraisal for
packers/stores and exporters and use
Lean cluster:
Join Lean pipfruit cluster Actively attend meetings to learn
Fieldwork: Seasonal pressures Sector differences
Applicable characteristics Supply chain communication
Other: General model Add new theory
Wider horticultural sector
Belief System (largely invisible): Vision Philosophy
Principles Strategy & alignment
Lean cluster: Join Lean pipfruit cluster Actively attend meetings
to learn
What and Why? When and How?
Supporting Framework
FIGURE 6 -1 0 : FRAMEWORK SUPPORTING THE MODEL

Page 265 of 372
6.3.5. Applicability to the wider horticultural sector
The model developed in this chapter is expected to be applicable to elements of the wider
horticultural industry. A conceptual diagram about the different degrees of applicability and
the need to adapt for industry sector activities is presented as figure 6-11.
FIGURE 6 -1 1 : SYMBOLIC CONTINUUM , DEPICTING LEAN APPLICABILITY VERSUS RE QUIRED
ADAPTATION. NOT BASE D ON EMPIRICAL DATA.
Pipfruit is a tree crop and the model can in principle be used for organisations operating
commercial tree crops, i.e. growers, packhouses, coolstores and exporters. Tree crops have an
annual and seasonal cycle and harvesting and packing is still largely completed with manual
labour. Crops such as grapes for wine are commonly harvested mechanically and while a
substantial proportion of the manual labour has been removed, there is still a significant
manual labour component. Kiwifruit is quite similar to pipfruit in terms of the growing, storing
and packing processes, while exporting is achieved through a single desk exporting company.
Manufacturing
Tree crop packhouses
Other horticultural packhouse/coolstore
s
Service organisations (Insurance, health)
Tree crop coolstores
Tree crop growing Hydroponics
Exporting
Ground crops
0
2
4
6
8
10
12
0 1 2 3 4 5 6 7 8 9 10
Leve
l of
appl
icab
ility
of
Lean
by
acti
vity
---
->
Level of adaptation required ----->
Conceptual applicability and adaptation required of Lean for various activities
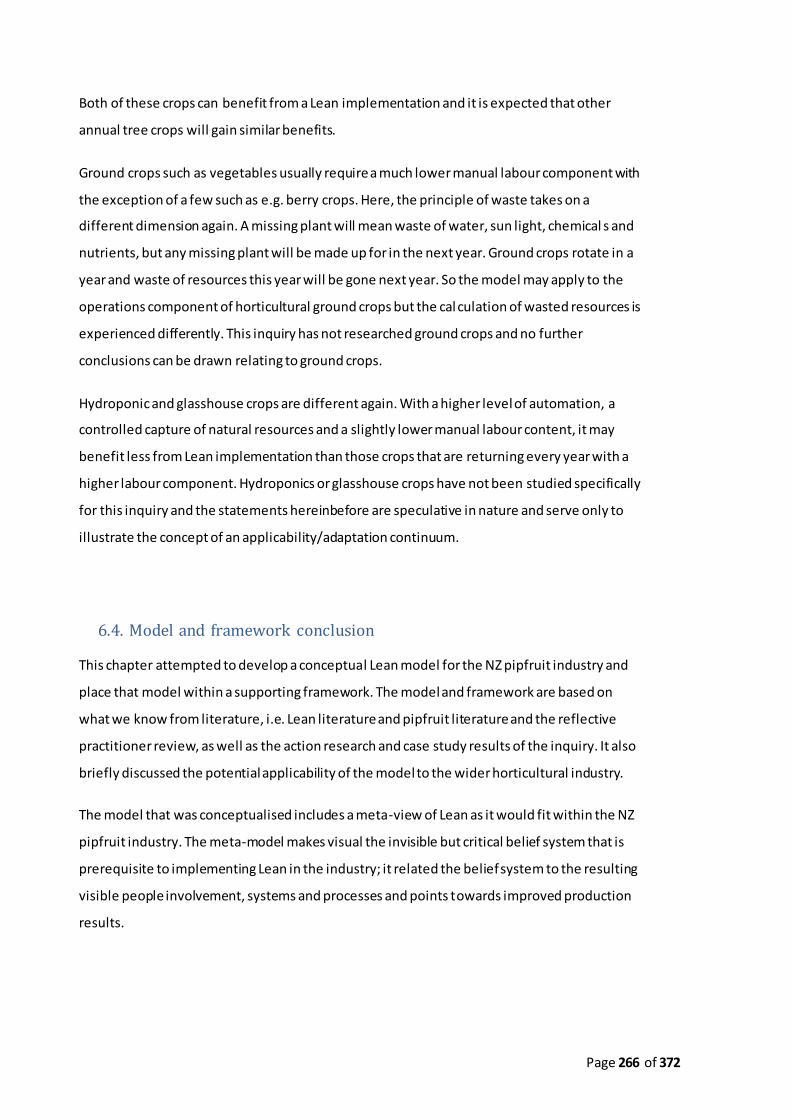
Page 266 of 372
Both of these crops can benefit from a Lean implementation and it is expected that other
annual tree crops will gain similar benefits.
Ground crops such as vegetables usually require a much lower manual labour component with
the exception of a few such as e.g. berry crops. Here, the principle of waste takes on a
different dimension again. A missing plant will mean waste of water, sun light, chemical s and
nutrients, but any missing plant will be made up for in the next year. Ground crops rotate in a
year and waste of resources this year will be gone next year. So the model may apply to the
operations component of horticultural ground crops but the calculation of wasted resources is
experienced differently. This inquiry has not researched ground crops and no further
conclusions can be drawn relating to ground crops.
Hydroponic and glasshouse crops are different again. With a higher level of automation, a
controlled capture of natural resources and a slightly lower manual labour content, it may
benefit less from Lean implementation than those crops that are returning every year with a
higher labour component. Hydroponics or glasshouse crops have not been studied specifically
for this inquiry and the statements hereinbefore are speculative in nature and serve only to
illustrate the concept of an applicability/adaptation continuum.
6.4. Model and framework conclusion
This chapter attempted to develop a conceptual Lean model for the NZ pipfruit industry and
place that model within a supporting framework. The model and framework are based on
what we know from literature, i.e. Lean literature and pipfruit literature and the reflective
practitioner review, as well as the action research and case study results of the inquiry. It also
briefly discussed the potential applicability of the model to the wider horticultural industry.
The model that was conceptualised includes a meta-view of Lean as it would fit within the NZ
pipfruit industry. The meta-model makes visual the invisible but critical belief system that is
prerequisite to implementing Lean in the industry; it related the belief system to the resulting
visible people involvement, systems and processes and points towards improved production
results.

Page 267 of 372
A framework is provided in addition to the model that relates to the implementation and
sustainability of Lean into the industry. Three broad phases systematise the implementation
process:
• Phase one is the lead-in, a one-way set of small steps to ensure that the organisation is
committed, educated and prepared for the changes ahead.
• Phase two is represented by an endless staircase that symbolises that there is always
opportunity to improve, using a repetitive EPDCA-like cycle. The addition of a Lean
maturity appraisal and participation in the industry Lean cluster assist with the
successful implementation of Lean, regardless of size or industry activity.
• Phase three starts somewhere on that endless staircase when the organisational
culture has changed to the point where continuous improvement is achieved without
specific consideration. This phase is also where sustainability starts.
The combination of the understanding of what Lean would look like in a pipfruit env ironment,
combined with the concept of endless trying and learning is expected to lead to continuously
improving production management and production.
The model has been projected onto several other horticultural industries, resulting in a
realisation that the lean model applies to all industries and that applicability of Lean methods
and tools to other horticultural industries varies; different levels of adaptation of Lean
elements and the organisations involved are required as was the case within the pipf ruit
industry.
“In theory, theory and practice are the same. In practice, they are not”
(Albert Einstein)

Page 268 of 372
7. Conclusion
7.1. Introduction
This section reconciles the aim and objectives stated in the first chapter with the findings and
the analysis of the findings. It summarises how and to what degree the aim and objectives
have been achieved and what else was learned during the course of the inquiry.
The aim of this inquiry is to research the concept of Lean and its theoretical ‘fit’ and practical
applicability in a horticultural setting, specifically the New Zealand (NZ) pipfruit industry. The
four objectives detailing the aim of the inquiry and tabulated in chapter one are repeated
here and discussed in separate sections of this chapter:
1. Identify common theoretical themes for the Lean philosophy, methods and tools, that
are not industry or contextually bound and that may be transferable to the pipfruit industry.
2. Identify and analyse the current Lean deployment within the NZ pipfruit industry.
3. Analyse the applicability and any implementation approaches of the Lean philosophy,
methods and tools within the NZ pipfruit industry.
4. Develop a conceptual Lean model for the NZ pipfruit industry and consider if the
model is applicable to the wider horticultural sector.
The chapter intends to summarise the originality of the inquiry and the contribution of this
thesis to the body of existing knowledge. It further intends to provide signposts for the
direction of future research: ‘What comes next?’
7.2. Conclusion
In broad lines, the inquiry edified that Lean substantially fits the different elements of the NZ
pipfruit industry. The theoretical ‘fit’ is partly different and partly the same for the orchard
and packhouse/coolstore sectors of the industry. Not much was learned about the exporter
sector of the industry. Similarly, Lean proved to be substantially practically applicable, also

Page 269 of 372
partly similar and partly different for the orchard and packhouse/coolstore sectors of the
industry. Here too, not much was learned about the exporter sector of the industry.
7.2.1. Common themes transferable to the NZ pipfruit industry
A number of common Lean themes for the Lean philosophy, methods and tools have been
identified that are not industry or contextually bound and that are readily transferable to the
NZ pipfruit industry and the wider horticultural industry (the first objective).
The commonly accepted proposition that Lean was created by Toyota is partly disproven by
demonstrating that earlier pioneers were using substantially similar ‘best practice’
approaches. These best practices form a substantial component of the Lean theory. Womack
(2013) pointed out that “The Triumph of the Lean Production System” (Krafcik, 1988b) created
a watershed event in the history of the lean movement and that it helped open a floodgate of
new ideas for the world’s managers. The same could be argued about ‘the Machine that
changed the world’ (Womack et al, 1990). These may have been a turning point in the history
of Lean; timing of the identified theory combined with Toyota’s—and more broadly Japan’s—
success started a tidal wave and created a fixation on this specific system without realising
that a number of common elements of the philosophy, methods and tools were already in
existence long before the Lean tidal wave. It should therefore not be surprising that there are
a number of common themes that are not industry or contextually bound and are transferable
to the pipfruit industry.
7.2.2. Current Lean deployment within the NZ pipfruit industry
The level of current Lean deployment within the NZ pipfruit industry is low. Consultants
estimate that an average of 1.3% of the horticultural industry is dedicated to become Lean
(section 4.4.2.4) and has made substantial progress in doing so. This number is considered of
relatively low validity because less than half of the interviewed consultants had any
experience with a horticultural industry, the remaining part having no experience with this
type of industry. Despite this, consultants were unanimous in their belief that the industry
would benefit from Lean implementation.

Page 270 of 372
Of more relevance is the result of the industry stakeholder survey. The industry stakeholder
survey demonstrated that Lean is marginally consciously known or implemented, but that
there is some unconscious implementation of Lean within the NZ pipfruit industry. This result
is supported by the researcher who has broad experience within the industry and summarises
this in a reflective practitioner review. The industry has learned to get cleverer over the years
but this cleverness was born from practical survival, not from implementing theoretical
models that are known to work.
7.2.3. Applicability and implementation of Lean within the NZ pipfruit
industry
Lean is largely applicable and implementable to the different industry sector activities of
growing, packing and storing product. The orchards practiced Lean and found that specific
Lean principles and methods or tools had low applicability in the orchard environment while
the balance of what was tried worked effectively. An example is ‘Pull’ which could hardly be
applicable in the orchard production environment. A restricted number of principles, methods
and tools were implemented during the inquiry and the conclusion only relates to what was
tested in the orchard environment. Implementation using a champion or consultant approach
to stabilise implementation appears to be successful. The orchards delivered some original
interpretations of waste in the orchard which deserves further research. These specific
findings may not be readily transferable to other industries except other horticultural
industries. The literature review demonstrated that orchards are the least researched in terms
of Lean and therefore demand more attention in the future.
The packhouse/coolstore environment was most comparable with a manufacturing and
distribution environment and a number of Lean principles, methods and tools from existing
Lean literature were readily applicable in this environment. The champion or consultant
implementation approach worked successfully over the period of the inquiry.
Although the expectation is that exporting could benefit from Lean implementation, no firm
conclusion can be reached due to lack of data. One fact that emerged clearly was the focus on
customers, however the exporter appeared to have two customers on opposite sides—both
upstream and downstream—and this may well confuse the exporter’s position in the value
chain. It was the lack of data that was available that perhaps complemented our
understanding of the third objective in relation to exporters.

Page 271 of 372
The inquiry showed substantial applicability of the Lean philosophy, methods and tools within
the NZ pipfruit industry. It further analysed several implementation approaches which appear
to have the beginnings of success. It remains obvious that implementation requires
commitment for a period of years and the period of the inquiry was not long enough to
deploy Lean fully and build a sustained Lean culture, which is one of the limitations of the
inquiry.
7.2.4. A conceptual Lean model for the NZ pipfruit industry
A Lean model for the industry has been presented and clarifies the relevance of people and
processes as making the difference in a socio-technical approach to production.
The concept of implementing Lean and continuous improvement is then captured in a
framework by an endless ‘EPDCA’ spiral, where the letter ‘E’ stands for education. The inquiry
showed that there was very limited education and both the action research and case study
companies showed that people had to be educated before they could ‘Plan, Do, Check and
Act’.
The specific methods and tools differed somewhat per industry sector/activity (growing,
packing/storing, exporting), because sector-specific themes led to different effects on the
fundamental model. Specifically in the orchard environment, new forms of waste were
identified in relation to the elements of nature that created a new form of thinking,
concerning waste of natural resources. Additional themes affecting the fundamental model
were the 10-fold increase of staff during the season and the production of non-committed
product simultaneously with the production of value created product.
The fundamental model is applicable to all industry sectors however sector-specific models
clarified the specific themes that made each sector different.
7.2.5. Considerations for implementing the model to the wider horticultural
industry
The brief engagements with two other horticultural industries during the inquiry indicated
firstly that Lean had already been instigated by the two interviewed organisations, and

Page 272 of 372
secondly that the Lean Pipfruit model could easily be applied to these other annual tree -crop
industries. In both cases, the decision to implement Lean had been made years ago and the
pipfruit industry may well learn from these organisations. But for any ‘newcomer’ in these
industries, the lean pipfruit model can easily and quickly be transformed into a Lean
horticultural model.
7.3. Limitations
One of the limitations to the full inquiry is that exporters found it difficult to commit to full
participation; this affects how valid results are in relation to exporters and supply chain/value
stream. Just as Lean involves workers at all levels, the inquiry attempted to include all parts of
the value stream. Industry-related factors presenting methodological limitations include:
Only one orchard-company in the research group which affects validity.
Only three packhouse/coolstore combinations which affects the validity.
Only two exporters in the research group who provided limited data, which affects
validity; no real conclusions can be drawn although it is clear that exporters have a
strong focus on the customer.
Limited supply chain / value stream data as a consequence of, amongst others, the
lack of timely and full exporter participation.
The inquiry is restricted to the NZ pipfruit industry with possible extensions to the
wider horticultural industry.
Other factors presenting limitations include:
Researcher involvement: The researcher was an industry insider and was part of the
methodology, specifically the action research component. As such, the researcher
both influenced the results and is subject to researcher bias.
Quantitative data from the surveys were not able to be triangulated with other
quantitative data as none were available.
The period of the inquiry was not long enough to deploy Lean fully and build a sustained Lean
culture. The inquiry is therefore regarded as providing valid data concerning early applicability
and implementation but is restricted to that period of which theory indicates it is not possible
to achieve a true Lean culture.

Page 273 of 372
7.4. Originality and contribution
The aspiration and aim of any PhD student must be to deliver something truly new and
original and it was no different for this PhD student. Experience appears to dictate that PhD
students go through a turmoil of emotions during the course of their work (Murray, 2011),
one moment on an emotional high when something truly original appears to emerge, the next
moment emotionally deflated because further research demonstrated that another inquiry
had already found the same result, and perhaps even built a better inquiry.
The contribution by this inquiry is its focus on Lean in the NZ pipfruit industry, which is part of
the broader horticultural environment. This environment has been largely dominated by
technological innovations; larger tractors, smarter planters, reversible ploughs, combine
harvesters, better spray equipment and more. All of these innovations have substantially
reduced the manual labour component of horticulture but not so in some segments of the
pipfruit industry. Growing and packing fruit is still a largely manual component of the industry.
This research is necessary to make a start with the implementation of dif ferent production
management systems that will improve the industry as a whole, particularly because of that
large manual labour component. The inquiry showed that implementing Lean can start to lead
to a more effective operation. Sustainability is the next item on the research agenda.
During the course of the inquiry, a different method of surveying through questionnaires was
developed which delivered a relatively high response rate to the survey. The approach
emailed a single question to the sample, every day, with a five point Likert scale response
request. Questions or statements took less than a minute to respond to and the approach led
to an excellent response rate at 24.56% for this type of survey. This approach is argued to be
original and contribute to the wider issue of improving response rates to long or difficult
questionnaires.
The inquiry further found interpretations of waste that had not been encountered in
literature before. These indicate original thinking in terms of wasting natural resources that
are required for production in a horticultural environment such as sunlight, rainwater, and
soil. If the orchard is considered to be a factory, this is analogue to wasting power, additives
and other inputs. Another interpretation involves ‘real estate’, the orchard floor. Within the
industry there appeared to be no urgency to replace dead and diseased trees. The inquiry
revealed that this leads to multiple forms of waste during successive seasons. These
interpretations of Lean have not been encountered anywhere during the literature review.

Page 274 of 372
An element that was always there but not truly interpreted was the poor link between
grower, packer and exporter. It was not clear to the exporter that the grower needs customer
requirements at the time of pruning. At least one company now adopts the approach that
they prune trees to grow fruit to customer requirements. This approach should be elementary
to the industry but appears not to be.
A deliverable result is the Lean maturity assessment combined with the Lean activity planner.
The Lean maturity assessment has the potential to develop into a useful instrument which can
be used by horticultural organisations, particularly annual tree crop organisations. Similarly,
the Lean activity planner offers organisations a view of potential improvements.
Lastly, the inquiry presents a model, supported by a framework that represents both Lean in
the horticultural environment and an implementation expectation. The model clarifies that
Lean has an invisible ‘belief system’ that affects the involvement of people who create
systems and processes that continuously improve production; it further expounds that there
is no finite Lean state; that Lean continues infinitely and is a state-of-mind, a culture, more
than a state of the organisation.
The result of this inquiry is a contribution of some original knowledge to the body of
knowledge that exists in relation to ‘Lean’ and to the wider horticultural industry in New
Zealand, but specifically the NZ pipfruit industry.
7.5. Recommendations for the industry
If the industry intends to become Lean as a whole, there must be a vision and guidance from
the governing body. There is support from the governing body for this inquiry and there is an
initiative supported by this inquiry in the establishment of the Lean pipfruit cluster. This
cluster has successfully organised open meetings for members, where information is shared
without restriction in an attempt to spread the Lean message. However, the governing body is
not a business owner and can therefore not make business decisions that others must follow.
It can only point in a direction and express the view that that may be a right direction.
Implementing Lean is not easy; it requires dedication and the best possible implementation
method with the highest chance of success. It requires education before any attempt can be
made to implement Lean. It requires continued guidance until the point has been reached

Page 275 of 372
where Lean is so embedded into the culture of an organisation that the organisation starts to
educate the guide.
Having observed the industry as it is, there is only one recommendation and that is to
seriously consider Lean—under any name—as a production management system that will
help transform the industry.
7.6. Contribution to practice: The Lean apple tree
The results of this inquiry are of little value unless they can be communicated effectively to
the industry. A model for industry stakeholders is proposed to use the metaphor of an apple
tree, rather than the model presented in chapters two and six. An apple tree is fundamental
to the industry stakeholders and understood by most industry stakeholders; they understand
that it has roots; that it grows; that it produces food and that it needs nurture to do so. The
metaphor of a living tree also easily translates to other horticultural industries such as
kiwifruit, grapes or avocados. For convenience of the visual metaphor, the leaves of the tree
have not been emphasised in the model, however leaves fulfil a distinct function for the tree
and thereby symbolise a distinct interacting function in the Lean tree model metaphor (figure
7-1). Please note that the term ‘Lean apple tree model’ refers to the pictorial image that
follows as a metaphor for the ‘Lean pipfruit model’ which is proposed in section 6.4 for the
wider industry.
The metaphor of the apple tree model is useful to facilitate the transfer of knowledge to the
industry. Tools and processes with the emphasis on Lean appear to be highly visible and
appear to be strongly correlated with production results. The tree’s root structure is essential
for the tree to grow and produce; the tree cannot grow and produce without roots and vice
versa. Nutrition flows from the roots through the trunk through the branches to leaves and to
feed fruit, a metaphor for the energy provided by the belief system to the people involved.
The idea is contextualised in the following section, linking lessons learned to the model.
The principal model proposed in this section is emphasising that vision, philosophy, principles
and strategy—all encompassed by the word ‘belief system’—is invisible although essential
along the lines of the models of Hines et al (2011a) and Liker (2004). These enablers are
generally not obvious; they may give direction and facilitate growth but are not the sensory

Page 276 of 372
providers of production results. The root system of the tree represents the belief system that
is a prerequisite for successful implementation of Lean. Roots form the basis of the livi ng tree.
The implementation of Lean without the fundamental requirements is futile and as literature
has shown, likely to fail. The literature review recognises philosophy, people and process as
the main Lean themes and refers to critical factors (table 7-1) which include:
The supporting trunk is the visual exponent of the belief system and supports the branches
(Lean characteristics), shoots and leaves and represents the communication from the
prerequisite factors to the applications of principles, methods and tools and vice versa.
Employees know where the organisation intends to head and what their role is in this process.
It is not only essential for employees to know that they have the leadership that backs them
up as they endeavour to implement Lean; it is also essential that the leade rship knows that
the endeavours are successful.
Low hanging fruit (applications of Lean); some ready for harvest, some not
Lean Pipfruit Model
Supporting Lean; people, processes
The roots of Lean, belief system, enabling, pre-requisite, but
invisible
Maturing fruit;
ready for harvest
FIGURE 7 -1 : LEAN APPLE TREE MO DEL
Page 277 of 372
TABLE 7 -1 : SUMMARY OF CRI TI CAL FACTORS FOR SUCCES SFUL LEAN I MPLEMENTATI ON
Critical factors 1. Understanding Lean, education and training
2. Commitment to long term engagement
3. Senior management leadership
4. Open communication of strategy
5. Employee preparation for change
6. Staff involvement/empowerment
7. Visual monitoring of progress
8. Willingness of employees to learn
9. Resources availability
10. Proper deployment method
The fruit represents the applications of the Lean principles methods and tools. A method or
tool can be implemented in one area of the organisation and not (yet) in another. These
specific applications are the fruits, some of which are ready for harvest—i.e. can be
implemented successfully—and others are not. The essence of this argument is that the
organisation must implement Lean elements that it is ready for.
Young tree, starting structure, some fruit
Maturing tree, developing structure, reasonable production
Mature tree, mature structure, full production
of fruit on strong branches
FIGURE 7 -2 : THE LEAN ORGANISATIO N TREE, MATURING OVER A PERIOD OF YEARS.
Page 278 of 372
The fruit that is not ready for harvest may be obvious and appear easy to harvest (to
implement) at face value, but careful consideration must be given to when, where and how
new Lean elements are introduced. Every chance must be given to succeed. The alternative—
failure to successfully implement the tool in a specific situation— creates negative
reinforcement (Catania, 1984) which may negatively affect each next endeavour.
As an example, a company may attempt to introduce a fundamental Lean method that
requires substantial resources and re-organisation in the middle of the season when people
and the system are already overburdened. This is likely to fail. It is not ready to be
implemented.
Taking the metaphorical model one step further, the growth of a tree takes years and over the
years, the tree produces more fruit as it develops stronger roots, a robust trunk and branches
with better structure as a result of annual tree maintenance, equivalent to working on Lean
and improvements. As Lean matures within a company, the roots will become more
embedded and the tree structure will grow and end up producing more fruit or in Lean terms
produce more effectively (figure 7-2). This metaphor is representative in terms of time
involved to develop a mature Lean state as a tree matures over a period of seven to eight
years just short of Monden’s estimate for an organisation to become Lean (Monden, 1998).
This metaphorical model logic applies to all organisations within the pipfruit industry—and
indeed the wider horticultural industries—regardless if they are growing, packing, coolstoring
or exporting.
7.6.1. Growing Lean from a seed or graft
Symbolically, Lean implementation should grow from a seed, perhaps more accurately from a
graft. Grafting is a horticultural technique whereby tissues from one plant are inserted into
those of another so that they join together. In most cases, one plant is selected for its root
system and the other plant is selected for its stems, leaves, flowers, or fruits. The graft
contains the desired genes to be duplicated in future production by the plant. Grafting Lean
means taking something ‘we want’ (Lean) and grafting it onto an existing system that does not
produce what it is intended to produce.

Page 279 of 372
The analogy is evident. The decision to plant a seed or to graft an existing tree is the start of
lean implementation. Usually, organisations already have an operational structure at the time
that Lean implementation begins. In grafting, the existing structure is used to grow a new
production system that has to mature over the years to follow.
7.6.2. Originality of the model
The Lean apple tree model was designed mid-2014, specifically to serve as a metaphor that
industry stakeholders would understand and could associate with. The model is believed to
have real communicative value in that stakeholders can contextualise the model, especially
one that is characteristic and appropriate for the industry. Late September 2014, it emerged
that a similar model had been used as a metaphor by an industrial company earlier that
month. The originality of the Lean apple tree model is discussed further in appendix 17.
7.6.3. The implementation approach of the framework
Step Activity 1. Learn about Lean
2. Commit to implementation 3. Prepare for change: Discuss the plan
4. Educate and train 5. Plan and implement one or a few Lean
elements (that are ready for harvest)
6. Plan implementation time (e.g. week)
7. Reflect and analyse progress: Correct where necessary
8. Confirm Critical Factors are OK to continue
9. Educate, plan and implement the next Lean elements (that are ready for harvest)
10. Plan implementation time (e.g. week) 11. Reflect and analyse progress: Correct
where necessary
12. Point of established culture
FIGURE 7 -3 : ENTRY ONTO AN INFINTE STAIRCASE IMPLEMENTATION MODEL.
Lean

Page 280 of 372
The Lean pipfruit model forms part of a framework which includes an infinite implementation
staircase—similar for each industry activity (orchards, packhouses, coolstores and
exporters)—where each step represents implementation of one or more Lean principles,
methods or tools that may vary by industry activity. Each step symbolises a distinct effort; the
step needs to be climbed (figure 7-3).
The initial few steps relate to learning about Lean and the decision to become Lean. After the
organisation has decided to introduce Lean as a paradigm, several steps are necessary to
prepare the organisation for the implementation of Lean. Failure to prepare properly is likely
to lead to maladjustment to the change, leaving employees in an uncertain state and likely to
reject the change. This is similar to the first stage in NZTE’s approach (Wilson et al, 2008) or
Murti’s first step in a 5-P model (Murti, 2009).
Once the decision to implement Lean has been made, the organisation is committed and
prepared, the second phase includes the implementation of Lean principles, methods and
tools.
FIGURE 7 -4 : THREE STAGES OF LE AN
IMPLEMENTATION.
Early stages of Lean
implementation:
Lean is ‘pushed’
Fundamental:
Decision to
adopt Lean
Embedded Lean
culture: Lean
‘happens’
Page 281 of 372
In practical terms, it is suggested that a flight of steps take one or several weeks to
implement. Each flight of steps may focus on implementing only a single Lean principle,
method or tool (e.g. from appendix 15) or may introduce a combination.
Consequently, the eternal staircase spirals upward, while the organisation continues to
become more effective through Lean. The upward spiral reflects three stages (figure 7-4):
The initiative to adopt Lean as an approach to production;
The early and difficult stages of Lean implementation;
The mature Lean state where the culture is embedded in the organisation and Lean
just happens.
7.7. Future research
The inquiry has not provided all the answers; it really conjures the question ‘now what?’ It has
perhaps succeeded in establishing that the industry is not currently Lean; that common
theoretical themes are transferable to the industry and that Lean is both applicable and can
be implemented within the industry. It may have built a model and framework that
demonstrate a way to implement Lean. However the inquiry produced a number of questions
which were not researched to sufficient depth. These include:
1. Exploring further the concept of waste of natural elements in the horticultural
‘factory’.
2. Explore the concept and analogy of trees as machines further.
3. Refining the Lean maturity appraisal tool for growing (and build it for packing/storing
and exporting), test the instrument further and produce a sustainable assessment
concept for orchards.
4. Test the implementation model for the industry elements and develop further.
5. Research the exporter element of the industry specifically.
6. Assessing sustainability of Lean in the pipfruit industry. We know where we can get in
the period of two seasons. But can Lean be sustained in this environment?
7. Explore how generalizable findings are to the wider horticultural industries such as
kiwifruit, avocados, wine and others, and to agribusiness in general as a further
widening of the field of applicability.

Page 282 of 372
Not directly related to the objectives of this inquiry:
1. Research the effectiveness of the ‘question per day survey’ option for long or
complicated surveys, compared with whole questionnaires.
The answers to questions 1 to 5 and 7 will help pave the way for a more successful
implementation of Lean into the NZ pipfruit industry and other horticultural crops. The inquiry
into question 6 is essential for the longevity of this inquiry. Question 8 may lead to a more
effective way of obtaining reliable data for long or complicated surveys. Researching the
effectiveness of the ‘question per day survey option’ compared with other survey methods
has relevance for research methodologies world-wide.
7.8. A final word
After completion of the field work and just before submitting the thesis, the researcher
learned that three of the sample companies had been purchased by or merged with other
companies. Two of the managers involved in the inquiry had left their organisations for
different reasons. It will be interesting to see how the initial implementation of Lean under
the original structures and management will sustain the transfer of companies and the
departure of champions after less than two years of Lean implementation.

Page 283 of 372
8. References:
Abdulmalek, F. A., & Rajgopal, J. (2007). Analyzing the benefits of lean manufacturing and
value stream mapping via simulation: a process sector case study. International Journal of
production economics, 107(1), 223-236.
Achanga, P., Shehab, E., Roy, R., & Nelder, G. (2006). Critical success factors for lean
implementation within SMEs. Journal of Manufacturing Technology Management, 17(4),
460-471.
Altheide, D. L., & Johnson, J. M. (1994). Criteria for assessing interpretive validity in
qualitative research. Thousand Oaks, CA, US: Sage Publications.
Andersson, R., Eriksson, H. and Torstensson, H. (2006). Similarities and differences
between TQM, six sigma and lean. The TQM Magazine, 18(3), pp. 282-296.
Apple Fields Ltd. (1991). A time to change direction. Christchurch: Apple Fields Limited.
Arbos, L.C. (2002). Design of a rapid response and high efficiency service by Lean
production principles: Methodology and evaluation of variability of performance
International Journal of Production Economics 80 (2002) 169–183.
Argyris, C., & Schön, D. (1996). Organizational Learning II: Theory, method and practice.
Reading, PA: Addison Wesley.
Argyris, C. (1996). Actionable knowledge: Design causal ity in the service of consequential
theory. The Journal of Applied Behavioral Science, 32(4), 390-406.
Arnold, H. L. and Faurote, F. L. (1915). Ford methods and the Ford shops. New York: The
engineering magazine company.
Aronsson, H., Abrahamsson, M., & Spens, K. (2011). Developing lean and agile health care
supply chains. Supply Chain Management: An International Journal, 16(3), 176-183.
Ballard, R, (2010). A university perspective on future food production. New Zealand
Science Review, 67(3) pp 100-102, 2010.
Barnao, C. (2013). The primary sector. Presented at the 2013 annual Pipfruit NZ
conference, Hastings, New Zealand
Page 284 of 372
Barraza, M. F. S., Smith, T., & Dahlgaard-Park, S. M. (2009). Lean- kaizen public service: an
empirical approach in Spanish local governments. The TQM Journal, 21(2), 143-167.
Beer, S. (1979). The heart of enterprise (Vol. 2). John Wiley & Sons.
Ben Naylor, J., Naim, M. M., & Berry, D. (1999). Leagility: integrating the lean and agile
manufacturing paradigms in the total supply chain. International Journal of Production
Economics, 62(1), 107-118.
Benders, J. and van Bijsterveld, M. (2000). Leaning on lean: the reception of a
management fashion in Germany. New Technology, Work and Employment 15:1.
Benzies, B. (1968). Partners in Production. Wellington: Ferguson and Osborn Ltd.
Bhasin, S. (2008). Lean and performance measurement. Journal of Manufacturing
Technology Management, 19(5), 670-684.
Bhasin, S. (2012). An appropriate change strategy for lean success. Management Decision,
50(3), 439-458.
Bhasin, S., & Burcher, P. (2006). Lean viewed as a philosophy. Journal of Manufacturing
Technology Management, 17(1), 56-72.
Bicheno, J. (2004). The new lean toolbox: towards fast, flexible flow. Buckingham: Picsie
Books.
Bjørn, P., & Boulus, N. B. (2011). Dissenting in reflective conversations: Critical
components of doing action research. Action Research, 9(3) 282-302.
Borbas, M. (2011). The Fresh Express Lean Changeover Project. Industrial Technology
Orfalea: College of Business.
Bounds, G., Yorks, L., Adams, M., Ranney, G. (1994). Beyond Total Quality Management.
New York: McGraw-Hill, Inc.
Bourne, M., Mills, J., Wilcox, M., Neely, A., & Platts, K. (2000). Designing, implementing
and updating performance measurement systems. International Journal of Operations &
Production Management, 20(7), 754-771.
BRC (2012). BRC Global Standard for Food Safety, Issue 6.

Page 285 of 372
Brown, S. L. and Eisenhardt, K. M. (1997). The Art of Continuous Change: Linking
Complexity Theory and Time-Paced Evolution in Relentlessly Shifting Organizations.
Administrative Science Quarterly, 42(1), pp. 1-34.
Buesa, R. J. (2009). Adapting lean to histology laboratories. Annals of Diagnostic
Pathology, 13(5), 322-333.
Business Dictionary: http://www.businessdictionary.com/definition/consignment-
sale.html#ixzz2b2geiL9f (Retrieved 5-8-2013).
Business NZ (2006). Productivity Perspectives, Business NZ.
Byrne, A. (1995). How Wiremold reinvented itself with kaizen. Target, 11(1).
Byrne, A., & Womack, J. P. (2012). The Lean Turnaround: How Business Leaders Use Lean
Principles to Create Value and Transform Their Company . McGraw Hill Professional.
Camp, R. C. (1989). Benchmarking: the search for industry best practices that lead to
superior performance. Milwaukee, Wis.: Quality Press; Quality Resources, 1989.
Camp, R. C. (1998). Global Cases in Benchmarking. Best practices from organisations
around the world. Milwaukee: ASOQ Quality Press.
Cardno, C. (2003). Action Research. A developmental approach. Wellington: Printlink.
Carson, K. D., Carson, P. P., Lanier, P. A., & Judice, R. D. (2002). Management Fad
Adoption: An Exploration of Three Psychogenic Influences. The Journal of Behavioral and
Applied Management, 3, 174-189.
Carson, P. P., Lanier, P. A., Carson, K. D., & Birkenmeier, B. J. (1999). A historical
perspective on fad adoption and abandonment. Journal of Management History (Archive),
5(6), 320-333.
Catania, A. C. (1984). Learning. New Jersey: Prentice-Hall, Inc.
Christopher, M. (2000). The agile supply chain: competing in volatile markets. Industrial
marketing management, 29(1), 37-44.
Christopher, M., & Towill, D. (2001). An integrated model for the design of agile supply
chains. International Journal of Physical Distribution & Logistics Management, 31(4), 235-
246.

Page 286 of 372
Code of ethical conduct for research, teaching and evaluations involving human
participants (2010). Palmerston North: Massey University.
Conrad, E. & Maul, T. (1981). Introduction to experimental psychology. New York: J Wiley.
Coughlan, P., & Coghlan, D. (2002). Action research for operations management.
International journal of operations & production management, 22(2), 220-240.
Creswell, J.W. (2003). Research Design: Qualitative, Quantitative and Mixed methods
Approaches. London: Sage Publications.
Creswell, J. W., & Miller, D. L. (2000). Determining validity in qualitative inquiry. Theory
into practice, 39(3), 124-130.
Crosby, P.B. (1979). Quality is Free: the art of making quality certain. New York: Mentor.
Cusumano, M. A. (1994). The Limits of" Lean". Sloan Management Review, 35, 27-27.
Deming, W. E. (1975). On probability as a basis for action. The American Statistician, 29(4),
146-152.
Deming, W. E. (1986). Out of the Crisis. Cambridge, Mass.: Massachusetts Institute of
Technology.
Dennis, P. (2002). Lean Production Simplified: A plain language guide to the world's most
powerful production system. Productivity Press.
Dewell, R. (2007). The dawn of Lean marketing. Journal of digital asset management, 3(1),
23-28.
DiCicco‐Bloom, B., & Crabtree, B. F. (2006). The qualitative research interview. Medical
education, 40(4), 314-321.
Dick, B. (2002). Action research: action and research. Paper 41. Retrieved on 13 April
2012.
Dick, B. (2011). Action research literature 2008—2010: Themes and trends. Action
Research, 9(2), 122-143.
Dickson, E. W., Singh, S., Cheung, D. S., Wyatt, C. C., & Nugent, A. S. (2009). Application of
lean manufacturing techniques in the emergency department. The Journal of emergency
medicine, 37(2), 177-182.

Page 287 of 372
Dixon-Woods, M., Agarwal, S., Jones, D., Young, B., & Sutton, A. (2005). Synthesizing
qualitative and quantitative evidence: a review of possible methods. Journal of health
services research & policy, 10(1), 45-53B.
Doevendans, J.T. (2010). Total Quality Management in the New Zealand Pipfruit Industry;
An exploratory study (Unpublished master’s thesis) Massey University: Palmerston North,
New Zealand.
Doevendans, J.T. (2013). Management paradigms: Where to start? Pipfruit NewZ, July
2013.
Doevendans, J.T., and Wilson, R. (2011) The New Zealand Pipfruit Supply and value Chain
2010. Pipfruit NZ: Hastings
Doevendans, H. J., Grigg, N. P., & Goodyer, J. (2012). Towards a Lean NZ pipfruit industry;
improving practices within and between supply chain elements. Paper presented at the
World Business Capability Congress, Auckland, New Zealand.
Doevendans, H. J., Grigg, N. P., & Goodyer, J. (2014)¹. Introducing Lean to a horticultural
setting- Operational innovation of the New Zealand pipfruit industry. Paper presented at
the Euroma conference, Palermo, Italy.
Doevendans, H. J., Grigg, N. P., & Goodyer, J. (2014)². Exploring Lean deployment in New
Zealand apple pack-houses. Paper presented at the PMA conference, Aarhus, Denmark.
Doevendans, H. J., Grigg, N. P., & Goodyer, J. (2014)³. Towards a Lean NZ pipfruit industry;
improving practices within and between supply chain elements. Paper presented at the
ANZAM conference, Auckland, New Zealand.
Donati, M. (2004). Beyond synchronicity: the worldview of Carl Gustav Jung and Wolfgang
Pauli. Journal of Analytical Psychology, 49(5), 707-728.
Eisenhardt, K. M. (1989). Building Theories from Case Study Research. The Academy of
Management Review 14(4): 532-550.
Eisenhardt, K. M. & Brown, S.L. (1998). Time Pacing: Competing in markets that won’t
stand still. HBR, March-April 1998.
Emiliani, M. L. (1998). Lean behaviors. Management Decision, 36(9), 615-631.
Page 288 of 372
Emiliani, M. L. (2012). ‘Lean Management Failure at _____________’.
http://www.bobemiliani.com/oddsnends/lmf_article.pdf (Retrieved 11-9-2012).
Emiliani, M. L., & Stec, D. J. (2004). Using value-stream maps to improve leadership.
Leadership & Organization Development Journal, 25(8), 622-645.
EU Commission Recommendation 2003/361/EC. Official Journal of the European Union L
124, p. 36 of 20 May 2003.
Ezzamel, M., Hoskin, K., & Macve, R. (1990). Managing it all by numbers: a review of
Johnson & Kaplan's ‘Relevance Lost’. Accounting and business research, 20(78), 153-166.
Fillingham, (2007). Can lean save lives? Leadership in Health Services, 20(4), pp. 231-241.
Financial Post Canada (1999), “Aerospace industry mimics Toyota”, Financial Post, 10
March.
Flower, J. (1998). In the mush. Physician executive, 25(1), 64-66.
Food Chain Centre (2007). Applying lean thinking to the fresh produce industry . Watford
Herts: Food Chain Centre.
Food Chain Centre (2007). Saving Money by Better Workplace Organisation. A Case Study
of Adrian Cripps Ltd. Watford Herts: Food Chain Centre.
Ford, H. (1922). My life and work. Garden City, N.Y.: Doubleday, Page & Company (The
country life press).
Frater, G. T. (1999). An investigation into innovation management in the New Zealand
apple production industry. (Unpublished master’s thesis). University of Waikato, Hamilton,
New Zealand.
FreshFacts 2001, (2002). Auckland: Plant & Food Research.
FreshFacts 2006, (2007). Auckland: Plant & Food Research.
FreshFacts 2010, (2011). Auckland: Plant & Food Research.
FreshFacts 2012, (2013). Auckland: Plant & Food Research.
Friedman, T. L. (2006). The world is flat. Maryborough, Australia: Pearson Australia Group
Pty Ltd.
Page 289 of 372
Fujimoto, T., & Tidd, J. (1994). The UK & Japanese automobile industries: adoption &
adaptation of Fordism. Actes du GERPISA, 11, 94.
Fullerton, R. R., McWatters, C. S., & Fawson, C. (2003). An examination of the
relationships between JIT and financial performance. Journal of Operations Management,
21(4), 383-404.
Gapp, R., Fisher, R, and Kobayashi, K. (2008). Implementing 5S within a Japanese context:
an integrated management system. Management Decision, 46(4) pp. 565 – 579.
George, M. L., & George, M. (2003). Lean six sigma for service (p. 273). New York, NY:
McGraw-Hill.
Gershon, M. (2010). Choosing which process improvement methodology to implement.
The Journal of Applied Business and Economics, 10(5), 61-69.
Gersick, C. J. (1991). Revolutionary change theories: A multilevel exploration of the
punctuated equilibrium paradigm. Academy of management review, 16(1), 10-36.
Ghauri, P. N. & Grǿnhaug, K. (2005). Research methods in business studies: A practical
guide. 3rd Ed. Pearson Education.
Gilbreth, F. B. (1911). Motion study: A method for increasing the efficiency of the
workman. D. Van Nostrand Company.
Gilbreth, F. B., & Gilbreth, L. M. (1919). Fatigue Study: The Elimination of Humanity's
Greatest Unnecessary Waste, a First Step in Motion Study . Macmillan.
Golafshani, N. (2003). Understanding reliability and validity in qualitative research. The
qualitative report, 8(4), 597-607.
Goldratt, E. M. & Cox, J. (1986). The goal. A process of Ongoing Improvement (Revised
Edition). Croton-on-Hudson, N.Y.: North River Press Inc.
Gooch, M., Felfel, A. & Marenick, N. (2010). Food Waste in Canada. Publication by the
Value Chain Management Centre of the George Morris Centre in Canada.
Gooch, M., Laplain, D., Stiefelmeyer, K., Marenick, N., Felfel, A., Ingratta, F., Martin, L.,
Siren, C., Lamb, T., Dent, B., & MacTavish J. (2009). Consumer Market Research Strategic
Study for Fresh Grapes and Fresh & Processed Apples & Tender Fruit & Orchard Fruit &
Vineyard Quality Assessment throughout. Vineland Research and Innovation Centre.

Page 290 of 372
Goodyer, J., Grigg, N. and Murti, Y. (2011). Sustaining Lean Manufacturing in New Zealand
Organisations. Report prepared for NZTE. Massey University.
Graff, D. J. (1991). Deming's management philosophy and the defense industrial base.
Naval Postgraduate School Monterey CA.
Grasso, L. (2006). Barriers to lean accounting. Journal of cost management, 20(2), 6-19.
Green, R., Agarwal, R, Brown, Paul, Tan, H. and Randhawa K. (2011). Management
Matters in New Zealand: How Does Manufacturing Measure Up? Ministry of Economic
Development: Occasional Paper 11/03
Green, J. R., & Laffont, J. J. (1987). Posterior implementability in a two-person decision
problem. Econometrica: Journal of the Econometric Society, 69-94.
Greene, J. C., Caracelli, V. J., & Graham, W. F. (1989). Toward a conceptual framework for
mixed-method evaluation designs. Educational evaluation and policy analysis, 11(3), 255-
274.
Grigg, N. & Doevendans, J.T. (2011) Human Resource issues in the New Zealand Pipfruit
Industry: Some findings from a quality management study . Paper presented at EUROMA
2011, Cambridge, England.
Grigg, N.P., Goodyer, J. Murti, Y. and Shekar, A. (2010). The use of case study methods for
research into lean sustainability in SMEs in New Zealand . Paper presented at the 2010
Euroma Conference, Porto, Portugal.
Grover, V., Jeong, S. R., Kettinger, W. J., & Teng, J. T. (1995). The implementation of
business process reengineering. Journal of Management Information Systems, 12(1), 109-
144.
Growing a New Future, Horticulture Industry Strategy 2009-2020 (2009). Wellington:
Horticulture NZ.
Guba, E. G., & Lincoln, Y. S. (1994). Competing paradigms in qualitative research.
Handbook of qualitative research, 2, 163-194.
Hammer, M. (1990). Reengineering work: don't automate, obliterate. Harvard business
review, 68(4), 104-112.

Page 291 of 372
Hammer, M., & Champy, J. (1993). Business process reengineering. London: Nicolas
Brealey.
Hausman, W. H., Montgomery, D. B., & Roth, A. V. (2002). Why should marketing and
manufacturing work together? Some exploratory empirical results. Journal of Operations
Management, 20(3), 241-257.
Heberlein, T. A., & Baumgartner, R. (1978). Factors affecting response rates to mailed
surveys: A quantitative analysis of the published literature. American Sociological Review,
43, 447–462.
Hesselberth, J. (2008). Enabling Analysis. Synygy Magazine.
Hines, P. (2009). Lean & Green. Source, the home of Lean thinking, 3rd Edition, Summer
2009.
Hines, P. (2010). The principles of the Lean Business System. SA Partners.
Hines, P. (2013). Lean in the 21st century: The principles of the Lean Business System: #4 –
Pull. http://www.sapartners.com/lean-in-the-21st-century-blog-series-the-principles-of-
the-lean-business-system-4-
pull/?utm_content=qmacs%40xtra.co.nz&utm_source=VerticalResponse&utm_medium=
Email&utm_term=Read%20more&utm_campaign=S%20A%20Partners%20Monthly%20Ne
wslettercontent (Retrieved 2-8-2013).
Hines P., Bailey K. & Francis M. (2011b). Contingent approaches to quality-based pricing
within the agri-food business. International Journal of Logistics: Research and
Applications, Vol. 9, No. 3, September 2006, 223–235
Hines, P., Found, P., Griffiths, G and Harrison, R. (2011a). Staying Lean. Thriving, Not Just
Surviving (2nd Ed). London: CRC Press, Taylor and Francis Group.
Hines, P., Holweg, M., Rich, N. (2004),"Learning to evolve: A review of contemporary Lean
thinking", International Journal of Operations & Production Management, 24 (10) pp. 994
– 1011.
Hines, P., Martins, A. L., & Beale, J. (2008). Testing the boundaries of lean thinking:
observations from the legal public sector. Public Money and Management, 28(1), 35-40.

Page 292 of 372
Hines, P., & Rich, N. (1997). The seven value stream mapping tools. International journal
of operations & production management, 17(1), 46-64.
Hofstede, G. (1994). The business of international business is culture. International
business review, 3(1), 1-14.
Holton, E. (2003). Cycle Time: A Missing Dimension in HRD Research and Theory. Human
Resource Development Review 2003 2 (4): 335-336.
Holweg, M. (2007). The genealogy of lean production. Journal of Operations
Management, 25(2), 420-437.
Holweg, M. and Pil, F.K. (2001). Successful Build-to-Order Strategies Start With the
Customer. MIT Sloan management review, ISSN 1532-9194, Vol. 43, Nº 1, pages 74-83.
Hopkins, K. D. (1982). The unit of analysis: Group means versus individual observations.
American Educational Research Journal, 19(1), 5-18.
Hormozi, A. M. (2001). Agile manufacturing: the next logical step. Benchmarking: An
International Journal, 8(2), 132-143.
Ichniowski, Casey, et al (1996). "What works at work: overview and assessment."
Industrial Relations: A Journal of Economy and Society 35.3: 299-333.
Imai, M. (1986). Kaizen, the key to Japan’s competitive success. Singapore: McGraw-Hill.
Imai, M. (1997). Gemba Kaizen: A Commonsense, Low-Cost Approach to Management.
New York: McGraw-Hill.
Inkson, K. & Kolb, D. (2003). Management: Perspectives for New Zealand (3rd edition).
Auckland: Pearson Education New Zealand Limited.
International Organisation of Motor Vehicle Manufacturers – OICA (2008). World Ranking
of Manufacturers Year 2008. http://oica.net/wp-content/uploads/world-ranking-2008.pdf
(Retrieved 26-4-2012).
International Plant Protection Convention (IPPC) Countries List.
https://ippc.int/countries/list-countries (Retrieved on 4 July 2013).
Ishikawa, K. (1985). What is total quality control? The Japanese way (Vol. 215). Englewood
Cliffs, NJ: Prentice-Hall.
Page 293 of 372
Jacobi, J. (1973). The psychology of C.G. Jung. New Haven: Yale University Press.
James-Moore, S. M., & Gibbons, A. (1997). Is lean manufacture universally relevant? An
investigative methodology. International Journal of Operations & Production
Management, 17(9), 899-911.
Jayne, V. (2010) Masaaki Imai KAIZEN Guru. NZ Management magazine, April 2010 pp 40-
42.
Jina, J., Bhattacharya, A. K., & Walton, A. D. (1997). Applying lean principles for high
product variety and low volumes: some issues and propositions. Logistics Information
Management, 10(1), 5-13.
Johnson, H. T. (1991). Relevance lost: the rise and fall of management accounting. Harvard
Business Press.
Johnson, H. T. (2006). Lean dilemma: Choose system principles or management
accounting controls, not both. Lean Accounting: Best Practices for Sustainable Integration.
Hoboken, NJ: John Wiley & Sons.
Jones, D. T., Hines, P., & Rich, N. (1997). Lean logistics. International Journal of physical
distribution & logistics management, 27(3/4), 153-173.
Jones, T.O. & Sasser Jr, W.E. (2001). Why satisfied customers defect. Harvard Business
Review 73(6), 88.
Joosten, T., Bongers, I., & Janssen, R. (2009). Application of lean thinking to health care:
issues and observations. International Journal for Quality in Health Care, 21(5), 341-347.
Jørgensen, B. and Emmitt, S (2008),"Lost in transition: the transfer of lean manufacturing
to construction", Engineering, Construction and Architectural Management, 15 (4) pp. 383
– 398.
Kallage, R. (2006). Lean implementation failures: Why they happen, and how to avoid
them. http://www.thefabricator.com/article/shopstrategies/lean-implementation-failures
(Retrieved 27-8-2013).
Kaplan, R. S., & Norton, D. P. (1998). Putting the balanced scorecard to work. The
Economic Impact of Knowledge, 315-24.

Page 294 of 372
Kaplan, R. S., & Norton, D. P. (2001).Transforming the Balanced Scorecard from
Performance Measurement to Strategic Management: Part I. Accounting Horizons, 15(1),
87–104.
Kashyap, N., Dixon, J., Michel, G., Brandt, C., & Shiffman, R. (2005). GuideLine
implementability appraisal v. 2.0. Book: GuideLine implementability appraisal, 2.
Kelsey, J. (1997). The New Zealand Experiment: A world Model for Structural Adjustment?
Auckland University Press.
Kennedy, J.C., (2000). Leadership and culture in New Zealand. Canterbury: Lincoln
University
Kennedy, F. A., & Brewer, P. C. (2006). The lean enterprise and traditional accounting—Is
the honeymoon over? Journal of Corporate Accounting & Finance, 17(6), 63-74.
Kilpatrick, J. (2003). Lean principles. Utah Manufacturing Extension Partnership, 1-5.
Kim, C. S., Spahlinger, D. A., Kin, J. M., & Billi, J. E. (2006). Lean health care: What can
hospitals learn from a world‐class automaker? Journal of Hospital Medicine, 1(3), 191-199.
King, P.L. (2009). Lean for the Process Industries. London: CRC Press, Taylor & Francis
Group
Kobayashi, I. (1995). 20 keys to workplace improvement. Portland, Oregon: Productivity
press.
Kolb, D. A. (1984). Experiential learning: Experience as the source of learning and
development (Vol. 1). Englewood Cliffs, NJ: Prentice-Hall.
Koskela, L.J. (2004), Making do - the eighth category of waste. Paper presented at the
12th Annual Conference of the International Group for Lean Construction, 3-5 August
2004, Helsingor, Denmark.
Kotter, J. P. (1995). Leading change: Why transformation efforts fail. Harvard business
review, 73(2), 59-67.
Krafcik, J. F. (1988a). Comparative analysis of performance indicators at world auto
assembly plants (Unpublished doctoral thesis), Massachusetts Institute of Technology).

Page 295 of 372
Krafcik, J. F. (1988b). Triumph of the lean production system. Sloan management review,
30(1), 41-51.
Krings, D., Levine, D., & Wall, T. (2006). The Use of" Lean" in Local Government. PUBLIC
MANAGEMENT-LAWRENCE THEN WASHINGTON-, 88(8), 12.
Kvale, S. (1995). The social construction of validity. Qualitative inquiry, 1(1), 19-40.
Lean – What difference is it making to New Zealand businesses and what can we do to
ensure its success? (2011). Unpublished report by Windshift Ltd to NZTE.
Lewis, M. A. (2000). Lean production and sustainable competitive advantage.
International Journal of Operations & Production Management, 20(8), 959-978.
Liker, J. K. (2004). The Toyota Way; 14 management principles from the world’s greatest
manufacturer. New York: McGraw-Hill.
Liker, J. K., & Hoseus, M. (2007). Toyota culture: The heart and soul of the Toyota way.
New York: McGraw-Hill.
Liker, J. K., & Morgan, J. M. (2006). The Toyota way in services: the case of lean product
development. The Academy of Management Perspectives, 20(2), 5-20.
Liker, J. & Rother, M (2013). Why Lean Programs Fail. Lean Enterprise Institute.
http://www.lean.org/admin/km/documents/A4FF50A9-028A-49FD-BB1F-CB93D52E1878-
Liker-Rother%20Article%20v3_5_CM.pdf (Retrieved 27-8 2013).
Linderman, K., Schroeder, R. G., Zaheer, S., & Choo, A. S. (2003). Six Sigma: a goal -
theoretic perspective. Journal of Operations Management, 21(2), 193-203.
Lundberg, C., Gudmundson, A., & Andersson, T. D. (2009). Herzberg's Two-Factor Theory
of work motivation tested empirically on seasonal workers in hospitality and tourism.
Tourism Management, 30(6), 890-899.
Lutz, W., Sanderson, W. and Scherbov, S. (2001). The end of world population growth.
Nature, 412(2), 543-545.
MAF Horticulture and Arable Monitoring Report 2008. Wellington: MAF Policy.
MAF Horticulture and Arable Monitoring Report 2009. Wellington: MAF Policy.
MAF Horticulture and Arable Monitoring Report 2011. Wellington: MAF Policy.

Page 296 of 372
Mahapatra, S. S., & Mohanty, S. R. (2007). Lean manufacturing in continuous process
industry: an empirical study. Journal of Scientific and Industrial Research, 66(1), 19.
Mahidhar, V. (2005). Designing the lean enterprise performance measurement system.
(Unpublished doctoral thesis), Massachusetts Institute of Technology.
Manfreda, K. L., Batagelj, Z., & Vehovar, V. (2002). Design of web survey questionnaires:
Three basic experiments. Journal of Computer‐Mediated Communication, 7(3) , 0-0.
Mannering, R (1999). 100 Harvests: a history of fruitgrowing in Hawkes Bay . Wellington:
PSL Press.
Marshall, K., Avery, G., Ballard, Russell. And Johns, D. (2012). A Call to Arms. A
Contribution to a New Zealand Agri-Food Strategy Report from the Riddet Institute Agri-
Food Thought Leadership Team. Riddet Institute, Massey University, Palmerston North.
Martinez-Lorente, A. R., Dewhurst, F. & Dale, B.G. (1998). Total quality management:
origins and evolution of the term. The TQM Magazine, 10(5), 378-386.
Maskell, B.H. (2004). What is Lean Accounting, ‘Superfactory’.
www.maskell.com/leanAcctg.htm. 01.08.2009 (Retrieved 10-10-2013).
Maskell, B.H. (2013). Lean Accounting. Printing Industries of America: The Magazine | 3
2013, pp 28-30.
Maskell, B. H., & Baggaley, B. L. (2006). Lean accounting: what's it all about? Target, 22(1),
35-43.
Maskell, B. H., & Kennedy, F. A. (2006). Accounting for the Lean Enterprise: Major Changes
to the Accounting Paradigm. Statements on Management Accounting, Institute of
Management Accountants, Montvale.
Maskell, B. H., & Kennedy, F. A. (2007). Why do we need lean accounting and how does it
work? Journal of Corporate Accounting & Finance, 18(3), 59-73.
Mason-Jones, R., & Towill, D. R. (1999). Using the information decoupling point to
improve supply chain performance. The International Journal of Logistics Management,
10(2), 13-26.
Mason-Jones, R., Naylor, B. & Towill, D.R. (2000). Lean, agile or leagile? Matching your
supply chain to the marketplace. Int. J. Prod. Res., 38(17), 4061-4070.

Page 297 of 372
Maxwell, J. A. (1992). Understanding and validity in qualitative research. Harvard
educational review, 62(3), 279-301.
McAdam, R. (2000). Quality models in an SME context: a critical perspective using a
grounded approach. International Journal of Quality & Reliability Management, 17(3),
305-323.
McKenna, M. & Campbell, H. (1999). Strategies for ‘Greening’ the New Zealand Pipfruit
Export Industry: The development of IFP and Organic Systems. Studies in Rural
Sustainability Research Report No 6. Dunedin: Department of Anthropology, University of
Otago.
McKenna, M. Roche, M. Mansvelt, J. Berg, L. (1999). Core Issues in New Zealand’s Apple
Industry: Global-Local Challenges. Geography Department Massey University.
Melton, T. (2005). The Benefits of Lean Manufacturing. What Lean Thinking has to Offer
the Process Industries. Chemical Engineering Research and Design, 83(A6), 662–673
Miles, M. B., & Huberman, A. M. (1984). Drawing valid meaning from qualitative data:
Toward a shared craft. Educational researcher, 20-30.
Miles, M. B., & Huberman, A. M. (1994). Qualitative data analysis: An expanded
sourcebook. Sage.
Mintzberg, H. (1979). An emerging strategy of" direct" research. Administrative science
quarterly, 24(4), 582-589.
Mitroff, I. I., Betz, F., Pondy, L. R., & Sagasti, F. (1974). On managing science in the systems
age: two schemas for the study of science as a whole systems phenomenon. Interfaces,
4(3), 46-58.
Monden, Y. (1983). Toyota Production System. Practical approach to production
management. Atlanta: Industrial Engineering and management Press.
Monden, Y. (1998). Toyota production system: an integrated approach to just-in-time.
London: CRC Press
Monigatti, R. (1966). Fruitful Years. Wellington: Ferguson and Osborn Ltd.

Page 298 of 372
Morse, J. M., Barrett, M., Mayan, M., Olson, K., & Spiers, J. (2008). Verification strategies
for establishing reliability and validity in qualitative research. International journal of
qualitative methods, 1(2), 13-22.
Moss, P. A. (1994). Can there be validity without reliability? Educational researcher, 23(2),
5-12.
Murray, R. (2011). How to write a thesis. McGraw-Hill International.
Murti, Y. (2009). Sustaining Lean in New Zealand manufacturing Organisations .
(Unpublished master’s thesis). Massey University, Palmerston North, New Zealand.
Mwaura, G., Sutton, J., & Roberts, D. (1998). Corporate and national culture-an
irreconcilable dilemma for the hospitality manager? International Journal of
Contemporary Hospitality Management, 10(6), 212-220.
Näslund, D. (2008). Lean, six sigma and lean sigma: fads or real process improvement
methods? Business Process Management Journal, 14(3), 269-287.
National Pipfruit Crop Estimate (2013). Hastings: Pipfruit New Zealand Inc.
Naylor, J. B., Naim, M. M., & Berry, D. (1999). Leagility: integrating the lean and agile
manufacturing paradigms in the total supply chain. International Journal of production
economics, 62(1), 107-118.
Neely, A. (1999). The performance measurement revolution: why now and what next?
International Journal of Operations & Production Management, 19(2), 205-228.
Nelson, D. (Ed.). (1992). A mental revolution: Scientific management since Taylor. Ohio
State University Press.
Newman, K. L., & Nollen, S. D. (1996). Culture and congruence: The fit between
management practices and national culture. Journal of international business studies, 753-
779.
Nightingale, D. J., & Mize, J. H. (2002). Development of a lean enterprise transformation
maturity model. Information, Knowledge, Systems Management, 3(1), 15-30.
OECD (2013), “Labour productivity levels”, in OECD Factbook 2013: Economic,
Environmental and Social Statistics, OECD Publishing.

Page 299 of 372
Ohno, T. (2013). Taiichi Ohno’s Workplace Management, Special 100th Birthday Edition.
London: McGraw-Hill
Ohno, T. (1988). Toyota production system: beyond large-scale production. Productivity
press.
O'Neal, C. R. (1989). JIT procurement and relationship marketing. Industrial Marketing
Management, 18(1), 55-63.
Onwuegbuzie, A. J., Johnson, R. B., & Coll ins, K. M. (2009). Call for mixed analysis: A
philosophical framework for combining qualitative and quantitative approaches.
International journal of multiple research approaches, 3(2), 114-139.
Oram, R. (2012). Radical is the new Normal. Fast-forwarding the world’s economic
transformation, sustainably. Presentation to the World Business Capability Conference,
Auckland University: December 2012.
Orlicky, J. (1975). Material requirements planning. New York: McGraw-Hill.
Patton, M.Q. (1990). Qualitative Evaluation and Research Methods (2nd Ed). London: Sage
Publications.
Pedersen, E. R. G., & Huniche, M. (2011). Determinants of lean success and failure in the
Danish public sector: a negotiated order perspective. International Journal of Public Sector
Management, 24(5), 403-420.
Perigord, M. (1990). Achieving Total Quality Management. Cambridge Massachusetts:
Productivity Press.
Pettersen, J. (2009). Defining lean production: some conceptual and practical issues. The
TQM Journal, 21(2), 127-142.
Piercy, N. C., & Rich, N. (2004). Strategic marketing and operations relationships: the case
of the lean enterprise. Journal of Strategic Marketing, 12(3), 145-161.
Piercy, N. F., & Morgan, N. A. (1997). The impact of lean thinking and the lean enterprise
on marketing: threat or synergy? Journal of Marketing Management, 13(7), 679-693.
Pil, F. K., & MacDuffie, J. P. (1996). The adoption of high‐Involvement work practices.
Industrial Relations: A journal of economy and society, 35(3), 423-455.

Page 300 of 372
Pipfruit Industry Statistical Annual 2006 (2007). Hastings: Pipfruit New Zealand
Incorporated.
Pipfruit Industry Statistical Annual 2012 (2013). Hastings: Pipfruit New Zealand
Incorporated.
Pipfruit New Zealand Incorporated 2013 Annual Conference: $1 billion by 2022.
Pipfruit NewZ (2005). Where to from here? – 2006 and beyond. August issue, 2005.
Pipfruit NewZ (2008). Lean Manufacturing. October issue, 2008.
Pipfruit NewZ (2013). Lean Workshop at Fruitpackers. June issue, 2013.
Pipfruit NewZ, (2005). Market Panel Membership up to 77% Export Volume. December
issue, 2005).
Pipfruit NewZ, (2012). Urgently required: Volunteers for ‘Lean’ case studies! April issue
2012.
Pipfruit NZ (2008) Pipfruit-IFP MANUAL incorporating Apple Futures. Hastings: Pipfruit NZ
Pipfruit NZ (2012). Best Practice Guidelines for Production, Harvest, Cool-chain and
Packing of NZ pipfruit; Industry Quality Recommendations. Hastings: Pipfruit NZ
Polit, D. F., & Beck, C. T. (2004). Nursing research: Principles and methods. Lippincott
Williams & Wilkins.
Pool, A., Wijngaard, J., & Van der Zee, D. J. (2011). Lean planning in the semi -process
industry, a case study. International Journal of Production Economics, 131(1), 194-203.
Powell, M., & Childerhouse, P. (2010). Retail value stream management. International
Journal of Electronic Customer Relationship Management, 4(3), 209-227.
Radnor, Z. (2010). Transferring lean into government. Journal of Manufacturing
Technology Management, 21(3), 411-428.
Radnor, Z. J., Holweg, M., & Waring, J. (2012). Lean in healthcare: The unfilled promise?
Social Science & Medicine, 74(3), 364-371.

Page 301 of 372
Radnor, Z., Walley, P., Stephens, A., & Bucci, G. (2006). Evaluation of the lean approach to
business management and its use in the public sector. Research Findings 20/2006.
Edinburgh: Scottish Executive.
Ragin, C., C. (2007). Comparative Methods. In Outhwaite, W. and Turner, S. P. (2007). The
SAGE Handbook of Social Science Methodology
Reichhart, A., & Holweg, M. (2007). Lean distribution: concepts, contributions, conflicts.
International journal of production research, 45(16), 3699-3722.
Röhr, A., Lüddecke, K., Drusch, S., Müller, M. J., & Alvensleben, R. V. (2005). Food quality
and safety––consumer perception and public health concern. Food control, 16(8), 649-
655.
Saunders, M. N., Saunders, M., Lewis, P., & Thornhill, A. (2011). Research Methods for
Business Students, 5/e. Pearson Education India.
Scaffede, R. (2002). What it takes to turn manufacturing lean: the experience of Donnelly
Corporation. Journal of Organizational Excellence, 21(4), 3-16.
Scarrow, S. (2010). The ‘lean’ approach to orchard management. The Orchardist, April
2010.
Scherrer-Rathje, M., Boyle, T. A., & Deflorin, P. (2009). Lean, take two! Reflections from
the second attempt at lean implementation. Business Horizons, 52(1), 79-88.
Schneiderman, A. M. (1988). Setting quality goals. Quality Progress, 21(4), 51-57.
Schonberger, R. J. (1982). The Transfer of Japanese Manufacturing Management
Approaches to U. S. Industry. The Academy of Management Review, 7(3), 479-487.
Schonberger, R. J. (1987). Frugal manufacturing. Harvard Business Review, 65(5), 95-100.
Schonberger, R. J. (2007). Japanese production management: An evolution—with mixed
success. Journal of Operations Management, 25(2), 403-419.
Seale, C. (1999). Quality in qualitative research. Qualitative inquiry, 5(4), 465-478.
Seddon, J. (2007). Watch out for the toolheads. Factory Strategies Group LLC.
Seddon, J. (2010). Why Lean is a wicked disease. Moneywatch May 17, 2010, CBS
Interactive Inc.

Page 302 of 372
http://www.vanguardnederland.nl/nederlands/documents/JohnSeddon_vanguard-
methode_check-plan-do_why-lean-is-a-wicked-desease.pdf (Retrieved 11-9-2013).
Seddon, J. and Brand, C. (2008). Debate: Systems thinking and Public Sector Performance.
Public Money & management, 28(1), 7-9.
Seddon, J., & Caulkin, S. (2007). Systems thinking, lean production and action learning.
Action Learning: Research and Practice, 4(1), 9-24.
Shah, R., & Ward, P. T. (2003). Lean manufacturing: context, practice bundles, and
performance. Journal of Operations Management, 21(2), 129-149.
Shah, R. and Ward, P. (2007). Defining and developing measures of lean production.
Journal of Operations Management, 25(4), 785-805.
Sharma, A., & LaPlaca, P. (2005). Marketing in the emerging era of build-to-order
manufacturing. Industrial Marketing Management, 34(5), 476-486.
Sheehan, K. B. (2006) E-mail Survey Response Rates: A Review. Journal of Computer-
Mediated Communication, 6(2), pp0.
Shingo, S. (1989). A study of the Toyota production system: From an Industrial Engineering
Viewpoint. Productivity Press.
Shingo, S. (1992). The Shingo production management system: improving process
functions. Cambridge, MA: Productivity Press.
Simchi-Levi, D, Kaminsky, P. and Simchi-Levi, E. (2003). Designing and managing the
supply chain. New York: McGraw-Hill Irwin.
Skorstad, E. (1994). Lean production, conditions of work and worker commitment.
Economic and Industrial Democracy, 15(3), 429-455.
Slack, N., Lewis, M. and Bates, H (2004). The two worlds of operations management
research and practice: Can they meet, should they meet? International Journal of
Operations & Production Management, 24(4), 372–387.
Smelser, Neil J. (1976) Comparative Methods in the Social Sciences. Englewood Cliffs, NJ:
Prentice Hall

Page 303 of 372
SMEs in New Zealand: Structure and Dynamics 2011 (2011) (ISSN 1178-3281). Ministry of
Economic Development, Wellington, New Zealand: Author
Snee, R. D. (2010). Lean Six Sigma-getting better all the time. International Journal of Lean
Six Sigma, 1(1), 9-29.
Sohal, A. S., & Egglestone, A. (1994). Lean production: experience among Australian
organizations. International Journal of Operations & Production Management, 14(11), 35-
51.
Specifications Manual (2003). ENZAFRUIT. ENZA limited
Staats, B. R., Brunner, D. J. and Upton, D. M. (2011). Lean principles, learning, and
knowledge work: Evidence from a software services provider. Journal of Operations
Management 29(5), 376–390.
Stake, R. E. (1978). The case study method in social inquiry. Educational researcher, 5-8.
Stake, R. E. (2013). Multiple case study analysis. Guilford Press. (chapter 2.1)
Statistics New Zealand (2011), “Gross Domestic Product: December 2010 Quarter”,
http://www.stats.govt.nz/browse_for_stats/economic_indicators/GDP/ (accessed June
2011).
Stamm, M. L., Neitzert, T., & Singh, D. P. K. (2009). TQM, TPM, TOC, Lean and Six Sigma-
Evolution of manufacturing methodologies under the paradigm shift from
Taylorism/Fordism to Toyotism.
Stone, K. B. (2012),"Four decades of Lean: a systematic literature review", International
Journal of Lean Six Sigma, 3(2), 112–132.
Storm, L. (1999). Synchronicity, causality and acausality. Journal of Parapsychology, 63,
247–269.
Sugimori. Y., Kusunoki, K., CHO, F. and Uchikawa, S. (1977). Toyota production system and
Kanban system Materialization of just-in-time and respect-for-human system.
International Journal of Production Research, 15(6), 553-564.
Tapping, D., Luyster, T., & Shuker, T. (2002). Value stream management: Eight steps to
planning, mapping, and sustaining lean improvements. Productivity Press.

Page 304 of 372
Taylor, F. W. (1919). The Principles of Scientific Management. New York: Harper &
Brothers Publishers.
Tellis, W. (1997). Application of a case study methodology. The qualitative report, 3(3), 1-
17.
The Business Growth Agenda Progress Reports: Building Export Markets (2012). New
Zealand Government.
Umble, M. M., & Srikanth, M. L. (1995). Synchronous manufacturing: Principles for world-
class excellence. Conn. Wallingford: Spectrum Publications
Vargo, S. L., & Lusch, R. F. (2004). Evolving to a new dominant logic for marketing. Journal
of marketing, 68(1), 1-17.
Vogel, E. F. (1979). Japan as number 1: Lessons for America. Tokyo: Charles E. Tuttle.
Voss, C., Tsikriktsis, N. & Frohlich, M. (2002). Case research in operations management.
International Journal of Operations & Production Management, 22(2), 195-219.
Wagner, J. (2011). Studying Cultures of Continuous Improvement as Shared Meaning
Systems. A Comparative Investigation of Group Cultures of Continuous Improvement in
Different Societal Contexts. (Unpublished doctoral thesis), Massey University, Palmerston
North.
Wang, E. T., Klein, G., & Jiang, J. J. (2006). ERP misfit: country of origin and organizational
factors. Journal of Management Information Systems, 23(1), 263-292.
Wells, D. A. (1889). Recent Economic Changes, and Their Effect on the Production and
Distribution of Wealth and the Well-being of Society. New York: D. Appleton and
Company.
Weick, K. E., & Quinn, R. E. (1999). Organizational change and development. Annual
review of psychology, 50(1), 361-386.
Westbrook, R. (1995). Action research: a new paradigm for research in production and
operations management. International Journal of Operations & Production Management,
15(12), 6-20.
Williams, S., and Radnor, Z. (2014). The role of lean thinking in the design of integrated
care pathways. Paper presented at Euroma 2014, Palermo, Italy.

Page 305 of 372
Wilson, M., J. Heyl, and Smallman, C. (2008). Supporting Lean Manufacturing Initiatives in
New Zealand. Final Report. Christchurch, Lincoln University: 52.
Wilson, R. and Emms, C. (2009). Rapid Orchard Establishment Economic Modelling
2008/2009. Report prepared for the Sustainable Farming Fund and Pipfruit NZ. Hastings:
Pipfruit NZ
Womack, J. P., & Jones, D. T. (2003). Lean thinking: Banish waste and create wealth in
your corporation. New York: Free Press.
Womack, J. P., & Jones, D. T. (2009). Lean solutions: How companies and customers can
create value and wealth together. New York: Simon and Schuster.
Womack, J. P., & Jones, D. T., & Roos, D. (1990). The Machine That Changed the World:
The Story of Lean Production: How Japan’s Secret Weapon in the Global Auto Wars Will
Revolutionize Western Industry. New York, NY: Rawson Associates.
Womack, J. P., & Jones, D. T., & Roos, D. (2007). The machine that changed the world: The
story of lean production--Toyota's secret weapon in the global car wars that is now
revolutionizing world industry. London: Simon & Schuster.
Womack, J.P. (2010). A chat with James Womack. http://rk2blog.com/2010/06/09/a-chat-
with-james-womack/ (Retrieved 26-8-2013).
Womack, J. (2013). Gemba Walks: Expanded 2nd Edition. Lean Enterprise Institute.
Wong, K. Y., & Aspinwall, E. (2005). An empirical study of the important factors for
knowledge-management adoption in the SME sector. Journal of knowledge management,
9(3), 64-82.
World Apple Review 2002 Edition (2002). Pullman, Washington: Belrose Incorporated.
World Apple Review 2003 Edition (2003). Pullman, Washington: Belrose Incorporated.
World Apple Review 2009 Edition (2009). Pullman, Washington: Belrose Incorporated.
World Apple Review 2010 Edition (2010). Pullman, Washington: Belrose Incorporated.
World Apple Review 2012 Edition (2012). Pullman, Washington: Belrose Incorporated.
Wright, O. (1995). Manufacturing resource planning: MRP II: unlocking America's
productivity potential. John Wiley & Sons.

Page 306 of 372
Xu, X. (2006). To Be Lean or Agile in Supermarket Retail Industry: A Case Study on
Sainsburys. (Unpublished doctoral thesis). University of Nottingham.
Yin, R. K. (2009). Case study research: Design and methods (Vol. 5) . Sage.
Yin, R. K. (2012). Applications of case study research (3rd Ed.). Sage.
Zeithaml, V., Parasuraman, A. & Berry, L. L. (1990) Delivering Quality Service: Balancing
customer perceptions and expectations. New York: Free Press.
Page 307 of 372
9. Appendices:
Appendix 1: Reflective practitioner industry review
Appendix 2: Pipfruit Varieties (apples, pears, nashi)
Appendix 3: Export variety -by size -by country example
Appendix 4: 20 Kobayashi keys in relationship diagram (from Kobayashi, 1995) 323
Appendix 5: Lean Consultants
Appendix 6: Announcement of Lean industry study and request for volunteers
Appendix 7: Pipfruit industry stakeholder questionnaire
Appendix 8: Consultant semi-structured interview guideline
Appendix 9: Protocol for case study with partial applicability to action research
Appendix 10: Pipfruit NZ statistical annual data for orchards and packhouses 2012
Appendix 11: ARO: Pruning procedure and visual aid example
Appendix 13: Pipfruit Lean Cluster Summary
Appendix 14: Pipfruit Lean Cluster Summary Feedback example (Sic.)
Appendix 15: Future State Lean Activity Planner
Appendix 16: ARP exercise in identifying waste
Appendix 17: Concerning the originality of the Lean apple tree model

Page 308 of 372
Appendix 1: Reflective practitioner industry review
1. The need for a reflective practitioner review
Over the years, much has happened within the NZ pipfruit industry that has not been
documented. As an independent practitioner, the researcher has reflected on a number of
past developments and reviewed the industry from his professional perspective. The
reflective review became essential when it became clear that existing literature would not
complete the understanding of the industry. The following section reflects on and reviews the
industry from the practitioner’s perspective. The reflective review has been presented to
industry representatives to corroborate the accuracy of the practitioner’s presentation and
was found both interesting and correct by these representatives.
2. After-effects of deregulation and their relevance
The documented history of the NZ pipfruit industry is summarised for the purpose of this
inquiry in chapter 2 of this thesis, the literature review. The undocumented consequences of
deregulation have had both positive and negative effects on the industry. A description of
post-deregulation processes elaborates on this statement.
Just before deregulation in 2001, the industry consisted of 1488 growers, 130 packhouses and
a single exporter (FreshFacts 2002). Growers would just grow their fruit, submit it to their
packhouse and wait for packhouse information (export pack-out percentages) and their
monetary returns from the single desk exporter. Generally, they would have no specific idea
where their fruit was going. Similarly, packhouses would receive the fruit, pack it to the single-
desk exporter specification and submit the fruit to the exporter. Growers and packers had no
idea of end-customers and value streams.
After deregulation of the single desk exporting platform, a number of organisations saw
opportunities in exporting pipfruit. The resources required to become an exporter were
minimal. Exporters did not have to grow the fruit, they did not have to store the fruit nor did
they have to pack the fruit. Exporters did not need substantial financial resources because
they did not purchase the fruit under the NZ model. The grower retained ownership of the
fruit until sold. An exporter required customers for fruit and suppliers for their services,

Page 309 of 372
combined with means of communication and both a logistics and documentation capability.
The capital outlay to become an exporter was low.
This circumstance, combined with the existing and lingering dissatisfaction with the single
existing exporter, led to the formation of multiple exporters in a brief time—just under 100
exporters in the third year after deregulation (figure 2-2). Some of these may be called
opportunists but regardless, each exporter needed supply. Exporters would visit growers and
describe their past and expected returns to growers in order to get growers to commit to
supply. Exporters created outcomes and expectations that were shared with growers but
were considered confidential so that other exporters would not gain knowledge of their
performance and expectations created for the coming season. The outcomes were often
produced on an A4, expressed in dollars by size by variety, but often the underlying
calculations were different. Presented outcomes often looked good to growers initially.
This resulted in a guarded approach between growers who in the past would share
information as there was no disadvantage to sharing. Exporter stakeholders were using terms
such as 'poaching' growers when other exporters approached ‘their’ growers to attain supply.
Market claims were exaggerated in order to secure supply, often leading to disappointing
returns. The expectation-perception gap widened (Zeithaml et al, 1990). Growers would have
planned their next season based on projected outcomes and then find out that there was not
enough money to complete their plans. This researcher has personally witnessed, on a
number of occasions, the level of hate and paranoia between organisations and his several
qualifications in organisational and abnormal psychology and as practicing therapist allow him
to record such observations with a degree of reliability.
In addition to the claims made to growers, NZ exporters were competing in-market with each
other, rather than focussing on competing with supplies from other countries. During the first
years of deregulation, NZ was still considered the most competitive apple producing country
in the world by the World Apple Review 2002 (Belrose). From 2003 onwards, NZ was driven
from first place and never regained that place again (Doevendans, 2010), although always
finding itself in the top five. After a disastrous 2005 season, the industry attempted to unify
exporters which led to the formation of a market panel in 2006. The panel would meet weekly
during the season and discuss pricing by variety, size and market. Although the initiative to
coordinate was a positive one, the market panel was referred to by some as ‘the liar’s club’ as
communicated claims and commitments were subject to exporters’ personal interests and
inconsistent with real outcomes. Exporters confirmed the fragmented industry approach and

Page 310 of 372
may have believed that, rather than focusing on becoming the most effective exporter, it
would be beneficial to misdirect the on-shore competition.
The New Zealand Ministry of Agriculture and Forestry (MAF) produced an annual monitoring
report on the NZ pipfruit industry, analysing data from a number of model orchards in Nelson
and Hawke’s Bay (MAF has been renamed ‘Ministry for Primary Production’ (MPI) since March
2013). The last report was produced in 2012 and the report has not resumed since.
Data released for Hawke’s Bay—the largest pipfruit growing area in NZ—by MPI NZ at the
writer’s request show an average orchard deficit after re-investment between 2002 and 2011
of approximately $44,900 per year. Prolonged periods of re-investment deficit are not
sustainable for the organisations involved. This raises the question how an industry can be
ranked as highly competitive internationally and still be unsustainable economically. It implies
that the industry needs to become even more competitive in order to be sustainable. This
research project intends to find out if Lean can play a role in improving the industry’s
competitiveness.
Orchard surplus (deficit) after re-investment (HB area) for the period from 2002 to 2010 (data
provided by MPI).
On the other hand, deregulation caused some positive developments. The internal
competition did drive towards an intense exporter effort to increase markets and improve
prices, leading the way to an improved market distribution. Although the days were gone
where the growers would lean over the fence and voluntarily share technical information,
- 200 000
- 150 000
- 100 000
- 50 000
50 000
100 000
2002 2003 2004 2005 2006 2007 2008 2009 2010
Orchard surplus/deficit
2002
2003
2004
2005
2006
2007
2008
2009

Page 311 of 372
within interest groups there was a level of development that assisted these interest groups
with technical improvements. Technically, the industry continued to be one of the
frontrunners in the world as a result of the industry’s Integrated Fruit Production (IFP)
programme, which was improved in later years by the ‘Apple Futures’ programme, as well as a
number of other growing and post-harvest developments.
This chapter of the NZ pipfruit industry about the after-effects of deregulation is not well
documented and forms a possibly unavertable blemish in the history of an otherwise
promising primary industry. It combines the good with the bad. As an industry, the pipfruit
industry did not settle after deregulation, resulting in multiple supply and value chain changes
and therefore an uneven system with variable overburdening.
3. Stakeholders using Lean principles and methods intuitively
Over the past four years the interest in Lean has increased a little. Within the industry, the
practitioner is aware of four companies that are relatively dedicated to ‘make Lean work’.
During 2013 and at the request from the governing body, the researcher presented three Lean
workshops in the three main pipfruit regions and found that a limited number of companies
were attending and that Lean was generally an unknown paradigm. Independent of that, a
number of methods and tools have developed intuitively over the years. These include load -
levelling, quick change-over and various other methods. These methods are discussed in this
section.
4. Customer value
The exporter is the closest to the customer and generally is very aware of the customer’s
product preference. This is relevant since exporters estimate that, as a rough estimate, half of
the NZ export product is sold on consignment, i.e. without a dedicated purchaser. The other
half is sold on ‘programmes’, i.e. the customer and exporter agree on a sale and purchase
programme and schedule product deliveries up to six months in advance. Unfortunately not
many exporters communicate these customer requirements timely to growers (i.e. before
pruning starts); consequently, although the customer value and demand may be known

Page 312 of 372
approximately, growers are not generally placed in a position where they can grow fruit for
customers.
Growers do however plan target countries as early as September of each year (which
essentially is after pruning but before thinning) for regulatory reasons. Regulatory country
requirements demand management programmes that generally start in October; the country
planning affects the specifications of the fruit grown. So to a degree, customer value is
affected by regulatory requirements that force the grower to plan his/her crop details.
Who is the customer?
Within the industry there is some confusion who the customer is. The grower is usually not
talking to the end-customer. The packer has growers as customers (who pay for the packing
and cool-storing service) but pack to exporter requirements (who may represent the end-
customer if known). The exporter delivers a sales and logistics documentation service to the
grower but claims commission on the sale price received from the customer. Identification of
customer and therefore customer value is problematic.
Just-in-time
Coolstores store raw product as inventory when it arrives. Packhouses order stock-to-pack
‘just-in-time’ for packing from coolstores, bearing in mind that huge stocks are built up
through the harvesting period where packing does not keep up with harvest (Figure 6-9). In
figure 6-9, the blue line depicts harvested fruit entering cool-storage, the red line depicts fruit
volume packed and the green line depicts product shipped. Exporters monitor packed stock
that is ready for shipping and focus on getting product from coolstore into market as and
when required by customers (programmes) or by market buoyancy (consignment product).
Growing to size and colour
Growers have learned to manipulate the size curve of fruit grown to average certain sizes by
reducing the crop load more or less. A lower crop load produces larger fruit. Similarly, growers
have learned to increase the colour profile of their fruit by using reflective cloth. Provided
exporters communicate the customer requirements at the right time, growers can adjust the

Page 313 of 372
size and colour profile of their product. Growers start the growing process in June or July
when they start pruning.
Mistake/error proofing
In orchards there are a number of application options; numbering of rows, storing herbicides
away from insecticides so they cannot be accidently interchanged; some organisations have
the spray operator mark the last row and tree sprayed before re-filling the spray tank.
Generally the industry adopts the ‘common sense’ approach which is not necessarily best
practice (Ohno, 2013).
In packhouses/coolstores there are a number of application options; visual management,
numbering of lanes, scanning bin-cards before packing to ensure the correct fruit is packed;
confirming spray certificate before packing for a market. There are a number of examples
where software warnings or blockers prevent errors. Error proofing is used spasmodically
with some very clever applications while on other occasions simple forms of error proofing
are not implemented, leading to obvious mistakes. An example is spray operators who do not
mark where their tank ran out of spray; after filling their tank they spray the same row again
or omit a row.
Walking the shop floor and continuous improvement
Orchard managers spend considerable time on the shop floor, as do packhouse and coolstore
managers. This is generally the case because the organisations are small to medium and
managers spend considerable time working in the business versus on the business. Although
the walking of the shop-floor does take place, the missing element is the focus on value
stream, flow and waste which is essentially not well understood. Managers focus on isolated
efficiencies rather than overall effectiveness.
Load-levelling and preventing overburdening
Orchards are historically planted in different varieties. These different varieties generally have
different maturity periods, leading to different harvest periods from early export varieties
Page 314 of 372
(harvested from early February) to late export varieties (harvested until early May). This
mixture of varieties not only creates variation for the customer, it also leads to a natural form
of load-levelling which is a Lean form of waste avoidance. The industry uses chemicals to bring
tree bloom forward or delay it. Effectively this brings the maturity of fruit and therefore the
harvest window forward or delays it. The motivation to bring the harvest forward is mostly
driven by marketing demands; exporters prefer to enter markets early in relation to the ir
competitors, demanding a premium in the market place. These financial motivators also lead
to a degree of load-levelling. Instead of harvesting a particular variety over a four week
period, it is now harvested over a five to six week period. Similarly, delaying the fruit maturity
spreads the load backwards. The load levelling factor means that the seasonal labour
requirement is spread differently and is presumably leading to less overburdening of the
system.
Quick change-over
Quick change-over is applicable to different activities. When harvesting, an important
criterion is the harvesting at the correct maturity level of the fruit. If fruit is harvested too
early, it is immature and will not taste right as not enough starches have converted to sugars.
If fruit is harvested too late, the fruit will be 'mature' or 'over mature', meaning that the fruit
will not have the life span it would otherwise have. A grower has to therefore harvest the
same tree several times, each time when there is sufficient mature fruit on the tree. This leads
to labour and equipment movements and therefore to potential waste. Most growers will
check their orchard blocks for maturity and then prepare to harvest that particular block a
first time, or a second time or even a third time. Most growers will send trucks with empty
bins to the block to be harvested. Forklifts unload the trucks and tractor drivers set up the
empty bins in rows to reduce wasted motion by pickers having to walk distances from
harvested trees to their bins (pickers generally fill up their own bin). This is commonly done
before the pickers arrive and the approach likens a quick change-over process. Pickers can
arrive on-site and start harvesting without delay.

Page 315 of 372
Managing natural resources versus assembling man-made components
Although most of the pruning, thinning and harvesting are manual activities, the actual
production of the fruit is a natural but managed process. Trees need soil with water and
nutrients to grow in; they need sunlight and oxygen, day and night, the right temperatures
and rain to help the fruit grow. Most of these factors can be managed complementary to what
nature provides. These processes can be, but are generally not, seen from a Lean perspective.
Examples include the management of soil nutrients by examining soil samples and adding
necessary nutrients. This prevents wasting of growth and tree health opportunities. Water can
be managed by draining water if the water level in the soil is too high, or adding water if the
water level in the soil is too low. A water level that is too high reduces growth which is leads
to a loss of production which is an orchard waste. A water level that is too low has a similar
effect. Drainage and irrigation is generally well understood by the industry. Fruit needs
sunlight to get colour, often a customer requirement. As the sun does not reach the underside
of fruit, orchardists have started using reflective cloth to reflect sunlight onto the underside of
the apple. Customers require fruit of certain sizes. The orchardist can substantially achieve a
specific average size (note that the size distribution will always follow a standard distribution
or bell curve) by determining the number of fruit on a tree. More fruit on a tree leads to
smaller fruit; less fruit leads to larger fruit. If the grower knows what the exporter intends to
sell, he can grow more accurately to size demand.
Observations of levels of applicability of Lean
Having observed the industry over the years, it is this practitioner’s view that most Lean
principles, methods and tools are applicable to most areas within the industry. Some however
are not. It is obvious that the ‘just-in-time’ (JIT) principle cannot be maintained for fruit
production because the production is driven by nature. The principle of pulling just-in-time
can however be applied to a number of facets of the businesses involved. The seasonality of
the industry also affects even flow as harvest is driven by nature and shipping is driven by
northern and southern hemisphere market opportunities (the southern hemisphere exports
to the northern hemisphere during a period in which fruit cannot be produced). These aspects
of Lean are not equally applicable but still find some applications.

Page 316 of 372
Observations of waste
Over the years there have been numerous instances of ‘un-Lean’ activities that are worth
mentioning. A worker in one organisation started tracking repacking or reworking for a single
season. The spreadsheet was huge, and demonstrated an enormous direct cost of repacking.
These were caused by the packhouse having to meet volume targets and consequently
packing to a lower standard than they should do. The packhouse manager was adamant that
the grower paid the packhouse bill and therefore was the packhouse customer; in order to
provide good service to the grower customer, the packhouse tried to get as much fruit as
possible in the export carton. The packhouse saw the customer as the end of the value chain.
There was little consideration within the industry that the product had to be sold to a
customer who would also pay the grower, who could only then pay the packhouse. The
industry packhouses compared average ‘pack-outs’ (the percentage of submitted fruit that
was packed for export) and growers tended for some considerable time to select packhouses
with the highest average pack-out as a selection criterion. The fact that their fruit would be
harder to sell or sell at a lower value was often not reflected on. Most packhouses calculate
the direct costs involved in packing and base their pricing on that cost. The system is self-
defeating in that the grower would receive a lower return from market for a higher packed
percentage of his fruit, while the packhouse/coolstore incurred more indirect costs as a
consequence of not doing it right first time. Recognition of the product customer was
confused with recognition of the packing service customer. The two customers’ requirements
were not aligned.
For years, the orchardist would grow his fruit and try to grow blemish free fruit, only knowing
that blemishes would see the fruit removed from the export pool. Growers were relatively
unaware what the customer wanted, and did not grow fruit specifically for a customer. In fact,
the industry for a number of years adopted the approach that all frui t was grown for all
markets, i.e. all customers. The fruit grown was not very well coordinated with the exporter
and the number of growers that changed exporters since deregulation, often more than once,
meant that it was a challenge for exporters to coordinate stable supply.
Another typical orchard waste feature is the use of land. Existing orchards were set up
following the times and it is not uncommon to have an orchard where multiple varieties are
planted, sometimes only two rows of trees. These 'fruit salad' orchards lead to wasteful
activities such as having to spray only two rows, having to thin only two rows or having to

Page 317 of 372
harvest only two rows. The grower does not easily decide to replace trees because under the
current growing strategies, it may take seven years for a tree to reach full production. There
are always trees that do not grow well or die, and these are not always replaced with healthy
trees because it takes so long to get to the point of full production. These delays of course
mean that the 'shop floor' is not always used effectively which does not fit the Lean paradigm.
In addition, the poka yoke philosophy leads to resolving the root cause of a problem affecting
production; leaving the tree with low production without solving the problem (replacing the
tree) is not in line with the Lean philosophy.
5. Regulatory access to countries: A waste, necessary or not?
In order to export pipfruit, the product must gain regulatory access to countries. This means
that the grower needs to control pests and diseases and adhere to a number of regulatory
requirements. International phytosanitary rules are determined by the International Plant
Protection Convention (IPPC) of which New Zealand is an assignee. Under the IPPC, each
country has to appoint a National Plant Protection Organisation (NPPO) which is responsible
for ensuring that exports comply with importing countries’ phytosanitary rules. MPI is the NZ
NPPO and has created a system of regulatory standards and programmes that organisations
have to comply with in order to grow, pack, store and export product.
The grower, packhouse, coolstore and exporter also must comply with other regulatory
market access rules and regulations. In broad terms, regulatory market access is divided in
several areas:
1. Phytosanitary requirements mean that perfect fruit may not get to the customer
because certain pests are found in the fruit. Not being able to enter a country for
whose customers the fruit was grown is essentially a waste. The fruit must be diverted
to a country for whose customers the fruit was not grown and therefore there is
waste in the process.
2. Environmental requirements by countries mean that some countries (e.g. Europe) are
highly sensitive to the chemicals used to keep fruit blemish and insect free. The
paradox is that more chemicals are required to suppress pest populations which then
reduces market access through the residues found on fruit as a result of the use of
those chemicals. This is a form of waste.

Page 318 of 372
3. Other regulatory requirements concern for instance the labelling of fruit cartons.
Several countries have introduced measures that require packhouses to label cartons
specifically for those countries. Once labelled, the fruit cannot be sent to other
countries unless the carton is reworked. The processes involved are precise and
laborious because this type of labelling is completed manually. Special labelling
creates waste in the process.
4. Tariff barriers are considered to affect monetary decision making only (i.e. not fruit
growing or packing) and are not further addressed in relation to market access.
Market access before product reaches the customer: A necessary waste?
Until several years ago, MPI would dictate standards and systems, allowing little input from
industry. This led to a number of imposed on-shore requirements that were impractical, at
times ineffective and costly, in addition to market restrictions that negatively affected returns.
Country 2
Country 1
The NZ apple must first
comply with export
regulations before
leaving the country
Customer 1
Customer 2
Customer 3
Customer 4
Phyto-sanitary and other regulatory market access conditions must be met before entering the country and reaching the customer, creating necessary and un-necessary waste

Page 319 of 372
An example that is generally accepted as such is the protocol to get access to the Austral ian
market. Industry stakeholders have expressed the view that the protocol is unrealistic, and
that it demands a number of steps that do not contribute to Phytosanitary security. In recent
years, the dialogue between MPI and the industry has improved, allowing better industry
input in the design of MPI standards and programmes and thus reducing the waste caused by
these.
Generally, customers have some concern about food safety although the quality of food is
seen to have improved. Röhr et al (2005) differentiate between price-sensitive customers (for
who these requirements represent waste) and safety-sensitive customers (for who these
requirements are part of the value), indicating that there is some willingness to pay for food
safety through other regulatory requirements.
In general, the regulatory market access requirements are considered a necessary waste
where they have minimum impact and an unnecessary waste where they require wasteful
activity when the importing countries’ objectives can be achieved in a less-wasteful manner.
6. The industry supply chain or value stream
The industry as a whole appears to have limited understanding of the supply chain, less
understanding of the value chain and marginal understanding of Lean and value streams. The
supply chain is still often referred to as the logistical chain—not as the upstream and
downstream suppliers and customers to which the business should be tuned. This is stated
despite the fact that a number of individuals understand the supply chain and the importance
of the customer very well and are experts in the logistical side of operations. The
understanding of supply and value chain and value stream appears to have been both
hindered and helped by deregulation. In the market and on-shore, there is still distinct
competitiveness between NZ based companies for market share. Since deregulation there has
been slow growth of institutionalised trust and exporters still largely drive a distinct concern
for market share in favour of industry good approaches. The waste caused by market
requirements and lost market opportunities, the waste caused by internal competition and all
the grower and packhouse actions involved in these has gone largely unmeasured.

Page 320 of 372
7. Validity of this summary and position
This review has been presented to selected industry representatives for each industry activity
to ensure that the researcher’s views as practitioner are trustworthy and valid. Industry
representative stakeholders’ responses confirmed the practitioner reflective review as an
accurate reflection on the industry.
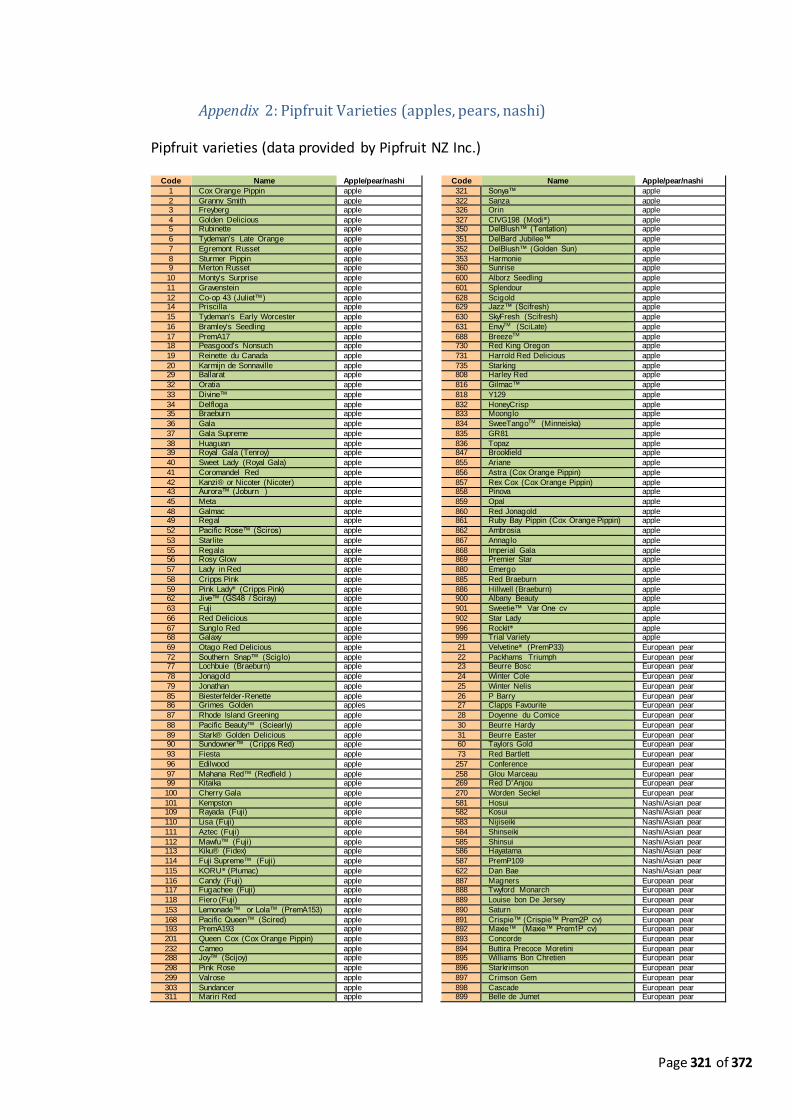
Page 321 of 372
Appendix 2: Pipfruit Varieties (apples, pears, nashi)
Pipfruit varieties (data provided by Pipfruit NZ Inc.)
Code Name Apple/pear/nashi
Code Name Apple/pear/nashi
1 Cox Orange Pippin apple
321 Sonya™ apple
2 Granny Smith apple
322 Sanza apple 3 Freyberg apple
326 Orin apple
4 Golden Delicious apple
327 CIVG198 (Modi®) apple 5 Rubinette apple
350 DelBlush™ (Tentation) apple
6 Tydeman's Late Orange apple
351 DelBard Jubilee™ apple
7 Egremont Russet apple
352 DelBlush™ (Golden Sun) apple
8 Sturmer Pippin apple
353 Harmonie apple 9 Merton Russet apple
360 Sunrise apple
10 Monty's Surprise apple
600 Alborz Seedling apple
11 Gravenstein apple
601 Splendour apple
12 Co-op 43 (Juliet™) apple
628 Scigold apple 14 Priscilla apple
629 Jazz™ (Scifresh) apple
15 Tydeman's Early Worcester apple
630 SkyFresh (Scifresh) apple
16 Bramley's Seedling apple
631 EnvyTM (SciLate) apple
17 PremA17 apple
688 BreezeTM apple 18 Peasgood's Nonsuch apple
730 Red King Oregon apple
19 Reinette du Canada apple
731 Harrold Red Delicious apple
20 Karmijn de Sonnaville apple
735 Starking apple 29 Ballarat apple
808 Harley Red apple
32 Oratia apple
816 Gilmac™ apple
33 Divine™ apple
818 Y129 apple
34 Delfloga apple
832 HoneyCrisp apple 35 Braeburn apple
833 Moonglo apple
36 Gala apple
834 SweeTangoTM (Minneiska) apple
37 Gala Supreme apple
835 GR81 apple
38 Huaguan apple
836 Topaz apple 39 Royal Gala (Tenroy) apple
847 Brookfield apple
40 Sweet Lady (Royal Gala) apple
855 Ariane apple
41 Coromandel Red apple
856 Astra (Cox Orange Pippin) apple
42 Kanzi® or Nicoter (Nicoter) apple
857 Rex Cox (Cox Orange Pippin) apple 43 Aurora™ (Joburn ) apple
858 Pinova apple
45 Meta apple
859 Opal apple
48 Galmac apple
860 Red Jonagold apple 49 Regal apple
861 Ruby Bay Pippin (Cox Orange Pippin) apple
52 Pacific Rose™ (Sciros) apple
862 Ambrosia apple
53 Starlite apple
867 Annaglo apple
55 Regala apple
868 Imperial Gala apple 56 Rosy Glow apple
869 Premier Star apple
57 Lady in Red apple
880 Emergo apple
58 Cripps Pink apple
885 Red Braeburn apple
59 Pink Lady® (Cripps Pink) apple
886 Hillwell (Braeburn) apple 62 Jive™ (GS48 / Sciray) apple
900 Albany Beauty apple
63 Fuji apple
901 Sweetie™ Var One cv apple
66 Red Delicious apple
902 Star Lady apple
67 Sunglo Red apple
996 Rockit® apple 68 Galaxy apple
999 Trial Variety apple
69 Otago Red Delicious apple
21 Velvetine® (PremP33) European pear
72 Southern Snap™ (Sciglo) apple
22 Packhams Triumph European pear 77 Lochbuie (Braeburn) apple
23 Beurre Bosc European pear
78 Jonagold apple
24 Winter Cole European pear
79 Jonathan apple
25 Winter Nelis European pear
85 Biesterfelder-Renette apple
26 P Barry European pear 86 Grimes Golden apples
27 Clapps Favourite European pear
87 Rhode Island Greening apple
28 Doyenne du Comice European pear
88 Pacific Beauty™ (Sciearly) apple
30 Beurre Hardy European pear
89 Stark® Golden Delicious apple
31 Beurre Easter European pear 90 Sundowner™ (Cripps Red) apple
60 Taylors Gold European pear
93 Fiesta apple
73 Red Bartlett European pear
96 Edilwood apple
257 Conference European pear
97 Mahana Red™ (Redfield ) apple
258 Glou Marceau European pear 99 Kitaika apple
269 Red D'Anjou European pear
100 Cherry Gala apple
270 Worden Seckel European pear
101 Kempston apple
581 Hosui Nashi/Asian pear 109 Rayada (Fuji) apple
582 Kosui Nashi/Asian pear
110 Lisa (Fuji) apple
583 Nijiseiki Nashi/Asian pear
111 Aztec (Fuji) apple
584 Shinseiki Nashi/Asian pear
112 Mawfu™ (Fuji) apple
585 Shinsui Nashi/Asian pear 113 Kiku® (Fidex) apple
586 Hayatama Nashi/Asian pear
114 Fuji Supreme™ (Fuji) apple
587 PremP109 Nashi/Asian pear
115 KORU® (Plumac) apple
622 Dan Bae Nashi/Asian pear
116 Candy (Fuji) apple
887 Magners European pear 117 Fugachee (Fuji) apple
888 Twyford Monarch European pear
118 Fiero (Fuji) apple
889 Louise bon De Jersey European pear
153 Lemonade™ or Lola™ (PremA153) apple
890 Saturn European pear
168 Pacific Queen™ (Scired) apple
891 Crispie™ (Crispie™ Prem2P cv) European pear 193 PremA193 apple
892 Maxie™ (Maxie™ Prem1P cv) European pear
201 Queen Cox (Cox Orange Pippin) apple
893 Concorde European pear
232 Cameo apple
894 Buttira Precoce Moretini European pear 288 Joy™ (Scijoy) apple
895 Williams Bon Chretien European pear
298 Pink Rose apple
896 Starkrimson European pear
299 Valrose apple
897 Crimson Gem European pear
303 Sundancer apple
898 Cascade European pear 311 Mariri Red apple
899 Belle de Jumet European pear

Page 322 of 372
Appendix 3: Export variety -by size -by country example
Example of export variety by size and by export country
Example of a variety, exported to specific countries in percentages of total export volume of that variety (anecdotal data)
Variety and Size Country
Variety SizeDesc Europe India USA
Hong
Kong Thailand UAE Taiwan UK Singapore China Bangladesh Malaysia Indonesia Total
Royal Gala Size 060 0% 0% 0% 0% 0% 0% 0% 0% 0% 0% 0% 0% 0% 0%
Size 070 0% 0% 0% 0% 0% 0% 0% 0% 0% 0% 0% 0% 0% 0%
Size 080 0% 0% 2% 0% 0% 0% 0% 0% 0% 0% 0% 0% 0% 3%
Size 090 0% 0% 6% 0% 0% 0% 0% 0% 0% 0% 0% 0% 0% 7%
Size 100 11% 3% 1% 0% 0% 1% 0% 0% 0% 0% 0% 0% 0% 16%
Size 110 11% 4% 0% 0% 0% 1% 0% 0% 0% 0% 0% 0% 0% 16%
Size 120 6% 7% 0% 0% 3% 1% 2% 0% 0% 0% 0% 0% 1% 21%
Size 135 0% 8% 1% 6% 1% 1% 0% 0% 1% 0% 0% 0% 0% 19%
Size 150 0% 2% 0% 5% 0% 3% 0% 0% 0% 0% 0% 0% 0% 10%
Size 165 0% 0% 0% 0% 3% 1% 0% 0% 0% 0% 1% 0% 0% 4%
Size 180 0% 0% 0% 0% 1% 0% 0% 0% 0% 0% 0% 0% 0% 2%
Size 198 0% 0% 0% 0% 1% 0% 0% 0% 0% 0% 0% 0% 0% 1%
Size 216 0% 0% 0% 0% 0% 0% 0% 0% 0% 0% 0% 0% 0% 0%
Royal Gala Total 28% 23% 11% 11% 9% 8% 3% 1% 1% 1% 1% 1% 1% 99%

Page 323 of 372
Appendix 4: 20 Kobayashi keys in relationship diagram (from Kobayashi,
1995)
20 Kobayashi keys in a relationship diagram (from Kobayashi, 1995)

Page 324 of 372
Appendix 5: Lean Consultants
List of lean known consultants in New Zealand
Lean Consultants
1. 5 Wise – Wanganui
2. Business Flow - Auckland
3. Continuous Business Improvement Ltd - Auckland
4. CTPM - Auckland
5. DA Business Solutions - Christchurch
6. Free Flow Partners – Tauranga
7. Go Solutions - Hastings
8. Improve Group – Auckland/Christchurch
9. Improvement Direct - Hamilton
10. INTENT Group Limited – Auckland, Wellington & Christchurch.
11. Kaizen Institute - Auckland
12. KM&T - Auckland
13. Lean Production Consulting – Palmerston North
14. LMAC – Christchurch/Wellington/Auckland
15. Peter Ramsden – Wanganui
16. Productivity Solutions Limited – Auckland
17. QCD Systems Inc - Auckland
18. Ross Newman Enterprise Training Consultant - Nelson
19. Simply Lean Business Solutions – Auckland/Blenheim/Christchurch
20. Skills4Work - Auckland
21. SNRG Solutions – Auckland
22. Spirals Resultants - Auckland
23. Step Change Associates – Palmerston North
24. Strategia - Wellington
25. Thornley Group - Auckland
26. Viago – Auckland/Hamilton/Christchurch

Page 325 of 372
Appendix 6: Announcement of Lean industry study and request for
volunteers

Page 326 of 372
Appendix 7: Pipfruit industry stakeholder questionnaire
Pipfruit ‘Lean’ questionnaire
Thank you for participating in this study. The study aims to better understand how ‘lean
production’ or ‘lean thinking’ can be made useful for the pipfruit industry. Outcomes of this
study are for the benefit of the pipfruit industry. Once sufficient questionnaires have been
returned, all participants will receive the mean answers to the questions by email. This may
help you understand the ‘lean thinking’ within the pipfruit industry as it stands. Your name
and the name of your organisation will be kept confidential.
This questionnaire consists of two sections:
1. Organisation contact details and information
2. General ‘lean’ statements
There are no correct or incorrect answers.
The information provided by you will be kept confidential and your organisation will not be recognisable in this study.
Part 1: Organisation contact details and information
Survey Questionnaire:
Organisation name:
Contact Person:
Person completing this questionnaire:
Please tick appropriate boxes: This organisation is: Growing Other:
Packing
Cool-storing
Exporting/Trading
Pipfruit Turnover per year (Bins, TCEs, or Tonnes)
Phone:
Email:
(*) This information will be treated as confidential.

Page 327 of 372
Part 2: ‘Lean thinking’
This table contains a number of random statements or questions with which you may agree or disagree moderately or
s trongly, or may indicate how you score your organisation. Please tick the box that best suits your view. Yo u can use
any letter or number in the MS-Word version. There are no incorrect answers. There is room for comments at the end
of each section.
Statement Strongly disagree
Moderately
Disagree
Agree nor
disagree
Moderately Agree
Strongly agree
‘Lean thinking’
1. Our company would l ike to learn how useful ‘lean production’ or ‘lean thinking’ can be for
the future.
Absolutely not
Probably not
Not sure i f we do
or don’t
Probably Definitely
2. On a sca le of 1 to 5 where 1 means no
knowledge and 5 means extensive knowledge of lean, where do you bel ieve your company is
pos i tioned?
1 2 3 4 5
3. If an organisation wants to introduce a new and fundamental management philosophy (where it does not matter what the phi losophy is ), i t i s sa id that the organisation needs a champion or a team of champions to achieve that change. In
your organisation, who would be the champion?
I don’t know
I would be the
champion
I would be part of the
champion team
My boss or the
bus iness owner
would be
the champio
n
A consultant would be the
champio
n
4. In order to achieve a fundamental management phi losophy change in our company, the most
effective persuas ion would be:
I don’t know
A sol id theory or
model that i s widely used in
other
industries
A recommendation
by Pipfrui t
NZ
Hearing facts
about organisations that
have tried the
management
philosoph
y change and have
documented
proven
benefi ts
Co-funding
of consultan
ts by NZTE
5. The last time that our organisation deliberately
cons idered a fundamental change in management phi losophy (paradigm) was :
I don’t
know
Never
happened
More
than 3 years ago
In the
last few years
This year
6. My personal influence on managerial paradigm
shi fts (changing fundamental management di rection) i s best described as fol lows:
No
influence at a l l
Some
influence but less than 50%
More
than 50% but less than 80%
More
than 80% but not
100%
I am the
decis ion maker
7. The questions I have answered and am answering next, I did (and will) answer from the
perspective of:
A
Grower
A
Packer/C
ools tore
A
Trader/E
xporter
A
vertica lly
integrate
d
operation
(please
indicate
activi ties)
Other
(Please
speci fy,
e.g.
'Transpor
t
Operator'
, or
'Chemical

Page 328 of 372
Supplier')
8. On a sca le of 1 to 5 where 1 means no knowledge and 5 means extensive knowledge of
lean, where do you bel i eve your company is pos itioned after reading all the statements and
questions of this survey?
1 2 3 4 5
9. As a result of this survey, my interest in fol lowing the developments in terms of ‘Lean’
and i ts usefulness for the pipfrui t industry i s best descri bed as fol lows:
Not intereste
d at a l l to fol low develop
ments
Marginally
interested to
fol low
developments
Moderately
interested to
fol low
developments
Quite intereste
d to fol low
develop
ments
100% intereste
d to fol low
develop
ments
10. As a result of the questions of this survey: We have not
changed our
thinking
at a l l about
the way we run
the organisat
ion.
We are not sure where to
head next;
should we learn
more about
‘lean’ or not in
order to run the
organisation
We bel ieve that we
wi ll make some
minor changes or have made a
few minor
changes to the
way we run the
organisat
ion
We wi l l make
changes or have made
changes to the
way we run the
organisation
We have changed
our thinking substanti
a l ly about
the way we run
the organisation and
have
made or wi l l make changes
accordingly.
‘20 Kobayashi Keys’
On a sca le of 1 to 5, where 1. means ‘No, not at a ll ’ and 5. means ‘Yes , a lways 100%’, indicate where your company is pos i tioned at up to today.
11. In our company, everything has its place; there are no unneeded i tems lying around. Everything i s labelled. Signs indicate where tools go. Notice boards are always up-to-date. Stock levels are
marked as in supermarkets .
1. No, not at a l l
2. We do this sometim
es or do some of this
3. We are truly ha l fwa
y organised as in the
s tatement
above
4. We
usually do this
or we do most of this
5. Yes , a lways
100%
12. In our company, everybody knows their exact
responsibility. Meetings between management, supervisors and workers clarify policy, goals and targets. 100% of goals are achieved each year.
People assist each other across the company to achieve goals . Motivation is high. Every
employee understands the company vis ion, medium (5 year) and long term (10 year) plan
thoroughly.
1.
No, not at a l l
2.
Sometimes we do some of
this
3.
We are truly ha l fwa
y organis
ed as in the
s tatem
ent above
4.
Usually we do most of
this
5.
Yes , a lways 100%
13. In our company, a ll work involves smal l teams that meet da i ly to discuss performance,
problems, solutions and set targets and a l ign
goals . Staff not only do their work but make extra va lue-adding contributions. We use visual
1. No, not at a l l
2. Sometimes we do
some of this
3. We are truly
ha l fway
4. Usually we do
most of this
5. Yes , a lways
100%
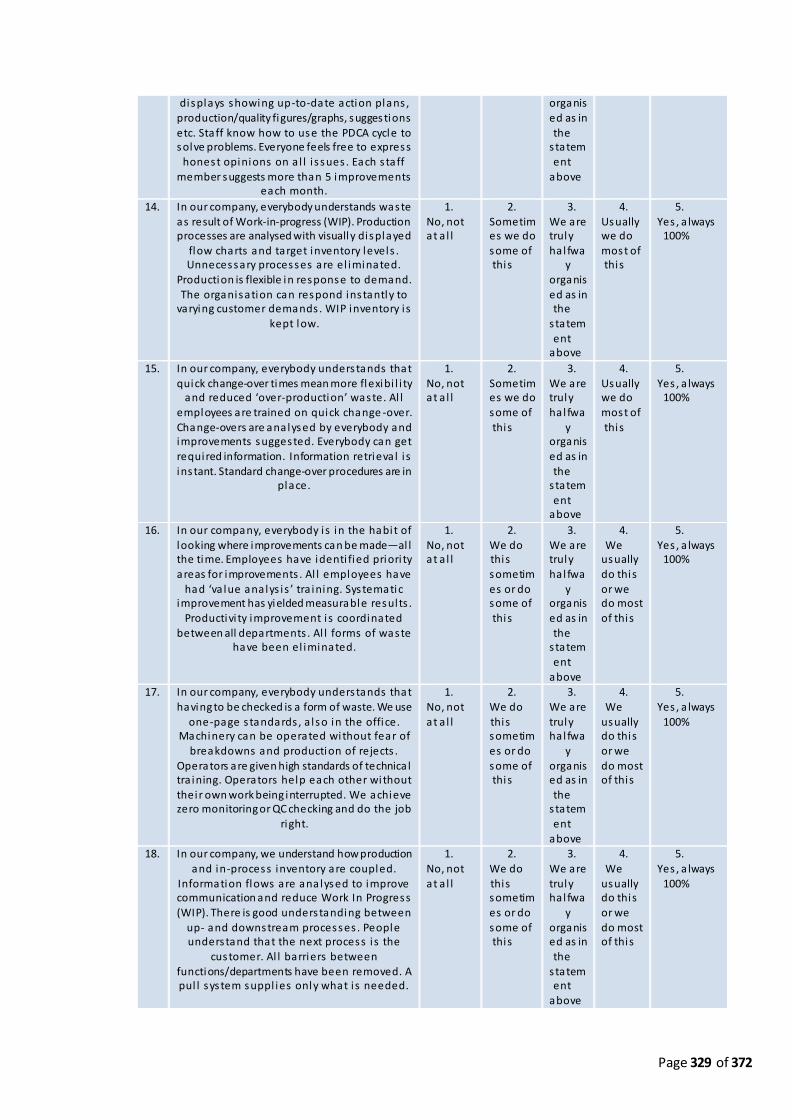
Page 329 of 372
displays showing up-to-date action plans , production/quality figures/graphs, suggestions
etc. Staff know how to use the PDCA cycle to solve problems. Everyone feels free to express
honest opinions on a l l i s sues . Each s taff
member suggests more than 5 improvements each month.
organised as in
the s tatement
above
14. In our company, everybody understands waste as result of Work-in-progress (WIP). Production processes are analysed with visually displayed
flow charts and target inventory levels . Unnecessary processes are el iminated.
Production is flexible in response to demand. The organisation can respond instantly to
varying customer demands . WIP inventory i s
kept low.
1. No, not at a l l
2. Sometimes we do
some of this
3. We are truly
ha l fway
organised as in the
s tatement
above
4. Usually we do
most of this
5. Yes , a lways
100%
15. In our company, everybody understands that quick change-over times mean more flexibi l i ty
and reduced ‘over-production’ waste. Al l employees are trained on quick change -over.
Change-overs are analysed by everybody and improvements suggested. Everybody can get required information. Information retrieva l i s
instant. Standard change-over procedures are in place.
1. No, not at a l l
2. Sometimes we do some of
this
3. We are truly ha l fwa
y organised as in
the s tatem
ent above
4. Usually we do most of
this
5. Yes , a lways
100%
16. In our company, everybody is in the habit of
looking where improvements can be made—al l the time. Employees have identi fied priori ty
areas for improvements . Al l employees have had ‘va lue analys is ’ tra ining. Systematic
improvement has yielded measurable results .
Productivi ty improvement i s coordinated between all departments . Al l forms of waste
have been el iminated.
1.
No, not at a l l
2.
We do this
sometimes or do some of
this
3.
We are truly
ha l fway
organis
ed as in the
s tatement
above
4.
We usually
do this or we do most
of this
5.
Yes , a lways 100%
17. In our company, everybody understands that having to be checked is a form of waste. We use
one-page s tandards , a lso in the office. Machinery can be operated without fear of
breakdowns and production of rejects .
Operators are given high standards of technica l tra ining. Operators help each other without
their own work being interrupted. We achieve zero monitoring or QC checking and do the job
right.
1. No, not
at a l l
2. We do
this sometimes or do
some of this
3. We are
truly ha l fwa
y
organised as in
the s tatement
above
4. We
usually do this or we
do most of this
5. Yes , a lways
100%
18. In our company, we understand how production
and in-process inventory are coupled. Information flows are analysed to improve communication and reduce Work In Progress
(WIP). There is good understanding between up- and downstream processes . People understand that the next process i s the
customer. Al l barriers between functions/departments have been removed. A pul l system suppl ies only what i s needed.
1.
No, not at a l l
2.
We do this sometim
es or do some of this
3.
We are truly ha l fwa
y organised as in the
s tatement
above
4.
We usually do this
or we do most of this
5.
Yes , a lways 100%

Page 330 of 372
19. In our company, floor s taff understand the need for preventative maintenance. A s ign on each machine tells who is respons ible for i t. Each machine has an up-to-date maintenance log. Consumables, lubricants, spare parts and tools are kept close i n a clearly marked location.
Equipment deterioration is recorded.
Inspections and maintenance are routine and operators use spare time to clean and touch up machines . Most operators are proficient at
improvement maintenance.
1. No, not at a l l
2. We do this sometimes or do some of this
3. We are truly ha l fwa
y organised as in
the s tatement
above
4. We
usually do this or we do most of this
5. Yes , a lways
100%
20. Al l our staff are clear about punctual i ty; shi fts
s tart on time with a safety and production briefing. Nobody smokes. Uniforms are a lways
tidy; people are friendly and energetic.
Everyone returns tools . Desktops are a lways tidy. There is no litter and i f there i s , anybody
wi l l pick i t up and discard properly. Morning briefings are brief and effective. The next day i s organised before people leave. Meetings are
focussed. Employees perform va lue -adding work whenever they can. Work has a s teady
rhythm and is not hectic.
1.
No, not at a l l
2.
We do this sometim
es or do some of
this
3.
We are truly ha l fwa
y organis
ed as in the
s tatem
ent above
4.
We usually do this
or we do most
of this
5.
Yes , a lways 100%
21. In our company, everybody treats the next process as the next customer. Qual i ty i s bui l t into a l l processes . Staff use the 7 QC tools . Operational standards are visual ly displayed,
are clear and include key points . A defect feedback system informs the defect source for corrective measures. The Poka Yoke concept i s wel l understood and implemented throughout the organisation. Compla ints , errors and the
amount of rework between processes i s reduced s igni ficantly and close to zero.
1. No, not at a l l
2. We do this sometim
es or do some of this
3. We are truly ha l fwa
y organised as in the
s tatem
ent above
4. We
usually do this
or we do most of this
5. Yes , a lways
100%
22. Our company and our suppliers understand that
they are extensions of each other. Both parties accept respons ibi l i ty for poor qual i ty. Va lue
Analysis (VA) and Value Engineering (VE) s tudy groups have been formed with suppl iers .
Defects and delays from a l l key suppl iers are
continuous ly reduced as a result. We have ini tiated a best practice development program with suppliers. We audit suppl iers annual ly.
1.
No, not at a l l
2.
We do this
sometimes or do some of
this
3.
We are truly
ha l fway
organis
ed as in the
s tatement
above
4.
We usually
do this or we do most
of this
5.
Yes , a lways 100%
23. In our company, everybody understands that reducing waste makes work easier. Everybody is motivated to reduce all forms of waste and do only va lue-adding work. Every aspect of the job i s regularly re-examined to do so. Employees
accept chal lenges rather than negatively cri tici se innovation. There i s good-natured
competi tion between s taff to find waste elements and el iminate these. Waste
el iminating ideas are shared. Employees ’ jobs
are easier and more meaningful , resulting in high morale.
1. No, not at a l l
2. We do this sometimes or do some of this
3. We are truly ha l fwa
y organised as in
the s tatement
above
4. We
usually do this or we do most of this
5. Yes , a lways
100%
24. In our company, employees who have improvement proposals are a l lowed to
implement these themselves as that i s most
effective. There i s mutual agreement that everyone can improve by finding time to
improve during work-time. We have created
1. No, not at a l l
2. We do this
sometimes or do some of
3. We are truly
ha l fway
organis
4. We
usually
do this or we do most
5. Yes , a lways
100%

Page 331 of 372
‘Improvement stations’ where employees can bui ld shelves, platforms and other s imple i tems
to improve processes. Employees feel s trongly empowered to make improvements. Employees are provided with the latest technologica l
education so they can make equipment improvements when they deem i t appropriate.
this ed as in the
s tatement
above
of this
25. In our company, both management and s taff want to develop skill versatility. Employees do not prevent others from learning the skills they
have; they encourage others to learn what they know. Employees understand that cross-training
makes them more va luable - not less valuable. A ski l l versati l i ty matrix i s displayed in every workplace and supervisors create time for
cross -training during shifts. Standard operating procedures are on display and make cross -
tra ining easy. Our company can freely re -dis tribute people and adapt to all changes in the market place without holding ski l l inventory.
1. No, not at a l l
2. We do this
sometimes or do
some of this
3. We are truly
ha l fway
organised as in the
s tatement
above
4. We
usually
do this or we
do most of this
5. Yes , a lways
100%
26. Production priori ties are never re -arranged; operators always know what to do. Today’s and
tomorrow’s work i s clearly displayed. Raw materials and inventory required for production are a lways delivered to coupling points on time.
Process lead times are accurate. Bottlenecks are taken into account when schedul ing. Each
product has a documented process flow-chart. Work i s tracked effectively through the system.
Schedulers are ful ly aware of production
capabi l i ty. Machine breakdowns have been el iminated. Fluctuations in work load have been
el iminated by smoothing of work-load and cross -tra ining of employees .
1. No, not
at a l l
2. We do
this sometimes or do
some of this
3. We are
truly ha l fwa
y
organised as in
the s tatement
above
4. We
usually do this or we
do most of this
5. Yes , a lways
100%
27. In our company, we maintain daily work reports
for operators, daily and periodical (e.g. weekly) efficiency charts, and display these visual ly so that efficiency drops can be identi fied and addressed by a ll. Employees feel that managers and supervisors understand and appreciate the effort they put into work. Difficulty indices and s tandard times are reviewed periodica l ly.
Everyone is interested in efficiency trends and is motivated and confident about reaching
efficiency goa ls .
1.
No, not at a l l
2.
We do this sometimes or do some of this
3.
We are truly ha l fwa
y organised as in the
s tatement
above
4.
We usually do this or we do most of this
5.
Yes , a lways 100%
28. Office and work automation has been introduced with backup systems allowing quick
retrieval of data and information. Employees are interested in automation because they understand the benefi ts . There i s ful l sca le
implementation of seamless ly integrated bus iness and production systems. Data and
information are readily and easily ava i lable to a l l users without dupl ication. There i s an information systems s trategy and i t i s an
integral part of the business strategy. Real time data i s captured at the point of origin and information is ava i lable to a l l users at a l l
s tations in rea l -time.
1. No, not
at a l l
2. We do
this sometimes or do
some of this
3. We are
truly ha l fwa
y
organised as in
the s tatement
above
4. We
usually do this or we
do most of this
5. Yes , a lways
100%
29. In our company, the importance of conservation i s quantified by showing energy and materia l
costs as percentage of tota l costs to a l l
employees. Awareness and tra ining programs
1. No, not at a l l
2. We do this
sometim
3. We are truly
ha l fwa
4. We
usually
do this
5. Yes , a lways
100%

Page 332 of 372
take place and a l l workers are aware of the need to conserve materia ls and energy. We
have a company-wide conservation s trategy. Wel l planned and substantiated equipment
modification plans are implemented
organisation-wide. Improvements in conservation us ing technology have been
exhausted and new technologies are being developed.
es or do some of
this
y organis
ed as in the
s tatem
ent above
or we do most
of this
30. In our company, a radar chart for required s i te
technologies has been completed. Our company’s level of s i te technology i s world
class. A s ignificant percentage of employees are rated as world-class. Benchmarking to compare
technology and performance has been
completed. There i s a skill certification system by vocation in place. We are one s tep ahead of
the normal world industry. We are more advanced than other companies in our industry
in the development of fundamental technologies .
1.
No, not at a l l
2.
We do this
sometimes or do some of
this
3.
We are truly
ha l fway
organis
ed as in the
s tatement
above
4.
We usually
do this or we do most
of this
5.
Yes , a lways 100%
Part 3: Current use of Lean Tools and Methods
Do you use: Don’t
know what i t
i s
Never
used
Use
sometimes
Use
regularly
Use a l l the
time
1. 5-S' 2. Va lue s tream mapping
3. Flow as one of five bas ic ‘lean’ elements
4. Kanban (materia l pul l )
5. Just-in-time 6. Continuous improvement (Ka izen)
7. Gemba (floor) walks
8. 7 wastes identi fication 9. Process maps (swimming lane maps)
10. Spaghetti diagram
11. TAKT time 12. ‘Pul l ’ as one of five bas ic ‘lean’ elements
13. Fishbone or Ishikawa diagram
14. Root cause analys is (5 why's )
15. Red tagging
16. Visual management
17. PDSA cycle 18. Jidoka (autonoma tion)
19. Poka Yoke (error proofing)
20. SMED or Quick Change -over
Additional Comments :

Page 333 of 372
Appendix 8: Consultant semi-structured interview guideline
Consultant semi-structured interview guideline Participant
This research project intends to find out how useful 'Lean' is (or is perceived to be) as a model for the NZ Pipfruit (apples, pears, nashi) industry and consequently the wider horticultural industry. The industries are 'push', seasonal (seasonal staff), and deal wi th
perishable products.
General and ethics a. Is the consultant prepared to provide info for a PhD study in Lean in the Pipfruit
industry?
b. Would you prefer to give the information anonymous ly, or
c. Would you be happy to be mentioned in the research report?
The business 1 What is your business' specialist area?
2 Does your business train, consult, coach, do all these or different? 3 Does your business assist companies with Lean? 4 Does your business assist companies with Lean in any primary industry company?
5 Can you give examples? (either names or industry sectors)
6 Does your business assist companies with Lean in any horticultural company? 7 Can you give examples? (either names or types of horticulture) Horticulture
8 Horticultural product is pushed into the market. How does that affect Lean implementation?
9 Horticultural industries have some 80% seasonal workers. How does that affect Lean implementation?
10 Horticultural products are l ive, perishable goods, i .e. l imited lifespan. How does that affect Lean implementation?
11 Horticultural products are commodities sold on consignment (NO known customer).
How does that affect Lean implementation? Who is the customer? Theory
12 Are you familiar with any academic work done in the horticultural area with Lean implementation? If so, can you provide some examples?
13 Are you familiar with any practical work done in the horticultural area with Lean implementation? If so, can you provide some examples?
Lean in NZ 14 In your estimate, what percentage of NZ companies is seriously Lean? (Dedicated to
become Lean and having made substantial inroads) 15 In your estimate, what percentage of NZ horticultural companies is seriously Lean?
(Dedicated to become Lean and having made substantial inroads) 16 What works better: philosophy or Tools/Techniques? 17 Could Lean add value to the NZ horticultural industries? Other models or consultants
18 Are there any other models that you would recommend to be used by horticultural
organisations rather than or in addition to Lean? 19 Do you know any other consultants that specialise in Lean that should be part of this
research? 20 Closing comments? Thank you

Page 334 of 372
Appendix 9: Protocol for case study with partial applicability to action research
Introduction
Case study requires strict protocols in order to provide robust research results (Yin, 2009).
This appendix discusses the protocol design used in the current inquiry.
The case study protocol follows a number of considerations. Yin (2009) emphasises the
importance of a preparation and protocol design before the actual data collection phase
starts. In case of multiple researchers, the protocol gives guidance to each researcher and will
result in reliable findings across researchers based on consistent research questions and aims.
In addition, and particularly in case of a single researcher as is the case in this inquiry, a
protocol ensures that the researcher stays ‘on track’ and firmly focuses on the research
objectives and the way in which his research will be analysed and reported (Yin, 2009). The
protocol for the case study phase of the research project provides guidance for the following:
5. Basic information
6. Data collection procedures
7. Proposed analysis and method
8. Proposed report structure
In helping to structure the case study, the case study protocol also provides helpful structure
for the action research component of this inquiry. Where parallels are observed between case
study and action research, the protocol will provide similar structure and stability to the
action research component of this inquiry.
Protocol Basic Information
The inquiry’s objectives are not bound to research methodology and the protocol relates to:
a. Case study and action research objectives
b. Theoretical framework

Page 335 of 372
Research questions and objectives
The research objectives intend to give direction; to avoid a study of everything related to the
subject organisations and Lean. The following research questions arise:
Phase 1 (Exploratory stakeholder survey and consultant survey and interviews):
1. Are organisations within the NZ pipfruit industry generally aware of Lean; are they
using Lean, and to what extend? (Purpose is to explore);
2. Do practical experts such as Lean consultants believe that Lean can be expected to
contribute to a more competitive position for the NZ pipfruit industry? (Purpose is
to explore).
Phase 2 (Case Study and Action Research):
3. Status Quo: Did organisations use the Lean paradigms at the time of the inquiry
start, or did they use any other paradigm (and which)? (Purpose is to explore)
4. Applicability (induction): How are Lean principles, methodologies or tools fitting a
seasonal horticultural industry such as the NZ pipfruit industry? (Purpose is theory
building)
a. Which principles, methodologies or tools work better or not-so-well within
each of the industry segments (i.e. growing, packing, cool-storing and
exporting) of the NZ pipfruit industry?
b. For each of these, why do or don’t they apply? (Practical aspects and theory
development (e.g. Voss et al, 2002))
5. Implementation (case studies and action research): How can Lean be
implemented in a seasonal horticultural industry such as the NZ pipfruit industry?
(Purpose is exploration and theory building).
a. How is implementation of Lean potentially affected by this ‘push’ industry
which produces perishable products?
b. How is implementation of Lean potentially affected by the strong seasonal
influences?
6. Pipfruit Lean Model (induction): Can a Lean model be created for each of the
three different segments within the industry? Conceptualise a model (Purpose is
theory building)

Page 336 of 372
A further question, logically derived from the above is:
1. Transferability: Are Lean pipfruit models likely to be transferable to the wider
seasonal horticultural industries? (Purpose is theory building)
Propositions
The research questions in combination with Lean theory and the industry history leads to the
following propositions:
1. Lean is not well-known, nor is it commonly used by the NZ pipfruit industry as a
paradigm (based on industry historical development including strong traditional
management views).
a. Heuristic, traditional or intuitive management philosophies are commonly
used within the industry.
2. Lean can be useful to improve the competitive position of organisations within the NZ
pipfruit industry (based on Lean theory that Lean is universally applicable).
3. A number of Lean philosophies, principles, methodologies or tools do not
automatically ‘fit’ a horticultural industry such as the NZ pipfruit industry (e.g. TAKT
time, or Pull).
4. The seasonality and product of the industry automatically affect Lean philosophies,
principles, methodologies or tools (based on the fact that uncontrollable elements -
such as weather- influence the product while seasonality causes uneven people
requirements).
5. The industry organisations have developed some Lean tools and methods organically
over the years (Based on the continuous traditional cost-reduction focus).
6. There is waste in the commodity process, caused by e.g. the fact that the buyer is
unknown (based on the fact that fruit volumes, packaging, timing, labelling-PLUs are
completed partly on experience or perceived trends, not on known customer
requirements).
Propositions can be split for orchard, packhouse/coolstore and exporter sections but also
combined where applicable to all.

Page 337 of 372
Theoretical framework:
Tests Approach Case Study Phase Construct Validity Use multiple sources of evidence Data Collection
Establish chain of evidence Data Collection Key informants have reviewed draft
statements and report sections Composition
Internal Validity Pattern matching Data analysis
Explanation building Data analysis Address rival explanations Data analysis
Use logic models Data analysis External Validity Use theory for single-case studies Research design
Use replication logic in multiple-case studies
Research design
Reliability Use case study protocol Data Collection
Develop case study database Data Collection Table
Data collection procedures:
Identification of research subjects
Use the following (case study) locations including managers/contact persons and informants.
Actual locations and manager names are not mentioned in order to safeguard the
identification of the organisations involved (Massey University Code of Ethical Conduct for
research, teaching and evaluations involving human participants, retrieved 2012, p10).
Sample by research method:
Phase 1: Survey/Interview Case Study Action Research
150 Industry stakeholders C/S Packhouse/Coolstore (with champion)
A/R Orchard (or orchard group)
26 Lean Consultants C/S Packhouse/Coolstore (with consultant)
A/R Packhouse/Coolstore
C/S Exporter 1 Lean pipfruit cluster
C/S Exporter 2 Other horticultural organisation(s) interview
Mini case-study

Page 338 of 372
Who to interview plus guideline:
What to observe:
Review organisation in terms of Kobayashi (1995) or Tapping et al (2002) criteria through
management assessment with researcher assistance.
Observe use of common Lean tools (refer questionnaire) such as:
1 5-S'
2 Value stream mapping
3 ‘Flow’ as one of five basic ‘Lean’ management elements
4 Kanban (material Pull)
Research organisations Manager Floor supervisors Seasonal staff
A/R Orchard (or orchard group)
Yes Yes Some, if possible
A/R Packhouse/Coolstore Yes Yes Some, if possible
C/S Packhouse/Coolstore (with champion)
Yes Yes Some, if possible
C/S Packhouse/Coolstore (with consultant)
Yes Yes Some, if possible
C/S Exporter (1) Yes No None C/S Exporter (2) Yes No None Other horticultural Yes (or specialist) No None
Note: In principle, interview as per table in order to achieve consistency.
Guideline for processes for which data are collected
Orchards Packhouse/Coolstore Exporter Harvest Intake Input/output
Pruning Cold storage raw material Inventory management Thinning Packing Planning Customer focus Spraying Coolstore/treatment planning Shipping Planning Grading/Packing Documentation
Maintenance Packaging Staff training Coolstore inventory management Transport/Logistics Maintenance
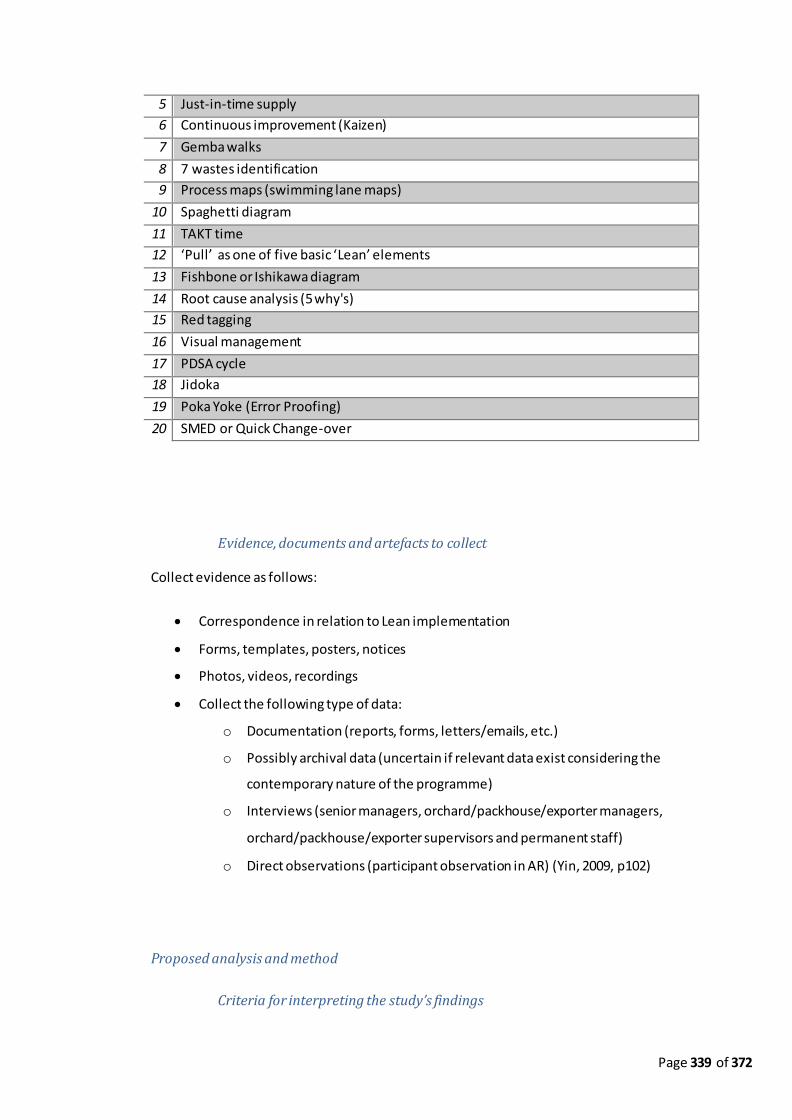
Page 339 of 372
5 Just-in-time supply
6 Continuous improvement (Kaizen)
7 Gemba walks
8 7 wastes identification
9 Process maps (swimming lane maps)
10 Spaghetti diagram
11 TAKT time
12 ‘Pull’ as one of five basic ‘Lean’ elements
13 Fishbone or Ishikawa diagram
14 Root cause analysis (5 why's)
15 Red tagging
16 Visual management
17 PDSA cycle
18 Jidoka
19 Poka Yoke (Error Proofing)
20 SMED or Quick Change-over
Evidence, documents and artefacts to collect
Collect evidence as follows:
Correspondence in relation to Lean implementation
Forms, templates, posters, notices
Photos, videos, recordings
Collect the following type of data:
o Documentation (reports, forms, letters/emails, etc.)
o Possibly archival data (uncertain if relevant data exist considering the
contemporary nature of the programme)
o Interviews (senior managers, orchard/packhouse/exporter managers,
orchard/packhouse/exporter supervisors and permanent staff)
o Direct observations (participant observation in AR) (Yin, 2009, p102)
Proposed analysis and method
Criteria for interpreting the study’s findings
Page 340 of 372
The study intends to:
Develop theory;
Generalise from case study and action research to theory.
Units of analysis
One unit of analysis is the organisations’ ability to adopt and implement new management
paradigms such as Lean. How do organisations (growers, packhouses and exporters) adopt
new management paradigms such as Lean into their seasonal activities? For each of these
organisations, the unit of analysis differs slightly as the type of organisation is different. Data
collection may be slightly different. So the unit of analysis is the organisation with the people
who need to implement the change (Hopkins, 1982).
The following are different (non-equivalent) variables:
People will struggle with Lean because they are unfamiliar with it;
People will find very little time for Lean because they are too busy (fixing things);
Lean organisations will be isolated and poorly understood;
Production will be more effective.
The pipfruit environment makes implementation of Lean desirable, required or difficult and
pressurised, etc.
The key people are the key people in the organisation involved in Lean implementation. The
start is at the start of Lean implementation process. The completion is after a minimum of a
full season.
A second unit of analysis is the ability to improve/adapt and standardise the new Lean
management paradigms. Interesting data may allow triangulation of the champion vs the
consultant vs the researcher, or the matching of Lean principles and tools with industry
dynamics.
Coding and categorising data
Interviews are coded and categorised as follows:

Page 341 of 372
1. Interviews are generally transcribed in situ as a combination of descriptive and
verbatim records.
2. Paragraphs are analysed looking for:
a. Identifiable Lean elements (words or sentences);
b. Repetitive elements (words or sentences);
c. Elements that may affect the suitability and implementation of Lean positively
or negatively.
3. The key elements are captured with key words and/or abbreviations.
4. Categories are designed to capture related keywords. Possibly link categories to
measurement instruments, e.g. the Tapping et al (2002) instrument.
5. Key elements and categories are re-assessed throughout the process to ensure
continued homogeneity of the categories.
Analytical techniques: Link data to propositions and criteria for interpreting findings
Data are linked where possible using pattern matching, explanation building, time-series
analysis, logic models or cross-case synthesis.
Logic models: Comparing (pattern matching) empirically observed events to theoretically
predicted events (propositions). Examples:
a. Organisations struggle to implement orthodox Lean and
B. become more effective as they implement Lean (e.g. stock control is easier, planning is
better). (Yin, 2009, p153-154)
Cross-case synthesis: Complete cross-case analysis
Cross-sector analysis
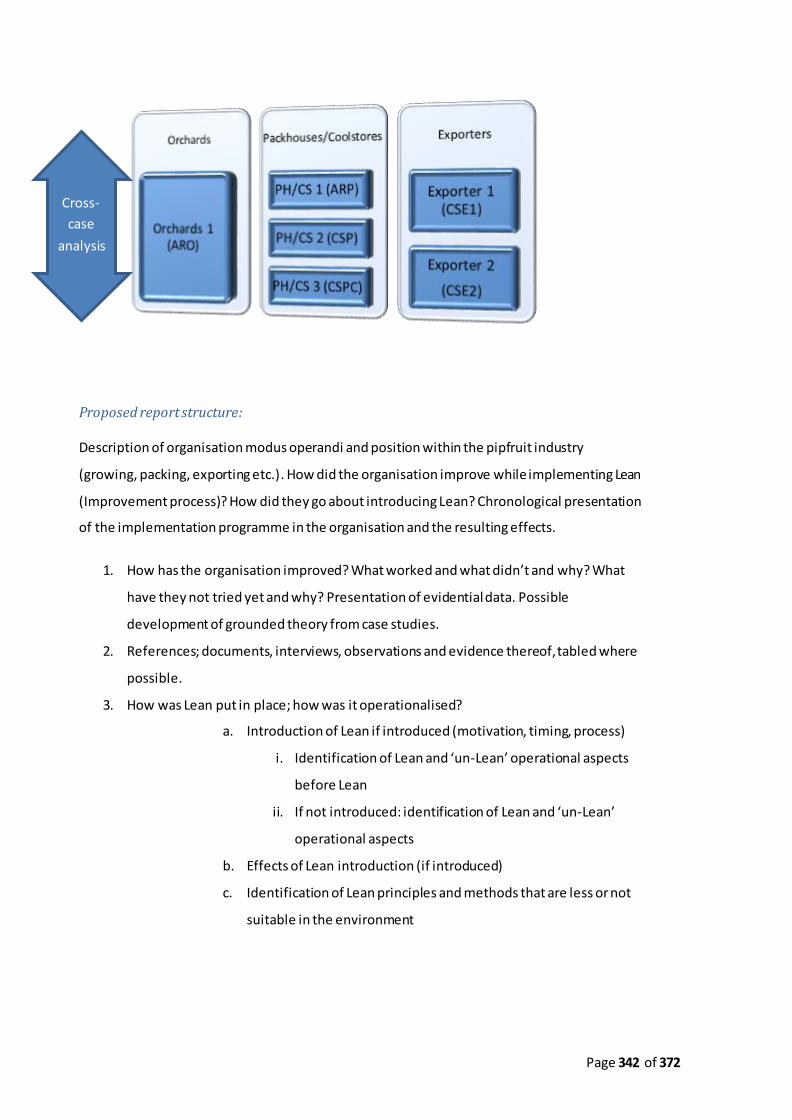
Page 342 of 372
Proposed report structure:
Description of organisation modus operandi and position within the pipfruit industry
(growing, packing, exporting etc.). How did the organisation improve while implementing Lean
(Improvement process)? How did they go about introducing Lean? Chronological presentation
of the implementation programme in the organisation and the resulting effects.
1. How has the organisation improved? What worked and what didn’t and why? What
have they not tried yet and why? Presentation of evidential data. Possible
development of grounded theory from case studies.
2. References; documents, interviews, observations and evidence thereof, tabled where
possible.
3. How was Lean put in place; how was it operationalised?
a. Introduction of Lean if introduced (motivation, timing, process)
i. Identification of Lean and ‘un-Lean’ operational aspects
before Lean
ii. If not introduced: identification of Lean and ‘un-Lean’
operational aspects
b. Effects of Lean introduction (if introduced)
c. Identification of Lean principles and methods that are less or not
suitable in the environment
Cross-
case
analysis

Page 343 of 372
Related documents:
Industry survey
Tapping et al (2002) assessment

Page 344 of 372
Appendix 10: Pipfruit NZ statistical annual data for orchards and packhouses
2012
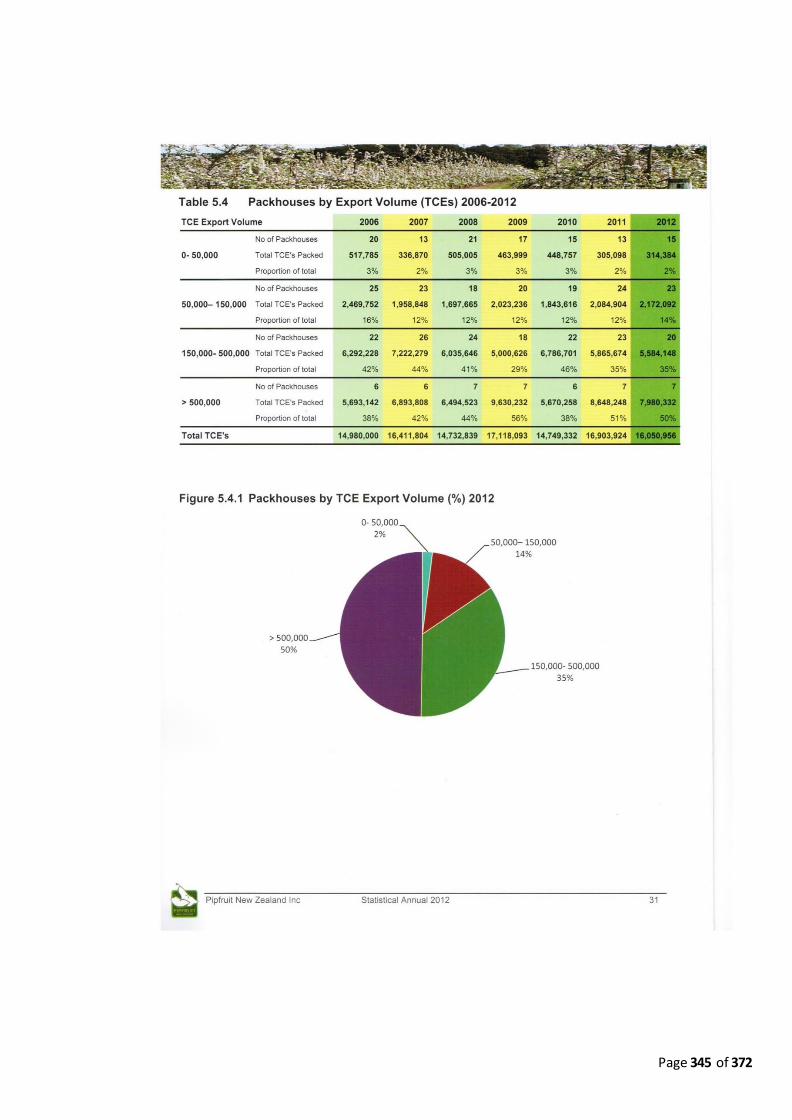
Page 345 of 372

Page 346 of 372

Page 347 of 372
Appendix 11: ARO: Pruning procedure and visual aid example
1. Establish Customer Demand through Exporter: Complete by 15th May
Process Procedure Who, When
Determine customer demand
1. Confirm global trading trends. Consider:
Shift in exporting countries
Northern hemisphere production information Other factors such as exchange rate influences
Exporter
2. Detail known customer demand for next season
By Customer By Variety
By Colour specifications
By Preferred size profile By Quality specifications
Note: Assess projected demand (Volume) for each variety/size/colour/quality combination
3. Detail preferred demand by country for market access
Assess projected demand (Volume) for each variety/size/colour/quality combination by country
4. Add other essential criteria such as timing by volume Note: Use a database model to facilitate multiple variables (variety, sizes, colours, specifications etc.)
Communicate to orchards
5. Communicate preferred customer demand to orchard sector
Also communicate initial picture to post-harvest planning
Exporter
Completed
2. Plan pruning strategy for all orchards/varieties (complete in May)
Process Procedure Who, When
Initial Planning preparation
1. Confirm orchard production details for the past season
Volume by variety
Quality details (colour, size profiles, pack-outs)
Orchard Planning
2. Receive forecasted demand May
Operationalize demand
3. Plan pruning for sector

Page 348 of 372
Process Procedure Who, When
Plan pruning 1. Receive production targets from planning by sector, by orchard block
Sector manager
2. Confirm required manpower requirement
3. Confirm required personal pruning equipment requirement Note: Uniquely identify each item of equipment and hand out on name. Maintain equipment record for the season.
Lean Note: Customer value is achieved by actual pruning (i.e. cutting). Maximise actual pruning time to minimise waste!
Plan equipment
1. Determine need for capital equipment such as hydraladas for each block
Sector managers
2. Coordinate use of company hydraladas in coordination with orchard planning Lean Note: Avoid unnecessary travel as this leads to waste
3. Coordinate use of other equipment in coordination with orchard planning Lean Note: Avoid unnecessary travel as this leads to waste
Completed
4. Execute pruning plan by orchard block
Process Procedure Who, When
Determine cycle time (TAKT time)
1. On each block: Select five typical trees by variety/age/growing method for pruning quality examples and to determine pruning tree cycle time
Sector Manager
2. Clearly mark sample trees so that pruners can go back and look
3. Prune some sample trees to specification while recording time Note: Use existing pruning specification
4. Check that trees were pruned correctly Note: Use orchard technical advisor to confirm
5. Prepare simple pruning instruction for pruners Note: Ensure that instructions plus filed book provide adequate detail

Page 349 of 372

Page 350 of 372
Appendix 12: ARO Lean audit draft (2014)
6 Improvement of the Lean Orchard Concept
Observation, documented, recorded, other
evidence
Not found anywhere
Only found in
some areas (<25%)
Commonly found but
not in majority (<60%)
Very typical, some exceptions
(<85%)
Found everywhere, no exceptions
(100%)
1
Orchard staff provide ideas and concepts that adapt, add to and/or improve the Lean orchard concept; the ideas are based on Lean as a production system to
satisfy customer demand, improve flow and even production and reduce waste in production processes.
0 1 2 3 4
Reason for score:
Total of circled scores:
Weight (Indicating relevance to operational 'Leanness' (select from: 1, 1.1, 1.2, 1.3, 1.4, 1.5):
1.4 = Lean Score = 0 (total times weight)
12 Total Productive Tree Maintenance
Observation, documented,
recorded, other evidence
Not found
anywhere
Only
found in some areas
(<25%)
Commonly found but not
in majority (<60%)
Very typical, some
exceptions (<85%)
Found
everywhere, no exceptions
(100%)
1 There is an effort to plan productive tree maintenance schedules by mapping
tree and orchard maintenance requirements by orchard block and variety. 0 1 2 3 4
Reason for score:
2 Planned orchard maintenance is communicated via visual management, both for the next few days as for the next few months.
0 1 2 3 4
Reason for score:
3 Each orchard block has a record of poorly producing trees (which are marked
in the orchard) and a plan to improve production of each of those trees. 0 1 2 3 4
Reason for score:
Total of circled scores:
Weight (Indicating relevance to operational 'Leanness' (select from: 1, 1.1, 1.2, 1.3, 1.4, 1.5):
1.475 = Lean Score = 0 (total times weight)

Page 351 of 372
Audit categories 1 Visual Management
2 Visual Performance Measurement
3 Workplace Organisation
4 Standardising Work
5 Orchard Layout
6 Improvement of the Lean Orchard Concept
7 Error Proofing (Preventing Human / Method Errors)
8 Quick Change-over (Quick Setup)
9 Flexible Operations (Process and Worker Flexibility through Continuous Flow)
10 Orchard and orchards Team work
11 Total productive Equipment Maintenance: Planned Maintenance & Safety
12 Sequential Productive Tree Maintenance
13 Total Even Production Orchard
14 Production Information flow and accuracy (supply chain)
15 Pull Systems (Material and People)
16 Waste
17 Lean Discipline
18 Continuous Improvement (Small, Regular Improvements by all)
19 Work-Culture Awareness (Customer Focus - Worker Awareness)
20 Management Support
Example of an audit outcome 2. Visual Performance
Measurement Observation, documented, recorded, other evidence, notes:
Visual performance management intends to communicate how well people or teams are performing. This is not financial performance! Up-to-date operational performance indicators allow staff to improve their performance. This can include H & S data, pruning data, daily pruning performance, quality of product etc.
There were only a few orchards that had some visual performance data. Several orchards had displayed pruning scores. Some had a pruning ‘worm’, a performance against budget tool that has a financial focus. It creates urgency but does not focus on or assist with performance improvement. One orchard had general H & S data on the notice board. Orchards struggled with the concept of Lean indicators versus budget driven indicators.
0.00
2.00
4.00
6.00
8.00
Visual Performance Measurement
Orchard 1 Orchard 2 Orchard 3 Orchard 4 Orchard 5 Orchard 6

Page 352 of 372
Appendix 13: Pipfruit Lean Cluster Summary
HB Pipfruit Lean Business Cluster In summary, the Hawke’s Bay Pipfruit Lean Business Cluster encompasses the following:
1. The cluster and its members:
a. A group of between six and twelve pipfruit companies.
b. Members can be growers, packers (incl. coolstores), exporters or vertically
integrated.
c. Cluster members are considered representative for the industry; they are
considered reasonable experts in their fields who intend to professionalise
their organisations.
d. Further members can be added during the year.
e. Important: The cluster is run by its members, i.e. cluster members take
ownership of the cluster and determine its direction.
2. Role of Pipfruit NZ Inc.:
a. Cluster is organised under auspices of Pipfruit NZ Inc.
b. Pipfruit NZ Inc. will assist e.g. by making printed material available.
c. Pipfruit NZ Inc. is represented by Hans Doevendans from QMAC Systems, who
is also a full-time Lean PhD student, specifically looking into Lean for the
pipfruit industry.
d. Pipfruit NZ Inc. may use its relationship with NZTE to assist cluster activi ties.
3. Meetings:
a. Six two-monthly meetings of a maximum of 4 hours each.
b. Members are expected to attend most meetings, also during the season.
c. Attendance can be with one or two people; the same person does not need to
attend all the time.
d. Meetings are on-location, the location swapping around from one cluster
member to another.
e. About two meetings per year may be organised around visiting other (non-
pipfruit) Lean companies.
4. Learning:
a. Open exchange of information.
b. Cluster is there for all members to learn from each other.
c. Cluster members can ask for specific information.
d. Hans Doevendans will be available to address any queries about Lean.
e. Cluster members may be offered to try specific methodologies and report on
effectiveness.
5. Research report:
a. Cluster activities may be mentioned in research reports, without identifying
organisations.
b. Research findings are shared with the participants, NZ pipfruit and may be
shared with the university and wider academic community.
6. Further principles may be added to this list.

Page 353 of 372
Appendix 14: Pipfruit Lean Cluster Summary Feedback example (Sic.)
Pipfruit NZ Lean Cluster Meeting: 25th Feb 2014 (Company 1 Coolstores)
Follow up questionnaire
Feedback Performance:
No. of members attending (organisations): 5 No. of feedback forms received: 3
Received within two weeks: 2
What did you learn from the visit:
Have you implemented anything from the visit?
Other Comments:
It is good to see other operations take on Lean and see the differences in the way they
have implemented things. The Haka meeting board at seen is a good example. While
we report on similar things at our meetings we are not as visual and don’t use boards
like this.
Another very good point was what is considered waste–we are told movement is
waste but the host pointed out that they will move a lot of pallets if needs be to get
the right ones to market. His take on the waste being fruit going to wrong markets.
Another good idea was having the red lines painted on the floor to show when bin
stack height needed to change to avoid hitting evaporators.
Keep it simple.
Let the teams take ownership–improvements will then just happen
Invest in the resources to collect the data to support what the teams are doing and
demonstrate gains
Very impressed with battery management and the hazard signs inside a room where
height levels reduce
Will put some visuals up for the line Haka meetings
Not yet…
We have adopted the battery management and had this in place a week after the visit
Great to be able to visit sites and see others ideas on how to follow Lean principles.
Excellent overview. Learnt a lot about alternative ways to do the same thing. The field
trips are very informative
Currently our toolbox meetings cover the remainder of lean management and would
like to thank our hosts for their sharing of lean practices.

Page 354 of 372
Do you plan to implement anything from the visit?
We have been looking at the issue of pallet movements needed to load containers
with the correct fruit. We will continue with this but may look at another measure of
correct fruit getting to correct market.
The Whiteboard concept and storage system for the clamps and locks for doors are on
the agenda for implementation
We will be introducing the hazard signs inside coolstores, when these are not in use.
This requires floors to be marked, which in effect cannot be done until rooms are
switched off and dry. However we can mark the wall with hazard strips where
applicable

Page 355 of 372
Appendix 15: Future State Lean Activity Planner
Principle/method/ tool
Use Grower/Orchard Packer/Packhouse/ Coolstore
Exporter
Customer Value Current Not specifically
communicated to orchards or communicated late,
most commonly around December of January.
Expressed in exporter or
customer specifications that are communicated before packing to the
packer.
The exporter is
the closest to the customer but does not
communicate timely to orchards (i.e. before pruning
starts); the industry sells an estimated 50% in programmes
(where the customer is known) and the
balance on consignment (where the customer is
unknown).
Future state
Growers can affect what is grown (production) if they know what the
customer requires and in which country the
customer is based (in order to get access to that market). The ideal
state communicates customer value just before pruning.
Pack as the customer requires. The future state is that the packer knows all customers and
customer value for each well before the time of packing all sizes and
colours of a variety. This facil itates timely ordering of packaging.
Sell to the customer what the customer requires. A
future state includes 100% customer
programmes which allows the exporter to provide
customer value specifications to grower and packer.
Example Growers arrange to
hear from their selected exporters no later than June each year what the
customer requires, in which country he trades and what the
exporter recommends to grow.
Packers set up a
calendar communication process with exporters to work towards a complete set of
specifications that is communicated timely to packaging
manufacturers.
Work with
customers on achieving more programmes and reduce the
number of consignment sales without
sacrificing returns.
Value Stream Mapping
(VSM)
Current Not used at all. Research company
had a look at it.
Trialled by some of the research companies but
not embedded.
Not known to be used by
exporters in

Page 356 of 372
Principle/method/ tool
Use Grower/Orchard Packer/Packhouse/ Coolstore
Exporter
general. Not used by sample
companies.
Future state
Valid tool but needs assessing for orchard use. The future state includes
value stream mapping to identify and reduce waste.
Standard tool to identify and eliminate waste in the packing/storing process. The future state
sees value stream mapping used in all departments for all
activities.
Valuable as VSM deals with processes, information and
product flow. The future state sees VSM used
by exporters identifying waste in all logistics.
Example Orchard staff map a value stream
around one activity (e.g. harvest) as practice to identify waste and gain
understanding.
Packhouse and coolstore staff map a single
process (e.g. load-out) to identify waste so that they gain understanding.
Exporters use a consultant to
learn about value stream mapping and develop a value stream for
a product family to reduce waste and gain
understanding. Creating Flow Current Some flow used but
low applicability as production is nature-dependent.
Apples flow from
orchard to coolstore to packhouse to coolstore to shipping with
numerous batching interruptions in the process caused by inventory peaks.
Not known to be
used except some information and
documentation flow.
Future
state
Low applicability.
Flow of staff from one orchard to another causes no waste. Harvest
flows from one orchard to the next as fruit matures. No
flow between production stages.
Used by research
packhouses with some variation in methods. In a future state, product will flow from orchard to
coolstore via treatments, to packing to cooling to shipping with minimal
transfers.
In a future state,
information flows seamless from orchard to coolstore to
packhouse, to coolstore and to shipping and
exporting.
Example Orchard plans flow for change of processes and
change of orchard blocks, e.g. where possible move pruners to an
adjacent block, not a remote block.
Product is packed to demand after pre-sizing and shipped
immediately, reducing packed stock inventory and thus reducing rework.
Relates to information only. Set up a l ive
information process that streams information to
packers and coolstores and v.v. to reduce
unnecessary actions.
Creating Pull Current Not applicable for Packhouse calls for fruit Exporters

Page 357 of 372
Principle/method/ tool
Use Grower/Orchard Packer/Packhouse/ Coolstore
Exporter
fruit; is used for tree and fruit quality
(e.g. sprays).
in stock to pack and reasonably packs to
exporter demand. Similarly calls for (pulls) packaging materials as
required to maintain low stocks.
provide load-out instructions as
packed products become available in inventory and
as they are sold. Exporters are aware of inventory issues.
Future
state
Pull only
materials/services as and when needed to reduce inventory, e.g.
chemicals, fertil isers, irrigation and labour. Typical
VSM.
In a future state, the
packhouse pulls only materials/services as and when needed (refer Kanban systems). Typical
VSM.
In an ideal state,
fruit would only be instructed to be packed if sold. Typical VSM.
Example Complete a soil test,
order the right fertil iser in the right quantity and apply
holding no leftover stock.
The information flow
with the exporter ensures that fruit is packed that will be
shipped without delay to reduce packed stocks.
Align sales with
packing instructions. When a l ine of
fruit is packed, sell all sizes and pull from coolstore to ship.
Continuous
Improvement
Current Not seen as
philosophy; small improvements are not ‘enough’. Difficult to adjust to
the mind-set.
Not seen to be
encouraged to workers except by the research companies.
Not known to be
used as philosophy but exporters try to improve product.
Future state
Essence of Lean; In the ideal state, all workers are involved in continuous incremental improvements; breakthroughs are bonus.
Example Make visible those improvement suggested and executed, including the difference they make to encourage staff to experience intrinsic value of improvements.
Load-levelling / Level
scheduling (Mura)
Current Used by planting
different varieties and using products such as Hi-Cane and Retain to advance
or delay harvest.
Packhouse/coolstore
accelerate from the season start and remain at full pace during the season and not
afterwards; MPI rules create multiple change-overs each day.
Not known to be
used. Exporters are outcome focussed and unconcerned
about load-levelling.
Future
state
Achieves production
smoothing. In an ideal state, pruning, hand-thinning and harvesting is spread
evenly over the seasons.
Reduces pressures if
achievable but depends on fruit quality and exporter demands. In an ideal state, all fruit
would be of consistent quality and sales would be even during the season.
In a future state,
exporters would coordinate the direct supply chain/value
stream.

Page 358 of 372
Principle/method/ tool
Use Grower/Orchard Packer/Packhouse/ Coolstore
Exporter
Example Create a matrix showing variety by
block and normal harvest time. Consult with
exporter and advance or delay harvest to level load on pickers.
Pack at a consistent speed by variety. Plan
runs so that size and quality permits this.
Integrate exporter with
coolstore, packer and grower information flow
to facil itate better planning. Work towards sell ing all sizes of
a packing run.
Preventing overburdening
(Muri)
Current Significant burden on staff during harvest time. Increase in seasonal
staff reduces the load.
Significant burden on staff during submission to load-out. Increase in seasonal staff reduces
the load.
Not considered a significant factor under the current model.
Increase of staff not usually necessary.
Future state
Flexible seasonal staff multiplication to cope with variation in hand thinning and harvest
requirement. Information flow is well integrated and timely, reducing any late changes which often create overburdening.
No or l ittle seasonal staff.
Information flow is well integrated and timely,
reducing any late changes which often create overburdening.
Example Train pickers to pick
the right fruit and use the right technique to improve
performance.
Combine packing runs in
such a way that the number of changes during a packing shift is reduced.
Plan packing for
packhouses with the least number of change-overs.
Identifying wastes Current Not deliberately used as Lean tool but consciously considered to achieve efficiency. Lack of education around what constitutes waste.
Future state
Essential for continuous improvement; in an ideal state, all employees identify all forms of wastes and minimise or remove these.
Example Explain a single form of waste to staff and get staff to identify that
form of waste within their area of operations for 30 minutes. Exchange results to reinforce learning. Repeat regularly.
Cellular Production Current Not applicable in annual tree crops.
Apples are washed, graded, packed in cartons and palletised in
the packhouse. Equipment layout is in essence one large cell.
Not applicable.
Future state
Applicability in annual tree crops
questionable.
Could be applied in a pre-sizing environment
where washed and graded apples are first batched, followed by
rapid packing in individual cells.
Not applicable.
Example Not applicable. Uncertain if current Not applicable.

Page 359 of 372
Principle/method/ tool
Use Grower/Orchard Packer/Packhouse/ Coolstore
Exporter
process can be much improved other than
through pre-sizing first.
One Piece Flow Current Not applicable in annual tree crops.
A form of one piece flow applies; apples from 400 kg bins are continuously packed into different
cartons of 18 kg, which are packed sequentially.
Not applicable.
Future state
Applicability in annual tree crops
questionable. Harvesting by size and colour could lead to a form of
one-piece flow in the packhouse but is impractical.
Questionable if improvement can be
made when assembly follows disassembly. One piece flow can be applied after pre-sizing,
allowing packing to demand.
Not applicable.
Example Not applicable. Pre-sized product is packed by single bin with
quick change-over leading to packing complete product in low volumes.
Not applicable.
Quick Change-over
Current Change-overs in
orchards include trees, sprayers and people. Orchards
can plan for quick change-over of trees. Fil l ing up sprayers requires
quick change-over. More time consuming is the changing of pruners,
thinners and pickers from block to block.
Applicable and used in
packhouse packing runs. MPI requirements and packaging make this
difficult. Applicable to coolstores; Smart-Fresh and CA room changes.
Not researched.
Future state
Trees are pulled, soil fumigated and
trees re-planted in high density fast maturing plantings, reducing non-
productive period to minimum. Spray fi l l ing combined with refuelling or
other. Setting up blocks before staff arrive, getting staff
to take own ladders and buckets to new blocks.
Timely planning allowing setting up of bins to pack
and packaging. Running packing run changes (no stopping). Running packaging changes.
Running variety changes. Continuous flow from bins in and out of Smart-Fresh rooms.
Not seen to be applicable.

Page 360 of 372
Principle/method/ tool
Use Grower/Orchard Packer/Packhouse/ Coolstore
Exporter
Example A grower trained staff that they must
take their picking ladders to the end of the row to make
pick-up for removal less time consuming. The next phase is that
the harvesters move in a grower provided van and tow the ladders
themselves, saving time and making change-over much
quicker.
A change of packing run is announced and
prepared, with all packaging attributes pre-arranged before the
change-over takes place. This reduced standard change-over time by several minutes for each
change-over.
Not applicable.
TAKT time Current TAKT time for producing an apple is one year; TAKT time is not used in
orchards except by some research companies.
TAKT time is not used in packhouses or coolstores except by some research
companies. In broad terms, increased staff number relate to TAKT time.
Not researched.
Future
state
TAKT time for
producing an apple cannot be manipulated; TAKT time can be used for
pruning trees, hand thinning trees and fi l l ing bins.
TAKT time can be used
to determine emptied bins or packed cartons per time-unit. TAKT time can also be used for
fi l l ing and emptying Smart-Fresh rooms.
Not researched.
Example Measure the time it
takes to prune 5 trees and provide the TAKT time to the pruners. This
TAKT time is not directly related to customer demand.
A coolstore appointed
dedicated staff to load and unload SmartFresh rooms to keep up with demand.
Considered not
applicable.
Cycle time Current Cycle time for producing an apple
is one year; not applicable.
Cycle time is not used in packhouses or
coolstores except by some research companies.
Not researched.
Future state
Pace of production; not applicable.
Cycle time set to pack a bin of apples varying
with variety, quality and packaging requirements.
Not researched.
Example Not applicable. A packhouse plans its packing season duration based on volume by
variety and known cycle
Considered not applicable.

Page 361 of 372
Principle/method/ tool
Use Grower/Orchard Packer/Packhouse/ Coolstore
Exporter
time for packing.
Total Productive Maintenance (TPM)
Current Loosely planned maintenance during
the off-season; corrective maintenance during the season.
Research company making a start with TPM.
Research companies trending towards better
maintenance planning; some operator involvement.
Office equipment only; no TPM
philosophy.
Future
state
Effective TPM planning and execution leading to no breakdowns and
therefore superior flow in production. Off-season offers ideal opportunity for maintenance.
Example Orchards plan off-season maintenance but
make operators responsible for daily maintenance to ensure operational
effectiveness of equipment.
Coolstores make forklift drivers responsible for daily maintenance
checks.
Office equipment only.
Total Productive Tree maintenance (TPTM)
Current Individual dead trees and low producing trees
generally accepted as normal. Research companies making a
start with TPTM.
Not applicable Not applicable
Future
state
Dead or low
producing trees immediately replaced using
proper soil preparation. Reflecting cloth used for colouring
fruit, Drainage and irrigation controlled and monitored. Soil
health monitored and controlled.
Not applicable Not applicable
Example An orchard develops a process flow for the
immediate replacement of dead or diseased trees and executes
it decisively. There are never many dead or diseased trees in the orchard.
Not applicable Not applicable
Overall Equipment Current Not known to be Not known to be used. Applicable to

Page 362 of 372
Principle/method/ tool
Use Grower/Orchard Packer/Packhouse/ Coolstore
Exporter
Effectiveness (OEE) used. software inventory and
shipping programmes only.
Future state
Measurement of OEE available,
performance and output quality of equipment
measured; relates to tractors, sprayers, hydraladas.
Measure availability, performance and output
quality of equipment; relates e.g. to cooling equipment and packing
equipment.
Little relevance to exporters as
agents.
Example Record each event
where equipment does not perform to facil itate improvement.
Record each event
where equipment does not perform to facil itate improvement.
Not applicable
Overall Tree
Effectiveness (OTE)
Current Not known to be
used. Overall block effectiveness is monitored.
Not applicable Not applicable
Future state
Measurement of OTE available,
performance and output quality of each tree
measured; relates to trees only.
Not applicable Not applicable
Example Measure in increasingly smaller units of trees (e.g.
rows) to facil itate fine-tuning of cropload.
Not applicable Not applicable
Just-In-Time Current Production is a single annual cycle
and not based on customer demand. Some other supplies have intuitive JIT.
Coolstores store inventory as it arrives.
Packhouses order stock-to-pack from coolstores as required (JIT).
Exporters already focus on
getting product from ship into market without delay and JIT.
Future
state
Ordering chemicals
and fertil iser and labour only when needed. Reduces
inventory in a standard production setting.
Pipfruit can be packed
on demand with bins in coolstore ready for packing. Applicable for
programmes and fixed sales; not for consignments. Packaging materials ordered JIT.
See Kanban.
The exporter
confirms customer demand and
adjusts the timing of the demand with shipping options
and fruit availability.
Example Decide on spraying days and product to
Align packing programme with
As above.

Page 363 of 372
Principle/method/ tool
Use Grower/Orchard Packer/Packhouse/ Coolstore
Exporter
use. Pick up from supplier or arrange
with supplier to deliver the day before.
exporter sales programme.
Kanban Current Used incidentally as reactive inventory
management for consumables (e.g. chemicals).
Used by research packhouses with degree
of success. Not many applications in coolstore environment.
No known usage by exporters.
Future
state
Bins, chemicals and
labour are ordered in sufficient small numbers ‘automatically’ by
using kanban.
Packaging, labels,
packaging attributes and all other consumables are replenished in sufficient small numbers
‘automatically’ by using signal cards.
For exporters
this relates to office supplies; exporters can see inventory but
‘re-ordering’ is based on sales rather than minimum stock
levels.
Example Decide on bins required for next harvest day and order. May be
delivered as backload to reduce waste.
A packhouse has a Kanban system for all packaging requirements. The system
requirements are aligned with the volume of fruit to be packed.
Kanban can be used for office supplies.
Autonomation
(Jidoka)
Current No known
application in the orchard.
Coolstore alarms,
automatic sizer stoppage if missing cups detected.
No known
application.
Future state
Equipment is partially automated and designed to
stop automatically if defects are identified. Possible application in
sprayer setup.
Definite application in packhouses, e.g. if packing stations are too
full with apples; automatic tree feeding; recycling of un-allocated apples; set-height
forklifts.
No known application in the office.
Example Non available. Forklifts are programmed to stop at specific heights to stop forklift drivers from
misjudging the height of stacks of bins.
Not applicable
Mistake/error proofing
Current Many application options; rows
numbered and vital information shown, storing herbicides away from
insecticides; marking last row sprayed etc. Trees can be loaded with
Many application options; visual
management, numbering of lanes, scanning bin-cards before packing; confirm
spray certificate before packing. Numerous examples, often prevented by software
Application options for
service delivery and general administration.
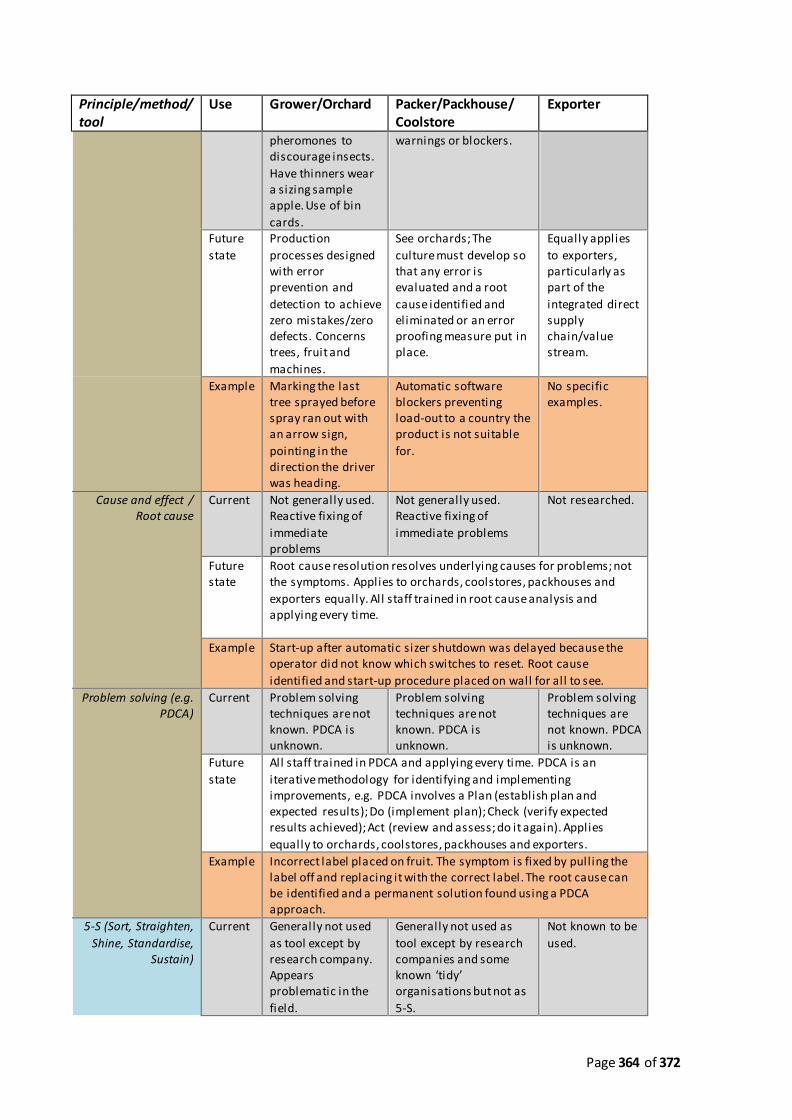
Page 364 of 372
Principle/method/ tool
Use Grower/Orchard Packer/Packhouse/ Coolstore
Exporter
pheromones to discourage insects.
Have thinners wear a sizing sample apple. Use of bin
cards.
warnings or blockers.
Future
state
Production
processes designed with error prevention and
detection to achieve zero mistakes/zero defects. Concerns trees, fruit and
machines.
See orchards; The
culture must develop so that any error is evaluated and a root
cause identified and eliminated or an error proofing measure put in place.
Equally applies
to exporters, particularly as part of the
integrated direct supply chain/value stream.
Example Marking the last tree sprayed before spray ran out with an arrow sign,
pointing in the direction the driver was heading.
Automatic software blockers preventing load-out to a country the product is not suitable
for.
No specific examples.
Cause and effect / Root cause
Current Not generally used. Reactive fixing of
immediate problems
Not generally used. Reactive fixing of
immediate problems
Not researched.
Future state
Root cause resolution resolves underlying causes for problems; not the symptoms. Applies to orchards, coolstores, packhouses and
exporters equally. All staff trained in root cause analysis and applying every time.
Example Start-up after automatic sizer shutdown was delayed because the operator did not know which switches to reset. Root cause
identified and start-up procedure placed on wall for all to see.
Problem solving (e.g. PDCA)
Current Problem solving techniques are not known. PDCA is unknown.
Problem solving techniques are not known. PDCA is unknown.
Problem solving techniques are not known. PDCA is unknown.
Future
state
All staff trained in PDCA and applying every time. PDCA is an
iterative methodology for identifying and implementing improvements, e.g. PDCA involves a Plan (establish plan and expected results); Do (implement plan); Check (verify expected results achieved); Act (review and assess; do it again). Applies
equally to orchards, coolstores, packhouses and exporters.
Example Incorrect label placed on fruit. The symptom is fixed by pulling the label off and replacing it with the correct label. The root cause can be identified and a permanent solution found using a PDCA approach.
5-S (Sort, Straighten,
Shine, Standardise, Sustain)
Current General ly not used
as tool except by research company. Appears problematic in the
field.
Generally not used as
tool except by research companies and some known ‘tidy’ organisations but not as
5-S.
Not known to be
used.

Page 365 of 372
Principle/method/ tool
Use Grower/Orchard Packer/Packhouse/ Coolstore
Exporter
Future state
All staff trained in 5-S to organise the work area using five approaches: Sort (eliminate that which is not needed); Set In Order
(organize remaining items); Shine (clean and inspect work area); Standardize (write standards for above); Sustain (regularly apply the standards). 5-S eliminates wastes resulting from a poorly organised
work area. Equally applies to all value chain elements (orchards, coolstores, packhouses, and exporters).
Example A company started on 5-S and found it had a lot of material and equipment without purpose. The 5-S exercise took about 6 months and made the company unrecognisably tidy.
Visual management Current Generally poorly
used as a tool. Research orchards are making progress.
Generally poorly used as
a tool. Research packhouses have significantly improved visual management with
positive results.
Exporters have
not been assessed.
Future state
All orchards have visual guidance, locations, displays, controls etc.
communicating useful information to everyone effortlessly.
Applicable to orchards.
All packhouses/coolstores have visual guidance, locations, displays,
controls etc. communicating useful information to everyone effortlessly. Applicable
to coolstores and packhouses.
All exporters have visual guidance in their offices, locations,
displays, controls etc. communicate useful
information to everyone effortlessly.
Applicable to office environments.
Example Use a fixed display at each block for
standard information. Use a mobile board if staff are not coming to a
central point.
Get staff to think about measures that help with
their performance, not ‘after-the-fact’ measures, e.g. packing planning for the day with
approximate bin numbers and times.
Not available
Stand-up meetings Current Not commonly found, often
because of people start times and locations.
Not used by industry. Used by research
organisations with varying degrees of effectiveness.
Not known to be used.
Future state
All organisations have brief daily stand-up meetings for each shift, with a focus on operational items from a Lean perspective (e.g. Lean
indicators) to coordinate activities.
Example One company is known to have sequential stand-up meetings from the top down so that information flows to all who need to know.
Traffic lights Current Not used in orchards.
Used in some packhouses for grading.
Not used by exporters.
Future state
Traffic l ights provide real time, immediate visual
feedback on
Quality status is shown using traffic l ights. Production status is
shown using traffic
Exporters use traffic l ight systems for
export available
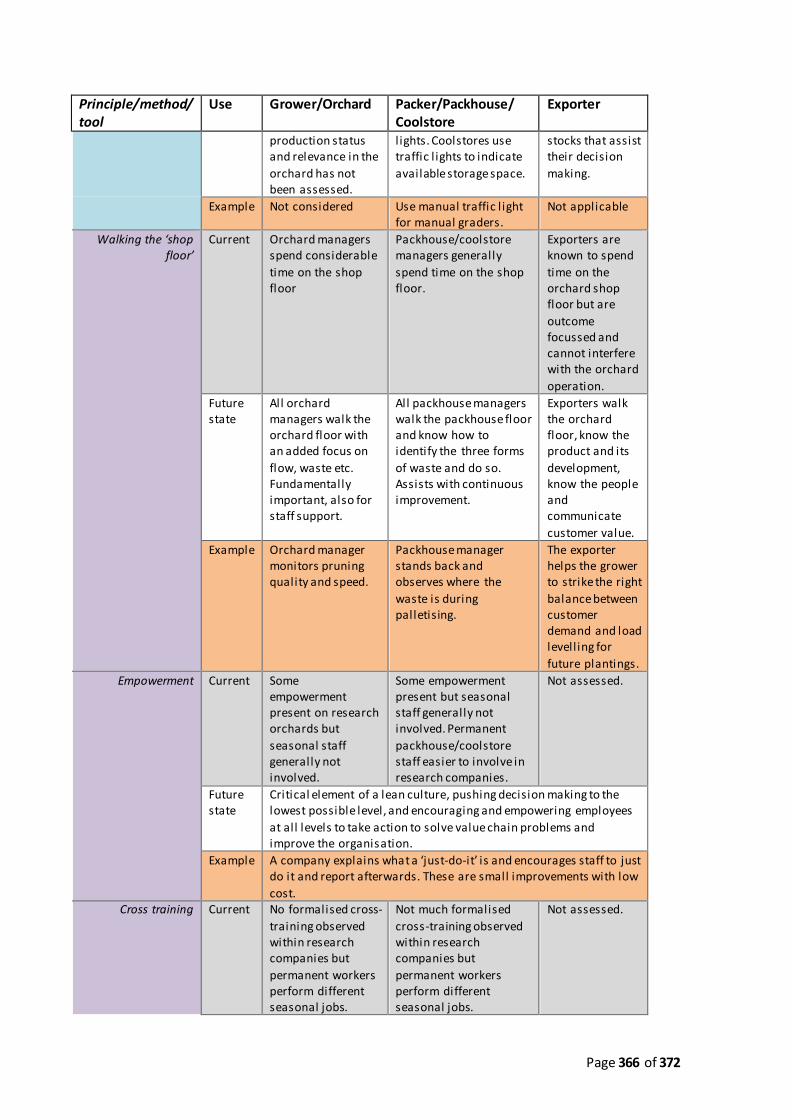
Page 366 of 372
Principle/method/ tool
Use Grower/Orchard Packer/Packhouse/ Coolstore
Exporter
production status and relevance in the
orchard has not been assessed.
l ights. Coolstores use traffic l ights to indicate
available storage space.
stocks that assist their decision
making.
Example Not considered Use manual traffic l ight for manual graders.
Not applicable
Walking the ‘shop floor’
Current Orchard managers spend considerable
time on the shop floor
Packhouse/coolstore managers generally
spend time on the shop floor.
Exporters are known to spend
time on the orchard shop floor but are
outcome focussed and cannot interfere with the orchard
operation.
Future state
All orchard managers walk the orchard floor with an added focus on
flow, waste etc. Fundamentally important, also for staff support.
All packhouse managers walk the packhouse floor and know how to identify the three forms
of waste and do so. Assists with continuous improvement.
Exporters walk the orchard floor, know the product and its
development, know the people and communicate
customer value.
Example Orchard manager monitors pruning quality and speed.
Packhouse manager stands back and observes where the
waste is during palletising.
The exporter helps the grower to strike the right
balance between customer demand and load levelling for
future plantings.
Empowerment Current Some empowerment present on research orchards but
seasonal staff generally not involved.
Some empowerment present but seasonal staff generally not involved. Permanent
packhouse/coolstore staff easier to involve in research companies.
Not assessed.
Future state
Critical element of a lean culture, pushing decision making to the lowest possible level, and encouraging and empowering employees
at all levels to take action to solve value chain problems and improve the organisation.
Example A company explains what a ‘just-do-it’ is and encourages staff to just do it and report afterwards. These are small improvements with low
cost. Cross training Current No formalised cross-
training observed within research companies but
permanent workers perform different seasonal jobs.
Not much formalised
cross-training observed within research companies but
permanent workers perform different seasonal jobs.
Not assessed.

Page 367 of 372
Principle/method/ tool
Use Grower/Orchard Packer/Packhouse/ Coolstore
Exporter
Future state
All organisations have built flexibility in the workforce by training workers to perform several or all the other operational steps
required within each team. Applicable specifically in cellular production, but also in orchard and coolstore/packhouse environment.
Example An orchard trained operators to spray fixed blocks, creating problems when the person was away.
Flow charts / Control
charts
Current Flow charts have
been introduced by the research orchards. Control
charts have not been assessed.
Flow charts are used by
some packhouses/coolstores. Control charts are
generally not used.
Not assessed.
Future state
All organisations use flow charts that visually represent a process to better understand it and identify opportunities for improvement. All control charts are used to monitor outputs and identify variability,
reducing sub-standard outputs.
Example An orchard uses a pruning ‘worm’ to monitor progress. The orchard uses a flow chart to explain the pruning sequence of actions. A coolstore uses a flow chart to load the stores for optimum value.
Spaghetti diagram Current No known trials completed with
spaghetti diagrams.
No known trials completed with
spaghetti diagrams.
Not researched as considered
not applicable. Future
state
All orchards have
used spaghetti mapping for all main processes at
least once to reduce waste.
All packhouses and
coolstores have used spaghetti mapping for all main processes at least
once to reduce waste, e.g. excessive forklift movements due to selecting pallets for
export.
Not applicable
Example Use spaghetti mapping to verify how much distance pruners, thinners or
pickers have to cover walking and determine the
waste in motion.
Use spaghetti mapping to verify how much distance packers and palletisers have to cover
walking and determine the waste through motion.
Not applicable
Pareto chart Current No known use of Pareto charts
No known use of Pareto charts
No known use of Pareto charts
Future state
All organisations use Pareto charts for all main processes to determine priorities. Pareto Charts graph data in order of frequency or relevance and assist decision making. Not researched but has
general applicability.
Example Introduce Pareto charts as part of problem solving training. Packhouse maintenance can be prioritised using a Pareto chart.

Page 368 of 372
Appendix 16: ARP exercise in identifying waste

Page 369 of 372
Appendix 17: Concerning the originality of the Lean apple tree model
Introduction
The Lean pipfruit model in this thesis is partly based on an apple tree and inspired by
Professor Peter Hines’ iceberg model and the need to contextualise the model for the
industry. Having completed the chapter on the model, I sent a picture of the apple tree model
to Professor Hines who responded that he had seen the analogy used before. This appendix
intends to provide evidence that the Lean apple tree model developed in chapter six of this
thesis is original and not based on any form of copying or plagiarism.
Background
On the 22nd September 2014, after completion of my chapter on a Lean pipfruit model, I
emailed Professor Peter Hines to ask what he thought about the model I created, as it was
inspired by the iceberg model. Professor Hines had spent some time with me at the start of
my PhD and I was curious about what his thoughts would be (Reference: Email dated 22
September 2014). I used our last communication (6 December 2012) to respond to his direct
email address.
Professor Hines responded on the 25th September 2014 (Reference: Email dated 25
September 2014), asking for a copy of the final thesis and agreeing with the apple tree model.
In that email, he mentioned that he had seen an apple tree being used as an analogy before.
As I was concerned about the originality of my apple tree model, I responded to his email on
the 25th September 2014 and, amongst other matters, asked if he could recall whether he saw
an apple tree used in a published document or presentation, or something else (refer email
sent on 25-9-2014).
Professor Hines responded promptly (refer email received 25-9-2014), sending me a copy of a
presentation by a conference participant during a Lean business system conference in Sydney
on the 1st and 2nd September 2014 (see conference-related screen-dumps in folder).
History of the development of the Lean apple tree model in this thesis.

Page 370 of 372
In June and July 2014, I presented three papers, based on the work completed for this thesis,
at Euroma 2014, PMA 2014 and ANZAM 2014. After my return from these conferences in
early July 2014, I started playing around with ideas for an industry model. I intended the
model to be symbolic because a detailed model would be too elaborate and not find any
following in the NZ pipfruit industry as it is known to me. I had identified by this time that a
number of critical factors were required in order to become Lean and had already sent a
literature review chapter identifying those critical factors to my supervisors in September
2013.
Looking for a symbolic representation of visible and invisible components of Lean that would
very likely be understood by the industry, I felt that a tree would contextualise the visible and
invisible components of Lean for the industry. I downloaded pictures of trees from the
internet on the 10th July 2014 (refer picture files; first picture files are dated 10 July 2014)
while the idea was in my head. One file was from a book from 1903 from the US archives and
thus copyright free, while the other one was more what I wanted but from a commercial site. I
asked my wife, who is an artist, to draw me a tree along the lines of the second tree and
explained why. In addition, I asked her to draw some younger trees to be able to show
development. She did draw a simple set of trees and I have the original calligraphy pen
drawing in my possession (refer picture files; file dated 24 July 2014). This all happened in July
2014.
I did a little more work on the chapter about the model towards the end of July 2014, using
various tree models including the one drawn by my wife to see what it would look like.
However I put it away for some time while I continued working on the results section of the
thesis.
During August, I continued working on the results and discussion chapters of the thesis and in
September I picked up the chapter on the model and started completing the chapter. I sent a
draft Lean apple tree model to the action research orchards manager to get his view on the
model on the 4th September 2014 (refer email sent to ARO manager, dated 4 September
2014). The first draft of the chapter was completed and was sent to Massey University on the
19th September 2014. This was followed by my email to Professor Hines on the 22nd
September 2014.
During all of this time I was not aware of the Sydney conference or any other conference as I
had just returned from three academic conferences and was determined to have no further

Page 371 of 372
distractions while completing my thesis. For all previous conferences I had obviously
communicated with my supervisors. As I like to plan my study, my supervisors had a copy of
my study planning, including the planned completion date of each chapter; the list also
included dates of my planned visits to Massey University to discuss progress. My supervisors
can confirm that I generally keep to the study plan.
Possible explanations for two Lean apple tree models
The apple tree model in this thesis was conceived by me before—and without any knowledge
of—the Sydney conference. Conversely, I do not believe that somehow my apple tree model
might have ‘leaked’ to the creator of the apple tree model presented in Sydney 2014. In my
view, the parallel development of the two similar models is coincidental or could be referred
to as a case of synchronicity. The difference between coincidence and synchronicity is that
there is no psychic ‘inner experience’ involved in coincidence; coincidence is an aggregation of
facts that, although astonishing, do not share meaningfulness. Synchronicity involves
meaningfulness.
Synchronicity:
Jung first used the term ‘synchronism’ in a seminar in 1928 (McGuire 1982, in Donati, 2004) in
order to account for what he called non-causal coincidences, and place these non-causal
events into an ordered framework that would offer a more complete picture of our
phenomenological world (Storm, 1999). According to Jung, several events form synchronicity
when a meaningful connection or association can be made between the events, but it is only
synchronicity when meaningfulness is the connecting principle between the events in the
absence of causal connections (Jung, 1960, para. 849-850 in Storm, 1999). Jung makes the
connection between the individual psyche and the collective unconscious—usually involving
archetypes—to explain synchronicity. Synchronicity is not time-dependent in the causal sense
(cause must precede effect): The physical event may occur at the same time as an experience
in the psyche (an internal image), or even after this experience. Also, synchronicity is not
dependent on spatial factors.

Page 372 of 372
Final statement
I unconditionally confirm that my Lean apple tree model was conceived before—and without
any knowledge of—the Sydney conference. The essence of this appendix is to claim the
originality of the Lean apple tree model for this thesis and serves to prove that the Lean apple
tree model in this thesis is not a form of plagiarism. I accept that it is unlikely that the apple
tree model presented at the Sydney conference is plagiarised from the Lean apple tree model
developed for this thesis. In my view, the parallel development of the two similar models is
attributable to coincidence or, possibly more likely, synchronicity.