copyright oxford university press 2009 chapter 8 choosing the best alternative
TRANSCRIPT

Copyright Oxford University Press 2009
Chapter 8Choosing the Best Alternative

Copyright Oxford University Press 2009
• Incremental Analysis• Graphical Technique in Solving problems
with Mutually Exclusive Alternatives• Using Spreadsheets in Incremental
Analysis
Chapter Outline

Copyright Oxford University Press 2009
• Define Incremental Analysis• Apply Graphical Technique in solving
Problems with Mutually Exclusive Alternatives
• Use Spreadsheets in Incremental Analysis
Learning Objectives

Copyright Oxford University Press 2009
• Only one alternative may be implemented
• All alternatives serve the same purpose
• Objective of incremental analysis is to select the best of these mutually exclusive alternatives
Mutually Exclusive Alternatives

Copyright Oxford University Press 2009
Incremental Analysis
• Could be applied to rate of return (IRR), present worth (PW), equivalent uniform annual cost (EUAC), or equivalent uniform annual worth (EUAW) approaches.
• [Higher-cost alternative] = [Lower-cost alternative] + [Increment between them]
• The “defender” is the best alternative identified so far in the process, and “challenger” is the next higher-cost alternative to be evaluated.
• For a set of N mutually exclusive alternatives, (N - 1) “challenger/defender” comparisons must be made from [N(N-1)/2] possibilities.

Copyright Oxford University Press 2009
($4,000.00)
($2,000.00)
$0.00
$2,000.00
$4,000.00
$6,000.00
$8,000.00
0% 5% 10% 15% 20% 25%
i
PW
Example 8-1 Incremental Analysisusing Graphical Comparison
High Low IncrementCost $13,400 $10,310 $3090Capacity 150 100 50Benefit $4000/year $3300/year $700/yearLife 5 years 5 years 5 years
IRRLowIRRHigh
IRRIncrement

Copyright Oxford University Press 2009
($400.00)
($200.00)
$0.00
$200.00
$400.00
$600.00
$800.00
$1,000.00
0% 5% 10% 15% 20% 25%
i
PW
IRRY
IRRIncrement
Example 8-2 Incremental Analysis using Graphical Comparison
Machine X Machine YInitial Cost $200 $700Uniform Annual Benefit $95 $120End-of-Useful-Life Salvage Value $50 $150Useful Life, in Years 6 12
Copyright Oxford University Press 2009
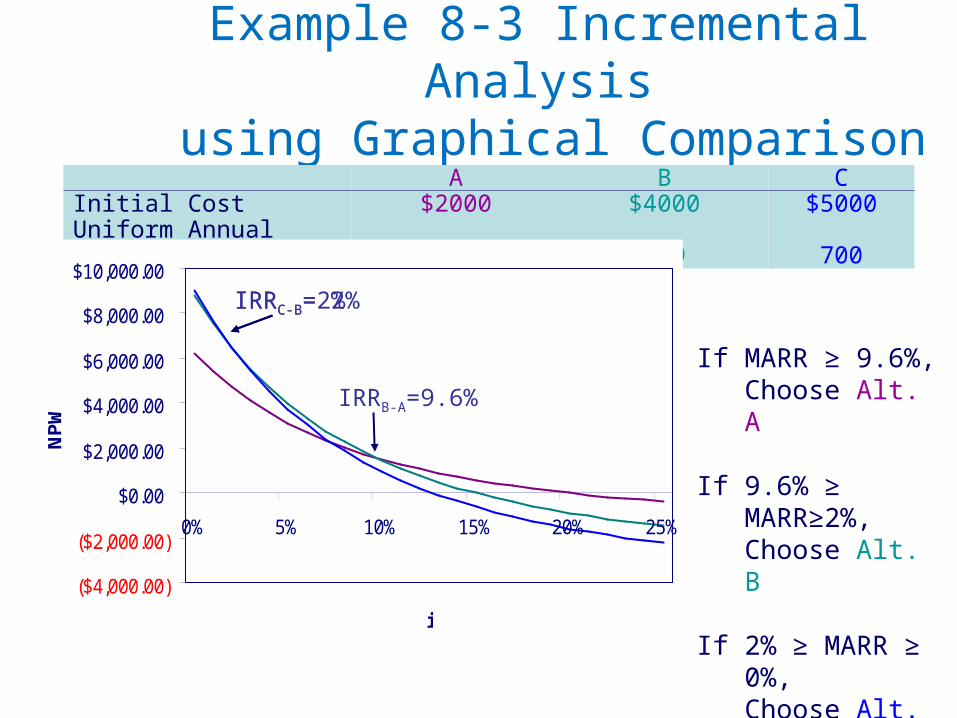
Example 8-3 Incremental Analysis using Graphical Comparison
A B CInitial Cost $2000 $4000 $5000Uniform Annual Benefit 410 639 700
($4,000.00)
($2,000.00)
$0.00
$2,000.00
$4,000.00
$6,000.00
$8,000.00
$10,000.00
0% 5% 10% 15% 20% 25%
i
NPW
If MARR ≥ 9.6%,Choose Alt. A
If 9.6% ≥ MARR≥2%,Choose Alt. B
If 2% ≥ MARR ≥ 0%,Choose Alt. C
IRRB-A=9.6%
IRRC-B=2%IRRC-B= 2%

Copyright Oxford University Press 2009
$0
$10,000
$20,000
$30,000
$40,000
$50,000
$60,000
$70,000
$80,000
0% 5% 10% 15% 20% 25%
i
EUAC
Example 8-4 Incremental Analysis using Graphical Comparison
Brass Stainless TitaniumCost $100,000 $175,000 $300,000Life 4 10 25
If 6.3% ≥ MARR ≥ 0%,Choose Titinium
If 15.3% ≥ MARR≥ 6.3%,Choose Stainless
If MARR ≥ 15.3%,Choose Brass
IRRStainless - Brass=15.3%
IRRTitanium - Stainless= 6.3%

Copyright Oxford University Press 2009
($100)
($80)
($60)
($40)
($20)
$0
$20
$40
$60
0% 5% 10% 15% 20% 25%
i
EUAW
Example 8-5 Incremental Analysis(with Do-Nothing option)
Machine X Machine Y Machine ZInitial Cost $200 $700 $425Uniform Annual Benefit 65 110 100Useful Life, in years 6 12 8
If MARR≥23%,Choose “Do-Nothing”
If 23%≥MARR≥11%,Choose X
If 11%≥MARR≥3.5%,Choose Z
If 2%≥MARR≥0%,Choose Y
IRRZ-X=11%IRRY-Z=3.5%
IRRX=23%

Copyright Oxford University Press 2009
($100)
($80)
($60)
($40)
($20)
$0
$20
$40
$60
0% 5% 10% 15% 20% 25%
i
EUAW
Example 8-5 Incremental Analysis(without Do-Nothing option)
Machine X Machine Y Machine ZInitial Cost $200 $700 $425Uniform Annual Benefit 65 110 100Useful Life, in years 6 12 8
If MARR≥11%,Choose X
If 11%≥MARR≥3.5%,Choose Z
If 2%≥MARR≥0%,Choose Y
IRRZ-X=11%IRRY-Z=3.5%
IRRX=23%

Copyright Oxford University Press 2009
(8,000)
(6,000)
(4,000)
(2,000)
0
2,000
4,000
6,000
8,000
10,000
0% 5% 10% 15% 20% 25%
i
NPW
Example 8-6 Incremental Analysis using Graphical Comparison
A B C D EInitial Cost $4000 $2000 $6000 $1000 $9000Uniform Annual Benefit 639 410 761 117 785
If MARR≥20%, Choose Do-Nothing
If 20%≥MARR≥11%,Choose B
If 11%≥MARR≥2%,Choose A
If 2%≥MARR≥0%,Choose C
IRRA-B=11%
IRRC-A=2%
IRRB=20%

Copyright Oxford University Press 2009
Example 8-7 Incremental Analysis using Pair-wise Comparisons
A B C D EInitial Cost $4000 $2000 $6000 $1000 $9000Uniform Annual Benefit 639 410 761 117 785
1. Rearrange the alternatives in order of increasing costD B A C E
Initial Cost $1000 $2000 $4000 $6000 $9000Uniform Annual Benefit 117 410 639 761 785
2. Calculate IRR of the least expensive alternative to see if it is better than “Do Nothing” at MARR of 10%
PWD = 0 = -$1000 + $117 (P/A, IRRD, 20)
IRRD = 9.94% < 10%
“Do Nothing” is preferred, and is still the “Defender.”
Copyright Oxford University Press 2009
Example 8-7 Incremental Analysis using Pair-wise Comparisons
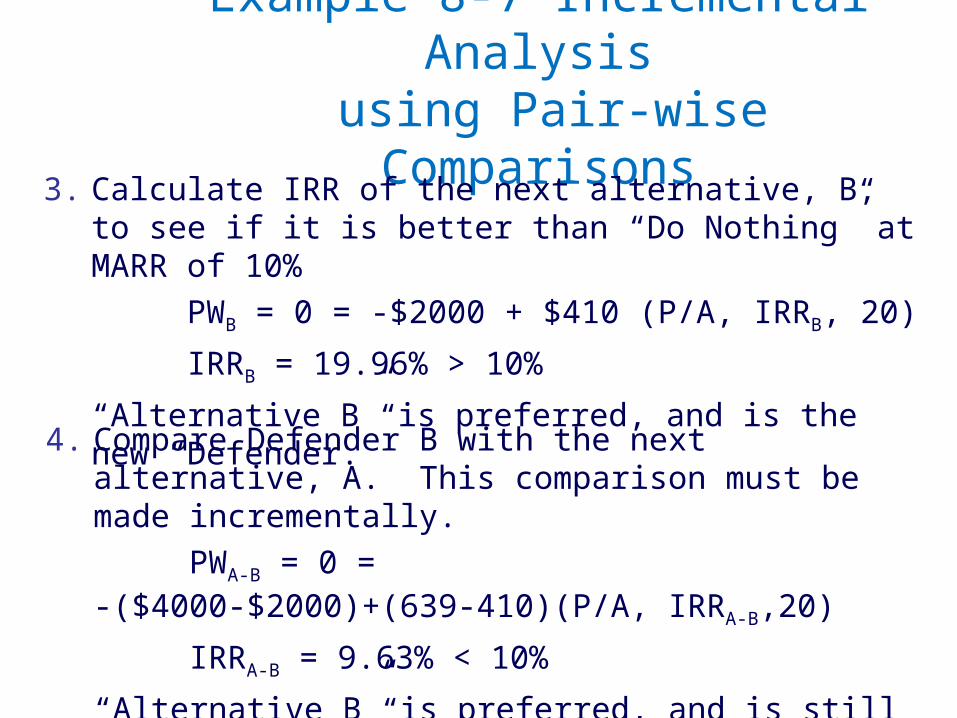
3. Calculate IRR of the next alternative, B, to see if it is better than “Do Nothing” at MARR of 10%
PWB = 0 = -$2000 + $410 (P/A, IRRB, 20)
IRRB = 19.96% > 10%
“Alternative B” is preferred, and is the new “Defender.”
4. Compare Defender B with the next alternative, A. This comparison must be made incrementally.
PWA-B = 0 = -($4000-$2000)+(639-410)(P/A, IRRA-
B,20)
IRRA-B = 9.63% < 10%
“Alternative B” is preferred, and is still the “Defender.”

Copyright Oxford University Press 2009
Example 8-7 Incremental Analysis using Pair-wise Comparisons
6. Compare Defender B with the next alternative, E. This comparison must be made incrementally.
PWE-B = 0 = -($9000-$2000)+(785-410)(P/A, IRRE-
B,20)
IRRE-B = 0.67% < 10%
“Alternative B” is preferred, and is the final selection.
5. Compare Defender B with the next alternative, C. This comparison must be made incrementally.
PWC-B = 0 = -($6000-$2000)+(761-410)(P/A, IRRC-
B,20)
IRRC-B = 6.08% < 10%
“Alternative B” is preferred and is still the “Defender.”

Copyright Oxford University Press 2009
1. Identify all alternatives.2. Construct an NPW or EUAW graph showing all
alternatives on the same axes. 3. Examine the line of maximum values and
determine which alternative create it, and over what range.
4. Determine the changeover point.5. Create a choice table to summarize the
information.
Elements in Comparing Mutually Exclusive Alternatives

Copyright Oxford University Press 2009
• All analysis methods provide consistent solutions.• Rate of Return Analysis
• Easier to explain• Most frequently used• More difficult to calculate (without spreadsheet) • Does not require a Minimum Attractive Rate of
Return in calculation• Present Worth or Annual Cash Flow Analysis
• Require a known Minimum Attractive Rate of Return in calculation
• Easier to calculate (without spreadsheet)
Choosing an Analysis Method