copyright taylor & francis group. do not distribute. 7 the
TRANSCRIPT

113
7 The Role of VegetarianDiets in Weight Management
Celine E. Heskey
CONTENTS
Summary ................................................................................................................ 1147.1 Introduction .................................................................................................. 114
7.1.1 Overweight and Obesity ................................................................... 1147.1.1.1 Prevalence .......................................................................... 1147.1.1.2 Link to Morbidity and Mortality ....................................... 114
7.1.2 Weight Management ......................................................................... 1157.1.2.1 Current Recommendations ................................................ 115
7.1.3 Why a Plant-Based Diet May Reduce the Prevalence of Overweight or Obesity .................................................................. 116
7.2 Observational Studies Examining the Relationship between Plant-Based Dietary Patterns and Measures of Adiposity ................................................ 1167.2.1 Studies on Seventh-Day Adventists .................................................. 1167.2.2 Studies on North American Populations .......................................... 1367.2.3 Studies on European Populations ..................................................... 1367.2.4 Studies on Other Populations ........................................................... 1387.2.5 Findings of Body Composition Analyses ......................................... 1387.2.6 Conclusions ....................................................................................... 140
7.3 Intervention Studies Examining the Effect of Plant-Based Diets on Measures of Adiposity ............................................................................. 1407.3.1 Studies in Individuals with a History of Diabetes ............................ 1417.3.2 Studies in Individuals with a History of Rheumatoid Arthritis ....... 157
7.4 Conclusion .................................................................................................... 1597.4.1 Mechanisms ...................................................................................... 159
7.4.1.1 Nutrient Intake Trends in Plant-Based Patterns ................. 1597.4.1.2 Implications of Dietary Patterns on Gut Microbiota ......... 1607.4.1.3 Satiety ................................................................................ 161
7.4.2 Research Gaps .................................................................................. 161References .............................................................................................................. 161
Copyright Taylor & Francis Group. Do Not Distribute.

114 Vegetarian Nutrition and Wellness
SUMMARY
Historically, observational studies have set the foundation for a relationship between plant-based dietary patterns and healthy weight status. Vegetarians, especially veg-ans, tend to weigh less than nonvegetarians and have a lower prevalence of overweight or obesity. Multiple studies, utilizing vegan and vegetarian dietary interventions, have demonstrated that plant-based diets may be successfully utilized in weight management treatment of overweight or obese individuals. Reduced energy, fat, and animal protein intake, and increased carbohydrate, fiber, whole grain, fruit, vegetable, and phytochemi-cal intake, help to explain some of the weight management benefits of these patterns.
7.1 INTRODUCTION
7.1.1 oVerWeight anD obeSity
Overweight and obesity are global issues with significant health implications. Excess body weight has been linked to increased risk of chronic diseases, including cardio-vascular disease and diabetes mellitus (Bastien et al., 2014). Excess abdominal fat, particularly visceral adipose tissue, contributes to the etiological pathway of car-diometabolic risk factor aberrations, including insulin resistance, dyslipidemia, and hypertension (HTN) (Bastien et al., 2014).
The definition of adiposity based on body mass index (BMI) (kg/m2), in most adult populations, is as follows: (1) underweight, <18.5 kg/m2; normal weight, 18.5–24.9 kg/m2; (2) overweight, 25–29.9 kg/m2; and (3) obese, ≥30 kg/m2 (CDC, 2016d; WHO, 2016). Abdominal obesity can be assessed by measuring waist circumference. Individuals are considered to have abdominal obesity if their waist circumference is >88 cm for women or >102 cm for men (Bastien et al., 2014). Waist-to-hip ratio has also been used to assess disease risk, as it relates to abdominal obesity, but this mea-surement has been found to be a poor predictor of chronic disease in women (Lee and Nieman, 2013). Waist-to-hip ratios that are linked to increased disease risk are ≥0.8 for women and ≥0.9 for men (Lee and Nieman, 2013). Other ways that researchers can measure or estimate body composition (including excess adiposity) include using skinfold thickness measurements, air displacement plethysmography, bioelectrical impedance analysis (BIA), dual-energy x-ray absorptiometry (DXA), and magnetic resonance imaging (MRI), to determine percent body fat, fat mass, and fat-free mass (Lee and Nieman, 2013; CDC, 2016d). In regard to percent body fat, the ideal ranges are 6%–24% for men and 9%–31% for women (Lee and Nieman, 2013).
7.1.1.1 PrevalenceAccording to the Centers for Disease Control (CDC), the prevalence of obesity in the United States is 36.5% in adults and 17% in children and adolescents (CDC, 2016a, 2016b). Worldwide the prevalence of overweight and obesity in adults is 39% and 18%, respectively (WHO, 2016).
7.1.1.2 Link to Morbidity and MortalityOverweight and obesity are risk factors for several of the top 10 causes of death in the United States, including heart disease, certain cancers, stroke, and diabetes
Copyright Taylor & Francis Group. Do Not Distribute.
115The Role of Vegetarian Diets in Weight Management
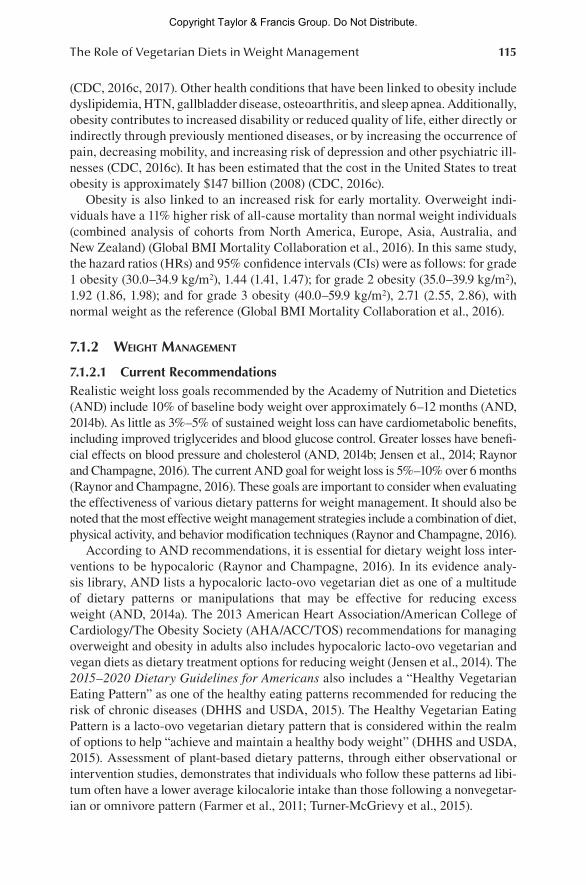
(CDC, 2016c, 2017). Other health conditions that have been linked to obesity include dyslipidemia, HTN, gallbladder disease, osteoarthritis, and sleep apnea. Additionally, obesity contributes to increased disability or reduced quality of life, either directly or indirectly through previously mentioned diseases, or by increasing the occurrence of pain, decreasing mobility, and increasing risk of depression and other psychiatric ill-nesses (CDC, 2016c). It has been estimated that the cost in the United States to treat obesity is approximately $147 billion (2008) (CDC, 2016c).
Obesity is also linked to an increased risk for early mortality. Overweight indi-viduals have a 11% higher risk of all-cause mortality than normal weight individuals (combined analysis of cohorts from North America, Europe, Asia, Australia, and New Zealand) (Global BMI Mortality Collaboration et al., 2016). In this same study, the hazard ratios (HRs) and 95% confidence intervals (CIs) were as follows: for grade 1 obesity (30.0–34.9 kg/m2), 1.44 (1.41, 1.47); for grade 2 obesity (35.0–39.9 kg/m2), 1.92 (1.86, 1.98); and for grade 3 obesity (40.0–59.9 kg/m2), 2.71 (2.55, 2.86), with normal weight as the reference (Global BMI Mortality Collaboration et al., 2016).
7.1.2 Weight management
7.1.2.1 Current RecommendationsRealistic weight loss goals recommended by the Academy of Nutrition and Dietetics (AND) include 10% of baseline body weight over approximately 6–12 months (AND, 2014b). As little as 3%–5% of sustained weight loss can have cardiometabolic benefits, including improved triglycerides and blood glucose control. Greater losses have benefi-cial effects on blood pressure and cholesterol (AND, 2014b; Jensen et al., 2014; Raynor and Champagne, 2016). The current AND goal for weight loss is 5%–10% over 6 months (Raynor and Champagne, 2016). These goals are important to consider when evaluating the effectiveness of various dietary patterns for weight management. It should also be noted that the most effective weight management strategies include a combination of diet, physical activity, and behavior modification techniques (Raynor and Champagne, 2016).
According to AND recommendations, it is essential for dietary weight loss inter-ventions to be hypocaloric (Raynor and Champagne, 2016). In its evidence analy-sis library, AND lists a hypocaloric lacto-ovo vegetarian diet as one of a multitude of dietary patterns or manipulations that may be effective for reducing excess weight (AND, 2014a). The 2013 American Heart Association/American College of Cardiology/The Obesity Society (AHA/ACC/TOS) recommendations for managing overweight and obesity in adults also includes hypocaloric lacto-ovo vegetarian and vegan diets as dietary treatment options for reducing weight (Jensen et al., 2014). The 2015–2020 Dietary Guidelines for Americans also includes a “Healthy Vegetarian Eating Pattern” as one of the healthy eating patterns recommended for reducing the risk of chronic diseases (DHHS and USDA, 2015). The Healthy Vegetarian Eating Pattern is a lacto-ovo vegetarian dietary pattern that is considered within the realm of options to help “achieve and maintain a healthy body weight” (DHHS and USDA, 2015). Assessment of plant-based dietary patterns, through either observational or intervention studies, demonstrates that individuals who follow these patterns ad libi-tum often have a lower average kilocalorie intake than those following a nonvegetar-ian or omnivore pattern (Farmer et al., 2011; Turner-McGrievy et al., 2015).
Copyright Taylor & Francis Group. Do Not Distribute.

116 Vegetarian Nutrition and Wellness
7.1.3 Why a Plant-baSeD Diet may reDuce the PreValence of oVerWeight or obeSity
Plant-based diets have often been found to be high in fiber (Key et al., 1999, 2006; Farmer et al., 2011), which may help to increase satiety, thereby decreasing kilo-calorie intake. Additionally, individuals who follow plant-based diets, particu-larly vegan diets, often consume less kilocalories and fat, while consuming higher amounts of phytochemicals and nutrient-dense foods, including fruits, vegetables, whole grains, legumes, and nuts (Key et al., 1999; Farmer et al., 2011; do Rosario et al., 2016). Additionally, fruits and vegetables are good sources of inulin-like fructans, which can affect gut microbiota in ways that impact adiposity (Delzenne et al., 2011).
7.2 OBSERVATIONAL STUDIES EXAMINING THE RELATIONSHIP BETWEEN PLANT-BASED DIETARY PATTERNS AND MEASURES OF ADIPOSITY
Various cohorts, in a variety of countries, have been used to examine the differences in weight and adiposity measures across dietary patterns. More than 60 publications have reported weight differences by dietary patterns (including plant based) for the past five decades. Associations between plant-based dietary patterns and measures of adiposity may help to assert that there is a relationship between vegetarian diets and a reduced risk or prevalence of overweight or obesity. Relevant findings of these studies are reported in Table 7.1.
7.2.1 StuDieS on SeVenth-Day aDVentiStS
Seventh-day Adventists (SDAs) comprise a unique population that, due to religious-related health beliefs and dietary habits, has been studied quite consistently over several decades. A substantial proportion of church members follow a plant-based dietary pattern, which ranges from vegan to semivegetarian, and health benefits have been observed for those members who follow such patterns (Key et al., 1999; Le and Sabate, 2014).
Early reports include several publications on Australian SDA members in the late 1970s to early 1980s. Several of these studies revealed that SDA vegetarians tend to weigh less than nonvegetarians (typically non-SDAs) (Armstrong et al., 1977, 1979; Simons et al., 1978). Assessment of weight without consideration of height is not very meaningful, but other studies have included measurements of relative weight, like BMI, which provide a better assessment of comparisons between groups. In 1981, Armstrong published results of a comparison of BMI between vegetarian and non-vegetarian postmenopausal women, but this comparison was not significantly differ-ent (Armstrong et al., 1981). Among male subjects in a 1983 comparison, BMI was significantly lower in lacto-ovo vegetarians (22.9 kg/m2) than in SDA nonvegetarians (24.7 kg/m2) and Mormon nonvegetarians (25.1 kg/m2) (Rouse et al., 1983). Among the female subjects, BMI was significantly lower in SDA vegetarians (23.3 kg/m2) than in Mormon nonvegetarians (26.3 kg/m2) (Rouse et al., 1983).
Copyright Taylor & Francis Group. Do Not Distribute.
117The Role of Vegetarian Diets in Weight Management
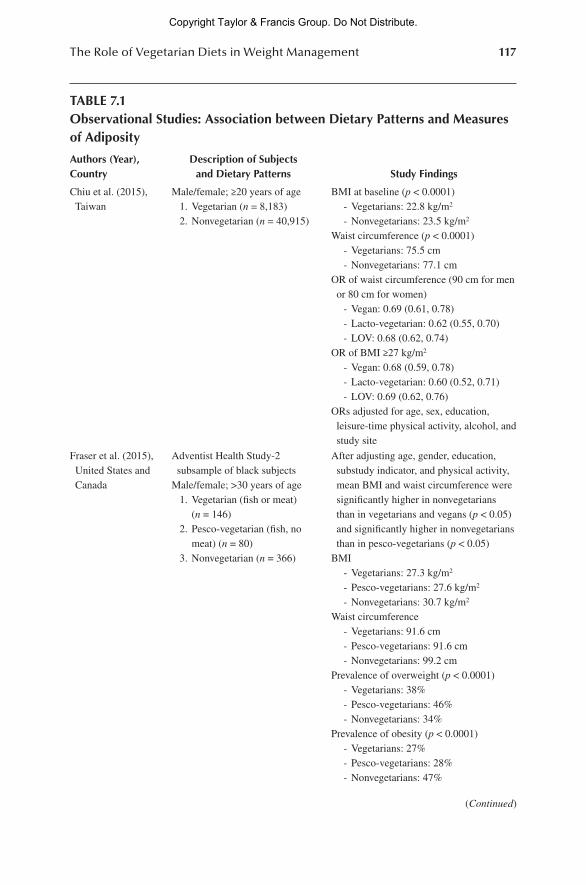
TABLE 7.1Observational Studies: Association between Dietary Patterns and Measures of Adiposity
Authors (Year), Country
Description of Subjects and Dietary Patterns Study Findings
Chiu et al. (2015), Taiwan
Male/female; ≥20 years of age 1. Vegetarian (n = 8,183) 2. Nonvegetarian (n = 40,915)
BMI at baseline (p < 0.0001) - Vegetarians: 22.8 kg/m2
- Nonvegetarians: 23.5 kg/m2
Waist circumference (p < 0.0001) - Vegetarians: 75.5 cm - Nonvegetarians: 77.1 cmOR of waist circumference (90 cm for men or 80 cm for women)
- Vegan: 0.69 (0.61, 0.78) - Lacto-vegetarian: 0.62 (0.55, 0.70) - LOV: 0.68 (0.62, 0.74)OR of BMI ≥27 kg/m2
- Vegan: 0.68 (0.59, 0.78) - Lacto-vegetarian: 0.60 (0.52, 0.71) - LOV: 0.69 (0.62, 0.76)ORs adjusted for age, sex, education, leisure-time physical activity, alcohol, and study site
Fraser et al. (2015), United States and Canada
Adventist Health Study-2 subsample of black subjects
Male/female; >30 years of age 1. Vegetarian (fish or meat)
(n = 146) 2. Pesco-vegetarian (fish, no
meat) (n = 80) 3. Nonvegetarian (n = 366)
After adjusting age, gender, education, substudy indicator, and physical activity, mean BMI and waist circumference were significantly higher in nonvegetarians than in vegetarians and vegans (p < 0.05) and significantly higher in nonvegetarians than in pesco-vegetarians (p < 0.05)
BMI - Vegetarians: 27.3 kg/m2
- Pesco-vegetarians: 27.6 kg/m2
- Nonvegetarians: 30.7 kg/m2
Waist circumference - Vegetarians: 91.6 cm - Pesco-vegetarians: 91.6 cm - Nonvegetarians: 99.2 cmPrevalence of overweight (p < 0.0001) - Vegetarians: 38% - Pesco-vegetarians: 46% - Nonvegetarians: 34%Prevalence of obesity (p < 0.0001) - Vegetarians: 27% - Pesco-vegetarians: 28% - Nonvegetarians: 47%
(Continued)
Copyright Taylor & Francis Group. Do Not Distribute.
118 Vegetarian Nutrition and Wellness
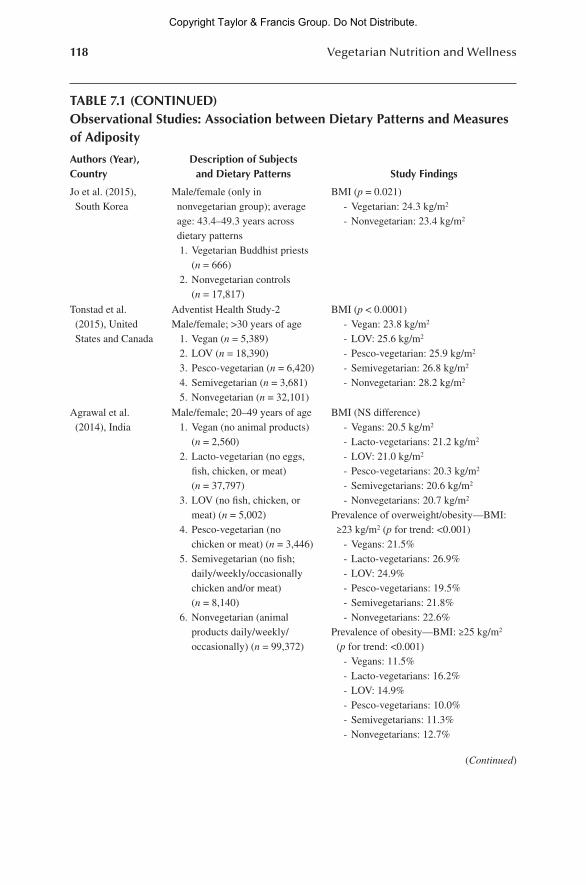
TABLE 7.1 (CONTINUED)Observational Studies: Association between Dietary Patterns and Measures of Adiposity
Authors (Year), Country
Description of Subjects and Dietary Patterns Study Findings
Jo et al. (2015), South Korea
Male/female (only in nonvegetarian group); average age: 43.4–49.3 years across dietary patterns
1. Vegetarian Buddhist priests (n = 666)
2. Nonvegetarian controls (n = 17,817)
BMI (p = 0.021) - Vegetarian: 24.3 kg/m2
- Nonvegetarian: 23.4 kg/m2
Tonstad et al. (2015), United States and Canada
Adventist Health Study-2Male/female; >30 years of age 1. Vegan (n = 5,389) 2. LOV (n = 18,390) 3. Pesco-vegetarian (n = 6,420) 4. Semivegetarian (n = 3,681) 5. Nonvegetarian (n = 32,101)
BMI (p < 0.0001) - Vegan: 23.8 kg/m2
- LOV: 25.6 kg/m2
- Pesco-vegetarian: 25.9 kg/m2
- Semivegetarian: 26.8 kg/m2
- Nonvegetarian: 28.2 kg/m2
Agrawal et al. (2014), India
Male/female; 20–49 years of age 1. Vegan (no animal products)
(n = 2,560) 2. Lacto-vegetarian (no eggs,
fish, chicken, or meat) (n = 37,797)
3. LOV (no fish, chicken, or meat) (n = 5,002)
4. Pesco-vegetarian (no chicken or meat) (n = 3,446)
5. Semivegetarian (no fish; daily/weekly/occasionally chicken and/or meat) (n = 8,140)
6. Nonvegetarian (animal products daily/weekly/occasionally) (n = 99,372)
BMI (NS difference) - Vegans: 20.5 kg/m2
- Lacto-vegetarians: 21.2 kg/m2
- LOV: 21.0 kg/m2
- Pesco-vegetarians: 20.3 kg/m2
- Semivegetarians: 20.6 kg/m2
- Nonvegetarians: 20.7 kg/m2
Prevalence of overweight/obesity—BMI: ≥23 kg/m2 (p for trend: <0.001)
- Vegans: 21.5% - Lacto-vegetarians: 26.9% - LOV: 24.9% - Pesco-vegetarians: 19.5% - Semivegetarians: 21.8% - Nonvegetarians: 22.6%Prevalence of obesity—BMI: ≥25 kg/m2 (p for trend: <0.001)
- Vegans: 11.5% - Lacto-vegetarians: 16.2% - LOV: 14.9% - Pesco-vegetarians: 10.0% - Semivegetarians: 11.3% - Nonvegetarians: 12.7%
(Continued)
Copyright Taylor & Francis Group. Do Not Distribute.

119The Role of Vegetarian Diets in Weight Management
TABLE 7.1 (CONTINUED)Observational Studies: Association between Dietary Patterns and Measures of Adiposity
Authors (Year), Country
Description of Subjects and Dietary Patterns Study Findings
BMI: ≥30 kg/m2 (p for trend: <0.001) - Vegans: 2.3% - Lacto-vegetarians: 3.6% - LOV: 3.0% - Pesco-vegetarians: 1.7% - Semivegetarians: 1.6% - Nonvegetarians: 2.4%
Clarys et al. (2014), Belgium
Male/female; ≥20 years of age 1. Vegan (no animal products)
(n = 104) 2. Vegetarian (no meat or fish)
(n = 573) 3. Pesco-vegetarian (fish but no
meat) (n = 145) 4. Semivegetarian (red meat,
poultry, or fish ≤1/week) (n = 498)
5. Nonvegetarians (meat or fish almost every day) (n = 155)
Prevalence of overweight - Vegans: 10.6% - Vegetarians: 14.7% - Semivegetarians: 17.1% - Pesco-vegetarians: 15.9% - Nonvegetarians: 20.6%Prevalence of obesity - Vegans: 1.9% - Vegetarians: 3.5% - Semivegetarians: 2.4% - Pesco-vegetarians: 3.4% - Nonvegetarians: 8.4%
Gadgil et al. (2014), United States
Atherosclerosis in South Asians Living in America Study
Male/female; 45–84 years of age 1. Vegetarian (n = 59) 2. Nonvegetarian (n = 91)
BMI (p = 0.30) - Vegetarian: 25.8 kg/m2
- Nonvegetarian: 26.6 kg/m2
Singh et al. (2014), United States
Adventist Health Study-2 subsample of Asian Indian subjects
Male/female; >30 years of age 1. Vegan (n = 9) 2. LOV (n = 44) 3. Pesco-vegetarian (n = 35) 4. Semivegetarian (n = 14) 5. Nonvegetarian (n = 119)
Prevalence of overweight/obesity (BMI >23 kg/m2)
- Vegan: ~55% - LOV: ~50% - Pesco-vegetarian: ~58% - Semivegetarian: ≥80% - Nonvegetarian: ≥80%
Baig et al. (2013), Pakistan
Male/female; 20–80 years of age 1. Vegetarian (n = 83) 2. Nonvegetarian (n = 93)
BMI (p = 0.027) - Vegetarians: 20.43 kg/m2
- Nonvegetarians: 21.24 kg/m2
(Continued)
Copyright Taylor & Francis Group. Do Not Distribute.

120 Vegetarian Nutrition and Wellness
TABLE 7.1 (CONTINUED)Observational Studies: Association between Dietary Patterns and Measures of Adiposity
Authors (Year), Country
Description of Subjects and Dietary Patterns Study Findings
Orlich et al. (2013), Orlich and Fraser (2014), United States and Canada
Adventist Health Study-2Male/female; average age: 57 years
1. Vegan (n = 5,548) 2. LOV (n = 21,177) 3. Pesco-vegetarian (n = 7,194) 4. Semivegetarian (n = 4,031) 5. Nonvegetarian (n = 35,359)
Age, sex, and race standardized average BMI
- Vegans: 24.1 kg/m2
- LOV: 26.1 kg/m2
- Pesco-vegetarians: 26.0 kg/m2
- Semivegetarians: 27.3 kg/m2
- Nonvegetarians: 28.3 kg/m2
Ho-Pham et al. (2012), Vietnam
Female; average age: ~60 years 1. Vegan nuns (n = 88) 2. Nonvegetarian regional
residents (n = 93)
BMI (NS difference) - Vegans: 24 kg/m2
- Nonvegetarians: 24 kg/m2
NS difference in weight, lean mass, fat mass, and percent body mass between vegans and nonvegetarians
Timko et al. (2012), United States
Male/female; average age: 24.9 years
1. Vegan (no animal products) (n = 35)
2. Vegetarian (n = 111) 3. Semivegetarian (occasional
consumption of fish and/or poultry) (n = 75)
4. Nonvegetarian (consumption of various animal foods) (n = 265)
BMI (p < 0.01) - Vegans: 21.29 kg/m2
- Vegetarians: 23.79 kg/m2
- Semivegetarians: 23.92 kg/m2
- Nonvegetarians: 24.49 kg/m2
Rizzo et al. (2011), United States and Canada
Adventist Health Study-2 substudy
Male/female; average age: 60 years; n = 773
1. Vegetarians (meat, poultry, or fish <1 time/month)
2. Semivegetarians (fish whenever but other meat <1 time/month or total meat ≥1/month and <1/week)
3. Nonvegetarians (meat or poultry ≥1 time/month and total meat ≥1 time/week)
BMI (p < 0.001) - Vegetarians: 25.7 kg/m2
- Semivegetarians: 27.6 kg/m2
- Nonvegetarians: 29.9 kg/m2
Waist circumference was significantly lower in vegetarians and semivegetarians than in nonvegetarians (p < 0.0001; data n/a)
Adjusted for age, gender, ethnicity, smoking, alcohol intake, physical activity, and kilocalorie intake
(Continued)
Copyright Taylor & Francis Group. Do Not Distribute.

121The Role of Vegetarian Diets in Weight Management
TABLE 7.1 (CONTINUED)Observational Studies: Association between Dietary Patterns and Measures of Adiposity
Authors (Year), Country
Description of Subjects and Dietary Patterns Study Findings
Karelis et al. (2010), Finland
Female; average age: 47.0–47.7 years across dietary patterns
1. Vegetarian (n = 21) 2. Age-matched nonvegetarian
(n = 41)
BMI (p < 0.05) - Vegetarians: 21.7 kg/m2
- Nonvegetarians: 23.8 kg/m2
Lee and Krawinkel (2009), South Korea
Female; average age: 30.4–31.4 years old across dietary patterns
1. Vegetarian Buddhist nuns (n = 54)
2. Nonvegetarian Catholic nuns (n = 31)
(diets probably not that different)
BMI (p = 0.010) - Vegetarians: 22.6 kg/m2
- Nonvegetarians: 20.7 kg/m2
Weight, fat-free mass, and body fat were also significantly higher in vegetarians than in nonvegetarians (p < 0.05 for all comparisons)
There was a higher prevalence of underweight in the nonvegetarian group
Baines et al. (2007), Australia
Australia Longitudinal Study on Women’s Health; 22–27 years of age
1. Vegetarian (no red meat, fish, or poultry) (n = 252)
2. Semivegetarian (no red meat) n = 827
3. Nonvegetarian n = 8,034
BMI - Vegetarians: 22.2 kg/m2 (21.7–22.7) - Semivegetarians: 23.0 kg/m2
(22.7–23.3) - Nonvegetarians: 23.7 kg/m2
(23.6–23.8)Prevalence of overweight—BMI >25–30 kg/m2 (p < 0.001)
- Vegetarians: 12.4% - Semivegetarians: 15.4% - Nonvegetarians: 19.1%Prevalence of obesity—BMI >30 kg/m2 (p < 0.001)
- Vegetarians: 3.4% - Semivegetarians: 7.4% - Nonvegetarians: 10.3%
Fontana et al. (2007), United States
Male/female; average age: 53.1–53.2 years across dietary patterns
1. Low-kilocalorie, low-protein vegan (n = 21)
2. Age-, gender-, and height- matched Western diet (n = 21)
BMI (p ≤ 0.002) - Vegans: 21.3 kg/m2
- Western diet: 26.5 kg/m2
Percent body fat—women (p ≤ 0.002) - Vegans: 26.9% - Western diet: 42.3%Percent body fat—men (p ≤ 0.002) - Vegans: 13.7% - Western diet: 21.0%NS difference in lean body mass
(Continued)
Copyright Taylor & Francis Group. Do Not Distribute.

122 Vegetarian Nutrition and Wellness
TABLE 7.1 (CONTINUED)Observational Studies: Association between Dietary Patterns and Measures of Adiposity
Authors (Year), Country
Description of Subjects and Dietary Patterns Study Findings
Rosell et al. (2006), United Kingdom
EPIC-OxfordMale/female; ≥20 years of age 1. Vegan (no food of animal
origin) (n = 609) 2. Vegetarian (no meat or fish)
(n = 5,277) 3. Pesco-vegetarian (fish, no
meat) (n = 2,504) 4. Nonvegetarian (n = 10,784)
Increase of BMI/year—women (p = 0.017) - Vegans: 0.12 kg/m2
- Vegetarians: 0.15 kg/m2
- Pesco-vegetarians: 0.12 kg/m2
- Nonvegetarians: 0.15 kg/m2
Increase of BMI/year—men (NS) - Vegans: 0.10 kg/m2
- Vegetarians: 0.12 kg/m2
- Pesco-vegetarians: 0.12 kg/m2
- Nonvegetarians: 0.12 kg/m2
Alewaeters et al. (2005), Belgium
Male/female; ≥20 years of age 1. Vegetarian (n = 326) 2. Nonvegetarian (n = 9,659)
BMI—women (p < 0.001) - Vegetarians: 22.1 kg/m2
- Nonvegetarians: 24.6 kg/m2
BMI—men (p < 0.001) - Vegetarians: 22.6 kg/m2
- Nonvegetarians: 25.7 kg/m2
Bedford and Barr (2005), Canada
British Columbia Nutrition Survey
Male/female; 19–84 years of age 1. Vegetarian 2. Nonvegetarian
BMI—women (p < 0.001) - Vegetarians: 23.1 kg/m2
- Nonvegetarians: 25.7 kg/m2
BMI—men (NS difference) - Vegetarians: 25.9 kg/m2
- Nonvegetarians: 26.7 kg/m2
Prevalence of overweight in women (p = 0.001)
- Vegetarians: 12.7% - Nonvegetarians: 21.2%Prevalence of overweight in men (NS) - Vegetarians: 35.5% - Nonvegetarians: 31.6%Prevalence of obesity in women (p = 0.001)
- Vegetarians: 4.2% - Nonvegetarians: 18.1%Prevalence of obesity in men (NS) - Vegetarians: 12.9% - Nonvegetarians: 19.4%Vegetarian women had a significantly lower waist circumference than nonvegetarian women (79.8 cm vs. 75.0 cm)
The comparison between men was NSAnalyses were age-adjusted
(Continued)
Copyright Taylor & Francis Group. Do Not Distribute.

123The Role of Vegetarian Diets in Weight Management
TABLE 7.1 (CONTINUED)Observational Studies: Association between Dietary Patterns and Measures of Adiposity
Authors (Year), Country
Description of Subjects and Dietary Patterns Study Findings
Newby et al. (2005), Sweden
Swedish Mammography CohortFemale; average age: 51.1–54.8 years across categories of dietary patterns
1. Vegan (no meat, poultry, fish, eggs, or dairy) (n = 83)
2. Lacto-vegetarian (no meat, poultry, fish, or eggs) (n = 159)
3. Semivegetarian (sometimes consume fish or eggs, but mainly LOV) (n = 960)
4. Nonvegetarian (n = 54,257)
BMI was also significantly higher in omnivores than in vegans, lacto-vegetarians, and semivegetarians (p < 0.005)
- Vegans: 23.3 kg/m2
- Lacto-vegetarians: 23.4 kg/m2
- Semivegetarians: 23.6 kg/m2
- Nonvegetarians: 24.7 kg/m2
Prevalence of overweight (p < 0.0001) - Vegans: 23% - Lacto-vegetarians: 21% - Semivegetarians: 24% - Nonvegetarians: 30%Prevalence of obesity (p < 0.0001) - Vegans: 6% - Lacto-vegetarians: 4% - Semivegetarians: 5% - Nonvegetarians: 10%The average weight of omnivores was significantly higher than the weight of semivegetarians, lacto-vegetarians, and vegans (p < 0.05)
Rosell et al. (2005), United Kingdom
EPIC-OxfordMale/female; ≥20 years of age 1. Lifelong vegetarian (n =
379) 2. Became vegetarian 1–9
years old (n = 328) 3. Became vegetarian 10–14
years old (n = 1,160) 4. Became vegetarian 15–19
years old (n = 2,764) 5. Became vegetarian ≥20
years old (n = 10,891) 6. Nonvegetarian (n = 29,250)
BMI—women (p < 0.001) - Lifelong vegetarian: 23.7 kg/m2
- Became vegetarian 1–9 years old: 23.9 kg/m2
- Became vegetarian 10–14 years old: 23.8 kg/m2
- Became vegetarian 15–19 years old: 23.6 kg/m2
- Became vegetarian ≥20 years old: 23.5 kg/m2
- Nonvegetarian: 23.2 kg/m2
BMI—men (p < 0.001) - Lifelong vegetarian: 24.2 kg/m2
- Became vegetarian 1–9 years old: 25.4 kg/m2
- Became vegetarian 10–14 years old: 24.4 kg/m2
(Continued)
Copyright Taylor & Francis Group. Do Not Distribute.

124 Vegetarian Nutrition and Wellness
TABLE 7.1 (CONTINUED)Observational Studies: Association between Dietary Patterns and Measures of Adiposity
Authors (Year), Country
Description of Subjects and Dietary Patterns Study Findings
- Became vegetarian 15–19 years old: 24.2 kg/m2
- Became vegetarian ≥20 years old: 24.3 kg/m2
- Nonvegetarian: 25.2 kg/m2
Reference = became vegetarian ≥20 years of age
Compared with reference nonvegetarians, differed p < 0.0001 for both sexes
Those becoming vegetarian 1–9 years of age differed for men p < 0.01
Those becoming vegetarian 10–14 years of age differed for women p < 0.01
Cade et al. (2004), United Kingdom
UK Women’s Cohort Study; 35–69 years of age
1. Vegetarians (meat or fish <1 time/week) (n = 6,478)
2. Oily fish eaters (oily fish 2–4 times/week, meat <1 time/week) (n = 870)
3. Other fish eaters (fish ≥1 time/week, oily fish <2–4 times/week, meat <1/week) (n = 6,478)
4. Nonvegetarians (meat >1 time/week) (n = 23,738)
BMI - Vegetarians: 23.3 kg/m2
- Oily fish eaters: 23.3 kg/m2
- Other fish eaters: 23.2 kg/m2
- Nonvegetarians: 25.0 kg/m2
Brathwaite et al. (2003), Barbados
SDAMale/female; 18–74 years of age 1. Self-identified vegetarians 2. FFQ defined vegetarians 3. Self-identified
nonvegetarians 4. FFQ-defined vegetarians
OR of being obese was greater for nonvegetarians: 1.70 (1.02, 2.83)
NS difference is BMI, waist or hip circumference, or waist-to-hip ratio between groups
Self-reported vegetarians >5 years had a significantly lower prevalence of overweight and obesity (p < 0.05)
(Continued)
Copyright Taylor & Francis Group. Do Not Distribute.

125The Role of Vegetarian Diets in Weight Management
TABLE 7.1 (CONTINUED)Observational Studies: Association between Dietary Patterns and Measures of Adiposity
Authors (Year), Country
Description of Subjects and Dietary Patterns Study Findings
Davey et al. (2003), United Kingdom
EPIC-OxfordMale/female; >20 years of age 1. Vegan (no food of animal
origin) (n = 2,596) 2. Vegetarian (no meat or fish)
(n = 18,840) 3. Pesco-vegetarian (fish, no
meat) (10,110) 4. Nonvegetarian (n = 33,883)
BMI—women - Vegans: 21.9 kg/m2
- Vegetarians: 22.7 kg/m2
- Pesco-vegetarians: 22.9 kg/m2
- Nonvegetarian: 24.3 kg/m2
BMI—men - Vegans: 22.5 kg/m2
- Vegetarians: 23.5 kg/m2
- Pesco-vegetarians: 23.6 kg/m2
- Nonvegetarians: 24.9 kg/m2
Prevalence of obesity in women 20–65 years of age
- Vegans: 2.5% - Vegetarians: 4.5% - Pesco-vegetarians: 4.4% - Nonvegetarians: 9.3%Prevalence of obesity in men 20–65 years of age
- Vegans: 1.6% - Vegetarians: 3.5% - Pesco-vegetarians: 3.0% - Nonvegetarians: 7.1%
Spencer et al. (2003), United Kingdom
EPIC-OxfordMale/female; 20–97 years of age 1. Vegans (no meat, fish, eggs,
or dairy) (n = 1,553) 2. Vegetarians (no meat or fish)
(n = 12,307) 3. Pesco-vegetarians (fish, no
meat) (n = 6,191) 4. Nonvegetarians (n = 17,824)
Age-, lifestyle-, and dietary factor–adjusted BMI (95% CI)—women
- Vegans: 22.56 kg/m2 (22.32, 22.79) - Vegetarians: 22.96 kg/m2 (22.88,
23.04) - Pesco-vegetarians: 22.83 kg/m2
(22.73, 22.92) - Nonvegetarians: 23.23 kg/m2 (23.17,
23.31)Age-, lifestyle-, and dietary factor–adjusted BMI (95% CI)—men
- Vegans: 23.12 kg/m2 (22.83, 23.43) - Vegetarians: 23.67 kg/m2 (23.54,
23.80) - Pesco-vegetarians: 23.45 kg/m2
(23.27, 23.64) - Nonvegetarians: 24.09 kg/m2 (23.97,
24.20)
(Continued)
Copyright Taylor & Francis Group. Do Not Distribute.

126 Vegetarian Nutrition and Wellness
TABLE 7.1 (CONTINUED)Observational Studies: Association between Dietary Patterns and Measures of Adiposity
Authors (Year), Country
Description of Subjects and Dietary Patterns Study Findings
Waldmann et al. (2003), Germany
German Vegan StudyMale/female; average age: 42.4–44.9 years across dietary patterns
1. Strict vegan (no animal food products) (n = 98)
2. Moderate vegan (eggs and dairy <5% kcal/day)
BMI (NS) - Strict vegans: 21.2 kg/m2
- Moderate vegans: 21.2 kg/m2
Percent body fat was significantly lower in strict vegans (both sexes combined and females) than in moderate vegans (p ≤ 0.05)
Waist-to-hip ratio was significantly greater in strict vegans than in moderate vegans
Hoffmann et al. (2001), Germany
Giessen Wholesome Nutrition Study
Female; 25–65 years of age 1. LOV (n = 111) 2. Low-meat eaters (n = 131) 3. Nonvegetarian controls
(n = 138)
The difference in proportions of subjects within categories of BMI was significant when comparing LOV with controls and in comparing low-meat eaters with controls (p ≤ 0.05)
Prevalence of overweight - LOV: 18% - Low-meat eaters: 18% - Nonvegetarians: 39%Prevalence of obesity - LOV: 1% - Low-meat eaters: 2% - Nonvegetarians: 9%
Kennedy et al. (2001), United States
Continuing Survey of Food Intake by Individuals (CSFII 1994–1996)
Male/female 1. Vegetarian (meat, poultry, or
fish on day of recall) (n = 643)
2. Nonvegetarian (n = 9,372)
BMI—women (p < 0.05) - Vegetarians: 24.6 kg/m2
- Nonvegetarians: 25.7 kg/m2
BMI—men (p < 0.05) - Vegetarians: 25.2 kg/m2
- Nonvegetarians: 26.4 kg/m2
Lin et al. (2001), Taiwan
Male/female; ≥50 years of age 1. Vegetarian (n = 20) 2. Nonvegetarian (n = 20)
BMI (NS difference) - Vegetarians: 23.1 kg/m2
- Nonvegetarians: 24.8 kg/m2
Barr and Broughton (2000), Canada
Premenopausal women; 18–50 years of age
1. Vegetarians (n = 90) 2. Past vegetarians (n = 35) 3. Nonvegetarians (n = 68)
BMI (NS difference) - Vegetarians: 23.2 kg/m2
- Past vegetarians: 25.3 kg/m2
- Nonvegetarians: 23.5 kg/m2
NS differences in weight or proportion within categories of BMI between vegetarians, nonvegetarians, and past vegetarians
(Continued)
Copyright Taylor & Francis Group. Do Not Distribute.

127The Role of Vegetarian Diets in Weight Management
TABLE 7.1 (CONTINUED)Observational Studies: Association between Dietary Patterns and Measures of Adiposity
Authors (Year), Country
Description of Subjects and Dietary Patterns Study Findings
Greenwood et al. (2000), United Kingdom
UK Women’s Cohort Study; 35–69 years of age
1. High-diversity vegetarians (n = 4,379)
2. Low-diversity vegetarians (n = 5,190)
3. Conservative omnivores (n = 5,946)
4. Higher-diversity, traditional omnivores (n = 4,819)
5. Traditional meat, chips, and pudding eaters (n = 6,087)
6. Health-conscious omnivores (n = 2,131)
7. Monotonous low-quantity omnivores (n = 5,416)
BMI - Groups 1 and 2: 23 - Groups 3–5, and 7: 25 - Group 6: 24Prevalence of obesity - Vegetarians: 5%–6% - Nonvegetarians: 9%–12%The mean waist-to-hip ratio ranged between 0.74 and 0.75 in all groups
Lu et al. (2000), Taiwan
Male/female; 31–45 years of age 1. Vegetarians 2. Age- and sex-matched
nonvegetarians
BMI—women for two different regions (p < 0.05)
- Vegetarians: 20.0 kg/m2; 20.7 kg/m2
- Nonvegetarians: 22.5 kg/m2; 22.0 kg/m2
BMI—men (p < 0.05) - Vegetarians: 20.8 kg/m2
- Nonvegetarians: 22.9 kg/m2
Average weight was significantly lower in vegetarians than in omnivores (p < 0.05)
Fraser (1999), United States and Canada
Adventist Health Study-1; ≥25 years of age
1. Vegetarian (no fish, poultry, or meat) (n = 17,488)
2. Semivegetarian (fish and poultry <1 time/week) (n = 12,525)
3. Nonvegetarian (n = 29,068)
BMI in women 45–64 years of age (p = 0.0001)
- Vegetarians: 23.73 kg/m2
- Semivegetarians: 24.83 kg/m2
- Nonvegetarians: 25.88 kg/m2
BMI in men 45–64 years of age (p = 0.0001)
- Vegetarians: 24.26 kg/m2
- Semivegetarians: 25.18 kg/m2
- Nonvegetarians: 26.24 kg/m2
Haddad et al. (1999), United States
Male/female; 20–60 years of age 1. Vegan (n = 25) 2. Nonvegetarian (n = 20)
BMI (p < 0.001) - Vegans: 20.5 kg/m2
- Nonvegetarians: 25.5 kg/m2
(Continued)
Copyright Taylor & Francis Group. Do Not Distribute.

128 Vegetarian Nutrition and Wellness
TABLE 7.1 (CONTINUED)Observational Studies: Association between Dietary Patterns and Measures of Adiposity
Authors (Year), Country
Description of Subjects and Dietary Patterns Study Findings
Hebbelinck et al. (1999), Belgium
Male/female; 16–30 years of age 1. LOV (n = 44)(compared with population reference value—data not shown)
BMI (NS difference from reference values) - Male: 22.1 kg/m2
- Female: 21.8 kg/m2
NS difference from reference population in terms of weight and skinfold measurements (triceps, suprailiac, calf)
Li et al. (1999), Australia
Male; age 20–50 years of age 1. Vegan (meat, eggs, or dairy
<6 times/year) (n = 18) 2. LOV (dairy and eggs; meat
<6 times/year) (n = 43) 3. Moderate-meat eaters
(<285 g/day raw weight of meat) (n = 60)
4. High-meat eaters (≥285 g/day raw weight of meat) (n = 18)
LOVs’ average BMI was significantly lower than high-meat and moderate-meat consumers (p < 0.001); similarly, the BMI in the vegan group was significantly lower than that for the moderate- and high-meat consumers (p < 0.001)
- Vegans: 23.3 kg/m2
- LOV: 23.6 kg/m2
- Moderate-meat eaters: 26.4 kg/m2
- High-meat eaters: 27.0 kg/m2
Moderate-meat eaters had a significantly higher waist-to-hip ratio (0.88) than LOV (0.86) and vegans (0.85)
Appleby et al. (1998), United Kingdom
Oxford Vegetarian StudyMale/female; 20–89 years of age 1. Vegetarian (including
pesco-vegetarians) (n = 2,847)
2. Nonvegetarians (n = 2,445)
Age-adjusted BMI—women (p < 0.0001) - Vegetarians: 21.32 kg/m2
- Nonvegetarians: 22.32 kg/m2
Age-adjusted BMI—men (p < 0.0001) - Vegetarians: 22.05 kg/m2
- Nonvegetarians: 23.18 kg/m2
Prevalence of overweight or obesity in women (p < 0.00001)
- Vegetarians: 8% - Nonvegetarians: 13%Prevalence of overweight or obesity in men (p < 0.00001)
- Vegetarians: 10% - Nonvegetarians: 21%
(Continued)
Copyright Taylor & Francis Group. Do Not Distribute.
129The Role of Vegetarian Diets in Weight Management
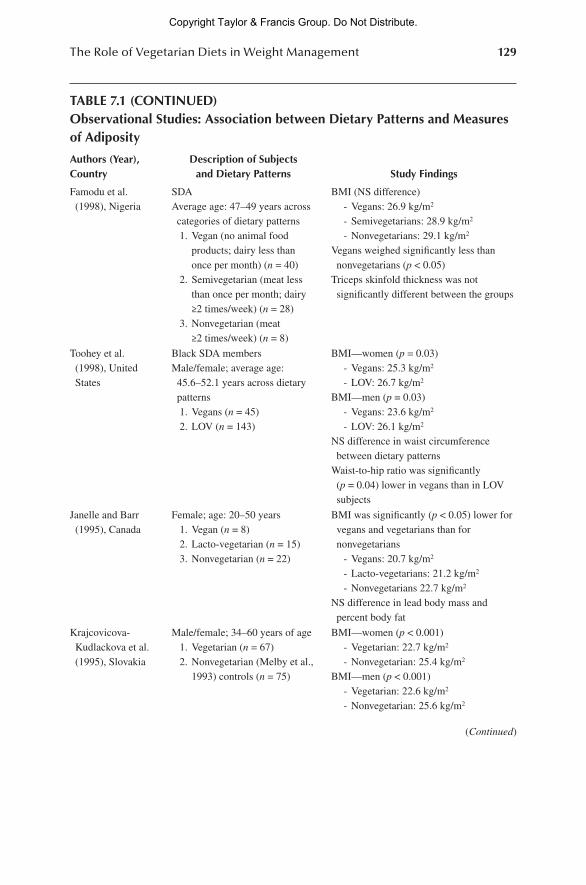
TABLE 7.1 (CONTINUED)Observational Studies: Association between Dietary Patterns and Measures of Adiposity
Authors (Year), Country
Description of Subjects and Dietary Patterns Study Findings
Famodu et al. (1998), Nigeria
SDAAverage age: 47–49 years across categories of dietary patterns
1. Vegan (no animal food products; dairy less than once per month) (n = 40)
2. Semivegetarian (meat less than once per month; dairy ≥2 times/week) (n = 28)
3. Nonvegetarian (meat ≥2 times/week) (n = 8)
BMI (NS difference) - Vegans: 26.9 kg/m2
- Semivegetarians: 28.9 kg/m2
- Nonvegetarians: 29.1 kg/m2
Vegans weighed significantly less than nonvegetarians (p < 0.05)
Triceps skinfold thickness was not significantly different between the groups
Toohey et al. (1998), United States
Black SDA membersMale/female; average age: 45.6–52.1 years across dietary patterns
1. Vegans (n = 45) 2. LOV (n = 143)
BMI—women (p = 0.03) - Vegans: 25.3 kg/m2
- LOV: 26.7 kg/m2
BMI—men (p = 0.03) - Vegans: 23.6 kg/m2
- LOV: 26.1 kg/m2
NS difference in waist circumference between dietary patterns
Waist-to-hip ratio was significantly (p = 0.04) lower in vegans than in LOV subjects
Janelle and Barr (1995), Canada
Female; age: 20–50 years 1. Vegan (n = 8) 2. Lacto-vegetarian (n = 15) 3. Nonvegetarian (n = 22)
BMI was significantly (p < 0.05) lower for vegans and vegetarians than for nonvegetarians
- Vegans: 20.7 kg/m2
- Lacto-vegetarians: 21.2 kg/m2
- Nonvegetarians 22.7 kg/m2
NS difference in lead body mass and percent body fat
Krajcovicova-Kudlackova et al. (1995), Slovakia
Male/female; 34–60 years of age 1. Vegetarian (n = 67) 2. Nonvegetarian (Melby et al.,
1993) controls (n = 75)
BMI—women (p < 0.001) - Vegetarian: 22.7 kg/m2
- Nonvegetarian: 25.4 kg/m2
BMI—men (p < 0.001) - Vegetarian: 22.6 kg/m2
- Nonvegetarian: 25.6 kg/m2
(Continued)
Copyright Taylor & Francis Group. Do Not Distribute.

130 Vegetarian Nutrition and Wellness
TABLE 7.1 (CONTINUED)Observational Studies: Association between Dietary Patterns and Measures of Adiposity
Authors (Year), Country
Description of Subjects and Dietary Patterns Study Findings
Knutsen (1994), United States
Adventist Health Study-1Male/female; ≥25 years of age 1. Vegetarian (meat, poultry, or
fish <1 time/week) (n = 15,228)
2. Nonvegetarian (n = 12,538)
BMI—women (p ≤ 0.001) - Vegetarians: 23.6 kg/m2
- Nonvegetarians: 25.2 kg/m2
BMI—men (p ≤ 0.001) - Vegetarians: 24.2 kg/m2
- Nonvegetarians: 25.7 kg/m2
Toth and Poehlman (1994), United States
1. Vegetarians (n = 17; 19–36 years of age)
2. Nonvegetarians (n = 40; 18–34 years of age)
NS differences in weight, fat mass, percent body fat, fat-free mass, sum of skinfold measurements (abdomen, axilla, biceps, calf, chest, subscapular, suprailiac, thigh, triceps), and waist-to-hip ratio
Melby et al. (1994), United States
Black SDAMale/female; average age 46–49 years across groups of dietary patterns
1. Vegetarian (no meat, fish, or poultry) (n = 66)
2. Semivegetarian (meat, fish, poultry 1–3 times/week) (n = 56)
3. Nonvegetarian (meat, fish, poultry daily) (n = 45)
BMI (NS difference) - Vegetarians: 26.8 kg/m2
- Semivegetarians: 29.2 kg/m2
- Nonvegetarians: 28.6 kg/m2
Waist circumference (p < 0.05) for vegetarians compared with semi- and nonvegetarians
- Vegetarians: 83.4 cm - Semivegetarians: 90.4 cm - Nonvegetarians: 89.4 cmVegetarians weighed significantly less than semivegetarians (p < 0.05), but not when compared with nonvegetarians
Chang-Claude and Frentzel-Beyme (1993), Germany
Male/female; age ≥10 years (most are adults)
1. Strict vegetarian (no meat/fish) (n = 1,163)
2. Moderate vegetarian (occasionally consume meat/fish) (n = 741)
A lower proportion of strict vegetarians were in the upper third of BMI categories (>22.4 kg/m2 in men; >21.6 kg/m2 in women)
(Continued)
Copyright Taylor & Francis Group. Do Not Distribute.
131The Role of Vegetarian Diets in Weight Management
TABLE 7.1 (CONTINUED)Observational Studies: Association between Dietary Patterns and Measures of Adiposity
Authors (Year), Country
Description of Subjects and Dietary Patterns Study Findings
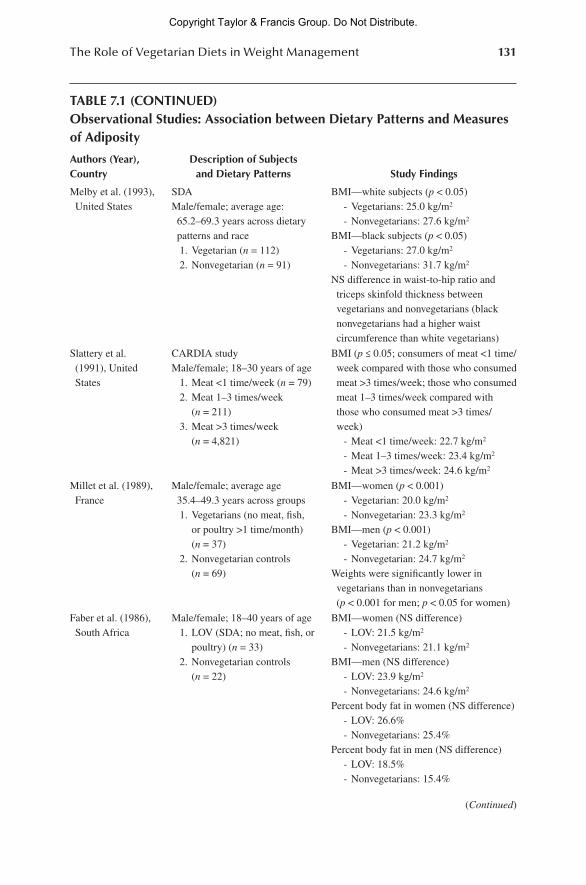
Melby et al. (1993), United States
SDAMale/female; average age: 65.2–69.3 years across dietary patterns and race
1. Vegetarian (n = 112) 2. Nonvegetarian (n = 91)
BMI—white subjects (p < 0.05) - Vegetarians: 25.0 kg/m2
- Nonvegetarians: 27.6 kg/m2
BMI—black subjects (p < 0.05) - Vegetarians: 27.0 kg/m2
- Nonvegetarians: 31.7 kg/m2
NS difference in waist-to-hip ratio and triceps skinfold thickness between vegetarians and nonvegetarians (black nonvegetarians had a higher waist circumference than white vegetarians)
Slattery et al. (1991), United States
CARDIA studyMale/female; 18–30 years of age 1. Meat <1 time/week (n = 79) 2. Meat 1–3 times/week
(n = 211) 3. Meat >3 times/week
(n = 4,821)
BMI (p ≤ 0.05; consumers of meat <1 time/week compared with those who consumed meat >3 times/week; those who consumed meat 1–3 times/week compared with those who consumed meat >3 times/week)
- Meat <1 time/week: 22.7 kg/m2
- Meat 1–3 times/week: 23.4 kg/m2
- Meat >3 times/week: 24.6 kg/m2
Millet et al. (1989), France
Male/female; average age 35.4–49.3 years across groups
1. Vegetarians (no meat, fish, or poultry >1 time/month) (n = 37)
2. Nonvegetarian controls (n = 69)
BMI—women (p < 0.001) - Vegetarian: 20.0 kg/m2
- Nonvegetarian: 23.3 kg/m2
BMI—men (p < 0.001) - Vegetarian: 21.2 kg/m2
- Nonvegetarian: 24.7 kg/m2
Weights were significantly lower in vegetarians than in nonvegetarians (p < 0.001 for men; p < 0.05 for women)
Faber et al. (1986), South Africa
Male/female; 18–40 years of age 1. LOV (SDA; no meat, fish, or
poultry) (n = 33) 2. Nonvegetarian controls
(n = 22)
BMI—women (NS difference) - LOV: 21.5 kg/m2
- Nonvegetarians: 21.1 kg/m2
BMI—men (NS difference) - LOV: 23.9 kg/m2
- Nonvegetarians: 24.6 kg/m2
Percent body fat in women (NS difference) - LOV: 26.6% - Nonvegetarians: 25.4%Percent body fat in men (NS difference) - LOV: 18.5% - Nonvegetarians: 15.4%
(Continued)
Copyright Taylor & Francis Group. Do Not Distribute.

132 Vegetarian Nutrition and Wellness
TABLE 7.1 (CONTINUED)Observational Studies: Association between Dietary Patterns and Measures of Adiposity
Authors (Year), Country
Description of Subjects and Dietary Patterns Study Findings
Melby et al. (1985), United States
SDAMale/female; average age: 51 years
1. Vegetarians (meat <1 time/month) (n = 150)
2. Nonvegetarians (n = 65)
BMI—women (p = 0.0001) - Vegetarians: 23.9 kg/m2
- Nonvegetarians: 28.1 kg/m2
BMI—men (NS difference) - Vegetarians: 23.9 kg/m2
- Nonvegetarians: 28.1 kg/m2
Rouse et al. (1983), Australia
Male/female; 25–44 years of age 1. SDA LOV (rarely or never
eat meat, fish, or poultry) (n = 98)
2. SDA nonvegetarians (meat, poultry, or fish ≥1 time/month) (n = 82)
3. Mormon nonvegetarians (meat, poultry, or fish >1 time/day on average) (n = 113)
BMI—women (p < 0.01 for difference between SDA LOV and Mormon nonvegetarians)
- SDA LOV: 23.3 kg/m2
- SDA nonvegetarian: 24.4 kg/m2
- Mormon nonvegetarian: 26.3 kg/m2
BMI—men (p < 0.05 for SDA LOV compared with SDA nonvegetarians; p < 0.01 for LOV compared with Mormon nonvegetarians)
- SDA LOV: 22.9 kg/m2
- SDA nonvegetarian: 24.7 kg/m2
- Mormon nonvegetarian: 25.1 kg/m2
Among the male subjects, omnivores (both SDA and Mormon) weighed significantly more than SDA LOV (p < 0.05 and p < 0.01, respectively)
Among the female subjects, the differences were noted between SDA vegetarians and Mormon omnivores: weight, mid-upper arm circumference, and triceps skinfold thickness were significantly lower in SDA vegetarians than in Mormon omnivores (p < 0.01)
Shultz and Leklem (1983), United States
Male/female 1. SDA vegetarians (n = 51;
20–83 years old) 2. SDA nonvegetarians (n = 16;
24–38 years old) 3. Non-SDA nonvegetarians
(n = 53; 19–78 years old)
BMI—women (NS difference) - SDA vegetarians: 24 kg/m2
- SDA nonvegetarians: 25 kg/m2
- Non-SDA nonvegetarians: 24 kg/m2
BMI—men (NS difference) - SDA vegetarians: 23 kg/m2
- SDA nonvegetarians: 22 kg/m2
- Non-SDA nonvegetarians: 24 kg/m2
NS difference in weight between the vegetarian and nonvegetarian groups
(Continued)
Copyright Taylor & Francis Group. Do Not Distribute.

133The Role of Vegetarian Diets in Weight Management
TABLE 7.1 (CONTINUED)Observational Studies: Association between Dietary Patterns and Measures of Adiposity
Authors (Year), Country
Description of Subjects and Dietary Patterns Study Findings
Knuiman and West (1982), Belgium and Netherlands
Male; 30–39 years of age 1. Macrobiotic (mainly whole
grains, beans, vegetables, seaweed, fermented soy foods; very limited to no animal products) (n = 33)
2. LOV (very limited to no meat or fish) (n = 56)
3. Semi-lacto-vegetarians (meat or fish ≤1/week) (n = 43)
4. Nonvegetarian (n = 52)
The BMIs of macrobiotic, lacto-vegetarian, and semi-lacto-vegetarian men were significantly lower than those of the nonvegetarian group (p < 0.01 for each comparison)
- Macrobiotics: 20.9 kg/m2
- Lacto-vegetarians: 21.4 kg/m2
- Semi-lacto-vegetarians: 22.2 kg/m2
- Nonvegetarians: 24.4 kg/m2
Armstrong et al. (1981), Australia
Postmenopausal women; 50–79 years of age
1. Vegetarian (SDA) (n = 46) 2. Nonvegetarian (matched
regional residents) (n = 47)
BMI (NS difference) - Vegetarians: 23.1 kg/m2
- Nonvegetarians: 24.0 kg/m2
NS differences in weight, arm circumference, and triceps skinfold thickness between the vegetarian and nonvegetarian groups
Burr et al. (1981), United Kingdom
Male/female; 28–80 years of age 1. Vegetarian (meat and fish
<1 time/month) (n = 85) 2. Nonvegetarian (n = 215)
BMI difference for women <60 years of age (NS)
- Vegetarians: 22.4 kg/m2
- Nonvegetarians: 23.2 kg/m2
BMI difference for women ≥60 years of age (p < 0.01)
- Vegetarians: 22.2 kg/m2
- Nonvegetarians: 24.9 kg/m2
BMI difference for men <60 years of age (p < 0.001)
- Vegetarians: 20.5 kg/m2
- Nonvegetarians: 24.5 kg/m2
BMI difference for men ≥60 years of age (p < 0.05)
- Vegetarians: 22.7 kg/m2
- Nonvegetarians: 24.9 kg/m2
Taber and Cook (1980), United States
Male/female; average age: 25.5–27.9 years across dietary patterns and genders
1. Vegetarian (n = 28) 2. Pesco-vegetarian (n = 20) 3. Nonvegetarians (n = 49)
NS difference between groups for weight, arm circumference, triceps skinfold, arm muscle area, and arm fat area
(Continued)
Copyright Taylor & Francis Group. Do Not Distribute.

134 Vegetarian Nutrition and Wellness
TABLE 7.1 (CONTINUED)Observational Studies: Association between Dietary Patterns and Measures of Adiposity
Authors (Year), Country
Description of Subjects and Dietary Patterns Study Findings
Armstrong et al. (1979), Australia
Male/female; matched pairs; 17–79 years of age
1. Vegetarians (including some SDAs; mostly no meat, fish, or poultry) (n = 106)
2. Nonvegetarians (meat, fish, or poultry ≥1 time/day) (n = 106)
BMI (NS difference) - Vegetarians: 22.9 kg/m2
- Nonvegetarians: 23.9 kg/m2
Average weight was lower in vegetarians than nonvegetarians (p = 0.03)
NS difference was noted for triceps skinfold thickness between the groups
Sanders et al. (1978), United Kingdom
Male/female; 21–66 years of age 1. Vegans (no foods of animal
origin for at least 1 year) 2. Nonvegetarian matched
controls
Vegans had a significantly lower average standard weight for height than nonvegetarians (p < 0.05); they also had a significantly lower sum of skinfold measurements (biceps, triceps, subscapular, and suprailiac) than nonvegetarians (p < 0.01)
Simons et al. (1978), Australia
Male/female 1. Vegetarians (SDA) (n = 20;
average age 39) 2. Nonvegetarians (SDA)
(n = 17; average age 37) 3. Nonvegetarians 9regional
residents) (n = 38; average age 46)
Proportion of subjects >10% overweighta
- Vegetarians: 20% - Nonvegetarians: 47%Vegetarians weighed significantly less than nonvegetarians, but this analysis included both men and women, and there was a higher proportion of women in the vegetarian group than in the nonvegetarian group
Armstrong et al. (1977), Australia
Male/female; 30–79 years of age 1. Vegetarians (SDA; meat,
fish, poultry <1/month) (n = 418)
2. Nonvegetarians (regional residents) (n = 290)
The nonvegetarians weighed significantly more than the vegetarians (p < 0.005 for differences by gender between vegetarians and nonvegetarians)
Sacks et al. (1975), United States
Male/female; 16–62 years of age 1. Macrobiotic/vegetarian
(residing in commune) (n = 115)
2. Age- and gender-matched nonvegetarian controls (Framingham cohort offspring) (n = 115)
Vegetarians weighed significantly less than nonvegetarian controls (p < 0.001)
Subscapular skinfold thickness was also significantly lower in vegetarians than in nonvegetarians (p < 0.001)
Results for other skinfold measurements (triceps, abdomen) were not shown
Note: CARDIA = Coronary Artery Risk Development in Young Adults; FFQ = Food Frequency Questionaire; LOV = lacto-ovo vegetarian; NS = not significant or nonsignificant; n/a = not available.
a Not defined.
Copyright Taylor & Francis Group. Do Not Distribute.
135The Role of Vegetarian Diets in Weight Management
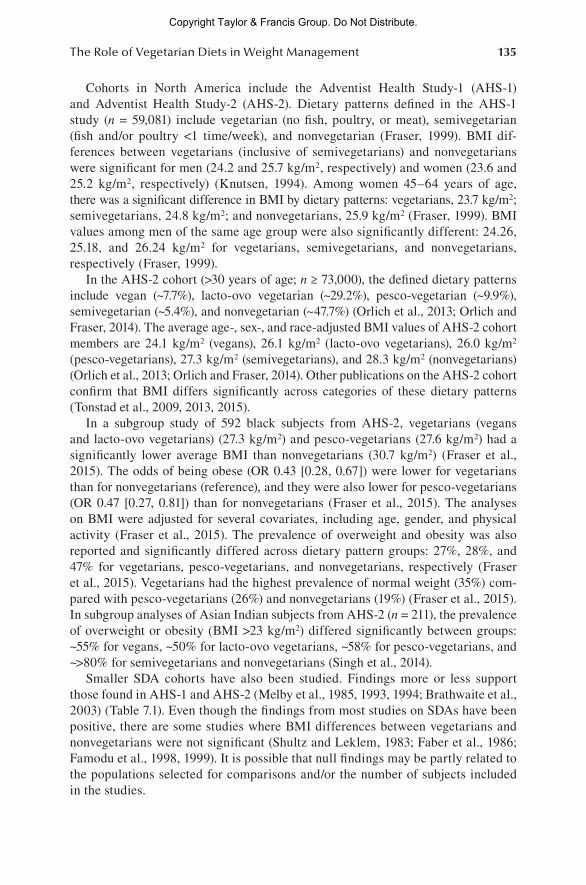
Cohorts in North America include the Adventist Health Study-1 (AHS-1) and Adventist Health Study-2 (AHS-2). Dietary patterns defined in the AHS-1 study (n = 59,081) include vegetarian (no fish, poultry, or meat), semivegetarian (fish and/or poultry <1 time/week), and nonvegetarian (Fraser, 1999). BMI dif-ferences between vegetarians (inclusive of semivegetarians) and nonvegetarians were significant for men (24.2 and 25.7 kg/m2, respectively) and women (23.6 and 25.2 kg/m2, respectively) (Knutsen, 1994). Among women 45–64 years of age, there was a significant difference in BMI by dietary patterns: vegetarians, 23.7 kg/m2; semivegetarians, 24.8 kg/m2; and nonvegetarians, 25.9 kg/m2 (Fraser, 1999). BMI values among men of the same age group were also significantly different: 24.26, 25.18, and 26.24 kg/m2 for vegetarians, semivegetarians, and nonvegetarians, respectively (Fraser, 1999).
In the AHS-2 cohort (>30 years of age; n ≥ 73,000), the defined dietary patterns include vegan (~7.7%), lacto-ovo vegetarian (~29.2%), pesco-vegetarian (~9.9%), semivegetarian (~5.4%), and nonvegetarian (~47.7%) (Orlich et al., 2013; Orlich and Fraser, 2014). The average age-, sex-, and race-adjusted BMI values of AHS-2 cohort members are 24.1 kg/m2 (vegans), 26.1 kg/m2 (lacto-ovo vegetarians), 26.0 kg/m2 (pesco-vegetarians), 27.3 kg/m2 (semivegetarians), and 28.3 kg/m2 (nonvegetarians) (Orlich et al., 2013; Orlich and Fraser, 2014). Other publications on the AHS-2 cohort confirm that BMI differs significantly across categories of these dietary patterns (Tonstad et al., 2009, 2013, 2015).
In a subgroup study of 592 black subjects from AHS-2, vegetarians (vegans and lacto-ovo vegetarians) (27.3 kg/m2) and pesco-vegetarians (27.6 kg/m2) had a significantly lower average BMI than nonvegetarians (30.7 kg/m2) (Fraser et al., 2015). The odds of being obese (OR 0.43 [0.28, 0.67]) were lower for vegetarians than for nonvegetarians (reference), and they were also lower for pesco-vegetarians (OR 0.47 [0.27, 0.81]) than for nonvegetarians (Fraser et al., 2015). The analyses on BMI were adjusted for several covariates, including age, gender, and physical activity (Fraser et al., 2015). The prevalence of overweight and obesity was also reported and significantly differed across dietary pattern groups: 27%, 28%, and 47% for vegetarians, pesco-vegetarians, and nonvegetarians, respectively (Fraser et al., 2015). Vegetarians had the highest prevalence of normal weight (35%) com-pared with pesco-vegetarians (26%) and nonvegetarians (19%) (Fraser et al., 2015). In subgroup analyses of Asian Indian subjects from AHS-2 (n = 211), the prevalence of overweight or obesity (BMI >23 kg/m2) differed significantly between groups: ~55% for vegans, ~50% for lacto-ovo vegetarians, ~58% for pesco-vegetarians, and ~>80% for semivegetarians and nonvegetarians (Singh et al., 2014).
Smaller SDA cohorts have also been studied. Findings more or less support those found in AHS-1 and AHS-2 (Melby et al., 1985, 1993, 1994; Brathwaite et al., 2003) (Table 7.1). Even though the findings from most studies on SDAs have been positive, there are some studies where BMI differences between vegetarians and nonvegetarians were not significant (Shultz and Leklem, 1983; Faber et al., 1986; Famodu et al., 1998, 1999). It is possible that null findings may be partly related to the populations selected for comparisons and/or the number of subjects included in the studies.
Copyright Taylor & Francis Group. Do Not Distribute.

136 Vegetarian Nutrition and Wellness
7.2.2 StuDieS on north american PoPulationS
Aside from the North American studies in SDAs noted previously, there are several studies that have been published from other North American cohorts. Early studies focused on differences in weight (Sacks et al., 1975; Toth and Poehlman, 1994).
In the Coronary Artery Risk Development in Young Adults (CARDIA) study, investigators examined the BMI of subjects (18–30 years of age) according to their meat intake (Slattery et al., 1991). The groups that consumed meat <1 time/week (22.7 kg/m2) and 1–3 times/week (23.4 kg/m2) had a significantly lower BMI than those who consumed meat >3 times/week (24.6 kg/m2) (Slattery et al., 1991).
Utilizing data from the Continuing Survey of Food Intake by Individuals (CSFII) 1994–1996, Kennedy et al. (2001) allocated subjects into vegetarian versus non-vegetarian patterns based on whether they consumed meat, poultry, or fish (based on one 24-hour dietary recall). In this particular study, the BMI of vegetarians (25.25 kg/m2 for men, 24.65 kg/m2 for women) was significantly lower than the BMI of nonvegetarians (26.65 kg/m2 for men, 25.75 kg/m2 for women). A higher propor-tion of vegetarians’ BMI was <25 kg/m2 compared with that of nonvegetarians, but these differences for men and women were not significant (Kennedy et al., 2001).
For the most part, other North American studies support lower BMI values in vegetarians than in nonvegetarians (Janelle and Barr, 1995; Haddad et al., 1999; Barr and Broughton, 2000; Bedford and Barr, 2005; Fontana et al., 2007; Timko et al., 2012).
7.2.3 StuDieS on euroPean PoPulationS
There are various cohorts in the United Kingdom and Europe that have been used to examine the relationship between dietary patterns and anthropometric data. An early UK study by Burr and colleagues (1981) documented that the BMIs of veg-etarian men <60 years of age (20.5 kg/m2) and ≥60 years of age (22.7 kg/m2) were significantly lower than those of nonvegetarian men of the same age ranges (24.5 and 24.9 kg/m2, respectively). Similar results were noted for vegetarian women ≥60 years of age (22.2 kg/m2 vs. 24.9 kg/m2 in nonvegetarians), but the comparison for women <60 years of age was not significant (Burr et al., 1981).
In the Oxford Vegetarian Study, a significantly higher proportion of nonvegetar-ians (21% of men, 13% of women) are overweight or obese than vegetarians (10% of men, 8% of women) (Appleby et al., 1998). In this same group, the average age-adjusted BMI values are significantly higher in nonvegetarians (23.18 kg/m2 in men, 22.32 kg/m2 in women) than in vegetarians (22.05 kg/m2 in men, 21.32 kg/m2 in women) (Appleby et al., 1998). These differences continued to be significant even after adjustment for various lifestyle factors, including dietary fiber and exercise. There is also evidence of a possible trend in long-term vegetarians (>5 years) having a lower BMI than short-term vegetarians (≤5 years). It should be noted that only 1% of this cohort have a BMI ≥30 kg/m2 (Appleby et al., 1998).
From the UK Women’s Cohort Study, researchers reported a BMI of 23 kg/m2 for low- and high-diversity vegetarians, whereas most of the nonvegetarian groups’ average BMIs were ~25 kg/m2 (no statistical test of differences noted) (Greenwood
Copyright Taylor & Francis Group. Do Not Distribute.

137The Role of Vegetarian Diets in Weight Management
et al., 2000). The prevalence of obesity ranged from 5% to 6% for vegetarians and 9% to 12% for nonvegetarians (Greenwood et al., 2000). In this same cohort, veg-etarians’ and fish eaters’ (similar to pesco-vegetarians) BMIs were lower than those of nonvegetarians (no statistical test of differences noted) (Cade et al., 2004).
A number of studies have been published on the UK European Prospective Investigation into Cancer and Nutrition (EPIC)–Oxford cohort (Davey et al., 2003; Spencer et al., 2003). The 2003 report based on the EPIC-Oxford cohort (n = 65,429) observed that the BMIs of vegan, vegetarian, pesco-vegetarian, and nonvegetarian women were 21.9, 22.7, 22.9, and 24.3 kg/m2, respectively (no statistical test of dif-ferences noted), while the corresponding values for men were 22.5, 23.5, 23.6, and 24.6 kg/m2, respectively (Davey et al., 2003). They also reported the prevalence of obesity in subjects 20–65 years of age. Among male subjects, the proportion of obe-sity was 1.6%, 3.5%, 3.9%, and 7.1% for vegans, vegetarians, pesco-vegetarians, and nonvegetarians, respectively (Davey et al., 2003), while the corresponding preva-lence of obesity in women was 2.5%, 4.5%, 4.4%, and 9.3%, respectively (Davey et al., 2003). Spencer et al. (2003) also published findings on a sample (n = 37,875) from the EPIC-Oxford cohort. Age-, lifestyle-, and dietary factor–adjusted BMI (95% CI) values in women were 22.56 (22.23, 22.79) kg/m2, 22.96 (22.88, 23.04) kg/m2, 22.83 (22.73, 22.92) kg/m2, and 23.23 (23.17, 23.31) kg/m2 for the vegans, vegetarians, pesco-vegetarians, and nonvegetarians, respectively (Spencer et al., 2003). For men, the corresponding values were 23.12 (22.83, 23.43) kg/m2, 23.67 (23.54, 23.80) kg/m2, 23.45 (23.27, 23.64) kg/m2, and 24.09 (23.97, 24.20) kg/m2 (Spencer et al., 2003). The age-adjusted prevalence of obesity was lowest in vegans (1.9% for men, 1.8% for women) and highest in nonvegetarians (5% for men, 5.7% for women) (Spencer et al., 2003). Rosell et al. (2005) published differences related to when individuals com-menced following a vegetarian diet (Rosell et al., 2005). Findings from longitudinal analyses (n = 21,966; median follow-up 5.3 years) determined a significant difference in the increases of BMI per year in women: 0.12 kg/m2 for vegans, 0.15 kg/m2 for vegetarians, 0.12 kg/m2 for pesco-vegetarians, and 0.15 kg/m2 for nonvegetarians (Rosell et al., 2006). These observations were not significant in men, with vegans gaining 0.10 kg/m2 per year and all other groups 0.12 kg/m2 per year. In terms of weight gain, vegan men gained significantly less weight than nonvegetarians. Those who converted their diet to a more plant-based pattern also gained less weight than nonvegetarians (Rosell et al., 2006). Vegan and pesco-vegetarian women gained sig-nificantly less weight per year than nonvegetarians, and those who converted to a more plant-based dietary pattern also gained significantly less over the years than nonvegetarians (Rosell et al., 2006).
Several studies have been done in other parts of Europe. Significant differ-ences in BMI were noted across gradient patterns of meat intake in Belgian men (Knuiman and West, 1982; Alewaeters et al., 2005) and women (Alewaeters et al., 2005) and for combined analyses (Clarys et al., 2014). Among women in the Swedish Mammography Cohort (n = 55,459), the odds ratio for being overweight and/or obese (BMI ≥25 kg/m2) (nonvegetarians as reference group) was 0.35 for vegans, 0.54 for lacto-vegetarians, 0.47 for vegans plus lacto-vegetarians, and 0.52 for semi-vegetarians. The logistic analyses were adjusted for various covariates, including age, energy intake, alcohol intake, smoking status, and parity (Newby et al., 2005).
Copyright Taylor & Francis Group. Do Not Distribute.

138 Vegetarian Nutrition and Wellness
The BMI of nonvegetarians (24.7 kg/m2) was also significantly higher than that of vegans (23.3 kg/m2), lacto-vegetarians (23.4), and semivegetarians (23.6 kg/m2) (Newby et al., 2005).
Null findings have also been reported in European groups (Hebbelinck et al., 1999). Similarly, differences favoring vegans or vegetarians have been noted in France (Millet et al., 1989), Germany (Chang-Claude and Frentzel-Beyme, 1993; Hoffmann et al., 2001), Finland (Karelis et al., 2010), Sweden (Newby et al., 2005), and Slovakia (Krajcovicova-Kudlackova et al., 1995).
7.2.4 StuDieS on other PoPulationS
Other cohorts, outside of North America and Europe, have also been evaluated. Findings have been mixed in Australian groups. In one study, the average BMI of lacto-ovo vegetarians (23.6 kg/m2) and vegans (23.3 kg/m2) was significantly lower than that of moderate-meat consumers (26.4 kg/m2), and high-meat consumers (27 kg/m2) (Li et al., 1999). In the Australian Longitudinal Study on Women’s Health cohort (22–27 years of age), the prevalence of overweight and obesity was signifi-cantly lower in vegetarian (12.4% and 3.4%, respectively) than in semivegetarian (15.4% and 7.4%, respectively) and nonvegetarian (19.1% and 10.3%, respectively) women (Baines et al., 2007), while the average BMIs were not significantly different between the three groups (Baines et al., 2007).
In a large cohort study in India, there was a significant difference in prevalence of overweight (23.0–24.9 kg/m2) and obesity (≥25.0 kg/m2) for subjects following different dietary patterns. The prevalence of overweight and obesity, respectively, was 21.5% and 11.5% for vegans, 26.9% and 16.2% lacto-vegetarians, 24.9% and 14.9% for lacto-ovo vegetarians, 19.5% and 10.0% for pesco-vegetarians, 21.8% and 11.3% for semivegetarians, and 22.6% and 12.7% for nonvegetarians (Agrawal et al., 2014). BMI was also found to be lower among vegetarians in Taiwan (Lu et al., 2000; Chiu et al., 2015), South Korea (Jo et al., 2015), and Pakistan (Baig et al., 2013). Some studies in Asian populations reported no differences (Lin et al., 2001; Ho-Pham et al., 2012; Gadgil et al., 2014). Another study reported a higher BMI in vegetarians than in nonvegetarians (Lee and Krawinkel, 2009). These null find-ings may be partly related to particular characteristics of the groups selected for comparisons.
7.2.5 finDingS of boDy comPoSition analySeS
There is evidence spanning at least five decades on differences in body composi-tion, including abdominal obesity, between individuals following different dietary patterns. In a subgroup from the AHS-2 cohort, waist circumference was found to be significantly lower in vegetarians and semivegetarians than in nonvegetarians (analyses adjusted for age, gender, ethnicity, smoking, calorie intake, alcohol intake, and physical activity) (Rizzo et al., 2011). In a subgroup of black subjects from AHS-2, vegetarians and pesco-vegetarians had significantly smaller waist circumferences that nonvegetarians (Fraser et al., 2015). The waist circumference measurements for women and men, respectively, were 88.1 and 95.5 cm for vegetarians, 89.0 and
Copyright Taylor & Francis Group. Do Not Distribute.

139The Role of Vegetarian Diets in Weight Management
94.7 cm for pesco-vegetarians, and 95.6 and 103.5 cm for nonvegetarians (Fraser et al., 2015). The odds of abdominal obesity for men and women, respectively, were 0.48 and 0.55 for vegetarians and 0.43 and 0.53 for pesco-vegetarians, with non-vegetarians as the reference group. In another group of black SDA members, waist circumference was significantly lower in vegetarians (83.4 cm) than in semivegetar-ians (90.4 cm) and nonvegetarians (89.4 cm) (Melby et al., 1994). Waist-to-hip ratio was significantly lower in vegetarians (0.79) than in both semivegetarians (0.82) and nonvegetarians (0.82) (Melby et al., 1994).
Results from the British Columbia Nutrition Survey reveal that vegetarian women had a significantly lower age-adjusted waist circumference than nonvegetarian women (79.8 cm vs. 75.0 cm) (Bedford and Barr, 2005). The comparison was not significant in men. In a study from Taiwan, vegetarians had a significantly lower waist circumference than nonvegetarians (75.5 cm vs. 77.1 cm). (Chiu et al., 2015). A significantly greater proportion of nonvegetarians were abdominally obese (≥90 cm in men, ≥80 cm in women) than vegetarians (27.7% vs. 21.7%). After adjusting for covariates, the odds of a large waist circumference were significantly lower for lacto-ovo vegetarians only (OR 0.86) than for nonvegetarians (Chiu et al., 2015). Other researchers have reported that differences in waist circumference were not signifi-cant (Toohey et al., 1998; Brathwaite et al., 2003).
Most of the analyses on skinfold thickness measurements indicate that differ-ences between vegetarians and nonvegetarians are not significant (Armstrong et al., 1979, 1981; Taber and Cook, 1980; Rouse et al., 1983; Melby et al., 1993, 1994; Toth and Poehlman, 1994; Famodu et al., 1998; Hebbelinck et al., 1999). However, a few studies do report differences. Vegans have been found to have significantly lower skinfold measurements (sum of biceps, triceps, subscapular, and suprailiac) than nonvegetarians (Sanders et al., 1978). Similarly, in a comparison among women of SDA vegetarians and Mormon nonvegetarians, triceps skinfold thickness measure-ments were significantly lower in the vegetarians (Rouse et al., 1983). In another study, subscapular skinfold thickness was significantly lower in vegetarians (includ-ing macrobiotic pattern) than in nonvegetarians (Sacks et al., 1975). In the CARDIA study, subjects who consumed meat less than once per week or 1–3 times/week had significantly lower skinfold thickness (sum of triceps, subscapular, and suprailiac) measurements than those who consumed meat >3 times/week (Slattery et al., 1991). It should be noted that interpretation of such measurements depends on the number of sites measured, use of formulas to estimate percent body fat, and/or availability of a good reference group to compare measurements to.
Reports on other measurements, such as arm circumference (Taber and Cook, 1980; Armstrong et al., 1981; Rouse et al., 1983), hip circumference (Brathwaite et al., 2003), and thigh circumference (Melby et al., 1994) have been varied.
Percent body fat was estimated or measured in only a few of the studies. Most reported no differences observed for percent body fat (Faber et al., 1986; Toth and Poehlman, 1994; Janelle and Barr, 1995; Ho-Pham et al., 2012). Fontana et al. (2007) found that vegans had significantly lower percent body fat than subjects on a Western dietary pattern (women 26.9% vs. 42.3%, men 13.7% vs. 21.0%). Vegan subjects, in the German Vegan Study, had significantly lower percent body fat than moderate vegans (Waldmann et al., 2003).
Copyright Taylor & Francis Group. Do Not Distribute.

140 Vegetarian Nutrition and Wellness
7.2.6 concluSionS
Most of the published studies examined here provide supporting evidence that plant-based dietary patterns are associated with lower excess adiposity, particularly when estimated by BMI. There are various caveats that should be noted, however. Most of the analyses in these studies were cross-sectional in nature and did not control for possible confounding variables, like age, gender, physical activity, and smoking sta-tus. Additionally, in some observational studies, the vegetarian group was selected from a different population than the nonvegetarian group. The definitions used for plant-based diets can be quite disparate, not allowing for complete comparisons between all studies. Also, vegans were not always included in analyses (at times excluded due to their small number). Anthropometric measurements were not always a main study outcome and were self-reported in some studies. It is possible that study design flaws and/or under-powered analyses contributed to mixed findings in some cases. These difficulties should be expected when examining a large number of studies published across several decades.
7.3 INTERVENTION STUDIES EXAMINING THE EFFECT OF PLANT-BASED DIETS ON MEASURES OF ADIPOSITY
One of the earliest intervention studies evaluating the effect of plant-based diets on anthro-pometric measurements was conducted by Ornish. In this study, 46 subjects with a his-tory of ischemic heart disease were randomly assigned to receive either a vegetarian diet (minimal amount of nonfat yogurt allowed) or control diet for 24 days. Subjects in the intervention group experienced a significant amount of weight loss (5.6%) (Ornish et al., 1983). Later on, Ornish reported findings of a lifestyle program, which included a low-fat vegetarian diet as part of the intervention. The intervention group experienced 11% weight loss (p < 0.0001) following 1 year of treatment (Ornish et al., 1990). Five years later, Ornish followed up on this same group of subjects. The low-fat vegetarian diet group had sustained an overall average 5.8 kg (6.3%) of weight loss (p = 0.001), and the loss was significantly greater than what occurred for the control group (Ornish et al., 1998).
An Ornish-style vegetarian diet has been utilized as an intervention in a number of other studies. In one case, 160 subjects with a BMI of 27–42 kg/m2 were randomly allo-cated to follow an Aktins, Zone, Weight Watchers, or Ornish diet for 1 year (Dansinger et al., 2005). The subjects in the Ornish group experienced significant reduction in weight (3.2%) and waist circumference (2.2 cm). These reductions were not significantly different from those in the other treatment groups. Similar results were noted in another randomized trial (n = 311) comparing Atkins, Zone, a lifestyle intervention (Lifestyle, Exercise, Attitudes, Relationships, Nutrition [LEARN]), and a high-carb Ornish diet for 2 months in overweight or obese individuals (Gardner et al., 2007). Weight loss was significant for all groups, with those on the Ornish diet losing 3%, although this reduction was not significantly different from that in the other groups. Changes in percent body fat and waist-to-hip ratio were not significant (Gardner et al., 2007).
In another study, a low-fat vegetarian diet was responsible for a 3.6% weight loss (p < 0.05) over the course of two menstrual cycles in a group of 35 premenopausal women. In this study, a trend was noted whereby the higher a subject’s baseline BMI, the greater their weight loss (Barnard et al., 2000). Overweight or obese postmenopausal
Copyright Taylor & Francis Group. Do Not Distribute.

141The Role of Vegetarian Diets in Weight Management
women on a low-fat vegan diet in another study experienced similar results. Compared with a group following the National Cholesterol Education Program (NCEP) diet, the women on the vegan diet lost significantly more weight (6.5%) after 14 weeks (Barnard et al., 2004, 2005; Turner-McGrievy et al., 2004). A similar study assessed adherence and weight loss 1 and 2 years after the initiation of a 14-week study comparing a low-fat vegan diet with the NCEP diet (Turner-McGrievy et al., 2007). The vegan group experi-enced significant weight loss over 1 and 2 years, and their loss was significantly greater than that of the NCEP group (Turner-McGrievy et al., 2007). Those in the vegan group who adhered to the diet for a year experienced more weight loss than nonadherers, but the difference was not significant (Turner-McGrievy et al., 2007).
In overweight or obese women (n = 18) previously diagnosed with polycystic ovary syndrome who were randomly assigned to either a vegan diet or low-calorie diet, significant weight loss (1.8%) was noted after 3 months for the vegan group. Weight loss was not significant after 6 months, with weight regain evident (Turner-McGrievy et al., 2014). The effects of a 2-month intervention were observed using different plant-based diets, including vegan, vegetarian, pesco-vegetarian, and semi-vegetarian diets, compared with a nonvegetarian diet in a group of 62 overweight or obese individuals. All groups experienced significant weight loss, but the loss in the vegan group was significantly greater than that in the nonvegetarian group (4.8% vs. 2.2%). After 6 months of follow-up, the loss in the vegan group (7.5%) was sig-nificantly more than that in the pesco-vegetarian (3.2%), semivegetarian (3.2%), and nonvegetarian (3.1%) groups (Turner-McGrievy et al., 2015).
The effect of an Eco-Atkins diet (low-carb vegan diet) was compared with that of a high-carb lacto-ovo vegetarian diet. After 1 month, no significant differences in weight were noted (Jenkins et al., 2009). Subjects included men and postmenopausal women with BMI >27 kg/m2 (Jenkins et al., 2009). However, when the same subjects were followed for 6 months, the low-carb vegan diet resulted in greater weight loss than the high-carb lacto-ovo vegetarian diet (8.2% vs. 6.8%). Other measurements of adiposity, however, including percent body fat and waist circumference, did not differ between the groups (Jenkins et al., 2014).
Several other studies have reported significant weight losses due to vegan (Lindahl et al., 1984; Balliett and Burke, 2013) and lacto-ovo vegetarian diets (Mahon et al., 2007; Burke et al., 2008). Other studies have reported no significant changes (Margetts et al., 1986; Prescott et al., 1988; Delgado et al., 1996). Details of these studies are found in Table 7.2. Several studies have focused on the effect of short vegan fasts on health out-comes, but considering current expert weight loss recommendations, these studies are not included here (Bloomer et al., 2010; Trepanowski et al., 2012; McDougall et al., 2014).
7.3.1 StuDieS in inDiViDualS With a hiStory of DiabeteS
Weight management is particularly beneficial for individuals diagnosed with type 2 diabetes, by improving insulin resistance and ultimately blood glucose control (Barnard et al., 2009c; Khazrai et al., 2014). Several studies have been published on the benefits of vegan or vegetarian diets for improving metabolic health for those with type 2 diabetes, including anthropometric data (Barnard et al., 2015). Details can be found in Table 7.3.
Copyright Taylor & Francis Group. Do Not Distribute.

142 Vegetarian Nutrition and Wellness
TAB
LE 7
.2In
terv
enti
on S
tudi
es E
xam
inin
g th
e Ef
fect
of P
lant
-Bas
ed D
iets
on
Mea
sure
s of
Adi
posi
ty
Aut
hors
(Ye
ar),
C
ount
rySt
udy
and
Subj
ect
Des
crip
tion
sIn
terv
enti
ons
Find
ings
Tur
ner-
McG
riev
y et
al.
(201
5),
Uni
ted
Stat
es
Ran
dom
ized
con
trol
led
tria
lO
verw
eigh
t/obe
se (
BM
I 25
–49.
9 kg
/m2 )
n =
62
Gen
der:
Mal
e, f
emal
eA
ge: 1
8–65
yea
rs o
ld
1.
Veg
an d
iet (
n =
11)
× 2
mon
ths
2.
Veg
etar
ian
diet
(n
= 1
3) ×
2 m
onth
s
3. P
esco
-veg
etar
ian
diet
(n
= 1
3) ×
2 m
onth
s
4. S
emiv
eget
aria
n di
et (
red
mea
t lim
ited
to
once
per
wee
k an
d po
ultr
y to
≤5
times
/w
eek)
(n
= 1
3) ×
2 m
onth
s
5. O
mni
voro
us d
iet (
n =
12)
× 2
mon
ths
All:
Lim
it fa
t and
gly
cem
ic in
dex;
lim
it “f
atty
” pl
ant f
oods
Free
-liv
ing
Wei
ght l
oss
was
sig
nific
ant a
fter
2 m
onth
s (p
< 0
.01)
-
Veg
an: 4
.8%
-
Veg
etar
ian:
~4.
8%
- Pe
sco-
vege
tari
an: 4
.3%
-
Sem
iveg
etar
ian:
3.7
%
- O
mni
voro
us: 2
.2%
Wei
ght l
oss
in v
egan
s w
as s
igni
fican
tly d
iffe
rent
fro
m
that
in th
e om
nivo
re g
roup
aft
er 2
mon
ths
(p <
0.0
1)W
eigh
t los
s w
as s
igni
fican
t aft
er 6
mon
ths
(p <
0.0
1)
- V
egan
: 7.5
%
- V
eget
aria
n: 6
.3%
-
Pesc
o-ve
geta
rian
: 3.2
%
- Se
miv
eget
aria
n: 3
.2%
-
Om
nivo
rous
: 3.1
%W
eigh
t los
s in
the
vega
n gr
oup
was
sig
nific
antly
di
ffer
ent f
rom
that
in th
e pe
sco-
and
sem
iveg
etar
ian
and
omni
vore
gro
ups
afte
r 6
mon
ths
(p <
0.0
3 fo
r ea
ch
com
pari
son)
(Con
tinu
ed)
Copyright Taylor & Francis Group. Do Not Distribute.
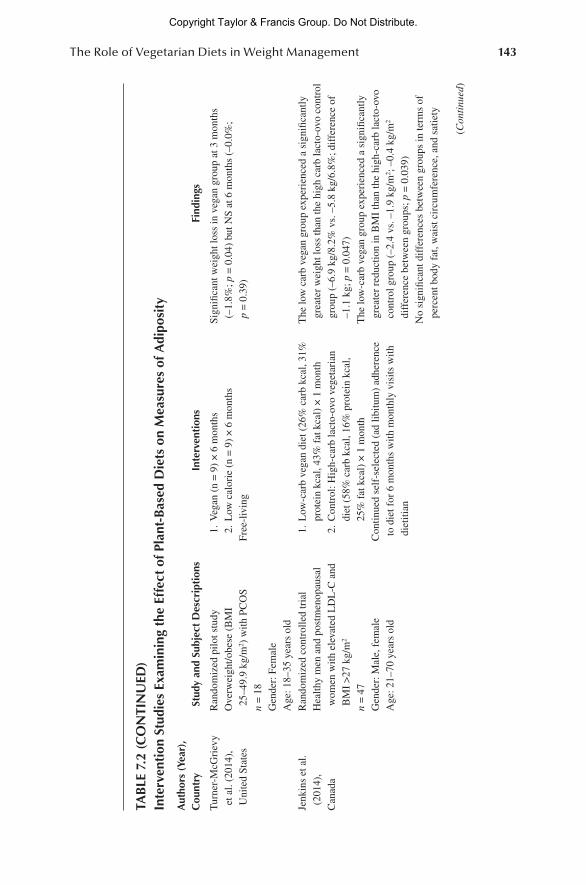
143The Role of Vegetarian Diets in Weight Management
TAB
LE 7
.2 (C
ON
TIN
UED
)In
terv
enti
on S
tudi
es E
xam
inin
g th
e Ef
fect
of P
lant
-Bas
ed D
iets
on
Mea
sure
s of
Adi
posi
ty
Aut
hors
(Ye
ar),
C
ount
rySt
udy
and
Subj
ect
Des
crip
tion
sIn
terv
enti
ons
Find
ings
Tur
ner-
McG
riev
y et
al.
(201
4),
Uni
ted
Stat
es
Ran
dom
ized
pilo
t stu
dyO
verw
eigh
t/obe
se (
BM
I 25
–49.
9 kg
/m2 )
with
PC
OS
n =
18
Gen
der:
Fem
ale
Age
: 18–
35 y
ears
old
1.
Veg
an (
n =
9)
× 6
mon
ths
2.
Low
cal
orie
(n
= 9
) ×
6 m
onth
sFr
ee-l
ivin
g
Sign
ifica
nt w
eigh
t los
s in
veg
an g
roup
at 3
mon
ths
(–1.
8%; p
= 0
.04)
but
NS
at 6
mon
ths
(–0.
0%;
p =
0.3
9)
Jenk
ins
et a
l. (2
014)
,C
anad
a
Ran
dom
ized
con
trol
led
tria
lH
ealth
y m
en a
nd p
ostm
enop
ausa
l w
omen
with
ele
vate
d L
DL
-C a
nd
BM
I >
27 k
g/m
2
n =
47
Gen
der:
Mal
e, f
emal
eA
ge: 2
1–70
yea
rs o
ld
1.
Lo w
-car
b ve
gan
diet
(26
% c
arb
kcal
, 31%
pr
otei
n kc
al, 4
3% f
at k
cal)
× 1
mon
th
2. C
ontr
ol: H
igh-
carb
lact
o-o v
o ve
geta
rian
di
et (
58%
car
b kc
al, 1
6% p
rote
in k
cal,
25%
fat
kca
l) ×
1 m
onth
Con
tinue
d se
lf-s
elec
ted
(ad
libitu
m)
adhe
renc
e to
die
t for
6 m
onth
s w
ith m
onth
ly v
isits
with
di
etiti
an
The
low
car
b ve
gan
grou
p ex
peri
ence
d a
sign
ifica
ntly
gr
eate
r w
eigh
t los
s th
an th
e hi
gh c
arb
lact
o-ov
o co
ntro
l gr
oup
(–6.
9 kg
/8.2
% v
s. –
5.8
kg/6
.8%
; dif
fere
nce
of
–1.1
kg;
p =
0.0
47)
The
low
-car
b ve
gan
grou
p ex
peri
ence
d a
sign
ifica
ntly
gr
eate
r re
duct
ion
in B
MI
than
the
high
-car
b la
cto-
ovo
cont
rol g
roup
(–2
.4 v
s. –
1.9
kg/m
2 ; –
0.4
kg/m
2 di
ffer
ence
bet
wee
n gr
oups
; p =
0.0
39)
No
sign
ifica
nt d
iffe
renc
es b
etw
een
grou
ps in
term
s of
pe
rcen
t bod
y fa
t, w
aist
cir
cum
fere
nce,
and
sat
iety
(Con
tinu
ed)
Copyright Taylor & Francis Group. Do Not Distribute.

144 Vegetarian Nutrition and Wellness
TAB
LE 7
.2 (C
ON
TIN
UED
)In
terv
enti
on S
tudi
es E
xam
inin
g th
e Ef
fect
of P
lant
-Bas
ed D
iets
on
Mea
sure
s of
Adi
posi
ty
Aut
hors
(Ye
ar),
C
ount
rySt
udy
and
Subj
ect
Des
crip
tion
sIn
terv
enti
ons
Find
ings
Bal
liett
and
Bur
ke
(201
3), U
nite
d St
ates
Unc
ontr
olle
d st
udy
n =
49
Gen
der:
Mal
e, f
emal
eA
ge: 2
0–60
yea
rs o
ld
Low
-cal
orie
veg
an d
iet ×
21
days
plu
s he
rbal
su
pple
men
tsSi
gnifi
cant
red
uctio
n in
wei
ght (
–8.7
lb =
3.9
5 kg
; ~5
%),
wai
st c
ircu
mfe
renc
e (–
1.5
in. =
3.8
1 cm
), h
ip
circ
umfe
renc
e (–
1.2
in. =
3.0
5 cm
), w
aist
-to-
hip
ratio
(–
0.01
), a
nd w
aist
-to-
heig
ht r
atio
(–0
.02)
; sig
nific
ant
redu
ctio
n in
BM
I (–
1.4
kg/m
2 )Si
gnifi
cant
red
uctio
n in
fat
mas
s (–
5.2
lb =
2.3
6 kg
);
decr
ease
in f
at-f
ree
mas
s bu
t inc
reas
e in
per
cent
at-
free
m
ass
(–4.
0 lb
= 1
.82
kg a
nd +
1.5%
); N
S ch
ange
in
perc
ent f
at m
ass
(–1%
)p
< 0
.05
Jenk
ins
et a
l. (2
009)
, Can
ada
Ran
dom
ized
con
trol
led
tria
lH
ealth
y m
en a
nd p
ostm
enop
ausa
l w
omen
with
ele
vate
d L
DL
-C a
nd
BM
I >
27 k
g/m
2
n =
47
Gen
der:
Mal
e, f
emal
eA
ge: 2
1–70
yea
rs o
ld
1.
Low
-car
b ve
gan
diet
(26
% c
arb
kcal
, 31%
pr
otei
n kc
al, 4
3% f
at k
cal)
× 1
mon
th
2. C
ontr
ol: H
igh-
carb
lact
o-ov
o ve
geta
rian
di
et (
58%
car
b kc
al, 1
6% p
rote
in k
cal,
25%
fat
kca
l) ×
1 m
onth
NS
wei
ght c
hang
e
(Con
tinu
ed)
Copyright Taylor & Francis Group. Do Not Distribute.

145The Role of Vegetarian Diets in Weight Management
TAB
LE 7
.2 (C
ON
TIN
UED
)In
terv
enti
on S
tudi
es E
xam
inin
g th
e Ef
fect
of P
lant
-Bas
ed D
iets
on
Mea
sure
s of
Adi
posi
ty
Aut
hors
(Ye
ar),
C
ount
rySt
udy
and
Subj
ect
Des
crip
tion
sIn
terv
enti
ons
Find
ings
Bur
ke e
t al.
(200
8),
Uni
ted
Stat
esR
ando
miz
ed c
ontr
olle
d tr
ial
BM
I 27
–43
kg/m
2
n =
176
Gen
der:
Mal
e, f
emal
eA
ge: 1
8–55
yea
rs o
ld
1.
Sel
f-se
lect
ed la
cto-
ovo
vege
tari
an
(low
-kilo
calo
rie,
low
-fat
) di
et ×
18
mon
ths
2.
Sel
f-se
lect
ed s
tand
ard
low
-kilo
calo
rie,
lo
w-f
at d
iet ×
18
mon
ths
3.
Ass
igne
d to
lact
o-ov
o ve
geta
rian
(l
ow-k
iloca
lori
e, lo
w-f
at)
diet
×
18 m
onth
s
4. A
ssig
ned
to s
tand
ard
low
-kilo
calo
rie,
lo
w-f
at d
iet ×
18
mon
ths
(1–3
incl
uded
gr
adua
l elim
inat
ion
of m
eat,
poul
try,
and
fis
h w
ithin
the
first
6 w
eeks
)Fr
ee-l
ivin
g
Sign
ifica
nt w
eigh
t los
s oc
curr
ed in
all
grou
ps a
fter
6
mon
ths:
9.9
% a
nd 9
.4%
, res
pect
ivel
y, in
gro
ups
1 an
d 3
(p <
0.0
001)
Wei
ght l
oss
afte
r 18
mon
ths
was
5.3
% a
nd 7
.9%
for
gr
oups
1 a
nd 3
, res
pect
ivel
y (p
< 0
.000
1)T
hose
who
sel
f-se
lect
ed th
e ty
pe o
f w
eigh
t los
s di
et
they
wou
ld f
ollo
w h
ad s
igni
fican
tly g
reat
er w
eigh
t re
gain
dur
ing
mon
ths
6–18
than
thos
e w
ho w
ere
assi
gned
to th
eir
resp
ectiv
e gr
oup
(p <
0.0
01)
The
re w
as a
lso
a si
gnifi
cant
red
uctio
n in
BM
I an
d w
aist
ci
rcum
fere
nce
in a
ll gr
oups
; the
dif
fere
nces
bet
wee
n gr
oups
wer
e N
S
Gar
dner
et a
l. (2
007)
, Uni
ted
Stat
es
Ran
dom
ized
tria
lB
MI
25–5
0 kg
/m2
Prem
enop
ausa
ln
= 3
11G
ende
r: F
emal
eA
ge: 2
5–50
yea
rs o
ld
1.
Atk
ins
(low
car
b) ×
2 m
onth
s
2. Z
one
(low
car
b) ×
2 m
onth
s
3. L
EA
RN
× 2
mon
ths
4.
Orn
ish
(hig
h ca
rb)
(n =
76)
× 2
mon
ths
Sign
ifica
nt r
educ
tion
in B
MI
occu
rred
in a
ll gr
oups
but
w
as g
reat
est i
n th
e A
tkin
s’ g
roup
The
Orn
ish
(–0.
77 k
g/m
2 ; p
< 0
.01)
gro
up w
as n
ot
sign
ifica
ntly
dif
fere
nt f
rom
the
Zon
e or
LE
AR
N
grou
ps in
term
s of
red
uctio
n of
BM
IW
eigh
t los
s w
as s
igni
fican
t for
all
grou
ps, w
ith O
rnis
h (–
2.6
kg; 3
.0%
; p <
0.0
01)
not b
eing
sig
nific
antly
di
ffer
ent f
rom
the
othe
r th
ree
grou
psC
hang
es in
per
cent
bod
y fa
t and
wai
st-t
o-hi
p ra
tio w
ere
NS
(Con
tinu
ed)
Copyright Taylor & Francis Group. Do Not Distribute.

146 Vegetarian Nutrition and Wellness
TAB
LE 7
.2 (C
ON
TIN
UED
)In
terv
enti
on S
tudi
es E
xam
inin
g th
e Ef
fect
of P
lant
-Bas
ed D
iets
on
Mea
sure
s of
Adi
posi
ty
Aut
hors
(Ye
ar),
C
ount
rySt
udy
and
Subj
ect
Des
crip
tion
sIn
terv
enti
ons
Find
ings
Mah
on e
t al.
(200
7), U
nite
d St
ates
Ran
dom
ized
con
trol
led
tria
lPo
stm
enop
ausa
lB
MI
25–3
4 kg
/m2
n =
54
Gen
der:
Fem
ale
Age
: 50–
80 y
ears
old
1.
Ene
rgy
rest
rict
ed
Bee
f (1
250
kcal
; 20%
bee
f kc
al; 4
8% c
arb
kcal
, 26%
pro
tein
kca
l, 26
% f
at k
cal)
×
9 w
eeks
2.
Ene
rgy
rest
rict
ed
Chi
cken
(12
50 k
cal;
20%
chi
cken
kca
l; 48
% c
arb
kcal
, 26%
pro
tein
kca
l, 26
% f
at
kcal
) ×
9 w
eeks
3.
Ene
rgy
rest
rict
ed
Lac
to-o
vo c
arb
(125
0 kc
al; 2
0% c
ooki
e an
d ch
ocol
ate
kcal
—in
tent
iona
l to
keep
fib
er in
take
the
sam
e be
twee
n gr
oups
; 58
% c
arb
kcal
, 16%
pro
tein
kca
l, 26
% f
at
kcal
) ×
9 w
eeks
4.
Iso
calo
ric
habi
tual
die
t con
trol
× 9
wee
ks
Fre
e-liv
ing
All
the
ener
gy-r
estr
icte
d gr
oups
exp
erie
nced
a
sign
ifica
nt r
educ
tion
in b
ody
mas
s, f
at m
ass,
per
cent
bo
dy f
at, a
nd f
at-f
ree
mas
s co
mpa
red
with
the
cont
rol
grou
pG
roup
3 h
ad s
igni
fican
tly la
rger
red
uctio
n in
BM
I (–
2.1
kg/m
2 ) th
an th
e co
ntro
l (bu
t sig
nific
antly
less
th
an g
roup
2);
gro
up 3
’s c
hang
e in
bod
y m
ass
(–5.
6 kg
) w
as s
igni
fican
tly le
ss th
an th
at o
f th
e ch
icke
n gr
oup
but s
igni
fican
tly g
reat
er th
an th
at o
f th
e co
ntro
l gr
oup
Dif
fere
nces
for
cha
nges
in f
at m
ass,
per
cent
bod
y fa
t, an
d fa
t-fr
ee m
ass
betw
een
grou
ps 1
, 2, a
nd 3
wer
e N
S;
for
grou
p 3,
thes
e ch
ange
s w
ere
–3.9
kg,
–2.
1%, a
nd
–1.7
kg,
res
pect
ivel
y
(Con
tinu
ed)
Copyright Taylor & Francis Group. Do Not Distribute.

147The Role of Vegetarian Diets in Weight Management
TAB
LE 7
.2 (C
ON
TIN
UED
)In
terv
enti
on S
tudi
es E
xam
inin
g th
e Ef
fect
of P
lant
-Bas
ed D
iets
on
Mea
sure
s of
Adi
posi
ty
Aut
hors
(Ye
ar),
C
ount
rySt
udy
and
Subj
ect
Des
crip
tion
sIn
terv
enti
ons
Find
ings
Tur
ner-
McG
riev
y et
al.
(200
7),
Uni
ted
Stat
es
Ran
dom
ized
tria
lPo
stm
enop
ausa
l ove
rwei
ght/o
bese
n =
62
Gen
der:
Fem
ale
Ave
rage
age
: 57.
4 ye
ars
old
(veg
an
grou
p), 5
5.7
year
s ol
d (N
CE
P gr
oup)
1.
Low
-fat
veg
an d
iet ×
14
wee
ks
a. S
ocia
l sup
port
vs.
b.
Non
e
2. N
CE
P st
ep I
I di
et ×
14
wee
ks
a. S
ocia
l sup
port
vs.
b.
Non
eFr
ee-l
ivin
g
The
veg
an g
roup
exp
erie
nced
sig
nific
ant w
eigh
t los
s at
1
year
(–4
.9 k
g; p
< 0
.001
) an
d 2
year
s (–
3.1
kg;
p <
0.0
1); t
his
was
als
o si
gnifi
cant
ly g
reat
er th
an th
e N
CE
P gr
oup’
s w
eigh
t los
s (p
< 0
.05)
The
veg
an g
roup
sub
ject
s w
ho r
ecei
ved
grou
p su
ppor
t (1
yea
r, –6
.2 k
g; 2
yea
rs, –
5.3
kg; p
< 0
.01)
lost
si
gnifi
cant
ly m
ore
wei
ght t
han
the
unsu
ppor
ted
(1 y
ear,
–2.1
kg;
2 y
ears
, –0.
35 k
g) (
p <
0.0
5)T
he v
egan
gro
up d
iet a
dher
ers
expe
rien
ced
sign
ifica
nt
wei
ght l
oss
(1 y
ear,
–5.9
; p <
0.0
5), b
ut n
ot
sign
ifica
ntly
mor
e th
an n
onad
here
rs (
1 ye
ar, –
3.6)
aft
er
1 ye
ar
Dan
sing
er e
t al.
(200
5), U
nite
d St
ates
Ran
dom
ized
tria
lB
MI
27–4
2 kg
/m2
plus
1
card
iom
etab
olic
ris
k fa
ctor
n =
160
Gen
der:
Mal
e/fe
mal
eA
vera
ge a
ge: 4
9 ye
ars
old
1.
Atk
ins
× 1
yea
r
2. Z
one
× 1
yea
r
3. W
eigh
t Wat
cher
s ×
1 y
ear
4.
Orn
ish
(veg
etar
ian)
× 1
yea
rFr
ee-l
ivin
g
The
Orn
ish
grou
p ha
d si
gnifi
cant
red
uctio
ns in
wei
ght
(–3.
3 kg
; 3.2
%; p
< 0
.01)
, BM
I (–
1.4
kg/m
2 ; p
< 0
.05)
, an
d w
aist
cir
cum
fere
nce
(–2.
2 cm
; p <
0.0
5) a
fter
1
year
; the
se c
hang
es w
ere
not s
igni
fican
tly d
iffe
rent
fr
om th
ose
of o
ther
gro
ups
Am
ong
com
plet
ers,
thes
e ch
ange
s w
ere
of a
larg
er
mag
nitu
de f
or w
eigh
t (–6
.6 k
g; p
< 0
.01)
, BM
I (–
2.3
kg/m
2 ; p
< 0
.01)
, and
wai
st c
ircu
mfe
renc
e (–
4.3
cm)
(Con
tinu
ed)
Copyright Taylor & Francis Group. Do Not Distribute.

148 Vegetarian Nutrition and Wellness
TAB
LE 7
.2 (C
ON
TIN
UED
)In
terv
enti
on S
tudi
es E
xam
inin
g th
e Ef
fect
of P
lant
-Bas
ed D
iets
on
Mea
sure
s of
Adi
posi
ty
Aut
hors
(Ye
ar),
C
ount
rySt
udy
and
Subj
ect
Des
crip
tion
sIn
terv
enti
ons
Find
ings
Bar
nard
et a
l. (2
004,
200
5),
Tur
ner-
McG
riev
y et
al.
(200
4),
Uni
ted
Stat
es
Ran
dom
ized
con
trol
led
tria
lO
verw
eigh
t and
obe
se
(BM
I 26
–44
kg/m
2 )
post
men
opau
sal
n =
59
Gen
der:
Fem
ale
Ave
rage
age
: 55.
6–57
.4 y
ears
old
ac
ross
trea
tmen
t gro
ups
1.
Ver
y-lo
w f
at v
egan
die
t (75
% c
arb
kcal
, 15
% p
rote
in k
cal,
10%
fat
kca
l) ×
14
wee
ks
2. N
CE
P di
et (
55%
car
b kc
al, 1
5% p
rote
in
kcal
, ≤30
% fa
t kca
l; <2
00 m
g ch
oles
tero
l) ×
14
wee
ksFr
ee-l
ivin
g
The
veg
an g
roup
lost
sig
nific
antly
mor
e w
eigh
t tha
n th
e N
CE
P gr
oup
(5.8
kg
[6.5
%]
vs. 3
.8 k
g)p
< 0
.05
BM
I w
as r
educ
ed s
igni
fican
tly c
ompa
red
with
that
of
the
cont
rol g
roup
(–2
.2 k
g/m
2 vs.
–1.
4 kg
/m2 ;
p =
0.0
12),
bu
t thi
s ch
ange
was
not
sig
nific
antly
dif
fere
nt o
ver
time
Wai
st c
ircu
mfe
renc
e w
as r
educ
ed s
igni
fican
tly
com
pare
d w
ith th
at o
f th
e co
ntro
l gro
up (
–4.6
cm
vs
. –2.
5 cm
; p =
0.0
23),
but
this
cha
nge
was
not
si
gnifi
cant
ly d
iffe
rent
ove
r tim
eL
ean
mas
s w
as r
educ
ed s
igni
fican
tly (
–0.7
kg;
p <
0.0
1)
in th
e in
terv
entio
n gr
oup,
but
this
cha
nge
was
not
si
gnifi
cant
ly d
iffe
rent
fro
m th
at in
the
cont
rol g
roup
NS
chan
ges
wer
e no
ted
for
perc
ent b
ody
fat (
–2.9
% in
th
e in
terv
entio
n gr
oup)
, hip
cir
cum
fere
nce,
and
w
aist
-to-
hip
ratio
(Con
tinu
ed)
Copyright Taylor & Francis Group. Do Not Distribute.

149The Role of Vegetarian Diets in Weight Management
TAB
LE 7
.2 (C
ON
TIN
UED
)In
terv
enti
on S
tudi
es E
xam
inin
g th
e Ef
fect
of P
lant
-Bas
ed D
iets
on
Mea
sure
s of
Adi
posi
ty
Aut
hors
(Ye
ar),
C
ount
rySt
udy
and
Subj
ect
Des
crip
tion
sIn
terv
enti
ons
Find
ings
Bar
nard
et a
l. (2
000)
, Uni
ted
Stat
es
Ran
dom
ized
cro
ssov
er tr
ial
Prem
enop
ausa
l with
abd
omin
al
pain
n =
35
Gen
der:
Fem
ale
Age
: >18
yea
rs o
ld
1.
Low
-fat
veg
etar
ian
diet
(10
% f
at k
cal)
×
2 m
enst
rual
cyc
les
2.
Pla
cebo
(ty
pica
l die
t) ×
2 m
enst
rual
cyc
les
Free
-liv
ing
Sign
ifica
nt r
educ
tion
in w
eigh
t (–2
.5 k
g; 3
.6%
; p
< 0
.05)
and
BM
I (0
.9 k
g/m
2 ; p
< 0
.01)
dur
ing
the
low
-fat
veg
etar
ian
inte
rven
tion
com
pare
d w
ith b
asel
ine
Tota
l wei
ght l
ost w
as d
iffe
rent
bet
wee
n th
ese
grou
ps
(NS
betw
een
grou
ps)
-
BM
I <
22 k
g/m
2 =
–1.
4 kg
-
BM
I 22
–26.
5 kg
/m2
= –
3.3
kg
- B
MI
>26
.5 k
g/m
2 =
–2.
9 kg
Orn
ish
et a
l. (1
998)
, Uni
ted
Stat
es
Ran
dom
ized
con
trol
led
tria
lH
x of
ath
eros
cler
osis
n =
35
Gen
der:
Mal
e, f
emal
e (n
o fe
mal
e in
in
terv
entio
n gr
oup)
Ave
rage
age
: 57.
4 ye
ars
old
(int
erve
ntio
n), 6
1.8
year
s ol
d (c
ontr
ol)
1.
Int
ensi
ve li
fest
yle
prog
ram
× 5
yea
rs:
Veg
etar
ian
diet
(10
% f
at k
cal)
, mod
erat
e ae
robi
c ex
erci
se, s
tres
s m
anag
emen
t, sm
okin
g ce
ssat
ion,
gro
up p
sych
sup
port
2.
Con
trol
: Per
sona
l phy
sici
an’s
adv
ice
abou
t lif
esty
le c
hang
es
Exp
erim
enta
l gro
up lo
st 1
0.9
kg (
12%
) by
yea
r 1
(p =
0.0
01)
and
sust
aine
d a
5.8
kg (
6.3%
) lo
ss b
y ye
ar
5 (p
= 0
.001
), w
hich
wer
e si
gnifi
cant
ly g
reat
er th
an
chan
ges
in th
e co
ntro
l gro
up
Del
gado
et a
l. (1
996)
, Spa
inC
ontr
olle
d tr
ial
Hea
lthy
phys
ical
edu
catio
n st
uden
ts
or g
rads
n =
38
Gen
der:
Mal
e, f
emal
eA
ge: 2
0–25
yea
rs o
ld
1.
Lac
to-o
vo v
eget
aria
n di
et ×
2 m
onth
s
2. C
ompa
red
with
non
vege
tari
an a
nd
vege
tari
an a
ge-,
wei
ght-
, die
tary
hab
it–,
and
phys
ical
act
ivity
–mat
ched
con
trol
s on
ha
bitu
al d
iet ×
2 m
onth
sFr
ee-l
ivin
g
NS
wei
ght l
oss—
wei
ght a
ctua
lly s
tabl
e in
the
expe
rim
enta
l gro
up (
68.3
–68.
8 kg
) af
ter
2 m
onth
sSi
mila
rly,
NS
chan
ge in
per
cent
bod
y fa
t and
lean
bod
y m
ass
(Con
tinu
ed)
Copyright Taylor & Francis Group. Do Not Distribute.

150 Vegetarian Nutrition and Wellness
TAB
LE 7
.2 (C
ON
TIN
UED
)In
terv
enti
on S
tudi
es E
xam
inin
g th
e Ef
fect
of P
lant
-Bas
ed D
iets
on
Mea
sure
s of
Adi
posi
ty
Aut
hors
(Ye
ar),
C
ount
rySt
udy
and
Subj
ect
Des
crip
tion
sIn
terv
enti
ons
Find
ings
Orn
ish
et a
l. (1
990)
, Uni
ted
Stat
es
Ran
dom
ized
con
trol
led
tria
lH
x of
cor
onar
y he
art d
isea
sen
= 4
1G
ende
r: M
ale,
fem
ale
(onl
y on
e fe
mal
e in
exp
erim
enta
l gro
up)
Age
: 35–
75 y
ears
old
1.
Lif
esty
le p
rogr
am: L
ow-f
at v
eget
aria
n di
et
(70%
–75%
car
b kc
al, 1
5%–2
0% p
rote
in
kcal
, 10%
fat
kca
l), m
oder
ate
aero
bic
exer
cise
, str
ess
man
agem
ent,
smok
ing
cess
atio
n, g
roup
sup
port
× 1
yea
r
2. C
ontr
ol: U
sual
car
e (n
= 1
9) ×
1 y
ear
P
repa
red
mea
ls a
vaila
ble
if s
ubje
cts
chos
e to
use
them
/fre
e-liv
ing
Sign
ifica
nt w
eigh
t los
s in
exp
erim
enta
l gro
up: 1
0.1
kg
(11%
) (p
< 0
.000
1)
Pres
cott
et a
l. (1
988)
, Aus
tral
iaR
ando
miz
ed tr
ial
n =
50
Gen
der:
Mal
e, f
emal
eA
ge: 1
8–60
yea
rs o
ld
Abs
tain
fro
m c
onsu
min
g m
eat,
fish,
or
poul
try
(2×
wee
ks p
rior
to a
ran
dom
izat
ion
and
cont
inui
ng f
or le
ngth
of
stud
y)
1. M
eat (
prot
ein)
sup
plem
ent (
beef
, chi
cken
, la
mb,
sau
sage
, por
k; p
raw
ns)
× 1
2 w
eeks
2.
Non
mea
t (pr
otei
n) s
uppl
emen
t (ce
real
s,
legu
mes
, nut
s, v
eget
able
s) ×
12
wee
ksSo
me
mea
ls w
ere
prov
ided
(tw
ice
a da
y +
w
eeke
nds)
NS
chan
ge in
wei
ght i
n ei
ther
gro
up
(Con
tinu
ed)
Copyright Taylor & Francis Group. Do Not Distribute.

151The Role of Vegetarian Diets in Weight Management
TAB
LE 7
.2 (C
ON
TIN
UED
)In
terv
enti
on S
tudi
es E
xam
inin
g th
e Ef
fect
of P
lant
-Bas
ed D
iets
on
Mea
sure
s of
Adi
posi
ty
Aut
hors
(Ye
ar),
C
ount
rySt
udy
and
Subj
ect
Des
crip
tion
sIn
terv
enti
ons
Find
ings
Mar
getts
et a
l. (1
986)
, Aus
tral
iaR
ando
miz
ed c
ross
over
tria
lSB
P 15
0–18
0 m
mH
g or
DB
P 90
–110
mm
Hg
and
not o
n H
TN
m
edic
atio
nn
= 5
8G
ende
r: M
ale,
fem
ale
Age
: 30–
64 y
ears
old
1.
Mai
ntai
n ha
bitu
al d
iet f
or d
urat
ion
of
stud
y
2. L
acto
-ovo
veg
etar
ian
diet
× 6
wee
ks
follo
wed
by
habi
tual
die
t × 6
wee
ks
3. H
abitu
al d
iet ×
6 w
eeks
fol
low
ed b
y la
cto-
ovo
vege
tari
an d
iet ×
6 w
eeks
Dur
ing
lact
o-ov
o ve
geta
rian
per
iod,
gro
up 2
gai
ned
~2 k
g an
d gr
oup
3 lo
st <
2 kg
(te
st o
f si
gnifi
canc
e no
t no
ted)
Lin
dahl
et a
l. (1
984)
, Sw
eden
Unc
ontr
olle
d st
udy
HT
Nn
= 2
6G
ende
r: M
ale,
fem
ale
Age
: 25–
70 y
ears
old
Veg
an f
oods
pro
vide
d (f
ruit
juic
e on
ly f
or fi
rst
7 da
ys)
× 1
yea
rFr
ee-l
ivin
g
Sign
ifica
nt w
eigh
t los
s
- A
t 4 m
onth
s: 1
0.2
kg (
13%
) (p
< 0
.001
)
- A
t 1 y
ear:
7.8
kg
(10%
) (p
< 0
.001
)
Orn
ish
et a
l. (1
983)
, Uni
ted
Stat
es
Ran
dom
ized
con
trol
led
feed
ing
tria
lH
x of
isch
emic
hea
rt d
isea
sen
= 4
6G
ende
r: M
ale,
fem
ale
Age
: 45–
75 y
ears
old
1.
Veg
an d
iet (
with
min
imal
non
fat y
ogur
t) ×
24
day
s
2. C
ontr
olIn
terv
entio
n in
clud
ed s
tres
s m
anag
emen
t tra
inin
g
Sign
ifica
nt w
eigh
t los
s (–
4.6
kg/5
.6%
) oc
curr
ed in
the
inte
rven
tion
grou
p (p
< 0
.000
1)
Not
e:
DB
P =
dia
stol
ic b
lood
pre
ssur
e; H
TN
= h
yper
tens
ion;
Hx
= h
isto
ry;
LD
L-C
= l
ow-d
ensi
ty l
ipop
rote
in c
hole
ster
ol;
NS
= n
ot s
igni
fica
nt o
r no
nsig
nifi
cant
; PC
OS
= p
olyc
ystic
ova
ry s
yndr
ome;
SB
P =
sys
tolic
blo
od p
ress
ure.
Copyright Taylor & Francis Group. Do Not Distribute.

152 Vegetarian Nutrition and Wellness
TAB
LE 7
.3In
terv
enti
on S
tudi
es E
xam
inin
g th
e Ef
fect
of P
lant
-Bas
ed D
iets
on
Mea
sure
s of
Adi
posi
ty in
Ind
ivid
uals
wit
h D
iabe
tes
Aut
hors
(Ye
ar),
C
ount
rySt
udy
and
Subj
ect
Des
crip
tion
sIn
terv
enti
ons
Find
ings
Mis
hra
et a
l. (2
013)
, U
nite
d St
ates
Ran
dom
ized
, wor
ksite
pai
r-m
atch
ed c
lust
ers,
con
trol
led
tria
lH
x of
type
2 D
M a
nd/o
r B
MI
≥25
kg/m
2
n =
10
site
s; 2
91G
ende
r: M
ale,
Fem
ale
Age
: >18
yea
rs o
ld
1.
Low
-fat
veg
an d
iet (
75%
car
b kc
al, 1
5%
prot
ein
kcal
, 10%
fat
kca
l) ×
18
wee
ks
2. C
ontr
ol ×
18
wee
ksFr
ee-l
ivin
g
Wei
ght l
oss
and
BM
I w
ere
sign
ifica
ntly
gre
ater
in th
e in
terv
entio
n gr
oup
(–2.
9 kg
, 3%
, p <
0.0
001;
–1
.04
kg/m
2 , p
< 0
.000
1) th
an th
e co
ntro
l gro
up
(–0.
06 k
g an
d –0
.01
kg/m
2 ) (
p <
0.0
01 f
or b
oth
com
pari
sons
) ev
en a
fter
adj
ustin
g fo
r ge
nder
, clu
ster
. an
d ba
selin
e va
lue
A g
reat
er p
ropo
rtio
n of
the
inte
rven
tion
grou
p ex
peri
ence
d ≥5
% w
eigh
t los
s (3
7%)
com
pare
d w
ith
the
cont
rol g
roup
(11
%),
p <
0.0
01W
eigh
t los
s an
d B
MI
wer
e si
gnifi
cant
ly r
educ
ed in
the
inte
rven
tion
grou
p am
ong
prog
ram
com
plet
ers
(–4.
3 kg
, 4.6
%, p
< 0
.001
; –1.
5 kg
/m2 ,
p <
0.0
01),
w
here
as N
S ch
ange
s w
ere
note
d in
the
cont
rol g
roup
(–
0.08
kg;
–0.
02 k
g/m
2 ); t
hese
cha
nges
dif
fere
d si
gnifi
cant
ly b
etw
een
grou
ps (
p <
0.0
01)
even
aft
er
adju
stin
g fo
r ge
nder
, clu
ster
, and
bas
elin
e va
lue
(Con
tinu
ed)
Copyright Taylor & Francis Group. Do Not Distribute.

153The Role of Vegetarian Diets in Weight Management
TAB
LE 7
.3 (C
ON
TIN
UED
)In
terv
enti
on S
tudi
es E
xam
inin
g th
e Ef
fect
of P
lant
-Bas
ed D
iets
on
Mea
sure
s of
Adi
posi
ty in
Ind
ivid
uals
wit
h D
iabe
tes
Aut
hors
(Ye
ar),
C
ount
rySt
udy
and
Subj
ect
Des
crip
tion
sIn
terv
enti
ons
Find
ings
Kah
leov
a et
al.
(201
1), C
zech
R
epub
lic
Ran
dom
ized
con
trol
led
tria
lH
x of
type
2 D
M tr
eate
d w
ith o
ral
hypo
glyc
emic
s, H
gbA
1c
6%–1
1%B
MI
25–5
3 kg
/m2
n =
74
Gen
der:
Mal
e, f
emal
eA
ge: 3
0–70
yea
rs o
ld
1.
Iso
calo
ric
lact
o-ve
geta
rian
die
t (60
% c
arb
kcal
, 15%
pro
tein
kca
l, 25
% f
at k
cal)
×
24 w
eeks
2.
Con
trol
: Con
vent
iona
l dia
betic
die
t (50
%
carb
kca
l, 20
% p
rote
in k
cal,
<30%
fat k
cal)
×
24 w
eeks
Las
t 12
wee
ks in
clud
ed a
n ex
erci
se p
rogr
amM
eals
wer
e pr
ovid
ed
Sign
ifica
nt w
eigh
t los
s in
bot
h gr
oups
, but
it w
as
grea
ter
in th
e ve
geta
rian
die
t gro
up (
–6.2
kg;
6.1
%;
p <
0.0
01)
than
in th
e co
ntro
l (–3
.2 k
g; 3
.2%
; p
< 0
.001
) (p
< 0
.001
)W
aist
cir
cum
fere
nce
decr
ease
d si
gnifi
cant
ly in
bot
h gr
oups
but
to a
gre
ater
ext
ent i
n th
e ve
geta
rian
die
t gr
oup
(–6.
4 cm
) th
an th
e co
ntro
l gro
up (
–5.3
cm
) (p
< 0
.001
); e
xerc
ise
help
ed to
fur
ther
dec
reas
e w
aist
ci
rcum
fere
nce
in th
e ve
geta
rian
gro
up (
–1.9
cm
; p
< 0
.05)
but
not
the
cont
rol g
roup
(+
0.7
cm)
Subc
utan
eous
and
vis
cera
l fat
vol
umes
dec
reas
ed
sign
ifica
ntly
in b
oth
grou
ps, w
ith e
xerc
ise
caus
ing
furt
her
redu
ctio
ns in
the
vege
tari
an d
iet g
roup
but
not
th
e co
ntro
l gro
up
(Con
tinu
ed)
Copyright Taylor & Francis Group. Do Not Distribute.

154 Vegetarian Nutrition and Wellness
TAB
LE 7
.3 (C
ON
TIN
UED
)In
terv
enti
on S
tudi
es E
xam
inin
g th
e Ef
fect
of P
lant
-Bas
ed D
iets
on
Mea
sure
s of
Adi
posi
ty in
Ind
ivid
uals
wit
h D
iabe
tes
Aut
hors
(Ye
ar),
C
ount
rySt
udy
and
Subj
ect
Des
crip
tion
sIn
terv
enti
ons
Find
ings
Ferd
owsi
an e
t al.
(201
0), L
evin
et a
l. (2
010)
, Uni
ted
Stat
es
Site
-spe
cific
des
igna
tion
of
trea
tmen
tsG
EIC
O e
mpl
oyee
s w
ith H
x of
ty
pe 2
DM
and
/or
BM
I ≥2
5 kg
/m2
n =
113
Gen
der:
Mal
e, f
emal
eA
ge: >
18 y
ears
old
1.
Low
-fat
veg
an d
iet ×
22
wee
ks
2. C
ontr
ol ×
22
wee
ksFr
ee-l
ivin
g
Subj
ects
on
the
low
-fat
veg
an d
iet s
igni
fican
tly lo
st
wei
ght (
–5.1
kg/
5.2%
; p <
0.0
001)
, wai
st
circ
umfe
renc
e (–
4.7
cm; p
< 0
.000
1), a
nd h
ip
circ
umfe
renc
e (–
4.5
cm; p
< 0
.000
1)T
hese
cha
nges
wer
e al
so s
igni
fican
tly g
reat
er th
an
chan
ges
in th
e co
ntro
l gro
up (
p <
0.0
001)
The
inte
rven
tion
grou
p ex
peri
ence
d a
sign
ifica
nt
decr
ease
in w
aist
-to-
hip
circ
umfe
renc
e co
mpa
red
with
the
cont
rol g
roup
(p
= 0
.000
7), b
ut th
e ch
ange
ov
er ti
me
was
NS
(Con
tinu
ed)
Copyright Taylor & Francis Group. Do Not Distribute.

155The Role of Vegetarian Diets in Weight Management
TAB
LE 7
.3 (C
ON
TIN
UED
)In
terv
enti
on S
tudi
es E
xam
inin
g th
e Ef
fect
of P
lant
-Bas
ed D
iets
on
Mea
sure
s of
Adi
posi
ty in
Ind
ivid
uals
wit
h D
iabe
tes
Aut
hors
(Ye
ar),
C
ount
rySt
udy
and
Subj
ect
Des
crip
tion
sIn
terv
enti
ons
Find
ings
Bar
nard
et a
l. (2
009a
), U
nite
d St
ates
Ran
dom
ized
con
trol
led
tria
lH
x of
type
2 D
Mn
= 9
9G
ende
r: M
ale,
fem
ale
Ave
rage
age
: 56.
7 ye
ars
old
(veg
an
grou
p), 5
4.6
year
s ol
d (A
DA
gr
oup)
1.
Veg
an d
iet (
75%
car
b kc
al, 1
5% p
rote
in
kcal
, ~10
% f
at k
cal)
× 7
4 w
eeks
2.
200
3 A
DA
gui
delin
es d
iet (
60%
–70%
car
b pl
us M
UFA
s kc
al, 1
5%–2
0% p
rote
in k
cal,
<7%
SA
T f
at k
cal)
; if
BM
I >
25 k
g/m
2 , th
en
a 50
0–10
00 k
cal d
efici
t was
app
lied
Free
-liv
ing
Sign
ifica
nt w
eigh
t los
s in
bot
h gr
oups
but
not
si
gnifi
cant
ly d
iffe
rent
bet
wee
n gr
oups
-
Veg
an: 4
.4 k
g (p
< 0
.000
1)
- A
DA
: 3.0
kg
(p <
0.0
01)
Am
ong
adhe
rent
par
ticip
ants
, tho
se o
n th
e ve
gan
trea
tmen
t los
t 6.8
kg,
whe
reas
thos
e on
the
conv
entio
nal t
reat
men
t los
t 4.9
kg
(NS)
Wai
st c
ircu
mfe
renc
e w
as s
igni
fican
tly r
educ
ed in
bot
h gr
oups
but
not
sig
nific
antly
dif
fere
nt b
etw
een
grou
ps
- V
egan
: 4.2
cm
(p
< 0
.001
)
- C
onve
ntio
nal:
1.8
cm (
p <
0.0
5)H
ip c
ircu
mfe
renc
e w
as s
igni
fican
tly r
educ
ed in
bot
h gr
oups
but
not
sig
nific
antly
bet
wee
n gr
oups
-
Veg
an: –
3.4
cm (
p <
0.0
001)
-
Con
vent
iona
l: –2
.3 c
m (
p <
0.0
1)N
S ch
ange
s in
wai
st-t
o-hi
p ra
tio
(Con
tinu
ed)
Copyright Taylor & Francis Group. Do Not Distribute.
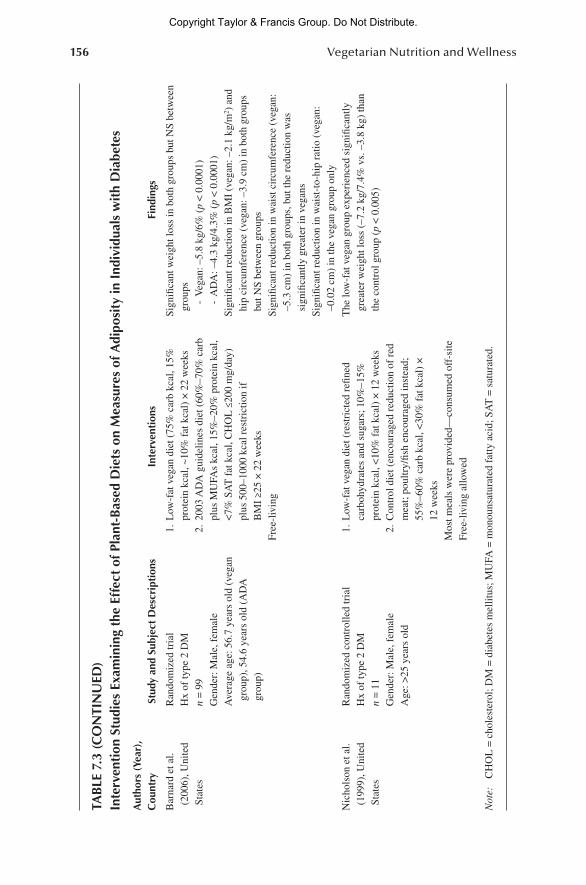
156 Vegetarian Nutrition and Wellness
TAB
LE 7
.3 (C
ON
TIN
UED
)In
terv
enti
on S
tudi
es E
xam
inin
g th
e Ef
fect
of P
lant
-Bas
ed D
iets
on
Mea
sure
s of
Adi
posi
ty in
Ind
ivid
uals
wit
h D
iabe
tes
Aut
hors
(Ye
ar),
C
ount
rySt
udy
and
Subj
ect
Des
crip
tion
sIn
terv
enti
ons
Find
ings
Bar
nard
et a
l. (2
006)
, Uni
ted
Stat
es
Ran
dom
ized
tria
lH
x of
type
2 D
Mn
= 9
9G
ende
r: M
ale,
fem
ale
Ave
rage
age
: 56.
7 ye
ars
old
(veg
an
grou
p), 5
4.6
year
s ol
d (A
DA
gr
oup)
1.
Low
-fat
veg
an d
iet (
75%
car
b kc
al, 1
5%
prot
ein
kcal
, ~10
% f
at k
cal)
× 2
2 w
eeks
2.
200
3 A
DA
gui
delin
es d
iet (
60%
–70%
car
b pl
us M
UFA
s kc
al, 1
5%–2
0% p
rote
in k
cal,
<7%
SA
T f
at k
cal,
CH
OL
≤20
0 m
g/da
y)
plus
500
–100
0 kc
al r
estr
ictio
n if
B
MI
≥25
× 2
2 w
eeks
Free
-liv
ing
Sign
ifica
nt w
eigh
t los
s in
bot
h gr
oups
but
NS
betw
een
grou
ps
- V
egan
: –5.
8 kg
/6%
(p
< 0
.000
1)
- A
DA
: –4.
3 kg
/4.3
% (
p <
0.0
001)
Sign
ifica
nt r
educ
tion
in B
MI
(veg
an: –
2.1
kg/m
2 ) a
nd
hip
circ
umfe
renc
e (v
egan
: –3.
9 cm
) in
bot
h gr
oups
bu
t NS
betw
een
grou
psSi
gnifi
cant
red
uctio
n in
wai
st c
ircu
mfe
renc
e (v
egan
: –5
.3 c
m)
in b
oth
grou
ps, b
ut th
e re
duct
ion
was
si
gnifi
cant
ly g
reat
er in
veg
ans
Sign
ifica
nt r
educ
tion
in w
aist
-to-
hip
ratio
(ve
gan:
–0
.02
cm)
in th
e ve
gan
grou
p on
ly
Nic
hols
on e
t al.
(199
9), U
nite
d St
ates
Ran
dom
ized
con
trol
led
tria
lH
x of
type
2 D
Mn
= 1
1G
ende
r: M
ale,
fem
ale
Age
: >25
yea
rs o
ld
1.
Low
-fat
veg
an d
iet (
rest
rict
ed r
efine
d ca
rboh
ydra
tes
and
suga
rs; 1
0%–1
5%
prot
ein
kcal
, <10
% f
at k
cal)
× 1
2 w
eeks
2.
Con
trol
die
t (en
cour
aged
red
uctio
n of
red
m
eat;
poul
try/
fish
enco
urag
ed in
stea
d;
55%
–60%
car
b kc
al, <
30%
fat
kca
l) ×
12
wee
ksM
ost m
eals
wer
e pr
ovid
ed—
cons
umed
off
-site
Free
-liv
ing
allo
wed
The
low
-fat
veg
an g
roup
exp
erie
nced
sig
nific
antly
gr
eate
r w
eigh
t los
s (–
7.2
kg/7
.4%
vs.
–3.
8 kg
) th
an
the
cont
rol g
roup
(p
< 0
.005
)
Not
e:
CH
OL
= c
hole
ster
ol; D
M =
dia
bete
s m
ellit
us; M
UFA
= m
onou
nsat
urat
ed f
atty
aci
d; S
AT
= s
atur
ated
.
Copyright Taylor & Francis Group. Do Not Distribute.
157The Role of Vegetarian Diets in Weight Management
Several of these studies have been successful for weight management. A 12-week low-fat vegan diet resulted in significantly greater weight loss (7.4%) than the control diet (Nicholson et al., 1999). A 24-week lacto-vegetarian diet intervention resulted in a 6.1% weight loss, which was significantly greater than loss on a conventional dia-betic diet (3.2%) (Kahleova et al., 2011). Additionally, waist circumference decreased significantly in both groups, but to a greater extent in the vegetarian group (6.4 cm vs. 5.3 cm) (Kahleova et al., 2011). The last 12 weeks of the intervention included an exercise program. Exercise was found to help further decrease waist circumference and subcutaneous and visceral fat in the vegetarian group but not the control group (Kahleova et al., 2011).
Barnard and colleagues (2006) compared a low-fat vegan diet to hypocaloric American Diabetes Association (ADA) guidelines for 22 weeks and later followed them for 74 weeks (Barnard et al., 2009a). After the initial 22-week intervention period, subjects in both groups experienced significant reductions in weight, BMI, and waist circumference, but the reductions were not significantly different between the groups. The vegan group also experienced a significant reduction in waist-to-hip ratio (0.02 cm) (Barnard et al., 2006). After 74 weeks, significant weight loss was noted for both the vegan (4.4 kg) and ADA (3.0 kg) groups (not significant between groups). Among those who remained adherent to the vegan diet, weight loss aver-aged 6.8 kg after 74 weeks (Barnard et al., 2009a). Waist circumference and hip cir-cumference were significantly reduced for both groups, but the changes for average waist-to-hip ratio were not significant. The reduction in waist circumference in the vegan group was 4.2 cm at the end of 74 weeks.
A few worksite studies of GEICO employees have been conducted to evaluate the effect of a low-fat vegan diet on individuals with a history of type 2 diabetes and/or overweight and/or obesity (Ferdowsian et al., 2010; Levin et al., 2010; Mishra et al., 2013). In an initial study (n = 113), GEICO sites were designated for inclusion in either a low-fat vegan diet intervention or the control group (Ferdowsian et al., 2010; Levin et al., 2010). The low-fat vegan diet intervention resulted in a 5.2% weight loss (p < 0.0001), 4.7 cm reduction in waist circumference (p < 0.0001), and 4.5 cm reduction in hip circumference (p < 0.0001) after 22 weeks, and these reductions were signifi-cantly greater than changes in the control group (Ferdowsian et al., 2010; Levin et al., 2010). In an expanded GEICO worksite study (n = 291 subjects at 10 sites), sites were randomly allocated to a low-fat vegan diet or control diet for 18 weeks (Mishra et al., 2013). Weight loss (3%) and BMI (1.04 kg/m2) were significantly reduced in the inter-vention group, and these changes were significantly greater than changes in the control group (Mishra et al., 2013). A greater proportion of the intervention group experienced ≥5% weight loss than the control group (37% vs. 11%; p < 0.001) (Mishra et al., 2013).
7.3.2 StuDieS in inDiViDualS With a hiStory of rheumatoiD arthritiS
A few studies have been conducted to examine the effect of plant-based diets on relieving the symptoms of rheumatoid arthritis. Changes in weight were also mea-sured in these studies. An uncontrolled study of a 4-week low-fat vegan diet inter-vention yielded a 4.4% weight loss (p < 0.001) (McDougall et al., 2002). A 4-month vegan intervention also resulted in significant weight loss (4.8 kg) (Skoldstam, 1986).
Copyright Taylor & Francis Group. Do Not Distribute.
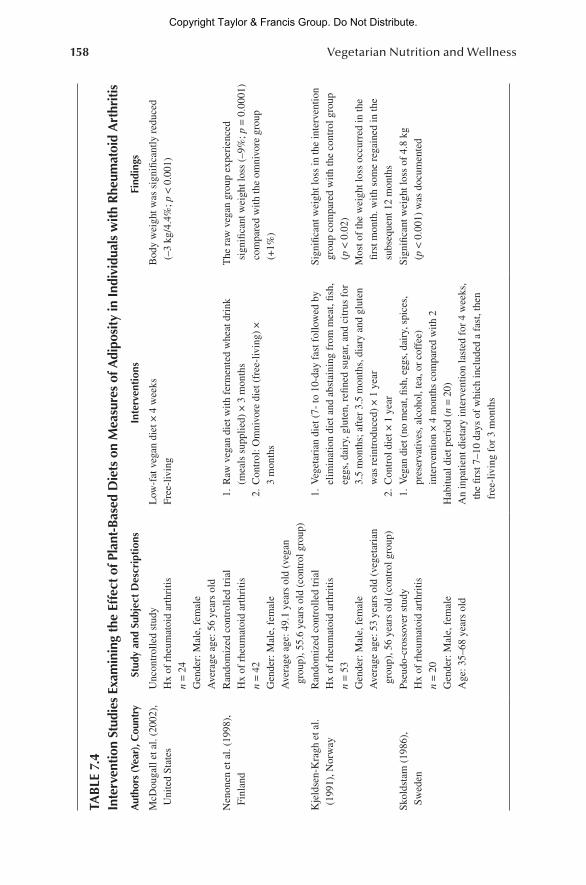
158 Vegetarian Nutrition and Wellness
TAB
LE 7
.4In
terv
entio
n St
udie
s Ex
amin
ing
the
Effe
ct o
f Pla
nt-B
ased
Die
ts o
n M
easu
res
of A
dipo
sity
in In
divi
dual
s w
ith R
heum
atoi
d A
rthr
itis
Aut
hors
(Yea
r), C
ount
rySt
udy
and
Subj
ect
Des
crip
tion
sIn
terv
enti
ons
Find
ings
McD
ouga
ll et
al.
(200
2),
Uni
ted
Stat
esU
ncon
trol
led
stud
yH
x of
rhe
umat
oid
arth
ritis
n =
24
Gen
der:
Mal
e, f
emal
eA
vera
ge a
ge: 5
6 ye
ars
old
Low
-fat
veg
an d
iet ×
4 w
eeks
Free
-liv
ing
Bod
y w
eigh
t was
sig
nific
antly
red
uced
(–
3 kg
/4.4
%; p
< 0
.001
)
Nen
onen
et a
l. (1
998)
, Fi
nlan
dR
ando
miz
ed c
ontr
olle
d tr
ial
Hx
of r
heum
atoi
d ar
thri
tisn
= 4
2G
ende
r: M
ale,
fem
ale
Ave
rage
age
: 49.
1 ye
ars
old
(veg
an
grou
p), 5
5.6
year
s ol
d (c
ontr
ol g
roup
)
1.
Raw
veg
an d
iet w
ith f
erm
ente
d w
heat
dri
nk
(mea
ls s
uppl
ied)
× 3
mon
ths
2.
Con
trol
: Om
nivo
re d
iet (
free
-liv
ing)
×
3 m
onth
s
The
raw
veg
an g
roup
exp
erie
nced
si
gnifi
cant
wei
ght l
oss
(–9%
; p =
0.0
001)
co
mpa
red
with
the
omni
vore
gro
up
(+1%
)
Kje
ldse
n-K
ragh
et a
l. (1
991)
, Nor
way
Ran
dom
ized
con
trol
led
tria
lH
x of
rhe
umat
oid
arth
ritis
n =
53
Gen
der:
Mal
e, f
emal
eA
vera
ge a
ge: 5
3 ye
ars
old
(veg
etar
ian
grou
p), 5
6 ye
ars
old
(con
trol
gro
up)
1.
Veg
etar
ian
diet
(7-
to 1
0-da
y fa
st f
ollo
wed
by
elim
inat
ion
diet
and
abs
tain
ing
from
mea
t, fis
h,
eggs
, dai
ry, g
lute
n, r
efine
d su
gar,
and
citr
us f
or
3.5
mon
ths;
aft
er 3
.5 m
onth
s, d
iary
and
glu
ten
was
rei
ntro
duce
d) ×
1 y
ear
2.
Con
trol
die
t × 1
yea
r
Sign
ifica
nt w
eigh
t los
s in
the
inte
rven
tion
grou
p co
mpa
red
with
the
cont
rol g
roup
(p
< 0
.02)
Mos
t of
the
wei
ght l
oss
occu
rred
in th
e fir
st m
onth
. with
som
e re
gain
ed in
the
subs
eque
nt 1
2 m
onth
s
Skol
dsta
m (
1986
),
Swed
enPs
eudo
-cro
ssov
er s
tudy
Hx
of r
heum
atoi
d ar
thri
tisn
= 2
0G
ende
r: M
ale,
fem
ale
Age
: 35–
68 y
ears
old
1.
Veg
an d
iet (
no m
eat,
fish,
egg
s, d
airy
, spi
ces,
pr
eser
vativ
es, a
lcoh
ol, t
ea, o
r co
ffee
) in
terv
entio
n ×
4 m
onth
s co
mpa
red
with
2H
abitu
al d
iet p
erio
d (n
= 2
0)A
n in
patie
nt d
ieta
ry in
terv
entio
n la
sted
for
4 w
eeks
, th
e fir
st 7
–10
days
of
whi
ch in
clud
ed a
fas
t, th
en
free
-liv
ing
for
3 m
onth
s
Sign
ifica
nt w
eigh
t los
s of
4.8
kg
(p <
0.0
01)
was
doc
umen
ted
Copyright Taylor & Francis Group. Do Not Distribute.

159The Role of Vegetarian Diets in Weight Management
In a 3-month trial, subjects consuming a raw vegan diet experienced significantly greater weight loss (9%) than those in an omnivore group (gained 1%) (Nenonen et al., 1998). In another study, a vegetarian diet resulted in significant weight loss compared with the control group after 1 year (Kjeldsen-Kragh et al., 1991). See Table 7.4 for details.
7.4 CONCLUSION
A trend is apparent in that populations that include a variety of dietary patterns, those individuals on more of a plant-based pattern, including a spectrum of vegans to semivegetarians, will exhibit lower excess adiposity. In most intervention studies, subjects on the plant-based interventions have experienced significant weight loss, ranging from 1.8% to 13% for vegan interventions and 3.2% to 9.9% for vegetarians over a wide variety of intervention times. Even pesco- and semivegetarian dietary interventions are successful. The weight loss noted in most of these studies meets or exceeds AND recommendations for weight loss. Additionally, because adherence to a diet or dietary pattern is an important factor for maintaining weight loss, it is useful to consider the likelihood that individuals can adhere to a vegan or vegetarian diet long term. Good adherence has been demonstrated in a number of long-term studies, measured up to 5 years (Ornish et al., 1998; Turner-McGrievy et al., 2007; Burke et al., 2008; Barnard et al., 2009b; Moore et al., 2015). Even among subjects who do not fully adhere to study diets, they still exhibit a pattern closer to a vegetarian one and can still experience significant weight loss (Moore et al., 2015). Additionally, according to AND, when dietary patterns are used as weight loss interventions, they should “have either an explicit energy goal per day or provide an ad libitum approach without a formal energy goal that still produces a reduction in energy intake, usu-ally by restriction or elimination of specific foods and/or food groups” (Raynor and Champagne, 2016, p. 134). The use of an ad libitum approach when recommending a plant-based pattern has successfully led to a reduction in calories in a number of intervention studies (Barnard et al., 2005; Dansinger et al., 2005; Gardner et al., 2007; Turner-McGrievy et al., 2015).
7.4.1 mechaniSmS
There are possible mechanisms that help to explain why plant-based dietary patterns may be beneficial for weight management. These include differences in the nutrient, food group, and phytochemical profile between plant-based and omnivore patterns. These differences may have implications in gut microbiota profiles that can affect weight.
7.4.1.1 Nutrient Intake Trends in Plant-Based PatternsTotal kilocalorie intake, on average, tends to be lower in individuals on plant-based diets than in nonvegetarians. The reduction in energy intake is partly explained by a higher intake of fiber (Berkow and Barnard, 2006). Researchers report that for every 14 g/day increase of fiber, there is a concomitant reduction in kilocalorie intake of 10% (Berkow and Barnard, 2006).
Copyright Taylor & Francis Group. Do Not Distribute.
160 Vegetarian Nutrition and Wellness
Higher intakes of dietary fiber in vegans and vegetarians may help to explain the weight management benefits of such dietary patterns (Key et al., 2006). Individuals following plant-based diets tend to consume greater amounts of fiber-rich foods, like fruits, vegetables, and whole grains, than nonvegetarians (Newby et al., 2005; Farmer et al., 2011; Orlich et al., 2014). Fiber helps to increase satiety and reduce overall energy density of diets, both of which result in a lower kilocalorie intake (Berkow and Barnard, 2006; Barnard et al., 2009c). Viscous fiber may have an impact by slowing down digestion (Huang et al., 2016), which could theoretically reduce absorption. There is evidence to support an inverse relationship between fiber intake and weight (Berkow and Barnard, 2006; Huang et al., 2016).
Vegetarians and vegans typically tend to have higher intakes of carbohydrate, while having lower protein and fat intake than nonvegetarians (Berkow and Barnard, 2006; Farmer et al., 2011), and this pattern is evident in various cohorts (Appleby et al., 1999; Davey et al., 2003; Orlich and Fraser, 2014). This ratio of macronutrient intake is associated with a lower BMI (Berkow and Barnard, 2006). High intakes of carbohydrate may increase the thermic effect of food, thereby increasing energy expenditure (Berkow and Barnard, 2006). In terms of protein, it has been suggested that plant proteins may have less of an impact on insulin secretion and increases in glucagon secretion (Berkow and Barnard, 2006), which are catabolic actions.
7.4.1.2 Implications of Dietary Patterns on Gut MicrobiotaResearch on the effect of nutrients, nonnutritive compounds (like phytochemicals), foods, and dietary patterns on gut microbiota may help us to better elucidate the positive effects of plant-based dietary patterns. There is evidence that different dietary patterns result in variation of gut microbiota composition (Glick-Bauer and Yeh, 2014; Wong, 2014; Tomasello et al., 2016). Gut microbiota can be altered in such a way as to increase or decrease risk of weight gain (Delzenne et al., 2011). Microbiota can affect adiposity by impacting energy extraction during digestion, affecting metabolism of carbohydrate and fat, increasing inflammation, regulating enteroendocrine cells (which release glucagon-like peptides [GLPs]), and stimulat-ing gut hormones (which affect appetite and weight) (Ley, 2010; Glick-Bauer and Yeh, 2014; Wong, 2014). Gut microbiota profiles that are related to increased obesity include reduced numbers of Bacteroidetes and Bifidobacterium, higher numbers of Firmicutes, and overall reduction in bacterial diversity (Ley, 2010; Delzenne et al., 2011; Wong, 2014). Gut microbiota interact with the endocannabinoid system to reg-ulate the growth and reduction of adipose tissue (Delzenne et al., 2011).
There are a few dietary factors prevalent in plant-based patterns that can impact gut microbiota profiles positively. Carbohydrates, specifically resistant starches and dietary fiber, which are fermented in the colon, can alter gut microbiota (Delzenne et al., 2011; Wong, 2014; Tomasello et al., 2016). Dietary fiber, specifically inulin-type fructans, can increase Bifidobacterium and reduce Bacteroides numbers in the gut (Delzenne et al., 2011; Wong, 2014). Inulin-type fructans can impact the size of adipocytes by interacting with the endocannabinoid system and inhibiting the expression of G-protein-coupled receptor 43 (GPR43) (Delzenne et al., 2011). Fruits and vegetables are good sources of fructans (Delzenne et al., 2011).
Copyright Taylor & Francis Group. Do Not Distribute.

161The Role of Vegetarian Diets in Weight Management
Polyphenols have also been found to increase Bifidobacterium and reduce Bacteroides (do Rosario et al., 2016). Food sources of polyphenols include fruits, vegetables, legumes, chocolate, and coffee (Burkholder-Cooley et al., 2016). Among noncoffee consumers in the AHS-2 cohort, vegans have the highest mean consump-tion of polyphenols (Burkholder-Cooley et al., 2016).
A high intake of dietary fat can cause dysbiosis, leading to deleterious impacts on fat metabolism and inflammation (Ley, 2010; Tomasello et al., 2016). High-fat diets also decrease Bifidobacterium numbers (Ley, 2010). Additionally, omnivore patterns have been associated with lower gut microbiota diversity than plant-based patterns (Wong, 2014). Since healthy plant-based patterns, particularly vegan diets, tend to be low in fat and low or absent in animal food products, it can be hypothesized that they would not result in these deleterious effects.
Recent research indicates that individuals on plant-based diets have a greater number of Bacteroidetes, specifically Prevotella, and higher diversity of bacteria, but lower numbers of Firmicutes and Bacteroides in the gut (Liszt et al., 2009; Glick-Bauer and Yeh, 2014; Wong, 2014; do Rosario et al., 2016). Some stud-ies have yielded contrary or null results, and some phyla include both harmful and protective species of bacteria (Tap et al., 2009; Glick-Bauer and Yeh, 2014; do Rosario et al., 2016). Clearly, much more research is needed to come to defini-tive conclusions.
7.4.1.3 SatietyInulin-type fructans can also increase GLP-1, which subsequently reduces appetite and increases satiety, leading to a reduction in kilocalorie intake (Delzenne et al., 2011). Additionally, GLP-1 has been found to reduce fat mass (Delzenne et al., 2011).
7.4.2 reSearch gaPS
Much more research is needed to fully elucidate the mechanisms that explain why plant-based diets are beneficial for weight loss. Additionally, although there have been studies that include various ethnic groups, there is not enough research in many groups in order to come to a consensus of the overall effectiveness of plant-based diets for weight management, especially the long-term maintenance of weight loss or a healthy weight. Long-term studies (beyond 5 years) are needed to evaluate the full impact of adherence with plant-based diets in terms of maintaining weight loss. Long-term studies may also help to assess whether changing dietary patterns can have a significant impact on altering gut microbiota.
REFERENCES
Agrawal S, Millett CJ, Dhillon PK, Subramanian SV, Ebrahim S. 2014. Type of veg-etarian diet, obesity and diabetes in adult Indian population. Nutr J 13:89. doi: 10.1186/1475-2891-13-89.
Alewaeters K, Clarys P, Hebbelinck M, Deriemaeker P, Clarys JP. 2005. Cross-sectional analysis of BMI and some lifestyle variables in Flemish vegetarians compared with non-vegetarians. Ergonomics 48 (11–14):1433–44. doi: 10.1080/00140130500101031.
Copyright Taylor & Francis Group. Do Not Distribute.
162 Vegetarian Nutrition and Wellness
AND (Academy of Nutrition and Dietetics). 2014a. Adult weight management: Dietary approaches for caloric reduction 2014. http://www.andeal.org/ (accessed May 25, 2017).
AND (Academy of Nutrition and Dietetics). 2014b. Adult weight management: Realistic weight goal setting 2014. http://www.andeal.org/ (accessed May 25, 2017).
Appleby PN, Thorogood M, Mann JI, Key TJ. 1998. Low body mass index in non-meat eat-ers: The possible roles of animal fat, dietary fibre and alcohol. Int J Obes Relat Metab Disord 22 (5):454–60.
Appleby PN, Thorogood M, Mann JI, Key TJ. 1999. The Oxford Vegetarian Study: An over-view. Am J Clin Nutr 70 (3 Suppl.):525S–31S.
Armstrong B, Clarke H, Martin C, Ward W, Norman N, Masarei J. 1979. Urinary sodium and blood pressure in vegetarians. Am J Clin Nutr 32 (12):2472–6.
Armstrong B, van Merwyk AJ, Coates H. 1977. Blood pressure in Seventh-day Adventist vegetarians. Am J Epidemiol 105 (5):444–9.
Armstrong BK, Brown JB, Clarke HT, Crooke DK, Hahnel R, Masarei JR, Ratajczak T. 1981. Diet and reproductive hormones: A study of vegetarian and nonvegetarian postmeno-pausal women. J Natl Cancer Inst 67 (4):761–7.
Baig JA, Sheikh SA, Islam I, Kumar M. 2013. Vitamin D status among vegetarians and non-vegetarians. J Ayub Med Coll Abbottabad 25 (1–2):152–5.
Baines S, Powers J, Brown WJ. 2007. How does the health and well-being of young Australian vegetarian and semi-vegetarian women compare with non-vegetarians? Public Health Nutr 10 (5):436–42. doi: 10.1017/S1368980007217938.
Balliett M, Burke JR. 2013. Changes in anthropometric measurements, body composition, blood pressure, lipid profile, and testosterone in patients participating in a low-energy dietary intervention. J Chiropr Med 12 (1):3–14. doi: 10.1016/j.jcm.2012.11.003.
Barnard ND, Cohen J, Jenkins DJ, Turner-McGrievy G, Gloede L, Green A, Ferdowsian H. 2009a. A low-fat vegan diet and a conventional diabetes diet in the treatment of type 2 diabetes: A randomized, controlled, 74-wk clinical trial. Am J Clin Nutr 89 (5):1588S–96S. doi: 10.3945/ajcn.2009.26736H.
Barnard ND, Cohen J, Jenkins DJ, Turner-McGrievy G, Gloede L, Jaster B, Seidl K, Green AA, Talpers S. 2006. A low-fat vegan diet improves glycemic control and cardiovas-cular risk factors in a randomized clinical trial in individuals with type 2 diabetes. Diabetes Care 29 (8):1777–83. doi: 10.2337/dc06-0606.
Barnard ND, Gloede L, Cohen J, Jenkins DJ, Turner-McGrievy G, Green AA, Ferdowsian H. 2009b. A low-fat vegan diet elicits greater macronutrient changes, but is compa-rable in adherence and acceptability, compared with a more conventional diabetes diet among individuals with type 2 diabetes. J Am Diet Assoc 109 (2):263–72. doi: 10.1016/j .jada.2008.10.049.
Barnard ND, Katcher HI, Jenkins DJ, Cohen J, Turner-McGrievy G. 2009c. Vegetarian and vegan diets in type 2 diabetes management. Nutr Rev 67 (5):255–63. doi: 10.1111/j.1753-4887.2009.00198.x.
Barnard ND, Levin SM, Yokoyama Y. 2015. A systematic review and meta-analysis of changes in body weight in clinical trials of vegetarian diets. J Acad Nutr Diet 115 (6):954–69. doi: 10.1016/j.jand.2014.11.016.
Barnard ND, Scialli AR, Bertron P, Hurlock D, Edmonds K, Talev L. 2000. Effectiveness of a low-fat vegetarian diet in altering serum lipids in healthy premenopausal women. Am J Cardiol 85 (8):969–72.
Barnard ND, Scialli AR, Turner-McGrievy G, Lanou AJ. 2004. Acceptability of a low-fat vegan diet compares favorably to a step II diet in a randomized, controlled trial. J Cardiopulm Rehabil 24 (4):229–35.
Barnard ND, Scialli AR, Turner-McGrievy G, Lanou AJ, Glass J. 2005. The effects of a low-fat, plant-based dietary intervention on body weight, metabolism, and insulin sensitiv-ity. Am J Med 118 (9):991–7. doi: 10.1016/j.amjmed.2005.03.039.
Copyright Taylor & Francis Group. Do Not Distribute.

163The Role of Vegetarian Diets in Weight Management
Barr SI, Broughton TM. 2000. Relative weight, weight loss efforts and nutrient intakes among health-conscious vegetarian, past vegetarian and nonvegetarian women ages 18 to 50. J Am Coll Nutr 19 (6):781–8.
Bastien M, Poirier P, Lemieux I, Despres JP. 2014. Overview of epidemiology and contri-bution of obesity to cardiovascular disease. Prog Cardiovasc Dis 56 (4):369–81. doi: 10.1016/j.pcad.2013.10.016.
Bedford JL, Barr SI. 2005. Diets and selected lifestyle practices of self-defined adult vegetar-ians from a population-based sample suggest they are more ‘health conscious’. Int J Behav Nutr Phys Act 2 (1):4. doi: 10.1186/1479-5868-2-4.
Berkow SE, Barnard N. 2006. Vegetarian diets and weight status. Nutr Rev 64 (4):175–88.Bloomer RJ, Kabir MM, Canale RE, Trepanowski JF, Marshall KE, Farney TM, Hammond
KG. 2010. Effect of a 21 day Daniel Fast on metabolic and cardiovascular disease risk factors in men and women. Lipids Health Dis 9:94. doi: 10.1186/1476-511X-9-94.
Brathwaite N, Fraser HS, Modeste N, Broome H, King R. 2003. Obesity, diabetes, hyperten-sion, and vegetarian status among Seventh-day Adventists in Barbados: Preliminary results. Ethn Dis 13 (1):34–9.
Burke LE, Warziski M, Styn MA, Music E, Hudson AG, Sereika SM. 2008. A randomized clinical trial of a standard versus vegetarian diet for weight loss: The impact of treat-ment preference. Int J Obes (Lond) 32 (1):166–76. doi: 10.1038/sj.ijo.0803706.
Burkholder-Cooley N, Rajaram S, Haddad E, Fraser GE, Jaceldo-Siegl K. 2016. Comparison of polyphenol intakes according to distinct dietary patterns and food sources in the Adventist Health Study-2 cohort. Br J Nutr 115 (12):2162–9. doi: 10.1017 /S0007114516001331.
Burr ML, Bates CJ, Fehily AM, St Leger AS. 1981. Plasma cholesterol and blood pressure in vegetarians. J Hum Nutr 35 (6):437–41.
Cade JE, Burley VJ, Greenwood DC, UK Women’s Cohort Study Steering Group. 2004. The UK Women’s Cohort Study: comparison of vegetarians, fish-eaters and meat-eaters. Public Health Nutr 7 (7):871–8.
CDC (Centers for Disease Control and Prevention). 2016a. Adult obesity facts. https://www .cdc.gov/obesity/data/adult.html (last modified September 1, 2016; accessed March 15, 2017).
CDC (Centers for Disease Control and Prevention). 2016b. Childhood obesity facts. https://www.cdc.gov/obesity/data/childhood.html (last modified December 22, 2016; accessed March 15, 2017).
CDC (Centers for Disease Control and Prevention). 2016c. Overweight and obesity. Adult obesity causes and consequences. https://www.cdc.gov/obesity/adult/causes.html (last modified August 15, 2016; accessed May 24, 2017).
CDC (Centers for Disease Control and Prevention). 2016d. Overweight and obesity. Defining adult overweight and obesity. https://www.cdc.gov/obesity/adult/defining.html (last modified June 16, 2016; accessed May 24, 2017).
CDC (Centers for Disease Control and Prevention). 2017. National Center for Health Statistics. Deaths and mortality. http://www.cdc.gov/nchs/fastats/deaths.htm (last modified March 17, 2017; accessed May 24, 2017).
Chang-Claude J, Frentzel-Beyme R. 1993. Dietary and lifestyle determinants of mortality among German vegetarians. Int J Epidemiol 22 (2):228–36.
Chiu YF, Hsu CC, Chiu TH, Lee CY, Liu TT, Tsao CK, Chuang SC, Hsiung CA. 2015. Cross-sectional and longitudinal comparisons of metabolic profiles between vegetarian and non-vegetarian subjects: A matched cohort study. Br J Nutr 114 (8):1313–20. doi: 10.1017/S0007114515002937.
Clarys P, Deliens T, Huybrechts I, Deriemaeker P, Vanaelst B, De Keyzer W, Hebbelinck M, Mullie P. 2014. Comparison of nutritional quality of the vegan, vegetarian, semi-vegetarian, pesco-vegetarian and omnivorous diet. Nutrients 6 (3):1318–32. doi: 10.3390/nu6031318.
Copyright Taylor & Francis Group. Do Not Distribute.
164 Vegetarian Nutrition and Wellness
Dansinger ML, Gleason JA, Griffith JL, Selker HP, Schaefer EJ. 2005. Comparison of the Atkins, Ornish, Weight Watchers, and Zone diets for weight loss and heart disease risk reduction: A randomized trial. JAMA 293 (1):43–53. doi: 10.1001/jama.293.1.43.
Davey GK, Spencer EA, Appleby PN, Allen NE, Knox KH, Key TJ. 2003. EPIC-Oxford: Lifestyle characteristics and nutrient intakes in a cohort of 33 883 meat-eaters and 31 546 non meat-eaters in the UK. Public Health Nutr 6 (3):259–69. doi: 10.1079 /PHN2002430.
Delgado M, Gutierrez A, Cano MD, Castillo MJ. 1996. Elimination of meat, fish, and derived products from the Spanish-Mediterranean diet: Effect on the plasma lipid profile. Ann Nutr Metab 40 (4):202–11.
Delzenne NM, Neyrinck AM, Backhed F, Cani PD. 2011. Targeting gut microbiota in obesity: Effects of prebiotics and probiotics. Nat Rev Endocrinol 7 (11):639–46. doi: 10.1038 /nrendo.2011.126.
DHHS (U.S. Department of Health and Human Services) and USDA (U.S. Department of Agriculture). 2015. 2015–2020 Dietary Guidelines for Americans. Washington, DC: DHHS.
do Rosario VA, Fernandes R, Trindade EB. 2016. Vegetarian diets and gut microbiota: Important shifts in markers of metabolism and cardiovascular disease. Nutr Rev 74 (7):444–54. doi: 10.1093/nutrit/nuw012.
Faber M, Gouws E, Benade AJ, Labadarios D. 1986. Anthropometric measurements, dietary intake and biochemical data of South African lacto-ovovegetarians. S Afr Med J 69 (12):733–8.
Famodu AA, Osilesi O, Makinde YO, Osonuga OA. 1998. Blood pressure and blood lipid levels among vegetarian, semi-vegetarian, and non-vegetarian native Africans. Clin Biochem 31 (7):545–9.
Famodu AA, Osilesi O, Makinde YO, Osonuga OA, Fakoya TA, Ogunyemi EO, Egbenehkhuere IE. 1999. The influence of a vegetarian diet on haemostatic risk factors for cardiovascular disease in Africans. Thromb Res 95 (1):31–6.
Farmer B, Larson BT, Fulgoni VL 3rd, Rainville AJ, Liepa GU. 2011. A vegetarian dietary pattern as a nutrient-dense approach to weight management: An analysis of the National Health and Nutrition Examination Survey 1999–2004. J Am Diet Assoc 111 (6):819–27. doi: 10.1016/j.jada.2011.03.012.
Ferdowsian HR, Barnard ND, Hoover VJ, Katcher HI, Levin SM, Green AA, Cohen JL. 2010. A multicomponent intervention reduces body weight and cardiovascular risk at a GEICO corporate site. Am J Health Promot 24 (6):384–7. doi: 10.4278/ajhp.081027-QUAN-255.
Fontana L, Meyer TE, Klein S, Holloszy JO. 2007. Long-term low-calorie low-protein vegan diet and endurance exercise are associated with low cardiometabolic risk. Rejuvenation Res 10 (2):225–34. doi: 10.1089/rej.2006.0529.
Fraser G, Katuli S, Anousheh R, Knutsen S, Herring P, Fan J. 2015. Vegetarian diets and cardiovascular risk factors in black members of the Adventist Health Study-2. Public Health Nutr 18 (3):537–45. doi: 10.1017/S1368980014000263.
Fraser GE. 1999. Associations between diet and cancer, ischemic heart disease, and all-cause mortality in non-Hispanic white California Seventh-day Adventists. Am J Clin Nutr 70 (3 Suppl.):532S–8S.
Gadgil MD, Anderson CA, Kandula NR, Kanaya AM. 2014. Dietary patterns in Asian Indians in the United States: An analysis of the metabolic syndrome and atheroscle-rosis in South Asians Living in America study. J Acad Nutr Diet 114 (2):238–43. doi: 10.1016/j.jand.2013.09.021.
Gardner CD, Kiazand A, Alhassan S, Kim S, Stafford RS, Balise RR, Kraemer HC, King AC. 2007. Comparison of the Atkins, Zone, Ornish, and LEARN diets for change in weight and related risk factors among overweight premenopausal women: The A to Z Weight Loss Study: a randomized trial. JAMA 297 (9):969–77. doi: 10.1001/jama.297.9.969.
Copyright Taylor & Francis Group. Do Not Distribute.

165The Role of Vegetarian Diets in Weight Management
Glick-Bauer M, Yeh MC. 2014. The health advantage of a vegan diet: Exploring the gut microbiota connection. Nutrients 6 (11):4822–38. doi: 10.3390/nu6114822.
Global BMI Mortality Collaboration, Di Angelantonio E, Bhupathiraju Sh N, Wormser D, Gao P, Kaptoge S, Berrington de Gonzalez A et al. 2016. Body-mass index and all-cause mortality: Individual-participant-data meta-analysis of 239 prospective studies in four continents. Lancet 388 (10046):776–86. doi: 10.1016/S0140-6736(16)30175-1.
Greenwood DC, Cade JE, Draper A, Barrett JH, Calvert C, Greenhalgh A. 2000. Seven unique food consumption patterns identified among women in the UK Women’s Cohort Study. Eur J Clin Nutr 54 (4):314–20.
Haddad EH, Berk LS, Kettering JD, Hubbard RW, Peters WR. 1999. Dietary intake and bio-chemical, hematologic, and immune status of vegans compared with nonvegetarians. Am J Clin Nutr 70 (3 Suppl.):586S–93S.
Hebbelinck M, Clarys P, De Malsche A. 1999. Growth, development, and physical fitness of Flemish vegetarian children, adolescents, and young adults. Am J Clin Nutr 70 (3 Suppl.):579S–85S.
Hoffmann I, Groeneveld MJ, Boeing H, Koebnick C, Golf S, Katz N, Leitzmann C. 2001. Giessen Wholesome Nutrition Study: Relation between a health-conscious diet and blood lipids. Eur J Clin Nutr 55 (10):887–95. doi: 10.1038/sj.ejcn.1601243.
Ho-Pham LT, Vu BQ, Lai TQ, Nguyen ND, Nguyen TV. 2012. Vegetarianism, bone loss, fracture and vitamin D: A longitudinal study in Asian vegans and non-vegans. Eur J Clin Nutr 66 (1):75–82. doi: 10.1038/ejcn.2011.131.
Huang RY, Huang CC, Hu FB, Chavarro JE. 2016. Vegetarian diets and weight reduction: A meta-analysis of randomized controlled trials. J Gen Intern Med 31 (1):109–16. doi: 10.1007/s11606-015-3390-7.
Janelle KC, Barr SI. 1995. Nutrient intakes and eating behavior scores of vegetarian and non-vegetarian women. J Am Diet Assoc 95 (2):180–6, 189, quiz 187–8.
Jenkins DJ, Wong JM, Kendall CW, Esfahani A, Ng VW, Leong TC, Faulkner DA, Vidgen E, Greaves KA, Paul G, Singer W. 2009. The effect of a plant-based low-carbohydrate (“Eco-Atkins”) diet on body weight and blood lipid concentrations in hyperlipidemic subjects. Arch Intern Med 169 (11):1046–54. doi: 10.1001/archinternmed.2009.115.
Jenkins DJ, Wong JM, Kendall CW, Esfahani A, Ng VW, Leong TC, Faulkner DA et al. 2014. Effect of a 6-month vegan low-carbohydrate (‘Eco-Atkins’) diet on cardiovascular risk factors and body weight in hyperlipidaemic adults: A randomised controlled trial. BMJ Open 4 (2):e003505. doi: 10.1136/bmjopen-2013-003505.
Jensen MD, Ryan DH, Apovian CM, Ard JD, Comuzzie AG, Donato KA, Hu FB et al. 2014. 2013 AHA/ACC/TOS guideline for the management of overweight and obesity in adults: A report of the American College of Cardiology/American Heart Association Task Force on Practice Guidelines and The Obesity Society. Circulation 129 (25 Suppl. 2): S102–38. doi: 10.1161/01.cir.0000437739.71477.ee.
Jo HB, Lee JK, Choi MY, Han IW, Choi HS, Kang HW, Kim JH, Lim YJ, Koh MS, Lee JH. 2015. Is the prevalence of gallbladder polyp different between vegetarians and general population? Korean J Gastroenterol 66 (5):268–73. doi: 10.4166/kjg.2015.66.5.268.
Kahleova H, Matoulek M, Malinska H, Oliyarnik O, Kazdova L, Neskudla T, Skoch A, Hajek M, Hill M, Kahle M, Pelikanova T. 2011. Vegetarian diet improves insulin resistance and oxidative stress markers more than conventional diet in subjects with type 2 diabe-tes. Diabet Med 28 (5):549–59. doi: 10.1111/j.1464-5491.2010.03209.x.
Karelis AD, Fex A, Filion ME, Adlercreutz H, Aubertin-Leheudre M. 2010. Comparison of sex hormonal and metabolic profiles between omnivores and vegetarians in pre- and post-menopausal women. Br J Nutr 104 (2):222–6. doi: 10.1017/S0007114510000619.
Kennedy ET, Bowman SA, Spence JT, Freedman M, King J. 2001. Popular diets: Correlation to health, nutrition, and obesity. J Am Diet Assoc 101 (4):411–20. doi: 10.1016/S0002 -8223(01)00108-0.
Copyright Taylor & Francis Group. Do Not Distribute.

166 Vegetarian Nutrition and Wellness
Key TJ, Appleby PN, Rosell MS. 2006. Health effects of vegetarian and vegan diets. Proc Nutr Soc 65 (1):35–41.
Key TJ, Davey GK, Appleby PN. 1999. Health benefits of a vegetarian diet. Proc Nutr Soc 58 (2):271–5.
Khazrai YM, Defeudis G, Pozzilli P. 2014. Effect of diet on type 2 diabetes mellitus: A review. Diabetes Metab Res Rev 30 (Suppl. 1):24–33. doi: 10.1002/dmrr.2515.
Kjeldsen-Kragh J, Haugen M, Borchgrevink CF, Laerum E, Eek M, Mowinkel P, Hovi K, Forre O. 1991. Controlled trial of fasting and one-year vegetarian diet in rheumatoid arthritis. Lancet 338 (8772):899–902.
Knuiman JT, West CE. 1982. The concentration of cholesterol in serum and in various serum lipoproteins in macrobiotic, vegetarian and non-vegetarian men and boys. Atherosclerosis 43 (1):71–82.
Knutsen SF. 1994. Lifestyle and the use of health services. Am J Clin Nutr 59 (5 Suppl.):1171S–5S.
Krajcovicova-Kudlackova M, Simoncic R, Bederova A, Babinska K, Ondreicka R. 1995. Selected prooxidative-antioxidative parameters in blood of adult vegetarians. Oncol Rep 2 (1):77–80.
Le LT, Sabate J. 2014. Beyond meatless, the health effects of vegan diets: Findings from the Adventist cohorts. Nutrients 6 (6):2131–47. doi: 10.3390/nu6062131.
Lee RD, Nieman DC. 2013. Nutritional Assessment. 6th ed. New York: McGraw-Hill.Lee Y, Krawinkel M. 2009. Body composition and nutrient intake of Buddhist vegetarians.
Asia Pac J Clin Nutr 18 (2):265–71.Levin SM, Ferdowsian HR, Hoover VJ, Green AA, Barnard ND. 2010. A worksite pro-
gramme significantly alters nutrient intakes. Public Health Nutr 13 (10):1629–35. doi: 10.1017/S136898000999303X.
Ley RE. 2010. Obesity and the human microbiome. Curr Opin Gastroenterol 26 (1):5–11. doi: 10.1097/MOG.0b013e328333d751.
Li D, Sinclair A, Mann N, Turner A, Ball M, Kelly F, Abedin L, Wilson A. 1999. The asso-ciation of diet and thrombotic risk factors in healthy male vegetarians and meat-eaters. Eur J Clin Nutr 53 (8):612–9.
Lin CL, Fang TC, Gueng MK. 2001. Vascular dilatory functions of ovo-lactovegetarians compared with omnivores. Atherosclerosis 158 (1):247–51.
Lindahl O, Lindwall L, Spangberg A, Stenram A, Ockerman PA. 1984. A vegan regimen with reduced medication in the treatment of hypertension. Br J Nutr 52 (1):11–20.
Liszt K, Zwielehner J, Handschur M, Hippe B, Thaler R, Haslberger AG. 2009. Characterization of bacteria, clostridia and bacteroides in faeces of vegetarians using qPCR and PCR-DGGE fingerprinting. Ann Nutr Metab 54 (4):253–7. doi: 10.1159/000229505.
Lu SC, Wu WH, Lee CA, Chou HF, Lee HR, Huang PC. 2000. LDL of Taiwanese vegetar-ians are less oxidizable than those of omnivores. J Nutr 130 (6):1591–6.
Mahon AK, Flynn MG, Stewart LK, McFarlin BK, Iglay HB, Mattes RD, Lyle RM, Considine RV, Campbell WW. 2007. Protein intake during energy restriction: Effects on body composition and markers of metabolic and cardiovascular health in postmenopausal women. J Am Coll Nutr 26 (2):182–9.
Margetts BM, Beilin LJ, Vandongen R, Armstrong BK. 1986. Vegetarian diet in mild hyper-tension: A randomised controlled trial. Br Med J (Clin Res Ed) 293 (6560):1468–71.
McDougall J, Bruce B, Spiller G, Westerdahl J, McDougall M. 2002. Effects of a very low-fat, vegan diet in subjects with rheumatoid arthritis. J Altern Complement Med 8 (1): 71–5. doi: 10.1089/107555302753507195.
McDougall J, Thomas LE, McDougall C, Moloney G, Saul B, Finnell JS, Richardson K, Petersen KM. 2014. Effects of 7 days on an ad libitum low-fat vegan diet: The McDougall Program cohort. Nutr J 13:99. doi: 10.1186/1475-2891-13-99.
Copyright Taylor & Francis Group. Do Not Distribute.

167The Role of Vegetarian Diets in Weight Management
Melby CL, Goldflies DG, Toohey ML. 1993. Blood pressure differences in older black and white long-term vegetarians and nonvegetarians. J Am Coll Nutr 12 (3):262–9.
Melby CL, Hyner GC, Zoog B. 1985. Blood-pressure in vegetarians and nonvegetarians—A cross-sectional analysis. Nutr Res 5 (10):1077–82. doi: 10.1016/S0271-5317(85)80138-X.
Melby CL, Toohey ML, Cebrick J. 1994. Blood pressure and blood lipids among vegetarian, semivegetarian, and nonvegetarian African Americans. Am J Clin Nutr 59 (1):103–9.
Millet P, Guilland JC, Fuchs F, Klepping J. 1989. Nutrient intake and vitamin status of healthy French vegetarians and nonvegetarians. Am J Clin Nutr 50 (4):718–27.
Mishra S, Xu J, Agarwal U, Gonzales J, Levin S, Barnard ND. 2013. A multicenter ran-domized controlled trial of a plant-based nutrition program to reduce body weight and cardiovascular risk in the corporate setting: The GEICO study. Eur J Clin Nutr 67 (7):718–24. doi: 10.1038/ejcn.2013.92.
Moore WJ, McGrievy ME, Turner-McGrievy GM. 2015. Dietary adherence and acceptability of five different diets, including vegan and vegetarian diets, for weight loss: The New DIETs study. Eat Behav 19:33–8. doi: 10.1016/j.eatbeh.2015.06.011.
Nenonen MT, Helve TA, Rauma AL, Hanninen OO. 1998. Uncooked, lactobacilli-rich, vegan food and rheumatoid arthritis. Br J Rheumatol 37 (3):274–81.
Newby PK, Tucker KL, Wolk A. 2005. Risk of overweight and obesity among semivegetar-ian, lactovegetarian, and vegan women. Am J Clin Nutr 81 (6):1267–74.
Nicholson AS, Sklar M, Barnard ND, Gore S, Sullivan R, Browning S. 1999. Toward improved management of NIDDM: A randomized, controlled, pilot intervention using a lowfat, vegetarian diet. Prev Med 29 (2):87–91. doi: 10.1006/pmed.1999.0529.
Orlich MJ, Fraser GE. 2014. Vegetarian diets in the Adventist Health Study 2: A review of initial published findings. Am J Clin Nutr 100 (Suppl. 1):353S–8S. doi: 10.3945 /ajcn.113.071233.
Orlich MJ, Jaceldo-Siegl K, Sabate J, Fan J, Singh PN, Fraser GE. 2014. Patterns of food consumption among vegetarians and non-vegetarians. Br J Nutr 112 (10):1644–53. doi: 10.1017/S000711451400261X.
Orlich MJ, Singh PN, Sabate J, Jaceldo-Siegl K, Fan J, Knutsen S, Beeson WL, Fraser GE. 2013. Vegetarian dietary patterns and mortality in Adventist Health Study 2. JAMA Intern Med 173 (13):1230–8. doi: 10.1001/jamainternmed.2013.6473.
Ornish D, Brown SE, Scherwitz LW, Billings JH, Armstrong WT, Ports TA, Mclanahan SM, Kirkeeide RL, Brand RJ, Gould KL. 1990. Can life-style changes reverse coronary heart-disease. Lancet 336 (8708):129–133. doi: 10.1016/0140-6736(90)91656-U.
Ornish D, Scherwitz LW, Billings JH, Brown SE, Gould KL, Merritt TA, Sparler S et al. 1998. Intensive lifestyle changes for reversal of coronary heart disease. JAMA 280 (23):2001–7.
Ornish D, Scherwitz LW, Doody RS, Kesten D, McLanahan SM, Brown SE, DePuey E et al. 1983. Effects of stress management training and dietary changes in treating ischemic heart disease. JAMA 249 (1):54–9.
Prescott SL, Jenner DA, Beilin LJ, Margetts BM, Vandongen R. 1988. A randomized con-trolled trial of the effect on blood pressure of dietary non-meat protein versus meat protein in normotensive omnivores. Clin Sci (Lond) 74 (6):665–72.
Raynor HA, Champagne CM. 2016. Position of the Academy of Nutrition and Dietetics: Interventions for the treatment of overweight and obesity in adults. J Acad Nutr Diet 116 (1):129–47. doi: 10.1016/j.jand.2015.10.031.
Rizzo NS, Sabate J, Jaceldo-Siegl K, Fraser GE. 2011. Vegetarian dietary patterns are associ-ated with a lower risk of metabolic syndrome: The Adventist Health Study-2. Diabetes Care 34 (5):1225–7. doi: 10.2337/dc10-1221.
Rosell M, Appleby P, Key T. 2005. Height, age at menarche, body weight and body mass index in life-long vegetarians. Public Health Nutr 8 (7):870–5.
Copyright Taylor & Francis Group. Do Not Distribute.

168 Vegetarian Nutrition and Wellness
Rosell M, Appleby P, Spencer E, Key T. 2006. Weight gain over 5 years in 21,966 meat-eating, fish-eating, vegetarian, and vegan men and women in EPIC-Oxford. Int J Obes (Lond) 30 (9):1389–96. doi: 10.1038/sj.ijo.0803305.
Rouse IL, Armstrong BK, Beilin LJ. 1983. The relationship of blood pressure to diet and lifestyle in two religious populations. J Hypertens 1 (1):65–71.
Sacks FM, Castelli WP, Donner A, Kass EH. 1975. Plasma lipids and lipoproteins in vegetari-ans and controls. N Engl J Med 292 (22):1148–51. doi: 10.1056/NEJM197505292922203.
Sanders TA, Ellis FR, Dickerson JW. 1978. Haematological studies on vegans. Br J Nutr 40 (1):9–15.
Shultz TD, Leklem JE. 1983. Dietary status of Seventh-day Adventists and nonvegetarians. J Am Diet Assoc 83 (1):27–33.
Simons LA, Gibson JC, Paino C, Hosking M, Bullock J, Trim J. 1978. The influence of a wide range of absorbed cholesterol on plasma cholesterol levels in man. Am J Clin Nutr 31 (8):1334–9.
Singh PN, Arthur KN, Orlich MJ, James W, Purty A, Job JS, Rajaram S, Sabate J. 2014. Global epidemiology of obesity, vegetarian dietary patterns, and noncommunicable disease in Asian Indians. Am J Clin Nutr 100 (Suppl. 1):359S–64S. doi: 10.3945/ajcn.113.071571.
Skoldstam L. 1986. Fasting and vegan diet in rheumatoid arthritis. Scand J Rheumatol 15 (2):219–21.
Slattery ML, Jacobs Jr. DR, Hilner JE, Caan BJ, Van Horn L, Bragg C, Manolio TA, Kushi LH, Liu KA. 1991. Meat consumption and its associations with other diet and health factors in young adults: The CARDIA study. Am J Clin Nutr 54 (5):930–5.
Spencer EA, Appleby PN, Davey GK, Key TJ. 2003. Diet and body mass index in 38000 EPIC-Oxford meat-eaters, fish-eaters, vegetarians and vegans. Int J Obes Relat Metab Disord 27 (6):728–34. doi: 10.1038/sj.ijo.0802300.
Taber LA, Cook RA. 1980. Dietary and anthropometric assessment of adult omnivores, fish-eaters, and lacto-ovo-vegetarians. J Am Diet Assoc 76 (1):21–9.
Tap J, Mondot S, Levenez F, Pelletier E, Caron C, Furet JP, Ugarte E et al. 2009. Towards the human intestinal microbiota phylogenetic core. Environ Microbiol 11 (10):2574–84. doi: 10.1111/j.1462-2920.2009.01982.x.
Timko CA, Hormes JM, Chubski J. 2012. Will the real vegetarian please stand up? An inves-tigation of dietary restraint and eating disorder symptoms in vegetarians versus non-vegetarians. Appetite 58 (3):982–90. doi: 10.1016/j.appet.2012.02.005.
Tomasello G, Mazzola M, Leone A, Sinagra E, Zummo G, Farina F, Damiani P et al. 2016. Nutrition, oxidative stress and intestinal dysbiosis: Influence of diet on gut microbiota in inflammatory bowel diseases. Biomed Pap Med Fac Univ Palacky Olomouc Czech Repub 160 (4):461–6. doi: 10.5507/bp.2016.052.
Tonstad S, Butler T, Yan R, Fraser GE. 2009. Type of vegetarian diet, body weight, and preva-lence of type 2 diabetes. Diabetes Care 32 (5):791–6. doi: 10.2337/dc08-1886.
Tonstad S, Nathan E, Oda K, Fraser GE. 2015. Prevalence of hyperthyroidism according to type of vegetarian diet. Public Health Nutr 18 (8):1482–7. doi: 10.1017/S1368980014002183.
Tonstad S, Stewart K, Oda K, Batech M, Herring RP, Fraser GE. 2013. Vegetarian diets and incidence of diabetes in the Adventist Health Study-2. Nutr Metab Cardiovasc Dis 23 (4):292–9. doi: 10.1016/j.numecd.2011.07.004.
Toohey ML, Harris MA, DeWitt W, Foster G, Schmidt WD, Melby CL. 1998. Cardiovascular disease risk factors are lower in African-American vegans compared to lacto-ovo- vegetarians. J Am Coll Nutr 17 (5):425–34.
Toth MJ, Poehlman ET. 1994. Sympathetic nervous system activity and resting metabolic rate in vegetarians. Metabolism 43 (5):621–5.
Copyright Taylor & Francis Group. Do Not Distribute.

169The Role of Vegetarian Diets in Weight Management
Trepanowski JF, Kabir MM, Alleman Jr. RJ, Bloomer RJ. 2012. A 21-day Daniel fast with or without krill oil supplementation improves anthropometric parameters and the cardiometabolic profile in men and women. Nutr Metab (Lond) 9 (1):82. doi: 10.1186/1743-7075-9-82.
Turner-McGrievy GM, Barnard ND, Scialli AR. 2007. A two-year randomized weight loss trial comparing a vegan diet to a more moderate low-fat diet. Obesity (Silver Spring) 15 (9):2276–81. doi: 10.1038/oby.2007.270.
Turner-McGrievy GM, Barnard ND, Scialli AR, and Lanou AJ. 2004. Effects of a low-fat vegan diet and a Step II diet on macro- and micronutrient intakes in overweight post-menopausal women. Nutrition 20 (9):738–46. doi: 10.1016/j.nut.2004.05.005.
Turner-McGrievy GM, Davidson CR, Wingard EE, Billings DL. 2014. Low glycemic index vegan or low-calorie weight loss diets for women with polycystic ovary syn-drome: A randomized controlled feasibility study. Nutr Res 34 (6):552–8. doi: 10.1016/j .nutres.2014.04.011.
Turner-McGrievy GM, Davidson CR, Wingard EE, Wilcox S, Frongillo EA. 2015. Comparative effectiveness of plant-based diets for weight loss: A randomized controlled trial of five different diets. Nutrition 31 (2):350–8. doi: 10.1016/j.nut.2014.09.002.
Waldmann A, Koschizke JW, Leitzmann C, Hahn A. 2003. Dietary intakes and lifestyle fac-tors of a vegan population in Germany: Results from the German Vegan Study. Eur J Clin Nutr 57 (8):947–55. doi: 10.1038/sj.ejcn.1601629.
WHO (World Health Organization). 2016. Obesity and overweight. Fact sheet. http://www .who.int/mediacentre/factsheets/fs311/en/ (last modified June 2016; accessed March 15, 2017).
Wong JM. 2014. Gut microbiota and cardiometabolic outcomes: Influence of dietary pat-terns and their associated components. Am J Clin Nutr 100 (Suppl. 1):369S–77S. doi: 10.3945/ajcn.113.071639.
Copyright Taylor & Francis Group. Do Not Distribute.

http://taylorandfrancis.com
Copyright Taylor & Francis Group. Do Not Distribute.