copyright © ucrpcandlestickreversalpattern.com/dl-now/20999/ultimatecandlestick... · introduction...
TRANSCRIPT
www.CandlestickReversalPattern.com Copyright © UCRP

IntroductionI don’t want this book to have dozens of unnecessary pages of material that would do you no good in order to impress you. That’s why I’m going to show you the examples and explanations right away.
In the figure below you see an ordinary chart with the template you got in the package along with this book – that’s a simple template that will provide you clear a candle overview that is necessary in order to notice reverse patterns more easily.
I suppose this figure doesn’t say too much and that’s the way it should be for now! As you can see there’s a EUS/USD pair on an H1 time frame. Ultimate Candlestick Reversal Pattern (UCRP) gives the best results on this pair and H1 time frame. My advice is that you follow this and all rules that will come along in this book.
2
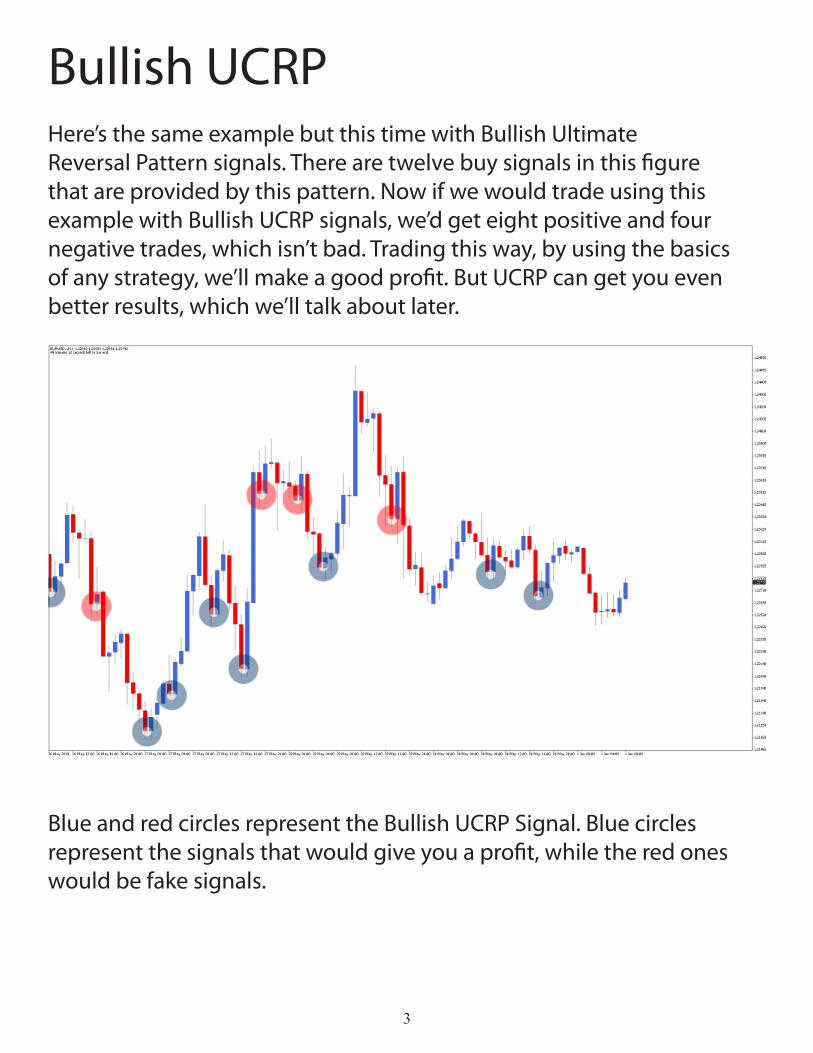
Bullish UCRPHere’s the same example but this time with Bullish Ultimate Reversal Pattern signals. There are twelve buy signals in this figure that are provided by this pattern. Now if we would trade using this example with Bullish UCRP signals, we’d get eight positive and four negative trades, which isn’t bad. Trading this way, by using the basics of any strategy, we’ll make a good profit. But UCRP can get you even better results, which we’ll talk about later. Blue and red circles represent the Bullish UCRP Signal. Blue circles represent the signals that would give you a profit, while the red ones would be fake signals.
3

Bearish UCRPNow we’ll follow the same example, only this time we’ll use the Bearish Ultimate Reversal Pattern signals. There are 13 sell signals in this figure provided by this pattern. If we traded with this example, by using our Bearish UCRP signals, we would have one negative and twelve positive trades. Blue and red circles represent the Reversal Bullish signal in which blue circles would be signals that would bring you a profit while the red ones would represent the fake signals.
4
The example we’ve been using represents the EUR/USD on the H1 time frame over one trading week. If you had traded this pattern over that week, you’d get the following results: twenty (20) positive trades and five (5) negative trades. Impressive, isn’t it? If in fact we were to count the pips this strategy made, you’d be even more impressed, but that’s not important at this time. It should be pointed out that it’s virtually impossible to trade all signals, because you would need to be trading around the clock 24/7. But in the end, that’s the problem with ALL strategies, signals, and systems. You may be thinking of ways to automate these patterns, so you won’t lose time and money while on the sidelines, but I strongly recommend against this. My team consists of a lot of programmers who have tried and failed every time, so stick to this simple manual “Ultimate Candle-stick Reverse Pattern Strategy”.
Before I explain how to eliminate some of the false signals and increase your winning percentage, allow me to explain our Ultimate Candlestick Reversal Pattern in detail.
5

What Is UCRP?If I was to write a definition for the Ultimate Candlestick Reversal Pattern it would be something like this: “The Ultimate Candlestick Reversal Pattern attempts to identify a key reversal in the forex markets. The actual pattern consistently comes at the beginning of a trend change and is always made up of two consecutive candlesticks. When the UCRP sets up, the odds are significantly in our favor that a reversal is underway.”
I’m going to get into more detail with the examples displayed in the following figures.
Here’s another example - I’ve magnified the candlestick sizes on this chart so you can see and realize Pattern Reversal better. The Bearish UCRP (1 Sell) is set up because a bullish trend preceded the candle clos-ing as a sell at which point these two candles evened. The sell candle is opened at the same price that closed the buy candle. The Bullish UCRP example (2 buy) shows the same rules in the opposite direction.
6
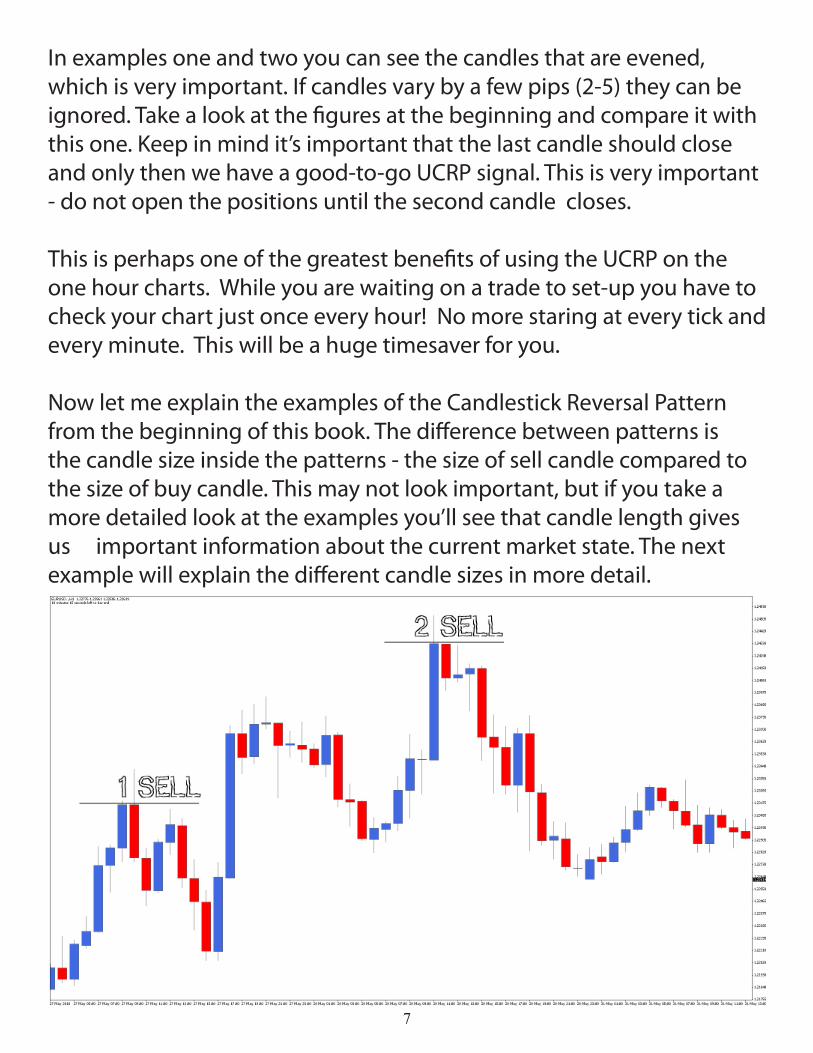
In examples one and two you can see the candles that are evened, which is very important. If candles vary by a few pips (2-5) they can be ignored. Take a look at the figures at the beginning and compare it with this one. Keep in mind it’s important that the last candle should close and only then we have a good-to-go UCRP signal. This is very important - do not open the positions until the second candle closes.
This is perhaps one of the greatest benefits of using the UCRP on the one hour charts. While you are waiting on a trade to set-up you have to check your chart just once every hour! No more staring at every tick and every minute. This will be a huge timesaver for you.
Now let me explain the examples of the Candlestick Reversal Pattern from the beginning of this book. The difference between patterns is the candle size inside the patterns - the size of sell candle compared to the size of buy candle. This may not look important, but if you take a more detailed look at the examples you’ll see that candle length gives us important information about the current market state. The next example will explain the different candle sizes in more detail.
7
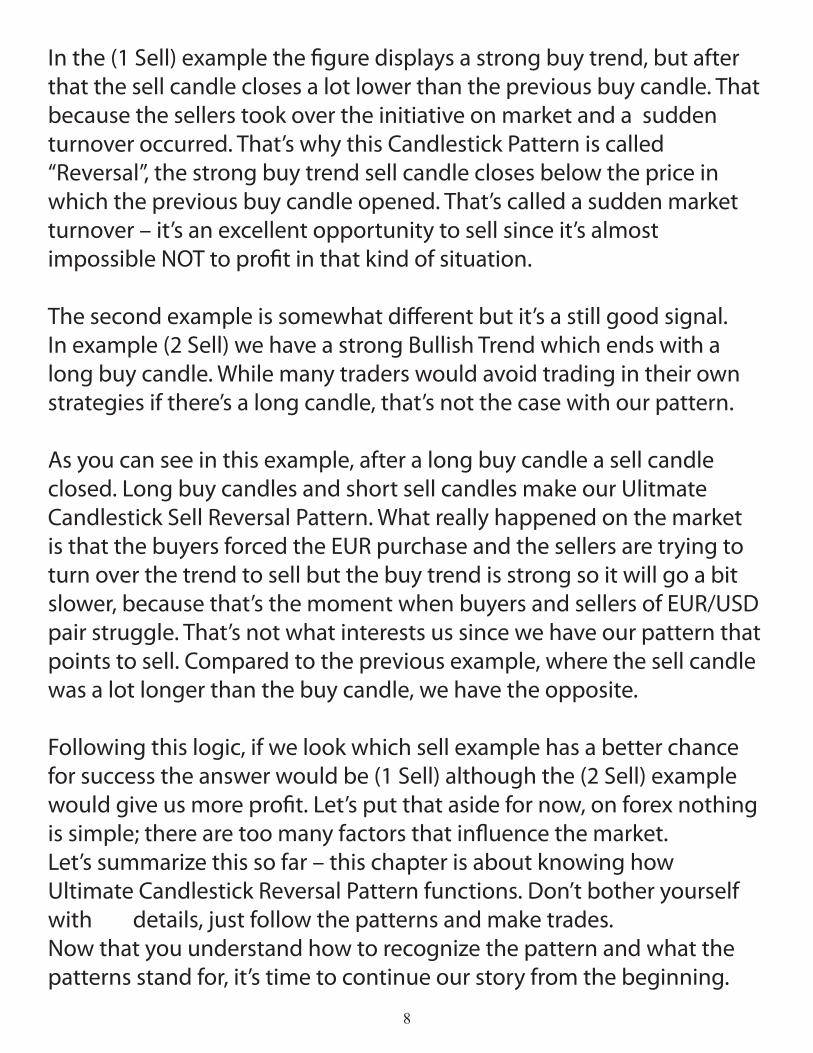
In the (1 Sell) example the figure displays a strong buy trend, but after that the sell candle closes a lot lower than the previous buy candle. That because the sellers took over the initiative on market and a sudden turnover occurred. That’s why this Candlestick Pattern is called “Reversal”, the strong buy trend sell candle closes below the price in which the previous buy candle opened. That’s called a sudden market turnover – it’s an excellent opportunity to sell since it’s almost impossible NOT to profit in that kind of situation.
The second example is somewhat different but it’s a still good signal. In example (2 Sell) we have a strong Bullish Trend which ends with a long buy candle. While many traders would avoid trading in their own strategies if there’s a long candle, that’s not the case with our pattern.
As you can see in this example, after a long buy candle a sell candle closed. Long buy candles and short sell candles make our Ulitmate Candlestick Sell Reversal Pattern. What really happened on the market is that the buyers forced the EUR purchase and the sellers are trying to turn over the trend to sell but the buy trend is strong so it will go a bit slower, because that’s the moment when buyers and sellers of EUR/USD pair struggle. That’s not what interests us since we have our pattern that points to sell. Compared to the previous example, where the sell candle was a lot longer than the buy candle, we have the opposite.
Following this logic, if we look which sell example has a better chance for success the answer would be (1 Sell) although the (2 Sell) example would give us more profit. Let’s put that aside for now, on forex nothing is simple; there are too many factors that influence the market.Let’s summarize this so far – this chapter is about knowing how Ultimate Candlestick Reversal Pattern functions. Don’t bother yourself with details, just follow the patterns and make trades.Now that you understand how to recognize the pattern and what the patterns stand for, it’s time to continue our story from the beginning.
8

The Best Time For Using UCRP? If you’ve ever analyzed different sessions, you probably know when sudden market turnover occurs. The beginning of the London session and end of the New York session should be ignored since those volumes are lower and it’s possible to get fake signals. Ultimately it’s up to you to determine your strategy, but I suggest you stick to London and New York.
If we go back to examples from the beginning of the book and analyze the fake signals that are generated by Candlestick Reversal Pattern we’ll notice that it’s possible to avoid those fake signals and decrease their number and increase our profitability.
The figure above displays the London and New York sessions - green for the London session, brown for the New York session, and blue representing the overlap of these two sessions.
9
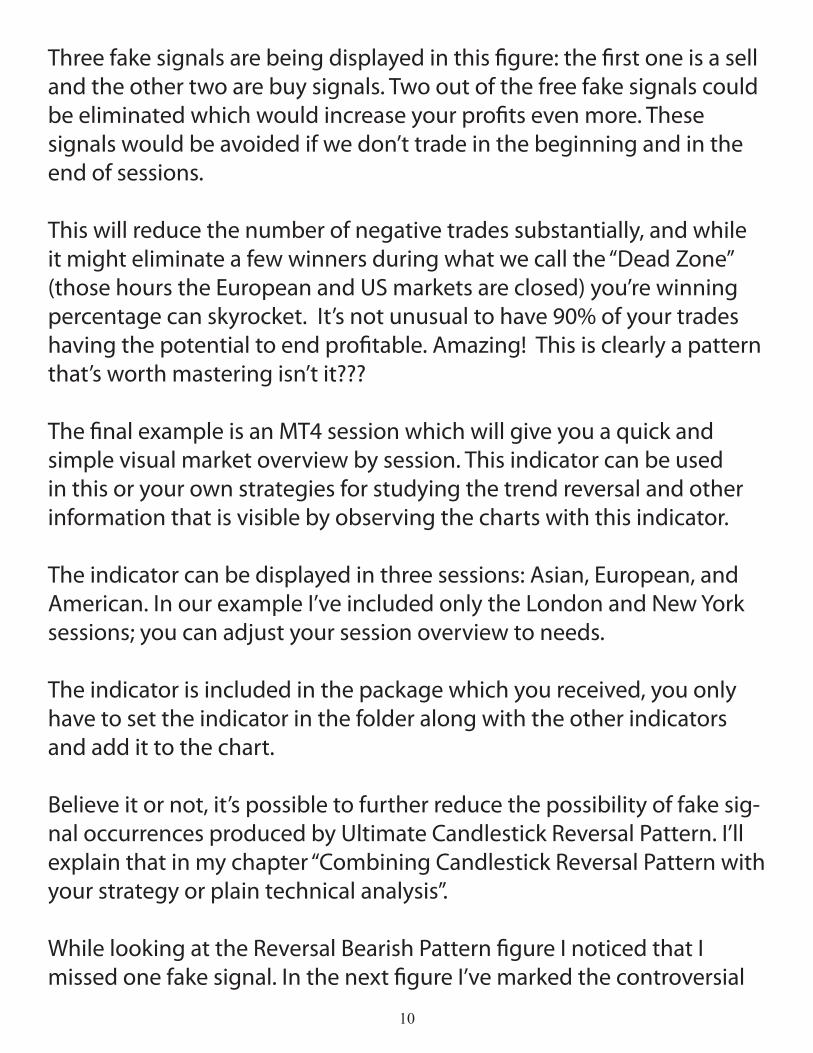
Three fake signals are being displayed in this figure: the first one is a sell and the other two are buy signals. Two out of the free fake signals could be eliminated which would increase your profits even more. These signals would be avoided if we don’t trade in the beginning and in the end of sessions.
This will reduce the number of negative trades substantially, and while it might eliminate a few winners during what we call the “Dead Zone” (those hours the European and US markets are closed) you’re winning percentage can skyrocket. It’s not unusual to have 90% of your trades having the potential to end profitable. Amazing! This is clearly a pattern that’s worth mastering isn’t it???
The final example is an MT4 session which will give you a quick and simple visual market overview by session. This indicator can be used in this or your own strategies for studying the trend reversal and other information that is visible by observing the charts with this indicator.
The indicator can be displayed in three sessions: Asian, European, and American. In our example I’ve included only the London and New York sessions; you can adjust your session overview to needs.
The indicator is included in the package which you received, you only have to set the indicator in the folder along with the other indicators and add it to the chart.
Believe it or not, it’s possible to further reduce the possibility of fake sig-nal occurrences produced by Ultimate Candlestick Reversal Pattern. I’ll explain that in my chapter “Combining Candlestick Reversal Pattern with your strategy or plain technical analysis”. While looking at the Reversal Bearish Pattern figure I noticed that I missed one fake signal. In the next figure I’ve marked the controversial
10

By the time I wrote this we have new three signals – all resulted in positive trades – let’s take a look at the figure.
If we stick to the session rules we would be trading only in examples two and three while the signal under number one is given before London opening. As you can see the signals are still highly profitable and precise.
11
Stop Loss And Take ProfitIn this chapter I’ll be explaining how should you setup stop loss and take profit limits. You’ve already concluded that positions are being opened by the closure of the second candle in the pattern, thus giving us a confirmation whether the signal is correct. Let me give you a few suggestions based on facts and my long experience with intraday trading on H1 time frame. First, the stop loss should span between 40-60 pips, maybe even less if you know what you’re doing. I’ve used a lot of different strategies and systems through time and proved that stop loss of 40-60 pips is best for intraday short trades. If you’re using Candlestick Reversal Pattern and this type of stop, you’ll have about 90% of success in your trades.
Regarding the take profit, my advice is that you set up two take profits: first should be at +20 pips and second at +50 pips. When you take your first profit in the 20 pip range on the first portion of your trade (per-haps about 70% of your initial position size), you should move your stop loss to a point where it eliminates all or most of the risk. Break-even is a good suggestion here, or give up just a few pips if you find a more strategic place on the chart near a swing high/low -- assuming it cuts the majority of your risk. With such a high winning percentage using the UCRP you should reach the 20 pips in the majority of your trades, and then you can ride the balance of your position for the bigger 50+ pip moves - with virtually no risk.
If you’re an experienced trader and have a profitable strategy and money management, you can use any technique with stop loss and take profit limits to your liking. In the examples above I’ve explained a simple and profitable way of setting up stop loss and take profit limits.
12
Combining Your Strategy with UCRPIn the examples above I’ve explained the method to open positions based on a signal generated by the Ultimate Candlestick Reversal Pattern, as well as how to set up the right stop and take profits. If you’ve read all the way through, you know that by using the signals of our pattern and sticking to the rules it will give you a complete strategy that can be used successfully in every day trading.
The main purpose of all patterns (ours included) is to help with decisions during the position opening. When you’re convinced by the efficiency of this pattern then it’s time to combine it with your strategy, get self-confidence and increase the possibility for profitable trades.
Imagine you own a strategy that generates 60:40% signals, 60% positive and 40% negative. If you include the Candlestick Reversal Pattern in your strategy, you’ll increase the ratio to 90:10% - 90% of positive signals.
To better understand what I’m talking about you’ll see in the next examples how to combine the Candlestick Reversal Pattern with Trendlines, Fibs, Pivots, etc.
My advice is quite simple: combine the Candlestick Reversal Pattern with the strategy or technical analysis that gives you the best results and you’ll reduce the number of negative trades which will result in incredible profit.
13
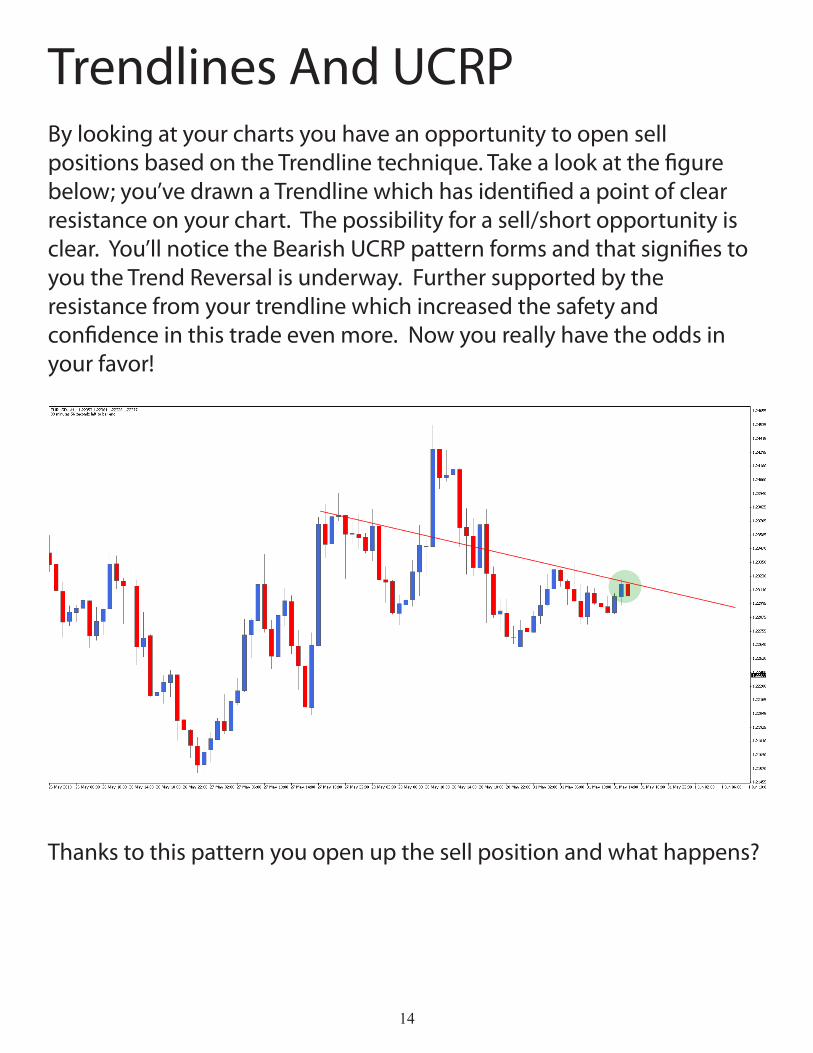
Trendlines And UCRPBy looking at your charts you have an opportunity to open sell positions based on the Trendline technique. Take a look at the figure below; you’ve drawn a Trendline which has identified a point of clear resistance on your chart. The possibility for a sell/short opportunity is clear. You’ll notice the Bearish UCRP pattern forms and that signifies to you the Trend Reversal is underway. Further supported by the resistance from your trendline which increased the safety and confidence in this trade even more. Now you really have the odds in your favor!
Thanks to this pattern you open up the sell position and what happens?
14
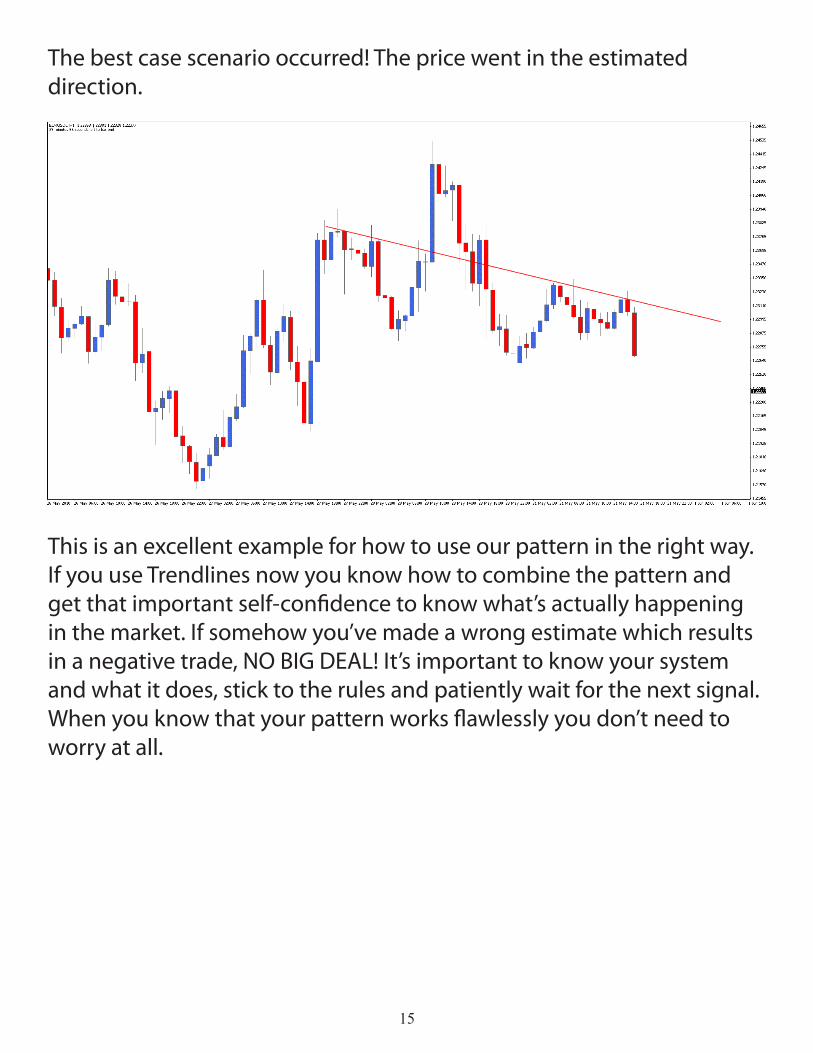
The best case scenario occurred! The price went in the estimated direction.
This is an excellent example for how to use our pattern in the right way. If you use Trendlines now you know how to combine the pattern and get that important self-confidence to know what’s actually happening in the market. If somehow you’ve made a wrong estimate which results in a negative trade, NO BIG DEAL! It’s important to know your system and what it does, stick to the rules and patiently wait for the next signal. When you know that your pattern works flawlessly you don’t need to worry at all.
15

Fibonacci And UCRPIf you know Fibonacci levels well and regularly use Fibo indicators, it’s time to increase the profitability of your “Fibo strategy”. Let’s have a look at this example:
You’ve made your analysis and you’re waiting for the price to come into an area that will allow you profitable trades using the Fibonacci strategy. Example 1: the price reached 50% of the Fibo level – this level represents the turnover; if the price bounces off this level that is usu-ally a strong support and resistance (resistance in this case). What actu-ally happens is that the Fibo level is an excellent resistance, then the Candlestick Reversal Patterns occurs pointing to the change of trend to sell. When you have these two data points you open your sell and a make profit. All connoisseurs of Fibo levels know that the best chance to open up the position is at Example 1. If you know and use Fibo levels you would make a trade with Example 1, with the confirmation from our pattern leading you to sure profit. In this example I’ve only included sell signals of our patterns. The other signals wouldn’t be traded by profes-sional Fibo users.
16
TA And Candlestick Reversal PatternI hope you now understand the best way to combine patterns with indicators and other strategies. Any indicator that you use every day can be combined with this pattern.
If you’re a fan of Pivot Points like me, then this pattern will make it easier for you and increase the profitability of your strategy. The way to combine this pattern with Pivot Point is the same as with Fibs and Trendlines; if the price closes below the daily pivot, Candlestick Reversal Pattern is formed and you’re sure the price will go to sell, etc.
17
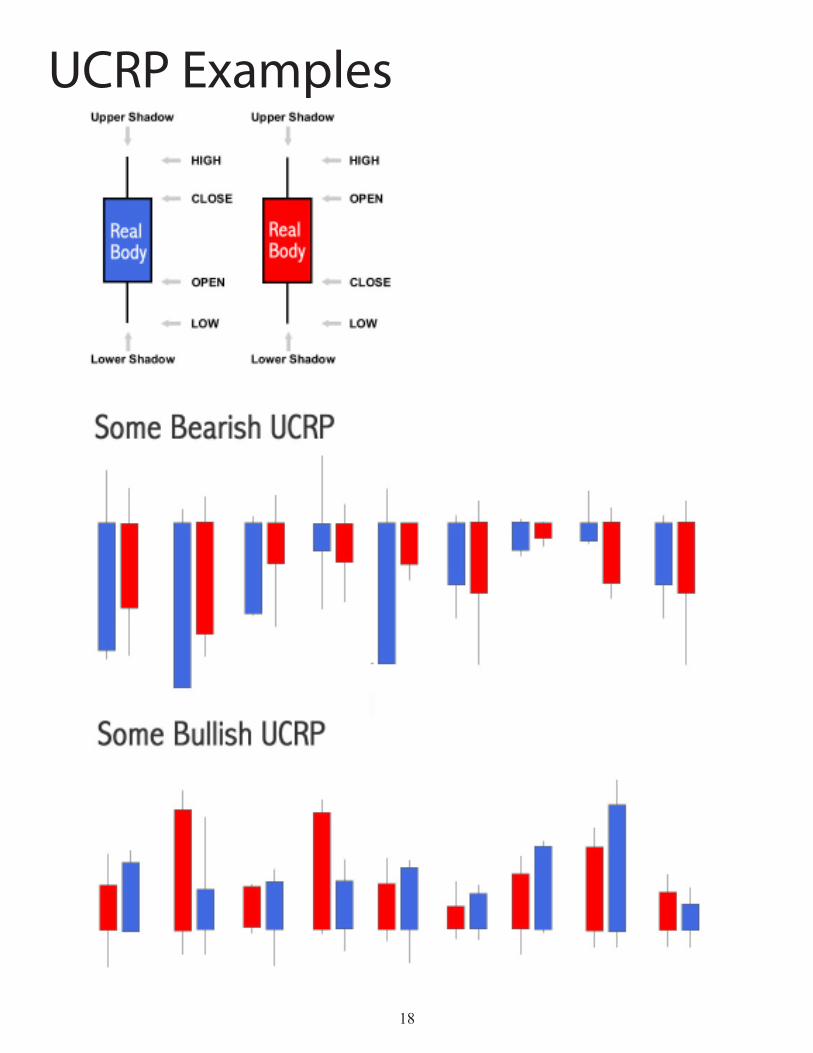
UCRP Examples
18

www.CandlestickReversalPattern.com Copyright © UCRP
Roger PetersonPro Trader & CEO
19