core basics competency exam readme -...
TRANSCRIPT

CORE BASICS COMPETENCY EXAM
README RICOH GROUP COMPANIES

It is the reader’s responsibility when discussing the information contained within this document to maintain a level of confidentiality that is in the best interest of
Ricoh Corporation and its member companies.
No part of this material may be reproduced in any fashion and distributed without the prior permission of Ricoh Corporation.
2006 RICOH Corporation. All rights reserved.
West Caldwell, NJ (V1)

TABLE OF CONTENTS TOPIC Page INTRODUCTION ........................................................................................ 1
RECOMMENDED PREREQUISITES: ........................................................ 1
SPECIAL REVIEW MATERIALS ................................................................ 2


INTRODUCTION
Welcome to the “Core Basics Competency Exam.” This exam has been designed to provide you with the opportunity to satisfy a training prerequisite without the need to complete a formal training program. By successfully completing this exam, you will be will permitted to bypass the Instructor led “Core Basics Training Program” and permitted to proceed directly to certain product training. Successfully completing this exam demonstrates that you have the required basic understanding of the imaging processes that will allow you to better “focus” on the proper product maintenance and servicing procedures presented during actual product training. It is important for you to remember that this exam is not product specific, but may include terminology common in any of the Ricoh University’s Instructor-led training programs. This means that although certain manufacturers in the industry use similar processes, they may vary somewhat in their terminology. Being able to “see around” some of these minor terminology differences is a part of this competency examination. In this examination, some questions have been designed which will rate your ability to derive the correct answer from a process you should know, but by using terminology perhaps slightly different from what you may be used to. In situations such as this, you should “attack” the question as you would troubleshoot a technical problem, by first eliminating those answers that are “obviously” incorrect and then by focusing on those provided answers that are most likely to be correct. Overall however, it is your understanding of the basic concepts and processes used in all products that this exam attempts to gauge.
RECOMMENDED PREREQUISITES: The following are strongly recommended prior to attempting the Core Basics Competency Exam:
• Six months experience working on any manufacturer’s analog product(s). • *Review the “Office Automation Series Manuals” (Volume I – Basic Electronics
and Volume II – Understanding the Copy Process).
SPECIAL REVIEW MATERIALS The Point-to-Point Diagram Introduction
If you’ve ever been lost in the middle of absolutely nowhere you can appreciate the value of a map. In some rural areas you can go for miles with no sign of human life besides isolated mailboxes, telephone poles and the occasional trail of a high-flying jet. Now imagine being lost while trying to service a copier, or any other complex electronic device. In each case, the right kind of map can save you valuable time, as well as help preserve your sanity. People in many different occupations depend on their own particular kind of map. Architects and construction workers use blueprints to map out the design of a building. Project planners use special charts that map the flow of work through time. People who work with electronics have their own varieties of maps. They let engineers and technicians see all the detail in even the most complex component designs, and provide an easy way to trace individual circuits like roads through a confusing landscape. Like road maps, electronic maps offer a tremendous amount of information on a single sheet of paper. Everything is labeled. Cities, towns, interstate highways and local roads all have their counterpart on an electronic map. To read this kind of map quickly and clearly requires some knowledge of electronics, but the basics are fairly simple.
Levels of Detail
There are two main types of electronic maps: schematic drawings and block diagrams. They take very different approaches to presenting the layout of an electronic component, and this difference is mostly a matter of how much detail they contain.
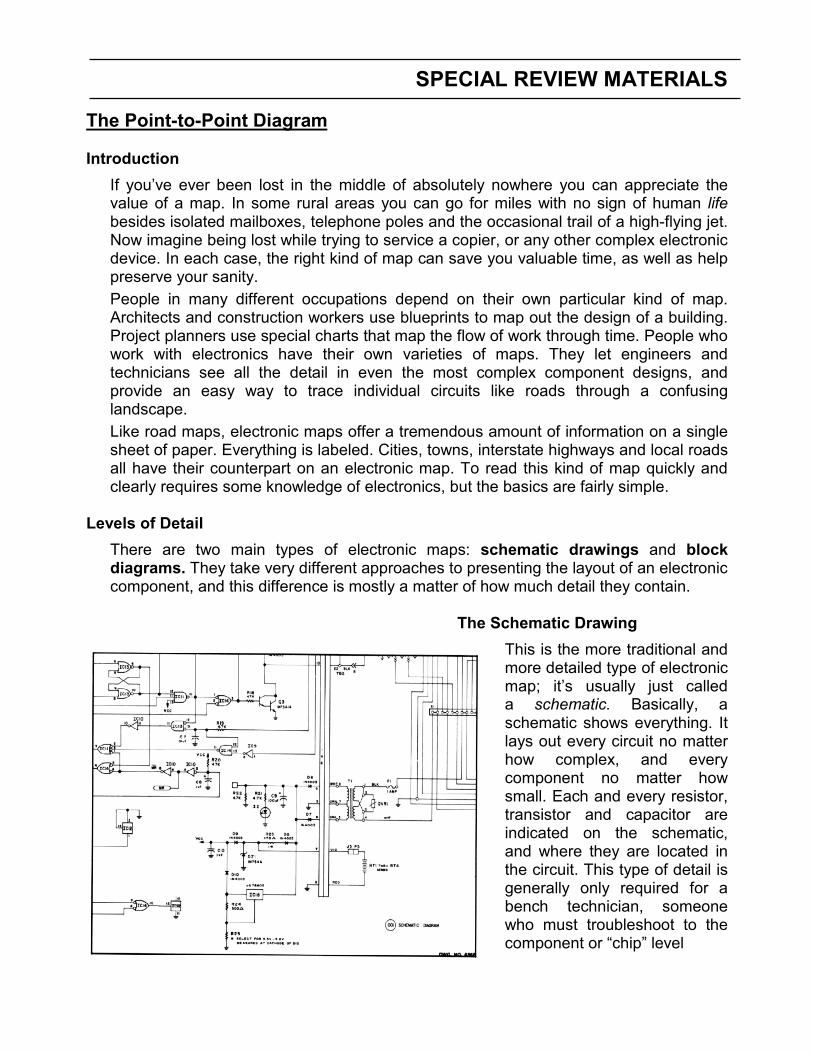
The Schematic Drawing
This is the more traditional and more detailed type of electronic map; it’s usually just called a schematic. Basically, a schematic shows everything. It lays out every circuit no matter how complex, and every component no matter how small. Each and every resistor, transistor and capacitor are indicated on the schematic, and where they are located in the circuit. This type of detail is generally only required for a bench technician, someone who must troubleshoot to the component or “chip” level

While schematic drawings are still the best approach for certain applications, it is much more information than a copier technician, that troubleshoots to the “board” level and not to the “chip” level, really needs.
The Block Diagram A block diagram shows an electronic system divided into a number of main areas, blocks, and then shows all the inter-connections among those areas. Showing only the connections between major assemblies, a block diagram contains relatively little detail. This actually makes them preferable for troubleshooting complex systems consisting of many major components or sub-systems. But detail that exists inside the blocks is not shown. This greatly simplifies the diagram for a complex piece of equipment, and is often all a technician needs to navigate through the different circuits. The simplest kind of block diagram can be found in the owner’s manual for a stereo component, like a receiver or compact disc player. It shows how to connect the component into an existing sound system by using pictures of several items connected in different ways. In this case the individual components are the blocks, and the audio cables hooking them together are the circuits. For a copier, the blocks on a block diagram represent individual circuit boards. In the actual machine these boards are thin wafers of non-conductive material used to support individual circuit components: resistors, transistors, chips and so on. The boards are connected to each other and to other electrical devices with bundles of thin wires, each bundle known as a wiring harness.
Troubleshooting Today schematics and block diagrams are both in wide use, for simple and complex applications. There are situations when a fully detailed schematic is still necessary, even on a device with a bewildering number of components. For example, a technician troubleshooting a video cassette recorder with only a block diagram would simply not have enough information to find the problem. This job would involve two steps. The technician would first examine the VCR’s block diagram to localize the problem on one circuit board, then work with a schematic of that particular board to isolate the faulty component.

Economics is another factor in the evolution of electrical drawings. As electronics have become more sophisticated, circuit boards have become less expensive, and that has led to a change in service procedures. This trend has continued to the point where it’s economically feasible to replace entire circuit boards in some items, rather than have a technician spend time in the field troubleshooting down to a single component. Instead, the technician sends the faulty board to the manufacturer or some other service facility. The board is quickly repaired with the aid of specialized test equipment. It’s then either returned to the customer or re-stocked as a replacement part. This type of “board swap” service policy has given rise to a kind of hybrid electrical drawing. It combines the characteristics of schematics and block diagrams, and is specifically tailored for the service of complex devices with replaceable circuit boards.
A point-to-point diagram is a hybrid. It shows more detail than a block diagram, but less than a schematic. This is the preferred map for navigating through a copier’s electrical components.
The Point-to-Point Diagram This type of drawing is a compromise between the massive amount of detail on a conventional schematic, and the relative lack of detail on a block diagram. It has the overall appearance of a block diagram but presents more detail in certain areas. The name point-to-point comes from the drawing’s concentration on connections to and from different components.
A typical point-to-point diagram shows most circuit boards as relatively featureless blocks, and may show some detail inside the blocks. For example, if a circuit board contains a large information-processing chip, the point-to-point will not show all the connections to that chip, but will show connections to the board itself. Other components get similar consideration. Like a schematic, a point-to-point will give graphic representations of relays, solenoids, fuses and other high voltage devices. In short, it shows anything in the electrical system that might help a technician service the equipment, with the exception of full detail on every circuit board.
Line-by-Line In a very literal sense, a point-to-point diagram consists of lots of lines. If this type of information is new to you, understanding the diagram is a little easier when you approach it that way, as a collection of different types of lines. Each type represents something different. When you first look at a point-to-point the most obvious elements are the blocks representing circuit boards. They’re outlined with the thickest lines on the diagram, and are clear, rectangular shapes with definite boundaries. There may also be divisions within a block, to indicate logical groupings of components on the corresponding circuit board. For example, a copier’s main board might be divided into sections dedicated to specific areas of the control system. These would be indicated on the point-to-point by dividing lines within the block, though components inside those areas would probably not be shown. Connecting the blocks together are many different types of lines, some thick, some thin, some dotted or dashed. Each type signifies a particular kind of electrical signal. Though the signal codes on a point-to-point vary from one manufacturer to the next, most follow certain standards. If in doubt, look for a signal key or symbol table somewhere on the diagram. It will explain which signal each type of line represents. Here are the most common varieties:
• AC voltage, such as 110 volts AC for a copier’s power supply, is often indicated with a heavy or otherwise distinctive line. This is generally the thickest voltage line on the drawing.
• DC signals such as 5,12 or 24 volts for machine control purposes are indicated with thinner lines.
• Pulsed signals are sometimes indicated with a broken or dotted line. • Some point-to-point diagrams are printed in two or three colors. In most such
cases, red lines are positive signals, blue or green are negative, and black indicates circuit boards and other details. This color-coding will vary, so always check the signal key on the diagram. Today however, the vast majority of diagrams similar to the point-to-point and the actual point-to-point used to troubleshoot the products you will train on, are all in black & white only.
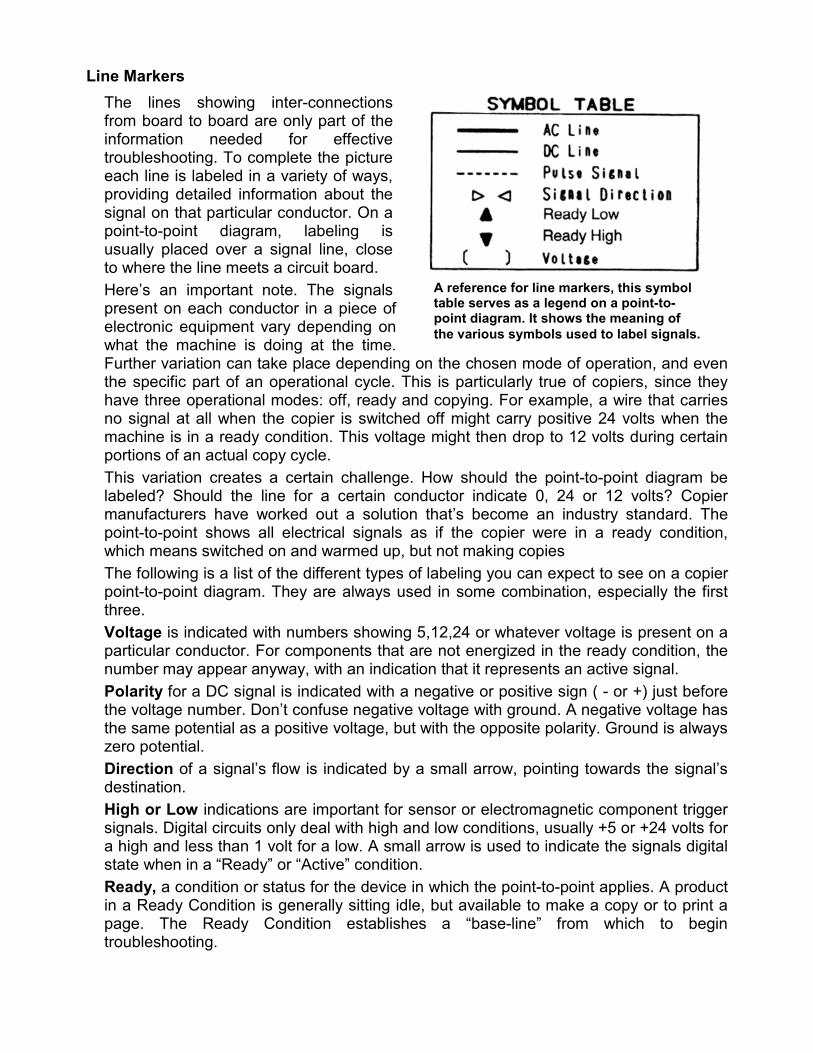
Line Markers The lines showing inter-connections from board to board are only part of the information needed for effective troubleshooting. To complete the picture each line is labeled in a variety of ways, providing detailed information about the signal on that particular conductor. On a point-to-point diagram, labeling is usually placed over a signal line, close to where the line meets a circuit board. Here’s an important note. The signals present on each conductor in a piece of electronic equipment vary depending on what the machine is doing at the time. Further variation can take place depending on the chosen mode of operation, and even the specific part of an operational cycle. This is particularly true of copiers, since they have three operational modes: off, ready and copying. For example, a wire that carries no signal at all when the copier is switched off might carry positive 24 volts when the machine is in a ready condition. This voltage might then drop to 12 volts during certain portions of an actual copy cycle. This variation creates a certain challenge. How should the point-to-point diagram be labeled? Should the line for a certain conductor indicate 0, 24 or 12 volts? Copier manufacturers have worked out a solution that’s become an industry standard. The point-to-point shows all electrical signals as if the copier were in a ready condition, which means switched on and warmed up, but not making copies The following is a list of the different types of labeling you can expect to see on a copier point-to-point diagram. They are always used in some combination, especially the first three. Voltage is indicated with numbers showing 5,12,24 or whatever voltage is present on a particular conductor. For components that are not energized in the ready condition, the number may appear anyway, with an indication that it represents an active signal. Polarity for a DC signal is indicated with a negative or positive sign ( - or +) just before the voltage number. Don’t confuse negative voltage with ground. A negative voltage has the same potential as a positive voltage, but with the opposite polarity. Ground is always zero potential. Direction of a signal’s flow is indicated by a small arrow, pointing towards the signal’s destination. High or Low indications are important for sensor or electromagnetic component trigger signals. Digital circuits only deal with high and low conditions, usually +5 or +24 volts for a high and less than 1 volt for a low. A small arrow is used to indicate the signals digital state when in a “Ready” or “Active” condition. Ready, a condition or status for the device in which the point-to-point applies. A product in a Ready Condition is generally sitting idle, but available to make a copy or to print a page. The Ready Condition establishes a “base-line” from which to begin troubleshooting.
A reference for line markers, this symbol table serves as a legend on a point-to-point diagram. It shows the meaning of the various symbols used to label signals.
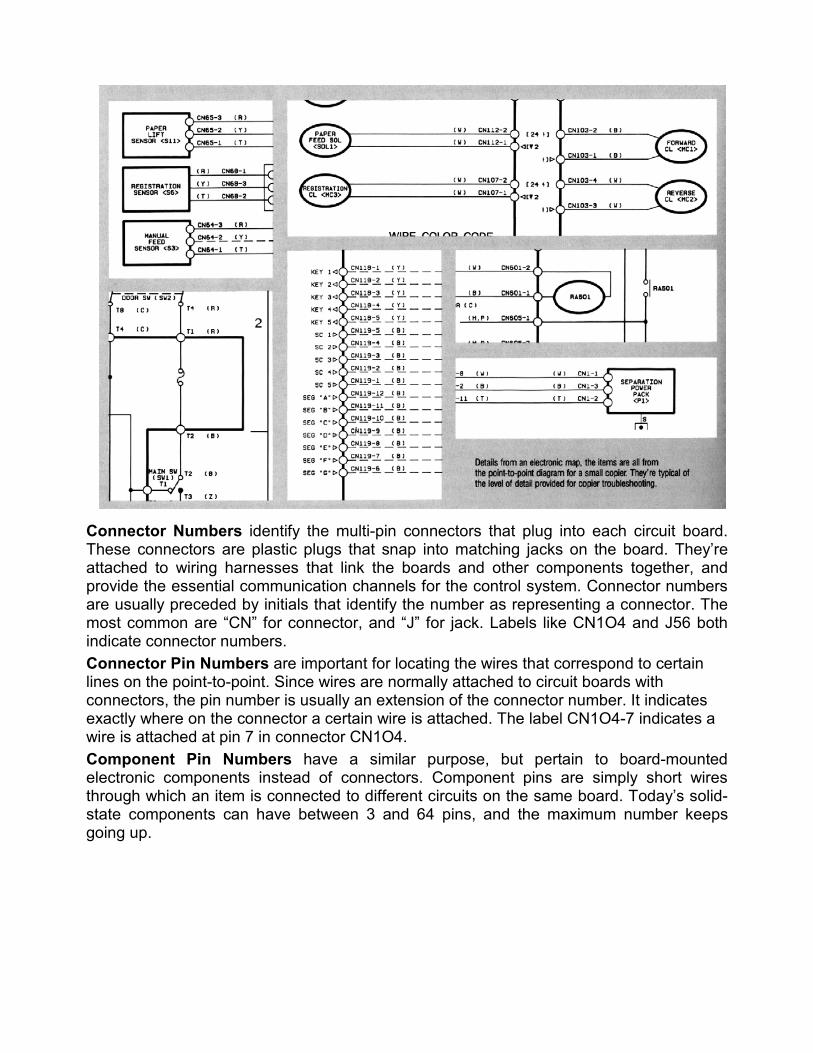
Connector Numbers identify the multi-pin connectors that plug into each circuit board. These connectors are plastic plugs that snap into matching jacks on the board. They’re attached to wiring harnesses that link the boards and other components together, and provide the essential communication channels for the control system. Connector numbers are usually preceded by initials that identify the number as representing a connector. The most common are “CN” for connector, and “J” for jack. Labels like CN1O4 and J56 both indicate connector numbers. Connector Pin Numbers are important for locating the wires that correspond to certain lines on the point-to-point. Since wires are normally attached to circuit boards with connectors, the pin number is usually an extension of the connector number. It indicates exactly where on the connector a certain wire is attached. The label CN1O4-7 indicates a wire is attached at pin 7 in connector CN1O4. Component Pin Numbers have a similar purpose, but pertain to board-mounted electronic components instead of connectors. Component pins are simply short wires through which an item is connected to different circuits on the same board. Today’s solid- state components can have between 3 and 64 pins, and the maximum number keeps going up.
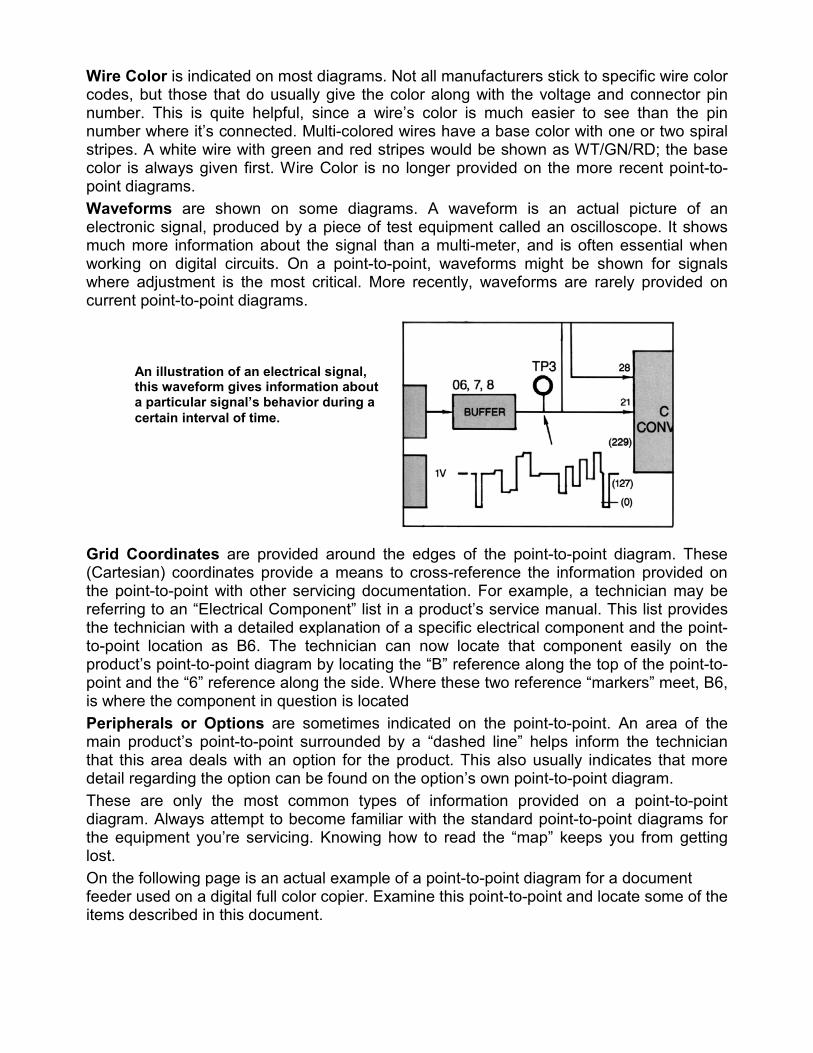
Wire Color is indicated on most diagrams. Not all manufacturers stick to specific wire color codes, but those that do usually give the color along with the voltage and connector pin number. This is quite helpful, since a wire’s color is much easier to see than the pin number where it’s connected. Multi-colored wires have a base color with one or two spiral stripes. A white wire with green and red stripes would be shown as WT/GN/RD; the base color is always given first. Wire Color is no longer provided on the more recent point-to-point diagrams. Waveforms are shown on some diagrams. A waveform is an actual picture of an electronic signal, produced by a piece of test equipment called an oscilloscope. It shows much more information about the signal than a multi-meter, and is often essential when working on digital circuits. On a point-to-point, waveforms might be shown for signals where adjustment is the most critical. More recently, waveforms are rarely provided on current point-to-point diagrams.
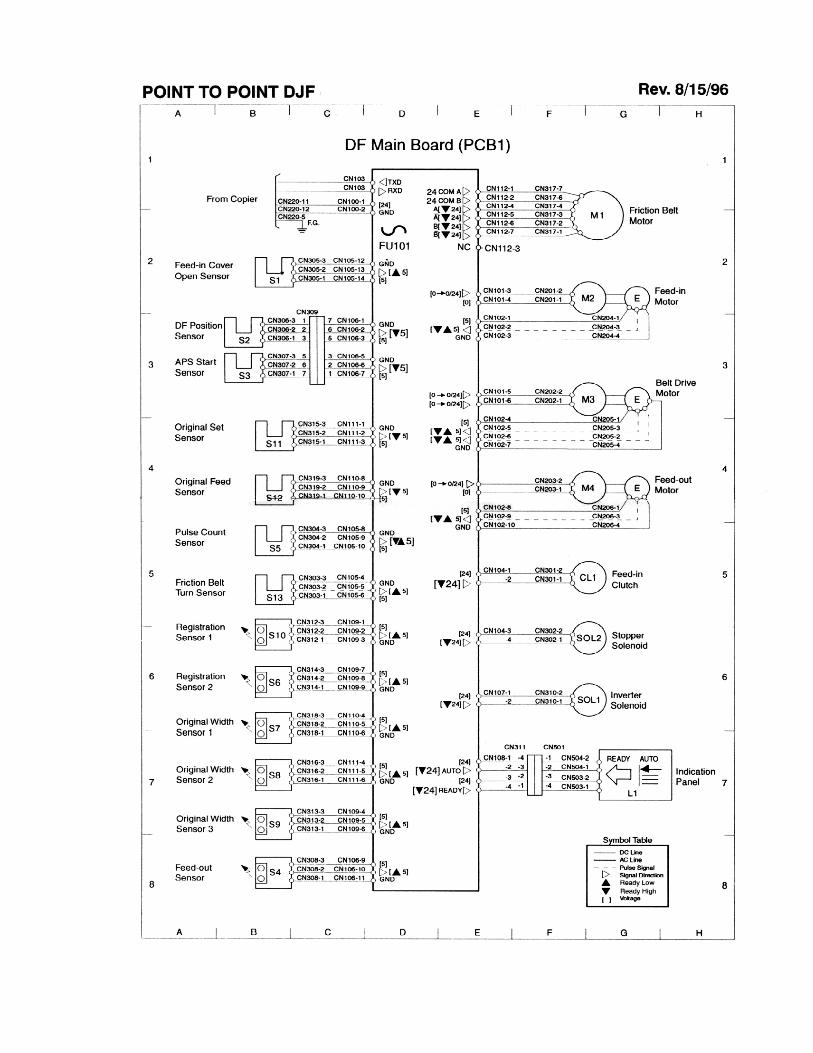
Grid Coordinates are provided around the edges of the point-to-point diagram. These (Cartesian) coordinates provide a means to cross-reference the information provided on the point-to-point with other servicing documentation. For example, a technician may be referring to an “Electrical Component” list in a product’s service manual. This list provides the technician with a detailed explanation of a specific electrical component and the point-to-point location as B6. The technician can now locate that component easily on the product’s point-to-point diagram by locating the “B” reference along the top of the point-to-point and the “6” reference along the side. Where these two reference “markers” meet, B6, is where the component in question is located Peripherals or Options are sometimes indicated on the point-to-point. An area of the main product’s point-to-point surrounded by a “dashed line” helps inform the technician that this area deals with an option for the product. This also usually indicates that more detail regarding the option can be found on the option’s own point-to-point diagram. These are only the most common types of information provided on a point-to-point diagram. Always attempt to become familiar with the standard point-to-point diagrams for the equipment you’re servicing. Knowing how to read the “map” keeps you from getting lost. On the following page is an actual example of a point-to-point diagram for a document feeder used on a digital full color copier. Examine this point-to-point and locate some of the items described in this document.
An illustration of an electrical signal, this waveform gives information about a particular signal’s behavior during a certain interval of time.