coronal suture morphology and synostotic …
TRANSCRIPT

CORONAL SUTURE MORPHOLOGY AND SYNOSTOTIC PROGRESSION IN RABBITS WITH DELAYED-ONSET CRANIOSYNOSTOSIS.
by
Harman Singh Deol
B.A. Anthropology, University of Pittsburgh, 2013
Submitted to the Graduate Faculty of
the School of Dental Medicine in partial fulfillment
of the requirements for the degree of
Master of Science
University of Pittsburgh
2017

ii
UNIVERSITY OF PITTSBURGH
SCHOOL OF DENTAL MEDICINE
This thesis was presented
by
Harman Singh Deol
It was defended on
January 3, 2017
and approved by
Michael I Siegel, PhD., Professor, Department of Anthropology
Seth Weinberg, PhD., Associate Professor, Department of Oral Biology
Gregory M. Cooper, PhD., Assistant Professor, Department of Plastic Surgery, Oral Biology,
and Bioengineering
Thesis Director: Mark P. Mooney, PhD., Professor, Department of Oral Biology,
Anthropology, Plastic Surgery, Orthodontics, and Communication Science and Disorders

iii
Copyright © by Harman Singh Deol
2017

iv
Delayed-onset craniosynostosis has been reported in the human clinical literature and may
represent part of the expanded phenotype of craniosynostosis. Delayed-onset synostosis (DOS) is
also an integral part of the phenotypic spectrum in an inbred rabbit strain of craniosynostosis.
The purpose of the present study was to qualitatively and quantitatively describe the
perisynostotic events in the coronal sutures of rabbits with delay-onset coronal suture synostosis
compared to age matched, wild-type control rabbits.
Coronal sutures from 80 rabbits (39 normal wild-type controls and 41 DOS) were
collected for gross morphological and histological examination. Ages ranged from term (day 0)
through 88 days of age. The sutures were harvested, formalin fixed, paraffin embedded, and
stained with alizarin red for gross light microscopic analysis.
Qualitative results showed that by 25 days of age a dramatic thickening of the sutural
ligament, an increase in the amount of bone in the osteogenic fronts, and an increase in the
frequency of bony bridges between the frontal and parietal bones in rabbits with DOS compared
to age matched, wild-type controls. No statistical significant differences in mean suture width or
total suture area between the groups at the interdigitating zone were recorded at any age and
CORONAL SUTURE MORPHOLOGY AND SYNOSTOTIC PROGRESSION IN
RABBITS WITH DELAYED-ONSET CRANIOSYNOSTOSIS
Harman Singh Deol, M.S.
University of Pittsburgh, 2017

v
cortical level (p> 0.05). At a region of the coronal suture closer to the midline, deemed the
medial zone, a significant difference was found in mean suture width between groups at 88 day
in age group at the ectocortical suture surface (p <.05); additionally, significant differences in
mean suture area between the groups were recorded at age 25 and 88 (p <.05). A significant
difference bony bridging frequency between the interdigitating zone and medial zone of DOS
sutures was observed at the 45 day age group. The results of the 6X2 (age by group) two-way
ANOVA indicate significant interaction at various cortical levels as well as total suture area at
the interdigitating and medial zone (p < 0.05).
Results suggest that bony bridging and sutural ligament thickening occurs much earlier
than coronal suture growth cessation in DOS rabbits and that these factors may limit subsequent
sutural growth in an additive effect.

vi
TABLE OF CONTENTS
ABSTRACT…………………………………………………………………………..………...IV
LIST OF TABLES…………………………………………………………………..……… VIII
LIST OF FIGURES…………………………………………………………………………… IX
PREFACE ..................................................................................................................................... X
1.0 INTRODUCTION ........................................................................................................ 1
2.0 HYPOTHESIS .............................................................................................................. 6
3.0 MATERIALS AND METHODS ................................................................................ 7
3.1 SAMPLE COLLECTION AND HISTOLOGICAL STAINING ................... 7
3.2 MICROSCOPY AND METRIC COLLECTION ............................................ 9
3.2.1 Qualitative Analysis. ...................................................................................... 10
3.2.2 Quantitative Metric Data Gathering ........................................................... 10
3.3 STATISTICAL ANALYSIS ............................................................................. 12
4.0 RESULTS ................................................................................................................... 13
4.1 QUALITATIVE ANALYSIS ............................................................................ 13
4.2 QUANTITATIVE ANALYSIS ......................................................................... 15
4.2.1 Suture Width .................................................................................................. 15
4.2.1.1 Interdigitating Zone ............................................................................ 15
4.2.1.2 Medial Zone ......................................................................................... 21
4.2.2 Total Suture Area .......................................................................................... 27
4.2.2.1 Interdigitating Zone ............................................................................ 27
4.2.2.2 Medial Zone ......................................................................................... 28

vii
4.2.3 Bony Bridging ................................................................................................ 29
4.2.4 6 X 2 (Age by group) two-way ANOVA ...................................................... 30
5.0 DISCUSSION ............................................................................................................. 32
APPENDIX A .............................................................................................................................. 38
BIBLIOGRAPHY ....................................................................................................................... 39

viii
LIST OF TABLES
Table 1 Sample Size Qualitative Analysis- The number of animals used by age and group for the
qualitative analysis .......................................................................................................................... 8
Table 2 Sample Size Quantitative Analysis- The number of sutures by age and diagnosis group
used for quantitative analysis (suture width, total suture area, and bony bridging frequency). ..... 8
Table 3 Mean ectocortical suture width measured at the interdigitating zone ............................. 16
Table 4 Mean mesocortical suture width measured at the interdigitating zone. ........................... 16
Table 5 Mean endocortical suture width measured at the interdigitating zone ............................ 17
Table 6 Mean ectocortical suture width measure at the medial zone ........................................... 22
Table 7 Mean mesocortical suture width measured at the medial zone ....................................... 22
Table 8 Mean endocortical suture width measured at the medial zone ........................................ 23
Table 9 Mean total suture area (mm2) by age group measured at the interdigitating zone .......... 27
Table 10 Mean total suture area (mm2) by age group measured at the medial zone ................... 28
Table 11 Mean frequency of recorded bony bridges between the frontal and parietal bone
recorded at the interdigitating and medial zones. ......................................................................... 29
Table 12 Results of 6 X 2 (age by group) two-way ANOVA for suture width, total suture area,
and frequency of bony bridging. *p < .001. **p <.05. ................................................................. 31
Table 13 t-values from all unpaired t-tests performed .................................................................. 38

ix
LIST OF FIGURES
Figure 1 Location of medial (MZ) and interdigitating (IZ) zones. ............................................... 11
Figure 2 Histophotomicrographs demonstrating the methods of metric data collection .............. 11
Figure 3 Histophotomicrograph of bony bridging. ....................................................................... 12
Figure 4 Histophotomicrographs of coronal suture taken from the interdigitating and medial
zones from the delayed onset affected animals (DOS) and the wild type controls (WT). ........... 14
Figure 5 Bar graphs of mean suture width (mm) by group and age at the interdigitating zone. .. 17
Figure 6 Cubic Regression model of suture width at the ectocortical suture surface at the
interdigitating zone. ...................................................................................................................... 19
Figure 7 Cubic Regression model of suture width at the mesocortical level of the suture at the
interdigitating zone. ...................................................................................................................... 20
Figure 8 Cubic Regression model of suture width at the endocortical surface of the suture at the
interdigitating zone. ...................................................................................................................... 20
Figure 9 Bar graphs of mean suture width (mm) by group and age at the medial zone. .............. 23
Figure 10 Cubic Regression model of suture width at the ectocortical suture surface at the medial
zone. .............................................................................................................................................. 25
Figure 11 Cubic Regression model of suture width at the mesocortical level of the suture at the
medial zone. .................................................................................................................................. 26
Figure 12 Cubic Regression model of suture width at the endocortical surface of the suture at the
medial zone. .................................................................................................................................. 26

x
PREFACE
I would like to acknowledge the Department of Anthropology for the support that I received
while working in the physical anthropology laboratory and completing my coursework for the
Oral Biology program. I am privileged to have worked with a great variety of individuals ranging
from interns, staff, and faculty of the department, and believe that my experience was shaped by
those I interacted with.
I would like to thank Dr. Siegel, Dr. Weinberg, and Dr. Cooper for their continual
motivation for me to work at a high level and for being members of my thesis committee. Your
time and flexibility has been vital as I worked through this process to completion. I am also
grateful for all of my professors and colleagues from the Oral Biology department that I have had
the opportunity to learn from during my time in the program.
I have been extremely lucky to work along side Dr. Mooney for the past 5 years. Your
knowledge as a professor and guidance as an advisor has been monumental to my pursuit of a
life in science. As a boss you taught me that confidence and humility are key in working in
collaborative setting. I appreciate everything you have done for me and will take the lessons you
taught with me as I progress through the various stages of my education and career.
Lastly, I would like to thank my parents and family. Your love has and support has
shown no limits.

1
1.0 INTRODUCTION
During embryonic development, craniofacial bones arise through intramembranous and
endochondral processes. Skull bones arising from such development, grow from a central
location peripherally, with articulations forming between the bony plates. Skull sutures are a thin
layer of fibrous tissue found at the articulations of approximating bones (Cohen, 2000).
Collagen, the predominant fibrous constituent of postnatal skull sutures, arrange between
adjacent bones to resist tensile or compressive forces (Herring, 2000, 2008). Development of the
sutural joint is formed by cell division and growth of cells at extensions, called osteogenic fronts,
of each adjacent skull bone (Cohen, 2000). Functioning sutures allow for continuous growth of
the cranial vault, with bone deposition and reposition occurring at the osteogenic fronts of
neighboring skull bones present at the suture (Cohen, 2000). Such articulations are present in the
neurocranium between the parietal bones, at the sagittal suture, the parietal and frontal bone, at
the coronal suture, and the the parietal and occipital bone, at the lambdoid suture (Cohen, 2000).
In craniosynostosis, premature closure of skull sutures is observed (Cohen, 2000). Under
this condition, the formation of patent suture occurs, however, early obliteration follows (Cohen,
2000; Mooney et al., 1994a). In cases of craniosynostosis, fusion begins at a localized region,
deemed the zone of complete osseous obliteration, and moves medial and laterally along the
suture (Cohen, 2000). In the rabbit model, the zone of complete osseous obliteration has served

2
as a synostoic foci and corresponds with underlying dural sinus tracts (Mooney et al, 2007; Reed
et al, 2007). On gross morphological description of this region, extensive interdigitating of the
coronal suture and bony bridging between frontal and parietal osteogenic fronts has been
described. (Mooney et al, 1996). In this study, the interdigitating zone was studied as a potential
initiation focus for suture fusion. Additionally, a region medially located (near the sagittal
suture), was studied as a means to track synostotic progression along the width of the suture; this
region has been named the medial zone.
It is estimated that nonsyndromic craniosynostosis affects 300 per 1 million births, of
which 24% are affecting the coronal suture (Cohen 1986). In humans, the coronal suture
typically is expected to remain patent throughout the stages of brain development and only begin
physiological fusion between 22 and 39 years of age (Cohen, 1993). Normal brain growth
typically plateaus around 6 yeas of age. Instances of isolated delayed onset coronal suture
synostosis occurring before the age of 6 would severely limit normal expansion of the cranial
vault and result in impeded brain growth and development. Due to the compensatory growth
along perpendicular axis to the affected suture, craniometrics and analysis of an affected
individual’s head shape has allowed for definitive diagnosis of suture fusion (Cunningham and
Heike, 2007). Additionally, approximately 150 syndromes have been identified causing primary
or secondary premature suture fusion, including Apert syndrome, Carpenter syndrome, Crouzon
syndrome, Saethre-Chotzen syndrome, Pfeiffer syndrome, as well as others (Rogers et al., 2015;
Cohen, 2000c, Connolly et al., 2004, Hoefkens et al., 2004).

3
Though many syndromic causes of primary or secondary craniosynostosis have identified
gene mutations, environmental etiologies, including in-utero growth restrictions and metabolic
disorders, have been associated with craniosynostosis (Cunningham and Heike, 2007; Graham et
al., 1980). Nonsyndromic single suture fusion has been identified as the most common form of
craniosynostosis, however, the pathogenesis of premature suture fusion is not well understood.
(Cunningham and Heike, 2007; Cohen, 2000; Johnson and Wilkie 2011). Mutations in FGFR2,
FGFR3, TWIST, MSX2, and TGFβR genes have been implicated as potential etiologies of
coronal suture fusion (Renier et al., 2000; Reardon et al., 1997; Seto et al., 2007; Johnson et al.,
2000). Additionally, growth factors, such as Tgf-β isoforms, secreted by the dura mater have
been reported as integral components of maintaining normal suture physiology (Poisson et al.,
2004; Johnson and Wilkie, 2011). Recently, Tgf-β2 neutralizing antibody was successfully used
to rescue coronal sutures in DOS rabbits, indicating the role of molecular signals in suture fusion
and the potential of cytokine therapy (Mooney et al., 2016).
In 1994, a rabbit colony expressing nonsyndromic coronal suture craniosynostosis was
reported (Mooney et al., 1994a). This model has been valuable in describing the pathological
progression of early suture fusion, which can be applied in syndromic and nonsyndromic cases
(Mooney et al., 1994a). In early descriptions of the rabbit model, trends suggested the trait
followed an autosomal dominant inheritance pattern with high penetrance and variable
expression of the disorder (Mooney et al., 1994a). Phenotypically, early and delayed onset
synostosis has been observed both bilaterally or unilaterally across the coronal suture in the
affected rabbit population. In early onset bilateral coronal synostosis, affected animals exhibited
brachycephaly, elevated bony coronal ridging, frontal bossing, and a domed appearance in the
4
anterior cranial vault (Mooney et al., 1994a). The delayed onset synostosis rabbits showed many
of the same features, though phenotypically milder (Mooney et al., 1994a). Additionally, it is
important to note that the early onset phenotype rabbits have obliterated sutures by term, while
patent sutures exist in rabbits of the delayed onset phenotype at term.
In a follow up study, radiopaque markers were placed anteriorly and posteriorly to the
coronal sutures of rabbits within the colony. In this study, marker separation was tracked at
various time points radiographic analysis and measurements (Mooney et al., 1994b). Across the
18-week study, completely synostosed sutures showed a 90% reduction in coronal suture growth
when compared to unaffected suture growth, and partially synostosed sutures showed a 25%
reduction of coronal suture growth (Mooney et al., 1994b). In this study, variable expression of
craniosynosostosis within the affected population was observed, however, key similarities in
growth patterns suggest a link between the morphology of progression of synostosis between the
complete and partial.
A histological analysis of the coronal sutures of the complete synostosis rabbits was
conducted and revealed that suture fusion began at a region in the middle of the suture, also
called the interdigitating zone (Mooney et al., 1996). Osseous projections connecting the
osteogenic fronts of the parietal and frontal bones were detected earliest at the interdigitating
zone and progressed medially and laterally, eventually leading to complete suture obliteration
(Mooney et al., 1996). It is important to note that these animals did show the formation of a
suture, however, thick osteogenic fronts, extensive bony bridging, and suture fusion appeared
prenatally (Mooney et al., 1996).

5
A gross morphological description of partially synostosis rabbits, also called delayed-
onset synostosis rabbits (DOS), has been conducted and the results, as described earlier, have
been published (Mooney et al., 1998, 1996). The DOS rabbits show plateauing of coronal suture
growth followed by suture obliteration by 42 days of age. Additionally, human cases of delayed
onset synostosis have been reported (Cohen et al., 1993; Reddy et al., 1990). Using the delayed
onset phenotype, studies testing potential therapies for abnormal suture fusion can be conducted
significantly easier. However, a histologic description of the progression of suture closure in this
phenotype has not been performed to determine if the delayed onset group serves as a proper
model for other phenotypes.
6
2.0 HYPOTHESIS
The objective of this study is to describe the progression of coronal suture synostosis in DOS
rabbits against wild type controls through histological analysis. Though initial development of a
patent suture will be observed in the sutures of the affected group, suture fusion is expected by
day 88. Dysmorphic suture features such as end to end articulation of the osteogenic fronts and
bony bridging may indicate the progression of synostosis in the affected group at the
interdigitating and medial zone. Additionally, it is hypothesized that a significant difference in
mean suture width and total suture area will be measured between the DOS affected group.
Through both qualitative and quantitative analysis, bony bridging is expected to be seen at first at
the interdigitating zone, a region laterally located along the width of the suture, and at the medial
zone in older rabbits within the affected group. Sutures in the wild type control are anticipated to
remain patent at all ages.

7
3.0 MATERIALS AND METHODS
3.1 SAMPLE COLLECTION AND HISTOLOGICAL STAINING
The calvaria from 80 postnatal New Zealand White rabbits (Orcyctolagus cuniculus) were
examined in this study. Sutures were collected from rabbits 1, 5, 10, 25, 31, 42, 88, 150 age in
days (Table 1). Of the samples collected, 39 were unaffected wild type controls and 41 were
delayed onset craniosynostosis rabbits.
Rabbits were euthanized with an overdose of penobarbital (Nembutal, 300mg/kg, IV;
Abbot Labs, Chicago, IL). Following the sacrifice, suture status was diagnosed by visual
observation (Mooney et al. 1994a 1996) as unaffected or delayed onset. The sutures of the
rabbits were harvested from the calvaria in rectangular blocks (160 total sutures) and processed
for serial histologic examination. The sutures were fixed in 10% buffered neutral formalin,
demineralized in 5% trichloroacetic acid (TCA), dehydrated in a series of acetone washes, and
embedded in mehtylmethacrylate (JB-4 Plus, Polyscience, Inc., Warington, PA). The specimens
were then sectioned with a thickness of 5 microns (μ) along the sagittal plane of the coronal
suture. The sections were then treated and stained with hematoxylin and erythrosine for light
microscopy and histomorphometric analysis.

8
Table 1 Sample Size Qualitative Analysis- The number of animals used by age and group for the qualitative
analysis
Table 2 Sample Size Quantitative Analysis- The number of sutures by age and diagnosis group used for
quantitative analysis (suture width, total suture area, and bony bridging frequency).
Age (Days)
5 10 25 31 42 88 Total Sutures
Wild Type 3 1 2 1 2 2 11 DOS 2 2 3 2 4 2 15
Age (Days)
1 5 10 25 31 42 88 150 Total Subjects
Total Sutures
Wild Type 11 6 5 5 3 3 4 2 39 78 DOS 8 7 4 5 3 5 5 4 41 82

9
3.2 MICROSCOPY AND METRIC COLLECTION
Histological slides were qualitatively and quantitatively analyzed using a Leica MZ12 Stereo
Zoom microscope and Northern Eclipse (v 5.0). Digital images of the specimens were captured
using a Sony DKC-5000, 3 CCD digital camera attached to the microscope and stored on a PC.
The magnification, slide number, and orientation of each slide was recorded on paper, in a
spreadsheet, as well as through file name and tag. The images were then equalized for white
balance and contrast to maximize the image quality, as well as rotated to standardize the
orientation of each image. Additionally, microscope rulers were photographed at various
magnifications and stored on the PC for measurements.
Sutures each from the wild-type and delayed onset rabbits at 5, 10, 25, 31, 42, and 88
days of age were chosen for histomorphometric analysis. The images selected were picked based
on image quality, integrity of the specimen, and availability at the referenced age. In total, 11
unaffected and 15 delayed onset age matched specimens were selected. Using Adobe Photoshop
(v 12.0) sutured were traced and outlined with a .3 px white demarcation.
ImageJ (v 1.48) was then used to carry out the metric analysis. For each suture image, the
microscope ruler captured at the same magnification was utilized to establish the reference scale
in ImageJ. The ruler image was loaded and a 1 mm distance was measured and input into the
program to standardize a reference scale for each corresponding magnification.

10
3.2.1 Qualitative Analysis.
All sutures collected (n=160) were used in an age comparison analysis between the unaffected
and DOS rabbits. Generally, the images obtained were used to describe the synostotic foci, the
extent of relative bony bridging, and coronal suture morphology in the samples.
3.2.2 Quantitative Metric Data Gathering
The samples selected for histomorphometric analysis were measured using ImageJ to obtain
endocortical suture width, mesocortical suture width, ectocortical suture width, total suture area,
and number of bony bridges (Figure 2). All measurements were done three times, with the mean
measurement being recorded, by the same individual. All measurements were performed at the
interdigitating zone as well as at a medially located region of the coronal suture (Figure 1). All
measurements were taken blindly with regard to group identity. A random sample of 10% of the
images were traced and measured twice. Intra-observer, repeated measurement reliability was
calculated at r = 0.999; p < 0.001, for suture width and r = 0.988; p < 0.001, for suture area.

11
Figure 1 Location of medial (MZ) and interdigitating (IZ) zones.
Figure 2 Histophotomicrographs demonstrating the methods of metric data collection
On the left side, the suture has been outlined using Photoshop, and total suture area was measured using ImageJ. The
image on the right shows the levels where suture width was measured.

12
Figure 3 Histophotomicrograph of bony bridging.
3.3 STATISTICAL ANALYSIS
Regression analysis was performed using Microsoft Excel to statistically analyze the data
between groups by age. Data was fit to a cubic model, which represents an expected biological
growth function. Additional statistical analysis was performed using Using Stata/SE (v 14.2).
Unpaired t-test was used to compare the mean suture width and mean total suture area between
age matched specimens of each diagnosis group at the ectocortical surface, at the mesocortical
level, and at the endocortical surface of the suture at the interdigitating and medial zones. Paired
t-test was used to compare the mean number of recorded bony bridges by age group between the
interdigitating and medial zones of the DOS affected rabbits. Furthermore, suture width, total
suture area, and frequency of bony bridging was analyzed for variance between and within
groups using a 6 x 2 (age by group) two-way ANOVA test. Differences were considered
significant if p< .05.
13
4.0 RESULTS
4.1 QUALITATIVE ANALYSIS
In wild-type rabbits, the existence of coronal sutures was evident at term and remained patent at
all ages. A well defined sutural ligament was present and distinct osteogenic fronts were
observed at both the interdigitating and medial zone. The suture showed dorsal-ventral
overlapping of the frontal and parietal bones without osseous connections. In the affected (DOS)
group, the morphology of the suture resembled the wild type controls until day 10. Initially,
specimens from the affected group showed similar suture development and general suture
morphology to age match controls sutures from term until day 10. In some DOS sutures, osseous
projections, or bony bridges, began to appear at the laterally located interdigitating zone
connecting the osteogenic fronts as early as day 10. With increased age, more extensive bony
bridging at the interdigitating zone, as well as increased frequency across the suture, was
observed. Additionally, sutural ligaments followed a general trend of thickening until day 32 and
dramatically narrowing after with associated increase in bony bridging. Typical dorsal-ventral
overlapping of the osteogenic fronts was not seen across all ages, with variations ranging from
severe overlapping to end to end approximation. Generally, total suture obliteration was
observed by day 85. Though general trends and similarities were described, it is worth noting
that variance in suture ligament morphology was observed within each age group of the DOS
rabbits.

14
Figure 4 Histophotomicrographs of coronal suture taken from the interdigitating and medial zones from the
delayed onset affected animals (DOS) and the wild type controls (WT).
Samples were collected from six different age groups (5-88 days)

15
4.2 QUANTITATIVE ANALYSIS
4.2.1 Suture Width
4.2.1.1 Interdigitating Zone
Unpaired t-test
To assess potential differences in the morphology of suture at the interdigitating zone of between
the wild-type and DOS groups, suture width was measured and analyzed for statistical
differences. At the ectocortical, mesocortical, and endocortical surfaces, the coronal suture was
measured to be wider in the 5, 10, 25, 45, and 88 days of age rabbits in the wild-type group than
the DOS groups. In both groups, suture widths increased slowly from ages 5 to 25 days. In the
wild-type group, a rapid growth and expansion of suture width was measured between age 45
and 88. However, in the DOS group coronal suture width plateaued and rapidly narrowed from
ages 31 to 88 in days. The maximum mean suture width at all levels of the coronal suture at the
interdigitating zone was at age 88 in days in the wild-type group and at age 31 in days in the
DOS rabbit group. The unpaired t-test comparing means between the delayed onset group and
the age matched wild types at the endocortical, mesocortical, or endocortical surface of the
suture showed no significant difference suture width at any age (p >.05) (Tables 2-4).

16
Table 3 Mean ectocortical suture width measured at the interdigitating zone
Age (Days) 5 10 25 31 45 88
WT Mean ± SD .303 ± .11 0.201 .395 ± .12 0.21 .304 ± .11 .971 ± .51
n 3 1 2 1 2 2
DOS Mean ± SD 0.124 ± .07 .15 ± .11 .152 ± .073 0.674 ± .43 .285 ± .15 .197 ± .12 n 2 2 3 2 4 2
t-value -2.060 - -2.990 - -0.159 -2.580 * p < .05
Table 4 Mean mesocortical suture width measured at the interdigitating zone.
Age (Days) 5 10 25 31 45 88
WT Mean ± SD .199 ± .083 0.178 .425 ± .23 0.185 .377 ± .23 1.0215 ± .41
n 3 1 2 1 2 2
DOS Mean ± SD .076 ± .001 0.114 ± .064 .0933 ± .083 .313 ± .19 .134 ± .10 .1645 ± .03 n 2 2 3 2 4 2
t-value -2.400 - -2.480 - -1.910 -2.960 * p < .05

17
Table 5 Mean endocortical suture width measured at the interdigitating zone
Age (Days) 5 10 25 31 45 88
WT Mean ± SD .25 ± .11 0.184 .408± .22 0.241 .2465 ± .088 1.094 ± .95
n 3 1 2 1 2 2
DOS Mean ± SD .0875 ± .052 .161 ± .09 .093 ± .038 .357 ± .20 .111 ± .067 .176 ± .021
n 2 2 3 2 4 2 t-values -1.870 - -2.640 - -2.140 -1.370
* p < .05
Figure 5 Bar graphs of mean suture width (mm) by group and age at the interdigitating zone.
Bar graphs showing mean suture width at the ectocortical (A), mesocortical (B), and endocortical (C) suture level at
the interdigitating zone.
18
Linear Regression
Linear regression analysis was used to visualize difference in growth rates and patterns in suture
width at the interdigitating zone at various levels of the coronal suture. In wild-type group at the
ectocortical, mesocortical, and endocortical suture surfaces, a slow growth phase was measured
from age 5 to 25 in days. At all three levels, a mild narrowing of the suture occurred between
ages 25 and 42 in days which was followed by a rapid growth phase. In comparison, regression
curves of the suture width data for the DOS group at the ectocortical surface showed a slower
growth rate, leading to a maximum suture width at age 42 in days; this was followed by a rapid
depression of growth and narrowing of the suture. A similar trend was seen at the mesocortical
and endocortical level of the suture, however, the growth curves generated by the regression
analysis of the DOS group is noticeably depressed in comparison to the wild-type controls.
Suture width data at the ectocortical level analyzed using a cubic regression model yielded the
equation of, y = 6E-06x3 - 0.0006x2 + 0.0157x + 0.2136 with an R2 value of .75 for the wild-type
group. The ectocortical suture width data for the DOS group was also applied to a cubic
regression model which generated the equation, y = 2E-06x3 - 0.0004x2 + 0.0211x - 0.0042, with
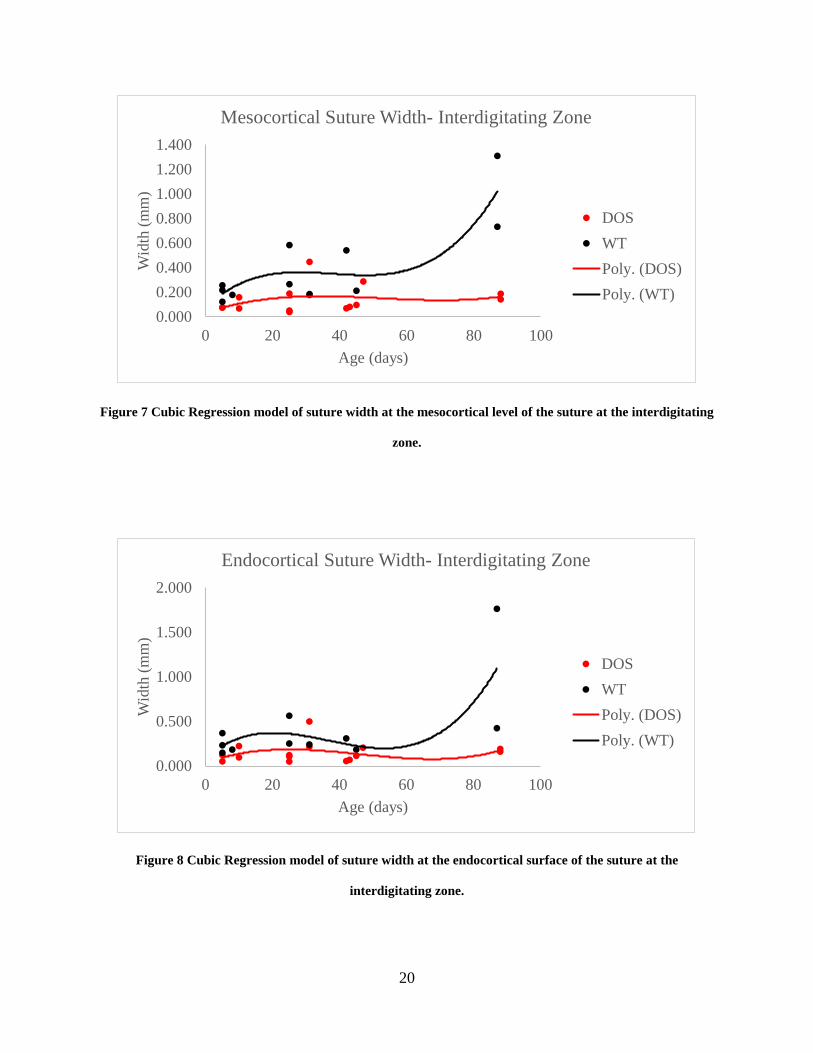
an R2 value of .17. At the mesocortical level, the cubic regression analysis for the wild-type
group generated a trendline equation of y = 6E-06x3 - 0.0007x2 + 0.0257x + 0.0754 with an R2
value of .74. The DOS suture width data at the mesocortical level cubic regression analysis
resulted in an equation of y = 1E-06x3 - 0.0002x2 + 0.0094x + 0.0317 with an R2 of .099. At the
endocortical level, cubic regression model applied to suture width data of the wild-type group
resulted the trendline equation y = 9E-06x3 - 0.001x2 + 0.0308x + 0.0975 with an R2 values of
.53. At the same level in the DOS group, suture width data analyzed using a cubic regression
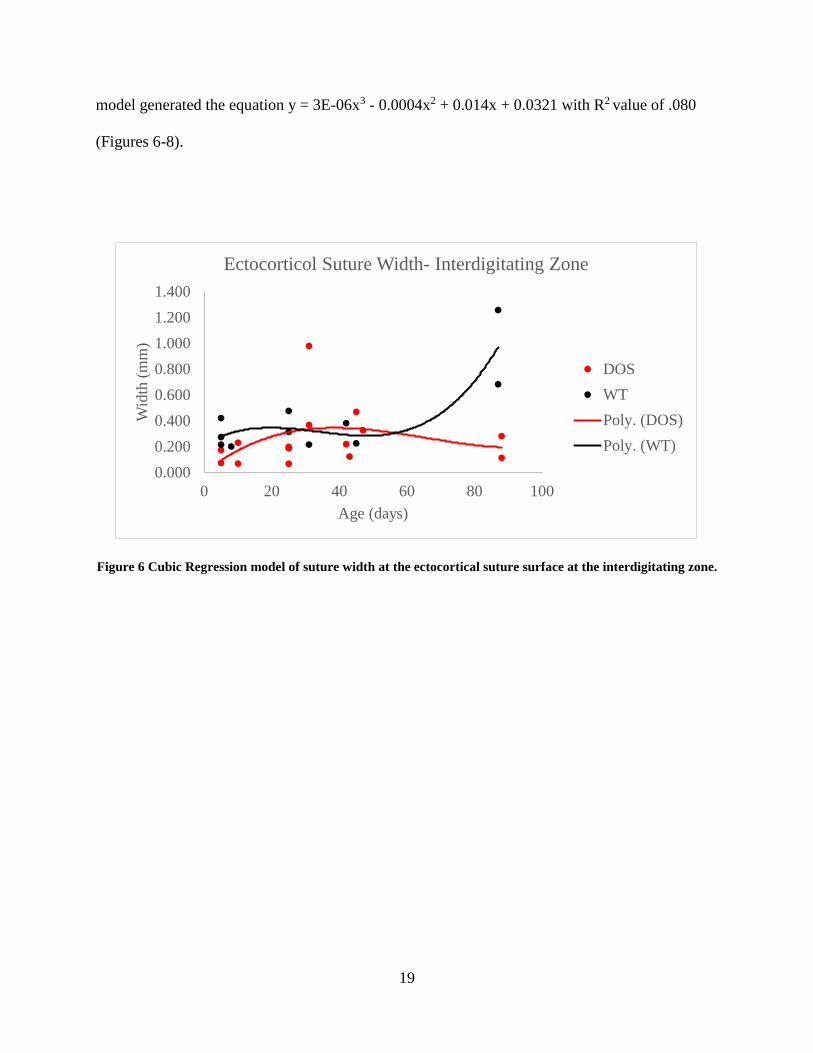
19
model generated the equation y = 3E-06x3 - 0.0004x2 + 0.014x + 0.0321 with R2 value of .080
(Figures 6-8).
Figure 6 Cubic Regression model of suture width at the ectocortical suture surface at the interdigitating zone.
0.0000.2000.4000.6000.8001.0001.2001.400
0 20 40 60 80 100
Wid
th (m
m)
Age (days)
Ectocorticol Suture Width- Interdigitating Zone
DOSWTPoly. (DOS)Poly. (WT)
20
Figure 7 Cubic Regression model of suture width at the mesocortical level of the suture at the interdigitating
zone.
Figure 8 Cubic Regression model of suture width at the endocortical surface of the suture at the
interdigitating zone.
0.0000.2000.4000.6000.8001.0001.2001.400
0 20 40 60 80 100
Wid
th (m
m)
Age (days)
Mesocortical Suture Width- Interdigitating Zone
DOSWTPoly. (DOS)Poly. (WT)
0.000
0.500
1.000
1.500
2.000
0 20 40 60 80 100
Wid
th (m
m)
Age (days)
Endocortical Suture Width- Interdigitating Zone
DOSWTPoly. (DOS)Poly. (WT)

21
4.2.1.2 Medial Zone
Unpaired t-test
Analysis of suture width at the medial zone was performed to determine if any significant
measurable differences in suture morphology between the wild-type and DOS groups. In the
wild-type group, sutures at the ectocortical surface and mesocortical levels widened from ages 5
to age 25 in days, followed by a brief narrowing period and then a widening period. At the
endocortical surface, the widening continued through till age 31 in days, after which, a
narrowing was measured at age 45 in days of the collected suture. At all three levels of the
suture, a dramatic increase in suture width was measured in sutures collected from the age 88 in
days wild-type group. This age group marked the maximum width of the suture measured for the
wild-type controls. In the DOS group at the ectocortical surface, the maximum suture width was
recorded among the age 31 in day group. Following this peak, a sharp narrowing of the suture
was recorded in subsequent age groups at the ectocortical level. In contrast, at the mesocortical
level of sutures collected from the DOS rabbits, a moderate increase in width was recorded with
increased age groups until age 31 in days. A narrowed suture was recorded in the age 45 in day
group, and then an expansion of suture width was recorded in the age 88 in day group. The
endocortical surface of the sutures collected from the DOS group recorded slow, steady
increasing width with age with exception of a recorded narrowing among the age 25 in day
group. The results of the unpaired t-test at the medial zone showed no significant differences in
mean suture width at any age at the mesocortical level or at the endocortical suture surface
between the wild-type and DOS groups (Tables 7-8). At the ectocortical surface, a difference
was found between groups at day 88 (p<.05) (Table 6).

22
Table 6 Mean ectocortical suture width measure at the medial zone
Age (Days)
5 10 25 31 45 88
WT Mean ± SD .107 ± .025 0.076 .311 ± .012 0.295 .156 ±
.0042 .554 ± .050*
n 3 1 2 1 2 2
DOS Mean ± SD .1195 ± .067 0.275 ± .053 .196 ± .13 .789 ± .081 .2815 ± .33 0.197 ± .11*
n 2 2 3 2 4 2 t-values 0.260 - -1.180 - 0.503 -4.070*
* p < .05
Table 7 Mean mesocortical suture width measured at the medial zone
Age (Days)
5 10 25 31 45 88
WT Mean ± SD .104 ± .037 0.110 .255 ± .045 0.227 .133 ± .021 .658 ± .17
n 3 1 2 1 2 2
DOS Mean ± SD .101 ± .024 .174 ± .011 .121 ± .087 .237 ± .066 .159 ± .12 .309 ± .12 n 2 2 3 2 4 2
t-values -0.098 - -1.940 - 0.293 -2.390 * p < .05

23
Table 8 Mean endocortical suture width measured at the medial zone
Age (Days) 5 10 25 31 45 88
WT Mean ± SD .107 ± .043 0.102 .221 ± .011 0.249 .1805 ± .049 .6225 ± .025
n 3 1 2 1 2 2
DOS Mean ± SD .125 ± .067 .148 ± .016 .131 ± .095 .179 ± .028 .195 ± .18 .248 ± .20 n 2 2 3 2 4 2
t-values 0.369 - -1.270 - 0.109 -2.700 * p < .05
Figure 9 Bar graphs of mean suture width (mm) by group and age at the medial zone.
Bar graphs showing mean suture width at the ectocortical (A), mesocortical (B), and endocortical (C) suture level at
the medial zone.

24
Linear Regression
Regression analysis was applied to suture width data to generate curves representative of the
growth rates of the coronal suture at three cortical levels at the medial zone. In the wild-type
group, a rapid period of growth is observed at the ectocortical and endocortical surfaces of the
coronal suture. At the ectocortical surface, this rapid growth was followed by slower period of
suture narrowing until day 60 of age. After this point, another rapid period of growth was
observed, leading to maximum suture width by day 88. At the endocortical surface a shallower
depression of suture growth rate and less extensive narrowing of the suture was observed after
the initial rapid growth phase in the wild-type group. However, an equally rapid phase of growth
is represented by regression model. At the mesocortical level, a less dramatic period of growth
was seen, and was followed by an equivalent period of slight narrowing of the suture. However,
as was seen in at the ectocortical and endocortical levels, a rapid period of suture growth is
represented by the cubic regression curve. The regression analysis applied to suture width data
collected from the DOS group showed varying trends at each level of the suture. At the
ectocortical surface, a rapid growth phase is seen, peaking at approximately 31 days of age. At
this cortical level, a long and slow narrowing of the suture follows the rapid growth phase until
age 80 in days. The model then indicates another period of growth occurring, though at a
relatively depressed rate. At the mesocortical suture level, a slow continuous growth rate is
observed until approximately 60 days of age, at which an increase in the rate of suture expansion
is seen, with measured suture width peaking at 88 days of age. At the endocortical surface, an
initial narrowing of the suture is seen before a slow expansion of the suture peaking at
approximately 70 days. However, unlike the ectocortical and mesocortical levels, a plateauing of

25
the suture width followed by narrowing of the suture is observed with an increase in age. For the
wild-type group, suture width data at the ectocortical level analyzed using a cubic regression
model resulted in generation of the equation y = 9E-06x3 - 0.0011x2 + 0.0378x - 0.0759 with an
R2 value of .95. At the mesocortical level the equation y = 4E-06x3 - 0.0004x2 + 0.0125x +
0.0467 was generated, with an R2 value of .85. At the endocortical suture surface, cubic
regression analysis formulated the equation y = 5E-06x3 - 0.0006x2 + 0.0212x + 0.0059, with an
R2 value of .98. In the DOS group at the ectocortical surface, the generated equation was y = 4E-
06x3 - 0.0006x2 + 0.0282x + 0.0064, with an R2 value of .14. At the mesocortical level, the cubic
regression equation was y = 1E-06x3 - 0.0002x2 + 0.0061x + 0.0922, with an an R2 value of .33.
At the endocortical suture surface, the cubic regression equation generated was y = -2E-06x3 +
0.0002x2 - 0.0058x + 0.1639, with an R2 value of .16 respectively for the DOS affected group.
(Figures 10-12).
Figure 10 Cubic Regression model of suture width at the ectocortical suture surface at the medial zone.
0.000
0.200
0.400
0.600
0.800
1.000
0 20 40 60 80 100
Wid
th (m
m)
Age (days)
Ectocortical Suture Width- Medial Zone
DOSWTPoly. (DOS)Poly. (WT)

26
Figure 11 Cubic Regression model of suture width at the mesocortical level of the suture at the medial zone.
Figure 12 Cubic Regression model of suture width at the endocortical surface of the suture at the medial
zone.
0.0000.1000.2000.3000.4000.5000.6000.7000.8000.900
0 20 40 60 80 100
Wid
th (m
m)
Age (days)
Mesocortical Suture Width- Medial Zone
DOSWTPoly. (DOS)Poly. (WT)
0.0000.1000.2000.3000.4000.5000.6000.700
0 20 40 60 80 100
Wid
th (
mm
)
Age (days)
Endocortical Suture Width- Medial Zone
DOSWTPoly. (DOS)Poly. (WT)
27
4.2.2 Total Suture Area
4.2.2.1 Interdigitating Zone
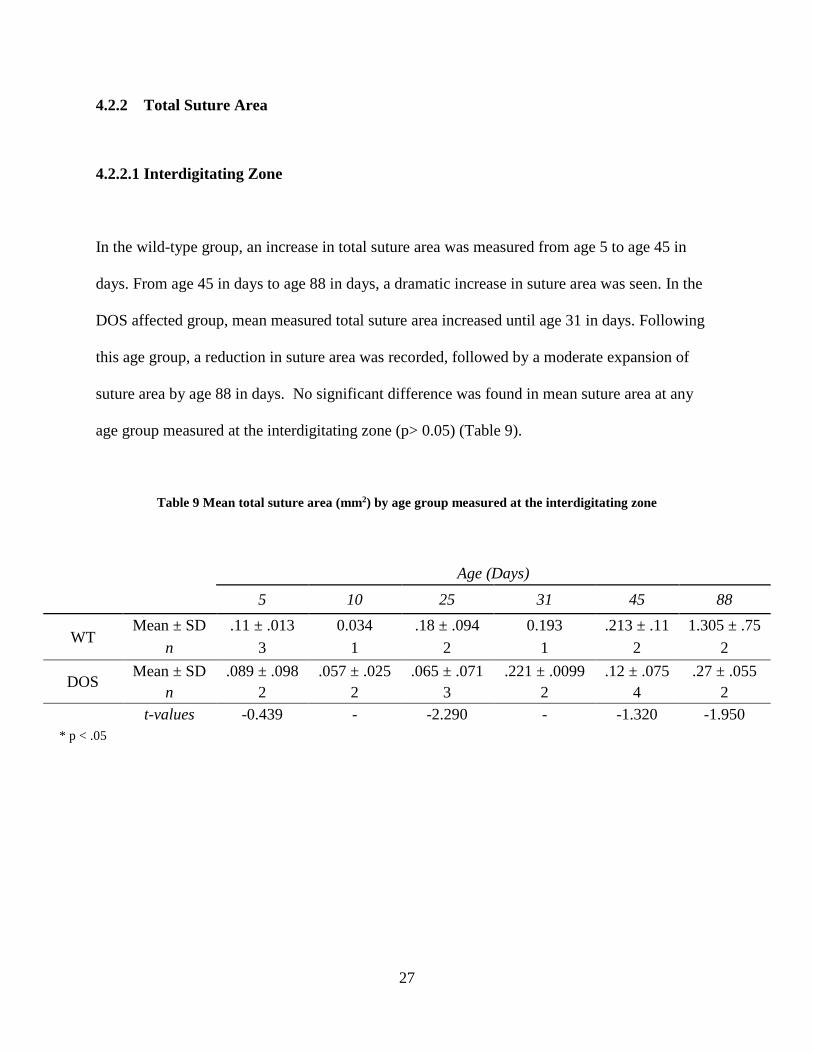
In the wild-type group, an increase in total suture area was measured from age 5 to age 45 in
days. From age 45 in days to age 88 in days, a dramatic increase in suture area was seen. In the
DOS affected group, mean measured total suture area increased until age 31 in days. Following
this age group, a reduction in suture area was recorded, followed by a moderate expansion of
suture area by age 88 in days. No significant difference was found in mean suture area at any
age group measured at the interdigitating zone (p> 0.05) (Table 9).
Table 9 Mean total suture area (mm2) by age group measured at the interdigitating zone
Age (Days) 5 10 25 31 45 88
WT Mean ± SD .11 ± .013 0.034 .18 ± .094 0.193 .213 ± .11 1.305 ± .75
n 3 1 2 1 2 2
DOS Mean ± SD .089 ± .098 .057 ± .025 .065 ± .071 .221 ± .0099 .12 ± .075 .27 ± .055
n 2 2 3 2 4 2 t-values -0.439 - -2.290 - -1.320 -1.950
* p < .05
28
4.2.2.2 Medial Zone
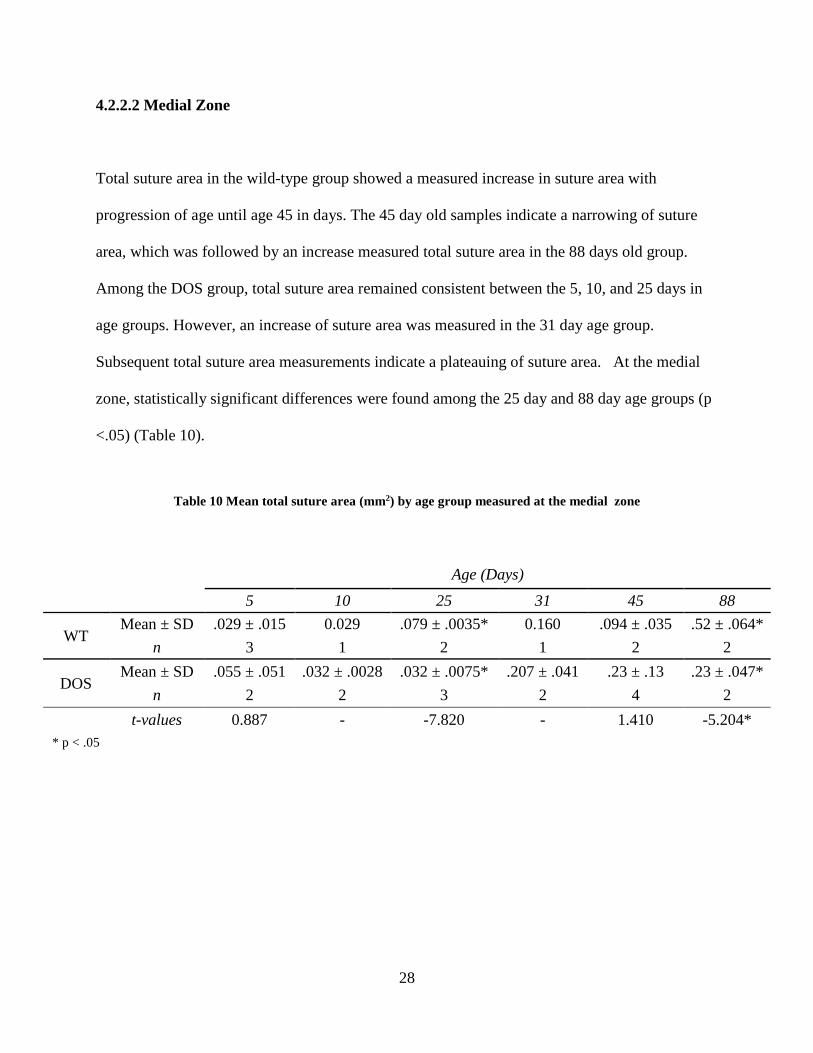
Total suture area in the wild-type group showed a measured increase in suture area with
progression of age until age 45 in days. The 45 day old samples indicate a narrowing of suture
area, which was followed by an increase measured total suture area in the 88 days old group.
Among the DOS group, total suture area remained consistent between the 5, 10, and 25 days in
age groups. However, an increase of suture area was measured in the 31 day age group.
Subsequent total suture area measurements indicate a plateauing of suture area. At the medial
zone, statistically significant differences were found among the 25 day and 88 day age groups (p
<.05) (Table 10).
Table 10 Mean total suture area (mm2) by age group measured at the medial zone
Age (Days) 5 10 25 31 45 88
WT Mean ± SD .029 ± .015 0.029 .079 ± .0035* 0.160 .094 ± .035 .52 ± .064*
n 3 1 2 1 2 2
DOS Mean ± SD .055 ± .051 .032 ± .0028 .032 ± .0075* .207 ± .041 .23 ± .13 .23 ± .047*
n 2 2 3 2 4 2 t-values 0.887 - -7.820 - 1.410 -5.204* * p < .05

29
4.2.3 Bony Bridging
At the interdigitating zone, bony bridging appeared first at a sample that was 10 days of age in
the partially affected animal. Observation of bony bridging increased within the 25 day rabbits (5
bony bridges recorded for n=3 rabbits) and was maximally observed at 42 day affected rabbits
(11 bony bridges for n=4 rabbits). The unaffected rabbits did not show any bony bridging
between the frontal and parietal bones at any age.
At the medial located zone of observation bony bridging was first recorded in one sample
of 25 day old affected rabbits in the medial region of the coronal suture. One bony bridge was
recorded among the two 32 day samples, and two bony bridges were observed among the four 42
day old samples. By day 88, more extensive bony bridging was observed in the coronal sutures
of the affected rabbits. No sutures of the unaffected control animals showed bony bridging at any
age group.
Table 11 Mean frequency of recorded bony bridges between the frontal and parietal bone recorded at the
interdigitating and medial zones.
Age (Days) 5 10 25 31 45 88
IZ Mean ±
SD 0 .5 ± .71 1.67 ± 2.08 .5 ± .71 2.75 ± .96* 3.0 ± 0.0
n 2 2 3 2 4 2
MZ Mean ±
SD 0 0.000 .33 ± .58 .5 ± .71 .5 ± .58* 1.5 ± .71
n 2 2 3 2 4 2 * p < .05

30
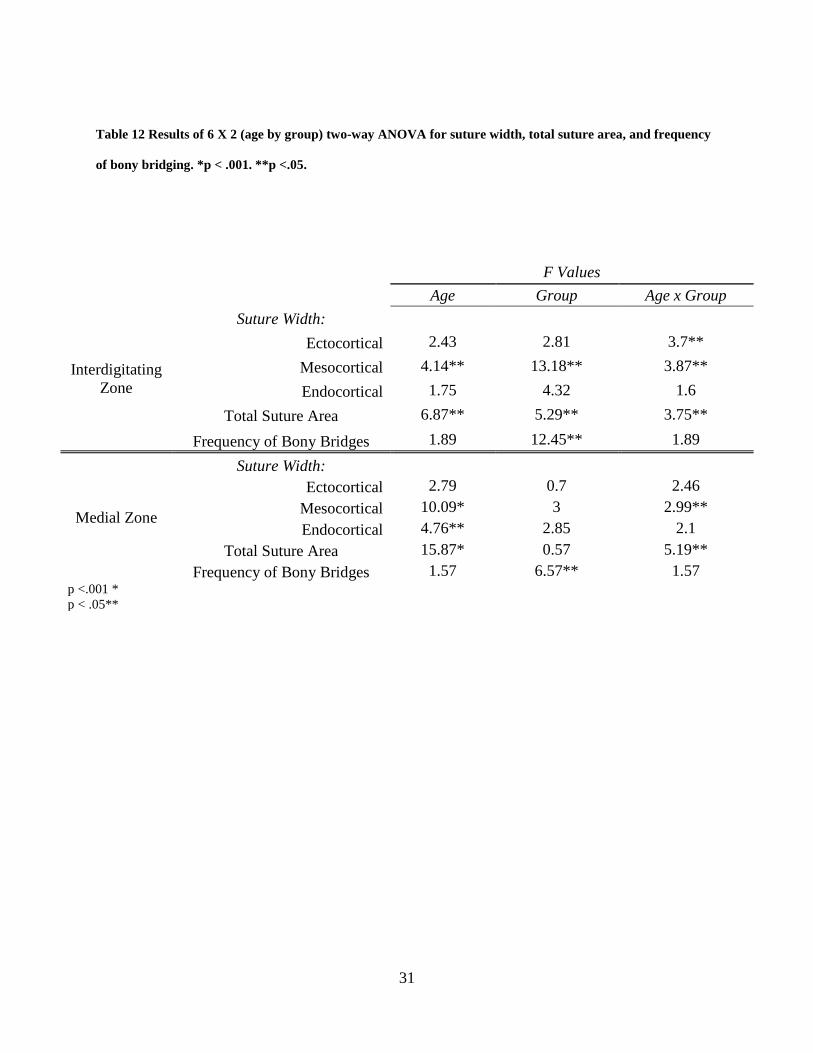
4.2.4 6 X 2 (Age by group) two-way ANOVA
The results of the two-way ANOVA indicate significant interaction between age and group for
suture width measured at the interdigitating zone at the ectocortical and mesocortical level of the
suture as well as for total suture area (p<.05) was found (Table 12). At the medial zone, two-way
ANOVA revealed significant interaction between age and group was found with suture width at
the mesocortical level and total suture area (p<.05) (Table 12). At the interdigitating zone, a
significant fixed effect of age on mesocortical suture width and total suture area was found
(p<.05). Additionally at the interdigitating zone diagnosis group was found to have a significant
effect on mesocortical and endocortical suture width, total suture area, and frequency of bony
bridging (p<.05). At the medial zone, age had a significant fixed effect on endocortical suture
width (p<.05), mesocortical suture width (p<.001), and total suture area (p<.001). Diagnosis
group showed a significant effect on frequency of bony bridging at the medial zone (p<.05).
31
Table 12 Results of 6 X 2 (age by group) two-way ANOVA for suture width, total suture area, and frequency
of bony bridging. *p < .001. **p <.05.
F Values
Age Group Age x Group
Interdigitating Zone
Suture Width: Ectocortical 2.43 2.81 3.7**
Mesocortical 4.14** 13.18** 3.87** Endocortical 1.75 4.32 1.6
Total Suture Area 6.87** 5.29** 3.75**
Frequency of Bony Bridges 1.89 12.45** 1.89
Medial Zone
Suture Width: Ectocortical 2.79 0.7 2.46
Mesocortical 10.09* 3 2.99** Endocortical 4.76** 2.85 2.1
Total Suture Area 15.87* 0.57 5.19** Frequency of Bony Bridges 1.57 6.57** 1.57
p <.001 * p < .05**

32
5.0 DISCUSSION
The present study was designed to describe and quantify the morphology of the coronal suture in
rabbits affected with delayed onset craniosynostosis against age matched controls as well as to
highlight key features of the progression of suture fusion. In both groups, a patent suture
consisting of a regular and uniform sutural ligament and normal dorsal-ventral overlapping of
osteogenic fronts were seen in sutures at days 0-10 of age. In some DOS specimens, suture
fusion was seen as early ten days. Extensive bony bridging was observed in most DOS sutures
by day 42. In such cases, bony bridging between the frontal and parietal osteogenic fronts were
observed and may serve as initiation foci for suture closure. Bony bridging increased with age in
the DOS affected specimens, and was generally observed at the interdigitating zone at earlier
ages than at the medial zone. The interdigitating zone has previously been described as a
synostotic foci in sutures collected from rabbits affected with early onset coronal suture
craniosynostosis (Mooney et al., 1996). Additionally, suture fusion was reported to progress
medially and laterally with increased gestational age in the early onset craniosynostosis
phenotype (Mooney et al., 1996). Tensile biomechanical forces occurring with normal skull
growth are increased at the location of the suture where the interdigitating zone has been
described, and may account for the initiation of synostosis occurring at this location (Herring
2000; Mooney et al., 1996).
With an increase in age, several other key differences were noted between sutures of the
delayed onset and age matched wild type controls. Normal dorsal ventral overlapping of the
osteogenic fronts was often not observed in sutures past day 10 in the delayed onset group.

33
Typically, end to end approximation of the bones was observed, and the osteogenic fronts were
noticeably thicker in the DOS sutures when compared to sutures collected from the control
group. In addition to regular overlapping of osteogenic fronts, wild type sutures consisted of a
sutural ligament uniform in width and morphology at all ages. In the sutures analyzed from the
DOS affected group, the sutural ligament began appearing dysmorphic and irregular
approximately by day ten. The changes were most commonly seen first at the endocortical
surface of sutures collected from the affected group. The narrowing and disappearance of the
sutural ligament in conjunction with extensive bony bridging suggests that initial mechanical
fusion of the coronal suture in DOS affected mostly occurs between 32 and 42 days after birth.
This may indicate a change in the genetic and molecular environment at this timeframe causing
leading to an increase in bone deposition and the initial stages of suture fusion. A previous study
using amalgam markers to track separation of the coronal suture in DOS affected animals
showed a marked decrease in growth by six weeks and continued depression when compared to
wild-type control groups (Mooney et al., 1994b). This coincides with the timeline of changes
observed at a histological level of affected sutures. By day 88, most sutures collected from DOS
animals showed complete suture fusion with loss of a distinct sutural ligament and ectocortical
ridging at the site of approximation; in wild-type controls, sutures remained patent.
Progression of synostosis of sutures in the DOS affected group was not uniform across all
specimens of the same age group. A high degree of variance in phenotypic expression and course
timeline of pathologies suggests heterogeneity amongst the group clustered together as delayed
onset. Further investigation is needed to categorize and describe phenotypic variations of suture
fusion progression within the affected group used in this study.

34
The metric analysis of the collected coronal sutures focused on measuring suture width
(ectocortical, mesocortical, and endocortical levels), total suture area, and frequency of bony
bridging at both the interdigitating zone and medial zone of DOS and WT sutures. The unpaired
t-test comparing means suture widths at various levels only showed a significant difference
between the two groups at the ectocortical suture surface at the medial zone among 88 day old
specimens (p<.05) (Tables 3-8). However, the suture width data suggests an overall narrowing of
the suture in affected animals in comparison to age matched controls. Additionally, it is
important to note the relative consistency in suture width at the ectocortical, mesocortical, and
endocortical levels among the wild type controls against the variability in width along the
thickness of the suture observed in the samples collected from the DOS subjects (Tables 2-7).
Suture width data at the interdigitating zone indicates that an initial formation of the suture does
occur, however, in comparison to the wild type controls, depressed growth and an eventual
plateauing of suture widening occurs at approximately 42 days of age. This depression and
eventual cessation of suture growth is seen more extensively at the endocortical surface at the
interdigitating zone than other cortical surfaces. This may be due to the proximity of the dural
tracts and stronger influence of molecular signals on bone deposition. At the medial zone, suture
width plateauing and reduction was also observed, however, the morphological changes were
observed later than at the interdigitating zone. This further indicates that synostosis begins at the
interdigitating zone and progresses across the span of the suture.
Comparison of mean total suture area at various age points did not reveal significant
differences between the groups at the interdigitating zone; this may be attributed to the general
dysmorphic shape of the sutural ligament seen in the DOS sutures. However, analysis of

35
measurements made at the medial zone indicates significant differences at ages 25 and 88
between the groups (Table 10). It is important to note that the statistical differences in total
suture area measured at the medial zone does not infer this site along the suture as the initiation
foci of synostosis; instead the data should be interpreted as indications of suture morphology
differences between the affected and unaffected groups. For metric investigation of the
synostosis foci, mean frequency of bony bridging between the interdigitating and medial zones
(Table 11). The significant (p<.05) difference and increased frequency of recorded bony bridging
at day 45 suggests the interdigitating zone as the site of suture fusion initiation, as was
previously described in rabbits from this colony with early onset congenital craniosynostosis
(Mooney et al., 1996).
The regression analysis of the suture width data was conducted can be used to describe
growth trends at the interdigitating and medial zone at three different levels of the suture
thickness. A cubic regression model was used to describe the wild type suture data because it
yielded the higher R2 values than other models, suggesting the data was best fit to a cubic
regression analysis. This also indicates a biphasic growth pattern consisting of an initial rapid
widening phase, an intermediate period of narrowing, and a secondary phase of rapid widening
along the suture (Figure 6-8, 10-12). With the same model applied to data collected from the
affected group, suture width at the interdigitating zone consisted of a slow widening phase
peaking between 20 and 45 days followed by dramatically reduced suture width with progression
of age (Figures 6-8). This suggests initial development of a patent suture may be present,
however, decreased growth rates as well as a plateauing of suture development may be observed.

36
This pattern was similarly described using amalgam markers to track separation of partial
synostosis coronal sutures (Mooney et al., 1994b).
An estimated 300 per 1 million babies born are affected with nonsyndromic
craniosynostosis, of which 24% involve the coronal suture (Cohen 1986). Nonsyndromic delayed
onset craniosynostosis was described in a human case study (Cohen et al., 1993) as well as in
association with Crouzon syndrome, Saethre-Chotzen syndrome, Pfeiffer syndrome, and other
syndromic cases (Rogers et al., 2015; Cohen, 2000c, Connolly et al., 2004, Hoefkens et al.,
2004). Though delayed-onset synostosis has been diagnosed in a small number of patients, it is
important to consider the potential for under reporting of affected individuals. Individuals with
delayed-onset craniosynostosis may only experience mild symptoms or even present as
asymptomatic if the process occurs following the cessation of major brain growth and
development.
Affected patients often present with intellectual development abnormalities, cosmetic and
anatomical defects, cognitive impairments, and elevated intracranial pressure (Connolly et al.,
2004, Scott et al., 2009). Surgical corrective measures and remodeling helmets, the gold standard
of treatment, are necessary to avoid dangerous risks associated with leaving a patient untreated
(Governale, 2015). However, the treatment itself is limited by complications of the surgery and
need for continual correction to relieve symptoms of elevated intracranial pressure (Jane et al.,
2015; Scott et al., 2009). The biochemical pathogenesis of suture fusion is not fully understood,
however, recent studies have made major strides in uncovering the roles of local tissue factors in
suture physiology and pathology (Cohen, 2000). For example, signaling from the dura mater has
37
been associated with regulating suture patency (Opperman et al., 1993, 1995). In affected rabbits,
dura mater cells showed abnormal rapid proliferation as well as associated increased influence of
bone cell differentiation (Cooper et al., 2012). Signaling cytokines groups secreted from the dura
mater, such as the Tgf-β family, have been explored for their role in suture fusion as well as
potential therapeutic uses. Injections of one isoform, TGF- β3, may have clinical applications as
therapy to rescue sutures in delayed onset craniosynostosis as well as delay reossification
following surgical correction of fused coronal sutures. (Chong et al., 2003; Gilbert et al., 2016).
In rabbits with delayed onset craniosynostosis associated elevation of TGF- β2 is also seen
(Cohen 2000; Poisson et al., 2004). An antagonistic suppression of TGF-β2 using neutralizing
antibodies also shows potential therapeutic application in preventing the progression of suture
fusion in delayed onset craniosynostosis (Mooney et al, 2016). Additionally, the role of bone
morphogenic protein in suture fusion has been investigated; one studied found a direct effect of
rhBMP-2 on coronal suture fusion (Kinsella et al., 2011).
To find other potential treatment options, further investigations of etiological factors and
the pathogenesis contributing to abnormal suture fusion must be performed. The progression of
suture fusion described in this study is similar to that described in prenatal suture fusion
(Mooney et al., 1996). Additional studies comparing the two phenotypic expressions (complete
and delayed onset) of non syndromic craniosynostosis should be conducted to determine if the
delay-onset variant serves as an adequate model for preterm suture fusion. The variations and
heterogeneity of the sutural morphology observed should also be explored for potential links and
commonalities for a more comprehensive understanding of the morphological events and
changes that occur during suture fusion in delayed onset of craniosynostosis.

38
APPENDIX A
T-VALUES
Table 13 t-values from all unpaired t-tests performed
t-values 5 10 25 31 45 88
IZ
Suture Width
Ectocortical -2.060 - -2.990 - -0.159 -2.580 Mesocortical -2.400 - -2.480 - -1.910 -2.960 Endocortical -1.870 - -2.640 - -2.140 -1.370
Total Suture Area -0.439 - -2.290 - -1.320 -1.950
MZ
Suture Width
Ectocortical 0.260 - -1.180 - 0.503 -4.070 Mesocortical -0.098 - -1.940 - 0.293 -2.390 Endocortical 0.369 - -1.270 - 0.109 -2.700
Total Suture Area 0.887 - -7.820 - 1.410 -5.204

39
BIBLIOGRAPHY
Chong, S.L., et al., Rescue of coronal suture fusion using transforming growth factor-beta 3 (Tgf-beta 3) in rabbits with delayed-onset craniosynostosis. Anat Rec A Discov Mol Cell Evol Biol, 2003. 274(2): p. 962-71.
Chumas, P.D., et al., Classification of previously unclassified cases of craniosynostosis. J Neurosurg, 1997. 86(2): p. 177-81.
Cohen, M. M., Jr. Epidemiology of craniosynostosis. In M. M. Cohen, Jr., and R. E. MacLean (Eds.), Craniosynostosis: Diagnosis, Evaluation, and Management. New York: Oxford University Press, 2000. Pp. 112–118.
Cohen, M. M., Jr. Sutural biology. In M. M. Cohen, Jr., and R. E. MacLean (Eds.), Craniosynostosis: Diagnosis, Evaluation,and Management. New York: Oxford University Press, 2000. Pp. 11–23.
Cohen, M. M., Jr. Sutural pathology. In M. M. Cohen, Jr., and R. E. MacLean (Eds.), Craniosynostosis: Diagnosis, Evaluation, and Management. New York: Oxford University Press, 2000. Pp. 95–99.
Cohen M.M., Jr. Sutural biology and the correlates of craniosynostosis. Am J Med Genet 1993; 47:581–616
Cohen SR, Dauser RC, Gorski JL. Insidious onset of familial craniosynostosis. The Cleft palate-craniofacial journal : official publication of the American Cleft Palate-Craniofacial Association. 1993;30(4):401-5.
Connolly, J.P., et al., Progressive postnatal craniosynostosis and increased intracranial pressure. Plast Reconstr Surg, 2004. 113(5): p. 1313-23.
Cooper, G. M., Durham E. L., Cray J. J., Siegel M. I., Losee J. E., and Mooney M. P., “Tissue interactions between craniosynostotic dura mater and bone,” Journal of Craniofacial Surgery, vol. 23, no. 3, pp. 919–924, 2012.
Cunningham, M., Heike, C., Evaluation of the infant with an abnormal skull shape. Current Opinion Pediatr, 2007. 19:645-651.
de Ribaupierre, S., et al., Frontosphenoidal synostosis: a rare cause of unilateral anterior plagiocephaly. Childs Nerv Syst, 2007. 23(12): p. 1431-8.

40
Francel, P.C., et al., Frontal plagiocephaly secondary to synostosis of the frontosphenoidal suture. Case report. J Neurosurg, 1995. 83(4): p. 733-6.
Gilbert, J., et al., Transforming Growth Factor-beta3 Therapy Delays Postoperative Reossification and Improves Craniofacial Growth in Craniosynostotic Rabbits. Cleft Palate Craniofac J, 2016. 53(2): p. 210-21.
Gilbert, J.R., et al., Genetic Homozygosity and Phenotypic Variability in Craniosynostotic Rabbits. Cleft Palate Craniofac J, 2016.
Governale, L.S., Craniosynostosis. Pediatr Neurol, 2015. 53(5): p. 394-401.
Graham J.M. Jr, Badura R.J., Smith D.W., Coronal craniostenosis: fetal head constraint as one possible cause. Pediatrics 1980; 65:995–999.
Greene, A.K., et al., Phenotypically unusual combined craniosynostoses: presentation and management. Plast Reconstr Surg, 2008. 122(3): p. 853-62.
Herring, S.W. Sutures and Craniosynostosis: A Comparative, Functional, and Evolutionary Perspective. In M. M. Cohen, Jr., and R. E. MacLean (Eds.), Craniosynostosis: Diagnosis, Evaluation,and Management. New York: Oxford University Press, 2000. Pp. 3–10.
Herring, S.W., Mechanical influences on suture development and patency. Front Oral Biol, 2008. 12: p. 41-56.
Hoefkens, M.F., C. Vermeij-Keers, and J.M. Vaandrager, Crouzon syndrome: phenotypic signs and symptoms of the postnatally expressed subtype. J Craniofac Surg, 2004. 15(2): p. 233-40; discussion 241-2.
Jane, J.A., Jr., M.D. Krieger, and J. Persing, Introduction: craniosynostosis: modern treatment strategies. Neurosurg Focus, 2015. 38(5): p. E1.
Johnson D, Wall SA, Mann S, Wilkie AO. A novel mutation, Ala315Ser, in FGFR2: a gene-environment interaction leading to craniosynostosis? Eur J Hum Genet 2000; 8:571–577.
Johnson D, Wilkie A.O., Craniosynostosis. Eur J Human Gen.2011; 19:369-376
Kinsella, C.R., Jr., et al., Recombinant human bone morphogenetic protein-2-induced craniosynostosis and growth restriction in the immature skeleton. Plast Reconstr Surg, 2011. 127(3): p. 1173-81.
Mooney M, Losken H, Tschakaloff A, Siegel M, Losken A, and Lalikos J (1993) Congenital bilateral coronal suture synostosis in a rabbit and craniofacial growth comparisons with experimental models. Cleft Palate-Craniofacial Journal 30:121-128.

41
Mooney, M.P., et al., Craniosynostosis with autosomal dominant transmission in New Zealand white rabbits. J Craniofac Genet Dev Biol, 1996. 16(1): p. 52-63.
Mooney, M.P., et al., Rescue of Premature Coronal Suture Fusion With TGF-beta2 Neutralizing Antibody in Rabbits With Delayed-Onset Synostosis. Cleft Palate Craniofac J, 2016.
Mooney M, Siegel M, Burrows A, Smith T, Losken H, Dechant J, Cooper G, and Kapucu M (1998) A rabbit model of human familial, nonsyndromic unicoronal suture synostosis. Part I: Synostotic onset, pathology, and sutural growth patterns. Child's Nervous System 14:236-246
Mooney M, Losken H, Siegel M, Lalikos J, Losken A, Burrows A, and Smith T (1994a) Development of a strain of rabbits with congenital simple, nonsyndromic coronal suture synostosis. Part I: Breeding demographics, inheritance pattern, and craniofacial anomalies. Cleft Palate-Craniofacial Journal 31:1-7
Mooney M, Losken H, Siegel M, Lalikos J, Losken A, Burrows A, and Smith T (1994b) Development of a strain of rabbits with congenital simple, nonsyndromic coronal suture synostosis. Part II: Somatic and craniofacial growth patterns. Cleft Palate-Craniofacial Journal 31:8-16
Mooney, M.P., Reed, J.C., Kovacik M.E., Barbano, T., Cooper, G.M., Losee, J.E., Siegel, M.I. Dural track morphology in rabbits with premature coronal suture fusion. J. Dental Research, 2007: 86, Special Issue A; 762.
Mooney MP, Smith TD, Burrows AM, et al. Coronal suture pathology and synostotic progression in rabbits with congenital craniosynostosis. Cleft Palate Craniofac J 1996;33:369Y378
Opperman, L.A., et al., Cranial sutures require tissue interactions with dura mater to resist osseous obliteration in vitro. J Bone Miner Res, 1995. 10(12): p. 1978-87.
Opperman, L.A., et al., Tissue interactions with underlying dura mater inhibit osseous obliteration of developing cranial sutures. Dev Dyn, 1993. 198(4): p. 312-22.
Poisson, E., Sciote, J. J., Koepsel, R., Cooper, G. M., Opper- man, L. A., and Mooney, M. P. Transforming growth factor- beta isoform expression in the perisutural tissues of cranio- synostotic rabbits. Cleft Palate Craniofac. J. 41: 392, 2004. Reardon W, Wilkes D, Rutland P, et al. Craniosynostosis associated with FGFR3pro250arg
mutation results in a range of clinical presentations including unisutural sporadic craniosynostosis. J Med Genet 1997; 34:632– 636.
Reddy K, Hoffman H, Armstrong D. Delayed and progressive multiple suture craniosynostosis. Neurosurgery. 1990;26(3):442-8.

42
Reed, J.C., Kovacik, M.E., Barbano T.E., Siegel, M.I., Mooney, M.P. Polarized light microscopy of the dural tracks underlying prematurely synostosed coronal sutures in New Zealand white rabbits. Amer. J. of Physical Anthropologists, 2007; Supplement 44: 196.
Renier D, El-Ghouzzi V, Bonaventure J, et al. Fibroblast growth factor receptor 3 mutation in nonsyndromic coronal synostosis: clinical spectrum, prevalence, and surgical outcome. J Neurosurg 2000; 92:631–636.
Rogers, G.F., et al., Progressive Postnatal Pansynostosis. Cleft Palate Craniofac J, 2015. 52(6): p. 751-7.
Seto ML, Hing AV, Chang J, et al. Isolated sagittal and coronal craniosynos- tosis associated with TWIST box mutations. Am J Med Genet A 2007; 143:678 – 686.
Scott, J.R., et al., Symptom outcomes following cranial vault expansion for craniosynostosis in children older than 2 years. Plast Reconstr Surg, 2009. 123(1): p. 289-97; discussion 298-9.