coronavirus job retention scheme: awareness, understanding
TRANSCRIPT

CJRS awareness, understanding and customer experience 1
OFFICIAL
Research report 595
Coronavirus Job Retention Scheme: awareness, understanding and customer experience surveys
Quantitative research with employees and employers
October 2020

CJRS awareness, understanding and customer experience
OFFICIAL
Disclaimer: The views in this report are the authors’ own and do not necessarily reflect those of HM Revenue & Customs. © Crown Copyright 2020 Copyright in the material, typographical arrangement and design rests with the Crown. This publication may be re-used free of charge in any format or medium, and provided that it is reproduced accurately and not used in misleading context, under the terms of the Open Government Licence (OGL) www.nationalarchives.gov.uk/doc/open-government-licence/version/3/. The material must be acknowledged with the title and source of the publication specified. Published by HM Revenue and Customs, {month} 2020 www.hmrc.gov.uk

CJRS awareness, understanding and customer experience
OFFICIAL
Contents Introduction .................................................................................................................. 1
Background .......................................................................................... 1
Research aims ...................................................................................... 1
Method and sample .............................................................................. 1
Interpretation of findings ....................................................................... 4
Impact of coronavirus .................................................................................................. 5
Trading status ....................................................................................... 5
Impact on sales and trade ..................................................................... 5
Actions taken in response to coronavirus .............................................. 7
CJRS knowledge and information .............................................................................. 9
Knowledge of CJRS .............................................................................. 9
Actions taken by employers ................................................................ 10
Information sources ............................................................................ 11
Applications made to CJRS ...................................................................................... 14
Applications made to CJRS ................................................................ 14
Receipt of CJRS funds ........................................................................ 15
Knowledge and understanding of CJRS and planned future use of the scheme . 16
Knowledge of CJRS ............................................................................ 16
Future applications for CJRS .............................................................. 18
Future plans to furlough staff .............................................................. 19
Other measures planned in response to coronavirus .......................... 20
Bringing workers back from furlough ................................................... 21
Customer experience of CJRS .................................................................................. 23
Contacting HMRC ............................................................................... 23
Resolving customer queries ................................................................ 25
Applying for CJRS and receiving the funds ......................................... 25
Clarity of the application process ........................................................ 26
Employees’ knowledge and understanding of CJRS .............................................. 28

CJRS awareness, understanding and customer experience
OFFICIAL
Reported impact on employees’ organisations .................................... 28
Impact on employees .......................................................................... 29
Awareness of CJRS ............................................................................ 31
Confidence in being eligible for CJRS ................................................. 31
Actions taken by employees ............................................................... 32
Information sources ............................................................................ 33
Knowledge of CJRS ............................................................................ 33
Appendix – Technical Approach ............................................................................... 36
Sample design .................................................................................... 36
Fieldwork ............................................................................................ 37
Data Processing and weighting ........................................................... 38
Statistical reliability ............................................................................. 39

CJRS awareness, understanding and customer experience
OFFICIAL
Glossary and abbreviations Term Definition Affected by coronavirus
Employers were asked about the impact of coronavirus on their sales and trade. We refer to those who reported having ‘no trade currently’, ‘a little less sales and trade’ or ‘a lot less sales and trade’ as being ‘more affected by coronavirus’. Those who reported ‘no impact’, ‘a little more sales and trade’ or ‘a lot more sales and trade’ are referred to as being the ‘least affected by coronavirus’.
Agriculture, Extraction & Utilities
Throughout the report, this group combines the following sectors: Agriculture, Forestry and Fishing; Mining and Quarrying; Electricity, Gas, Steam and Air Conditioning Supply; Water Supply, Sewerage, Waste Management and Remediation Activities.
CJRS Coronavirus Job Retention Scheme. This was launched in April and aims to support employers affected by the coronavirus pandemic. The scheme initially offered firms the opportunity to apply for a grant equivalent to up to 80% of employee wages for all employees who were furloughed as a result of coronavirus.
Furlough Furlough is a temporary leave of absence from work. Employers who put employees on furlough as a result of coronavirus were entitled to claim for a proportion of their wages through CJRS.
Medium and large employers
Medium organisations have 50 to 249 employees and large organisations have 250 or more employees. For reporting purposes, we have combined medium and large employers.
Micro employer An organisation with 1 to 9 employees.
Professional and Technical Services
Throughout the report, this group combines the following sectors: Financial and Insurance Activities; Real Estate Activities; Professional Scientific and Technical Activities; and Administrative and Support Service Activities.
Public and Other Services
Throughout the report, this group combines the following sectors: Education; Human Health and Social Work Activities; Arts, Entertainment and Recreation; and Other Service Activities. Public bodies are not included as they were excluded from this research.
Retail and Hospitality Throughout the report, this group combines the following sectors: Wholesale and Retail Trade; Repair of Motor Vehicles and Motorcycles; and Accommodation and Food Service Activities.
Small employer An organisation with 10 to 49 employees.
Transport and Communications
Throughout the report, this group combines the following sectors: Transport and Storage; and Information and Communications.

CJRS awareness, understanding and customer experience
OFFICIAL
Executive Summary Background The Coronavirus Job Retention Scheme (CJRS) was launched in April and aims to support employers affected by the coronavirus pandemic. The scheme initially offered firms the opportunity to apply for a grant equivalent of up to 80% of wages (up to a maximum of £2,500 a month) for all employees who were furloughed as a result of coronavirus. This report presents findings from two waves of employer research and one wave of employee research. The surveys were conducted online by Ipsos MORI between 16-19 April 2020 (wave 1 employer survey and employee survey) and 21-31 May 2020 (wave 2 employer survey). The research conducted in April was designed to examine awareness and understanding of CJRS amongst employees and employers, just before the scheme opened for applications. The later research with employers in May was designed to examine customer experience of applying for CJRS, once the scheme was open, and awareness of future changes to the scheme.
Interpretation of these findings The employer surveys were conducted using sample from publicly-available commercial databases and the employee survey was conducted using Ipsos MORI’s online omnibus survey. Please note that due to the sampling approach possible in the time available, the findings and any differences between sub-groups reported here are indicative; they describe the views and experiences of those surveyed and are not representative of the overall population of employers who are eligible for CJRS. More detail on this can be found in Chapter 1 of the main report.
The impact of coronavirus on employers surveyed Just under half (47%) of employers surveyed said they were actively trading at wave 1, and 62% at wave 2. Just under nine in ten employers (88%) reported that coronavirus had negatively impacted their sales and trade at wave 2. Just over nine in ten employers (92%) expected coronavirus to have a negative impact on their sales and trade over the next four weeks at wave 1. By wave 2 employers’ outlook had improved, with this figure decreasing to just under eight in ten (78%). Furloughing staff was the most common action taken by employers in response to coronavirus, with just under three-quarters (72%) doing this at wave 2.

CJRS awareness, understanding and customer experience
OFFICIAL
Taking other staffing-related measures in response to coronavirus was relatively less common; at wave 2 just over two in ten (22%) employers had reduced the number of hours staff worked, and one in ten (9%) had asked staff to take a pay cut. Fewer still had asked staff to take unpaid leave, reduced staff benefits such as pensions or medical insurance, or made staff redundant.
Employer knowledge of CJRS and information sources At wave 1, employers reported near universal awareness of CJRS (99%). Most felt they knew ‘a fair amount’ or ‘a great deal’ about the scheme, with 84% saying this at wave 1 and 88% at wave 2. There was also near universal awareness of the fundamentals of the scheme, with 98% aware of the amount of wage costs covered by CJRS at wave 1. Levels of knowledge about some specifics of the scheme, such as the eligibility of particular groups of workers, were lower. Chapter 5 provides more detail on this. Awareness of changes to the scheme at wave 2 were high, with eight in ten (80%) aware employers would be able to bring furloughed workers back to work part-time from August. At both waves, those who had been most affected by coronavirus reported higher levels of knowledge of the scheme, suggesting that employers most in need of support had either looked for information themselves, or received the information they needed.
Sources of information on CJRS for employers HMRC webpages on GOV.UK were the most frequent source of information on CJRS, mentioned by 68% of employers who had heard of the scheme at wave 1, and 74% at wave 2. After these, an email from HMRC (mentioned by 46% at wave 2) and the general media (mentioned by 39% at wave 2) were the most frequent information sources. The proportion of employers who had heard of the CJRS and had contacted HMRC about the scheme rose substantially between wave 1 (7%) and wave 2 (44%). At wave 2, medium and large employers (68%), those reporting ‘no trade’ (56%) and those who had already furloughed staff and planned to furlough more (61%) were more likely to have contacted HMRC.
Applications for the CJRS and employer experience of applying At wave 2, almost six in ten employers reported applying for CJRS (57%), with applications more common amongst employers who had been negatively affected by coronavirus. Three-quarters (74%) had received some or all of the funds applied for.

CJRS awareness, understanding and customer experience
OFFICIAL
Employers were split evenly between those who had submitted or intended to submit future applications for CJRS directly (48%), or through an agent (49%). Medium and large employers were more likely to have applied / intended to apply directly (84%), compared with 64% of small employers and 43% of micro employers. Employers who had applied for CJRS in the wave 2 survey were largely positive about their experience:
• Almost nine in ten (86%) of those applying directly rated their overall experience positively;
• Around eight in ten (79%) of those applying directly found the overall process fairly or very easy;
• Three-quarters of employers agreed HMRC made the steps in the application process clear (75%);
• Most employers agreed HMRC made it clear when their application had been submitted (90%) and when funds would be received (80%).
Crucially, given the aim of the scheme to provide employers with financial support in a timely manner, almost all employers surveyed who had received some or all of the funds they had applied for were satisfied with the time taken to receive them (94%, with 77% giving the top rating of ‘very satisfied’). Three-quarters (75%) of employers who had contacted HMRC about CJRS said they were ‘very’ or ‘fairly’ good’ at resolving their issue. One in ten (10%) said HMRC had been poor at this. The remainder said HMRC were neither good nor poor, or were unsure.
Employee understanding and awareness of CJRS
Employees were surveyed between 16-19 April, before CJRS opened to applications from employers on 20 April. Around four in ten (41%) reported their employer had stopped trading due to coronavirus, and almost six in ten (57%) said their employer was experiencing reduced sales and trade. Just over a third (35%) said they had been placed on furlough. The vast majority (88%) of employees were aware of CJRS. Knowledge of specific aspects of the scheme was variable, with most employees knowing the amount of wages covered by the scheme (85%). Awareness of more detailed aspects of the scheme, such as specific groups of employees covered, was lower. A majority of employees (63%) had sought or received information on the scheme from at least one source. HMRC webpages on GOV.UK (26%) and employers/trade unions (24%) were the most common sources of information, closely followed by the media (22%).

CJRS awareness, understanding and customer experience 1
OFFICIAL
Introduction
Background
The Coronavirus Job Retention Scheme (CJRS) was launched in April 2020 and aims to support employers affected by the coronavirus pandemic. The scheme initially offered firms the opportunity to apply for a grant equivalent of up to 80% of wages (up to a maximum of £2,500 a month) for employees who were furloughed as a result of coronavirus. The scheme was launched in April 2020 and was closed to new entrants on 30 June 2020. Changes were introduced from 1 July, allowing employers to bring furloughed employees back to work part-time, whilst claiming for part of their wages under CJRS. This ‘flexible furlough scheme’ was designed to help employers transition off CJRS. At the time of writing the scheme is planned to run until the end of October 2020.
Research aims
The purpose of this research was to examine awareness and understanding of CJRS amongst employees and employers, and employers’ experiences of applying to the scheme. The research included two survey waves with employers, with wave 1 fieldwork completed before the CJRS opened for applications on 20 April, and wave 2 fieldwork taking place after applications had opened. Findings were used as follows:
• The findings from the wave 1 survey on awareness and understanding of CJRS were used by HMRC to support communications strategy and implementation.
• The findings from the wave 2 survey were used by HMRC to understand the overall experience of customers applying for CJRS, and awareness of changes to the scheme.
One survey wave with employees was also conducted, using Ipsos MORI’s online omnibus. The research aimed to help HMRC understand employee perceptions and knowledge of the CJRS scheme, before it opened. The findings from this survey are reported in Chapter 7 of this report. HMRC also commissioned Ipsos MORI to conduct qualitative research with employers and agents to understand their experiences of applying for the Coronavirus Job Retention Scheme. This will be published in a separate report.
Method and sample
The research with employers and employees on CJRS was undertaken by Ipsos MORI’s Social Research Institute. An online survey and using Ipsos MORI’s online omnibus were deemed to be the most effective and efficient ways of reaching employers eligible for CJRS and employees during the pandemic. Given that many employers would have shut their premises, contacting employers via email was expected to be more successful than contacting them via a landline

CJRS awareness, understanding and customer experience 2
OFFICIAL
telephone number. Using online surveys also enabled the findings to be reported to HMRC in a much shorter timeframe than other methods would have allowed. Further technical information on both the employer surveys and the employee survey is provided below and in the Appendix.
The employer surveys
A random sample was drawn from a publicly-available commercial database of organisations, which covered some but not all employers. The target population were UK employers (with at least one employee), who were eligible for CJRS. The employer sample was proportionately stratified by region, and disproportionately stratified by size and sector. An entirely proportionately stratified sample would not have allowed sufficient subgroup analysis by size (e.g. medium and large employers) and certain sectors. Findings were weighted using the Business Population Estimates published by the Department for Business, Energy and Industrial Strategy1 to reflect the profile of UK employers by size (number of employees), sector and region. The sample was not designed to reflect the UK employer population by legal status. This meant that charitable organisations, whilst included in the research, were not proportionately sampled and the findings for charities should therefore be treated as indicative. We have therefore not reported on charities as a separate subgroup, but they are included in the overall results. For details of the proportion of respondents that were charities, please see Table A.1 in the Appendix. Sole traders who have employees are eligible for CJRS. This group was not included in the survey due to time restrictions on sourcing a reliable sample frame. We estimate this amounts to 15% of all employers eligible for the furlough scheme. Public sector employers were deliberately excluded from the sample as, at the time the survey was designed, they were not expected to take up the scheme in great numbers. Organisations who had permanently stopped trading due to the pandemic, and organisations that had temporarily or permanently stopped trading due to reasons other than coronavirus, were also excluded. As a result of these sampling parameters, the findings reported here are indicative; they are not representative of the overall population who are eligible for CJRS. Each employer received one invitation email for the survey and two separate reminders to complete it. The invitation specified that someone with responsibility for, and involvement in, decisions about the organisation’s finances and staffing should complete the survey. Emails were sent to personal (named) email addresses where one was available, or to a generic company email where a personal address was not available.
1 see https://www.gov.uk/government/statistics/business-population-estimates-2020

CJRS awareness, understanding and customer experience 3
OFFICIAL
The research consisted of two survey waves:
• Wave 1 fieldwork, 16-19 April 2020 (CJRS opened for applications on 20 April). There were 1,027 completes.
• Wave 2 fieldwork, 21-31 May 2020. There were 3,708 completes. The sample size was expanded for the second wave to allow for improved subgroup comparisons by organisation size and sector.
Table 1.1: Sample profile across waves 1 and 22 Unweighted Weighted Wave 1 Wave 2 Both waves
Size (number of employees)
Micro (1-9 employees) 445 (43%) 1,516 (41%) 82%
Small (10-49 employees) 403 (39%) 1,443 (39%) 15%
Medium and large (50+ employees) 179 (17%) 749 (20%) 3%
Sector Manufacturing 108 (11%) 444 (12%) 6%
Construction 141(14%) 316 (9%) 13%
Professional and Technical Services 297 (29%) 1,106 (30%) 28%
Retail and Hospitality 219 (21%) 645 (17%) 27%
Public and Other Services 119 (12%) 636 (17%) 12%
Transport and Communications 128 (12%) 465 (13%) 10%
Agriculture, Extraction & Utilities 15 (1%) 96 (3%) 4%
Region North, Northern Ireland and Scotland 265 (26%) 1,020 (28%) 30%
Midlands and Wales 323 (31%) 1,155 (31%) 29%
South 439 (43%) 1,533 (41%) 41%
The employee survey
The survey of employees was conducted via Ipsos MORI’s online omnibus, with quotas and weighting set to reflect the profile of the UK population. Respondents were drawn from Ipsos MORI’s dedicated Online Access Panel, a panel of people who have agreed to take part in research studies. The survey took place between 16-19 April 2020 – just before the scheme opened for applications from employers on 20 April – with 1,026 interviews among employees. At the beginning of the survey, screening questions identified whether the respondent was paid through pay as you earn (PAYE) and therefore potentially eligible for CJRS. Weighting was applied following completion of the survey to ensure the data reflected the profile of the UK population in terms of age, gender and region.
2 Certain firmographic categories were combined (for example, medium and large, and certain sectors) as individual sample sizes in wave 1 were too small to support robust subgroup analysis. The sample size was increased for wave 2 to ensure individual subgroup comparisons were possible.

CJRS awareness, understanding and customer experience 4
OFFICIAL
Table 1.2: Sample profile of employees Description Unweighted Weighted Gender Male 535 48%
Female 485 51%
Age 16-35 460 41%
36-54 434 44%
55+ 132 15%
Region North, Northern Ireland and Scotland 328 34%
Midlands and Wales 331 32%
South 367 34%
Interpretation of findings
This report draws on both wave 1 and wave 2 data for employers, making comparisons between the two waves where appropriate. However, many questions differed between waves due to the shift in focus at wave 2 to customer experience of those applying for CJRS, which opened for applications after wave 1 fieldwork concluded. There was only one wave of fieldwork for employees and this took place before CJRS opened for applications. As mentioned in Section 1.3, the sampling constraints in the time available to set the survey up mean findings cannot be generalised to all employers. All references to employers in the report refer only to the group of employers who participated in the survey. The survey results are subject to some uncertainty, which varies with the size of the sample and the percentage figure concerned. Due to the nature of the sample, any differences between subgroups mentioned in the report have at least a 10 percentage point difference between each group, as well as a base size sufficient to allow comparisons3. Please note that differences between subgroups (within waves) and differences between subgroups and the total (within waves) should again be treated with caution if they are less than 10 percentage points different. Due to the relatively small sample sizes for certain sectors, these have been grouped with other similar sectors for more robust analysis. Responses for medium and large employers have been combined because the sample size for large employers was too low for separate analysis. As sole traders with employees were not included in the sample, any comparisons by employer size should be treated with caution. Where figures in charts do not add to 100%, or to an associated net score, this is due to rounding of percentages, or because the question allowed more than one response.
3 All sub-group comparisons reported on are based on a minimum sample size of 100 interviews.

CJRS awareness, understanding and customer experience 5
OFFICIAL
Impact of coronavirus
Key findings
• The proportion of employers in the survey who were actively trading was 47% in wave 1, and 62% in wave 2.
• Just under nine in ten employers (88%) reported that coronavirus had negatively impacted their sales and trade at wave 2.
• Compared to wave 1, fewer employers at wave 2 expected coronavirus to negatively affect their trade in the next four weeks (92% compared with 78%).
• Furloughing staff was the most common action taken in response to coronavirus, with 72% of employers doing this at wave 2.
Trading status
Employers were asked about the current trading status of their organisation and whether coronavirus had affected this. At the time of wave 1 fieldwork, just under half of employers (47%) were actively trading. At wave 2, just over six in ten (62%) were actively trading. Table 2.1: Trading status Wave 1 Wave 2 Actively trading 47% 62%
Temporarily stopped trading – plan to reopen 46% 34%
Temporarily stopped trading – not sure if will reopen 7% 5% Q: Which of the following best describes your organisation currently? Base (unweighted) All employers at wave 1 (1,027) and wave 2 (3,708).
Impact on sales and trade
Current impact of coronavirus on sales and trade
Employers were asked whether coronavirus had affected the amount of sales and trade their organisation had at the time of the survey. The proportion of employers reporting that coronavirus had negatively impacted their sales and trade remained broadly in line between wave 1 (91%) and wave 2 (88%). However, the extent of the impact of coronavirus had lessened slightly, as 38% of employers said they had ‘no sales or trade’ at wave 1, compared to 27% of employers at wave 2 (Figure 2.1, overleaf).

CJRS awareness, understanding and customer experience 6
OFFICIAL
Figure 2.1: Impact of coronavirus on sales and trade
Q: What impact, if any, has coronavirus had on the amount of sales and trade your business or organisation has currently?
2
2
3
3
6
4
14
12
47
41
27
38
Wave 2 (%)
Wave 1 (%)
A lot more sales A little more sales No impact
A little less sales A lot less sales No trade currently
91%
88%
NET: A lot / a little less
trade / no trade
Base (unweighted): All employers in Wave 1 (1,027), all employers in Wave 2 (3,708).
Anticipated impact of coronavirus on sales and trade in the next four weeks
Employers were also asked about the impact they expected coronavirus to have over the next four weeks. Employers had a less negative outlook about how coronavirus would affect their sales and trade in the next four weeks at wave 2 than at wave 1. Whilst just over nine in ten employers (92%) expected a negative impact at wave 1, this had fallen to just under eight in ten (78%) at wave 2. The proportion saying they expected to have ‘no sales or trade’ at all was 20%, down from 40% at wave 1.
Figure 2.2: Anticipated impact of coronavirus
Q: What impact, if any, do you expect coronavirus to have on the amount of sales and trade your business or organisation has over the next four weeks?
1
1
8
2
10
5
15
11
42
41
20
40
Wave 2 (%)
Wave 1 (%)
A lot more sales A little more sales No impact
A little less sales A lot less sales No trade
92%
78%
NET: A lot / a little less
trade / no trade
Base (unweighted): All employers at wave 1 (1, 027) and wave 2 (3,708).

CJRS awareness, understanding and customer experience 7
OFFICIAL
Actions taken in response to coronavirus
Employers were asked whether they had taken any staffing-related actions in response to coronavirus, including placing staff on furlough or unpaid leave, reducing hours, pay or benefits, or making staff redundant. Placing staff on furlough was by far the most common course of action at both waves of the survey. Figure 2.3: Actions taken in response to coronavirus Q: Which, if any, of the following have you already done in response to coronavirus, either for all or some of your staff?
73%
24%
10%5% 4% 4%
72%
22%
9%3% 6% 4%
Placed staff onfurlough
For staff continuingto work, reducednumber of hours
worked
For staff continuingto work, asked staff
to take a pay cut
Asked staff to takeunpaid leave
Reduced staffbenefits (e.g.
pensions, medicalinsurance)
Made staffredundant
Wave 1 Wave 2
Base (unweighted): All employers in Wave 1 (1,027), all employers in Wave 2 (3,708). Responses do not sum to 100% as this was a multicoded question.
Placing staff on furlough
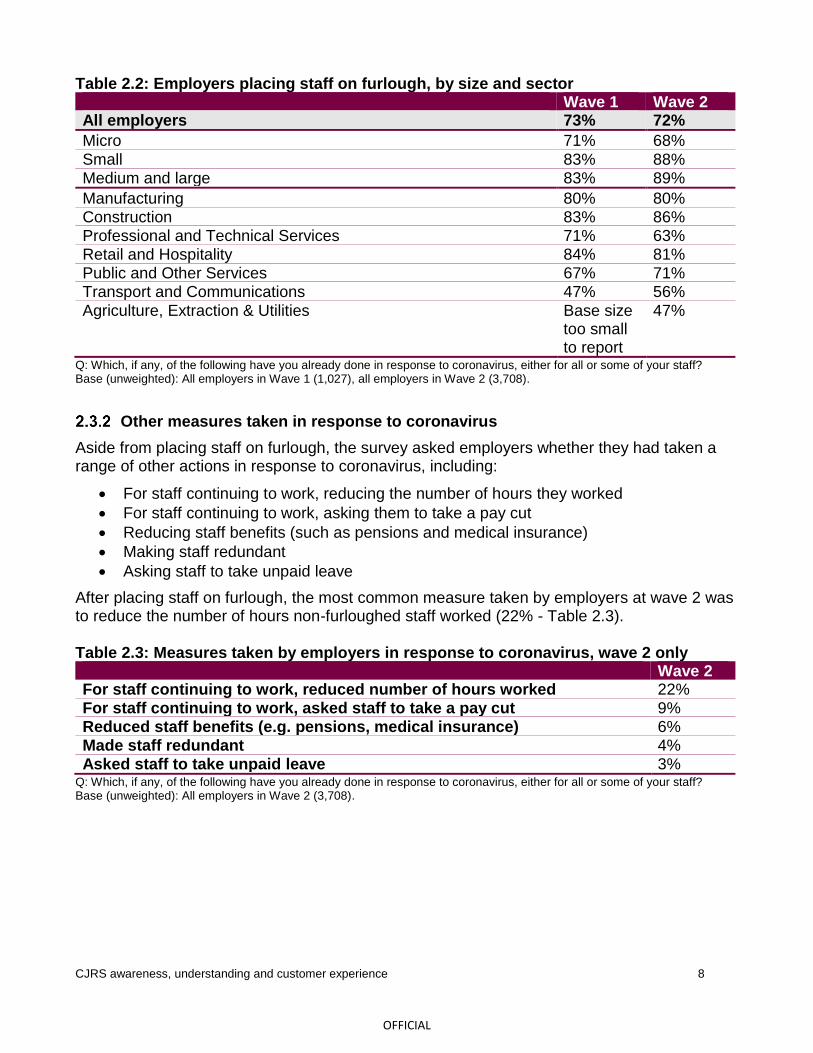
Across both waves, small (wave 1: 83%; wave 2: 88%) and medium and large employers (wave 1: 83%; wave 2: 89%) were more likely than micro employers (wave 1: 71%; wave 2: 68%) to have placed employees on furlough (Table 2.2, overleaf). Furloughing employees was also more common at both waves in Construction (wave 1: 83%; wave 2: 86%) and at wave 1 for Retail and Hospitality (84%).
CJRS awareness, understanding and customer experience 8
OFFICIAL
Table 2.2: Employers placing staff on furlough, by size and sector Wave 1 Wave 2 All employers 73% 72%
Micro 71% 68%
Small 83% 88% Medium and large 83% 89%
Manufacturing 80% 80% Construction 83% 86% Professional and Technical Services 71% 63% Retail and Hospitality 84% 81% Public and Other Services 67% 71% Transport and Communications 47% 56%
Agriculture, Extraction & Utilities Base size too small to report
47%
Q: Which, if any, of the following have you already done in response to coronavirus, either for all or some of your staff? Base (unweighted): All employers in Wave 1 (1,027), all employers in Wave 2 (3,708).
Other measures taken in response to coronavirus
Aside from placing staff on furlough, the survey asked employers whether they had taken a range of other actions in response to coronavirus, including:
• For staff continuing to work, reducing the number of hours they worked
• For staff continuing to work, asking them to take a pay cut
• Reducing staff benefits (such as pensions and medical insurance)
• Making staff redundant
• Asking staff to take unpaid leave
After placing staff on furlough, the most common measure taken by employers at wave 2 was to reduce the number of hours non-furloughed staff worked (22% - Table 2.3). Table 2.3: Measures taken by employers in response to coronavirus, wave 2 only Wave 2 For staff continuing to work, reduced number of hours worked 22% For staff continuing to work, asked staff to take a pay cut 9% Reduced staff benefits (e.g. pensions, medical insurance) 6% Made staff redundant 4% Asked staff to take unpaid leave 3%
Q: Which, if any, of the following have you already done in response to coronavirus, either for all or some of your staff? Base (unweighted): All employers in Wave 2 (3,708).

CJRS awareness, understanding and customer experience 9
OFFICIAL
CJRS knowledge and information
Key findings
• At wave 1, employers reported near universal awareness of CJRS (99%). Most employers said they knew at least ‘a fair amount’ about CJRS, with 84% saying this at wave 1 and 88% at wave 2.
• By wave 2, eight in ten employers (81%) had checked their eligibility for the scheme, and three-quarters (75%) had discussed it with their staff.
• HMRC webpages on GOV.UK were the most common source of information about CJRS at both wave 1 (68%) and wave 2 (74%), amongst employers who had heard about the scheme.
Knowledge of CJRS
At wave 1, which took place before applications for CJRS had opened, employers were asked whether they were aware of the scheme. They were provided with the following description:
‘Under this scheme, the government will pay part of the wages of any workers temporarily asked to stop working and placed on leave due to the impact of coronavirus on their employer. This is known as being placed on furlough, so staff aren’t made redundant’.
At wave 1, employers reported near universal awareness of CJRS, with 99% of employers saying they were aware of the scheme. At both waves, employers were asked how much they felt they knew about CJRS. Most employers said they knew ‘a great deal’ or ‘a fair amount’ about CJRS - 84% at wave 1 and 88% at wave 2. Figure 3.1: Employers’ knowledge of CJRS Q: How much, if anything, do you feel you know about the Coronavirus Job Retention Scheme?
24%
60%
15%
1%
25%
62%
10%1%
A great deal A fair amount Not very much Nothing at all
Wave 1 Wave 2
Net: Know a great deal / fair amount
Wave 1: 84% / Wave 2: 88%
Base (unweighted): All employers in wave 1 (1,027) and wave 2 (3,708). At both waves, the figure for ‘not sure’ was greater than zero but less than one per cent. At wave 2, employers could also select ‘I have not heard of the Coronavirus Job Retention Scheme’; this figure was greater than zero but less than one per cent.

CJRS awareness, understanding and customer experience 10
OFFICIAL
At both waves, those who had been most affected by coronavirus reported higher levels of knowledge of the scheme (see Section 5.1 for more detail on employers’ understanding of the scheme’s rules). At wave 2, medium and large employers (43%) were more likely to report knowing ‘a great deal’ about the scheme than small employers (33%), who were in turn more likely than micro employers (23%).
Actions taken by employers
Employers who were aware of CJRS were asked about any actions they had taken or planned to take in relation to the scheme. At least six in ten employers had already checked their eligibility, discussed or shared information on the scheme with staff or discussed the scheme with their agent at wave 1. The proportions who had checked their eligibility or shared information with staff increased at wave 2.The numbers of employers still planning to undertake these actions fell sharply from wave 1 to wave 2. Table 3.1: Actions already taken and those planned in relation to CJRS
Have done Planned to W1 W2 W1 W2
Checked if your organisation is eligible for the scheme 61% 81% 38% 4%
Discussed/shared information on the scheme with staff 67% 75% 46% 4% Discussed the scheme with your tax agent 64% 65% 50% 8% Checked what support you could claim in the future n/a 61% n/a 20% Looked for information on when the scheme ends n/a 59% n/a 17% Contacted HMRC about the scheme 7% 44% 31% 4%
Q: Which, if any, of the following have you already done/plan to do in relation to CJRS? Base (unweighted): All employers who were aware of CJRS in Wave 1 (1,021) and Wave 2 (3,648).
There was an increase in the proportion of employers who noted they had contacted HMRC about the scheme, rising from seven per cent in wave 1 to 44% in wave 2. At both waves, medium and large employers (wave 1: 25%; wave 2: 68%) were more likely than small employers (wave 1: 14%; wave 2: 59%) to have contacted HMRC. Micro employers were less likely than both medium and large and small employers to have done so (wave 1: 5%; wave 2: 41%). At wave 2, medium and large employers (93%) and small (91%) employers were more likely than micro employers (79%) to have checked eligibility for the scheme and shared information with staff (87%, 84% and 73% respectively). Across both waves, employers who had already furloughed staff were more likely to have checked their eligibility, discussed the scheme with staff and have discussed the scheme with an agent.

CJRS awareness, understanding and customer experience 11
OFFICIAL
Table 3.2: Actions taken by whether they had furloughed staff Wave 1 Wave 2 Checked if your organisation is eligible for the scheme (overall) 61% 81%
Furloughed staff already, no more planned 72% 93%
Furloughed staff already, more planned 67% 94%
Discussed/shared information on the scheme with staff (overall) 67% 75%
Furloughed staff already, no more planned 85% 89% Furloughed staff already, more planned 81% 93%
Discussed the scheme with your tax agent (overall) 64% 65%
Furloughed staff already, no more planned 65% 71% Furloughed staff already, more planned 73% 76%
Q: Which, if any, of the following have you already done in relation to CJRS? Base (unweighted): All employers who had heard of CJRS in Wave 1 (1,021) and Wave 2 (3,648).
At wave 2, employers who had submitted an application for CJRS were more likely to note they had taken the actions asked about, including discussing or sharing information on the scheme with staff (93% compared to 50% of employers who had not applied). Almost all who had applied to the scheme said they had checked eligibility (96% compared to 81% overall). At wave 2, employers who submitted a CJRS application themselves (rather than through an agent) were more likely to have undertaken most of the actions themselves, particularly contacting HMRC (69% versus 49% who submitted via an agent). Employers who submitted their application themselves were less likely to have discussed it with an agent (60%) than those who submitted through an agent (90%).
Information sources
The HMRC webpages on GOV.UK were the most common source of information for employers who had heard of CJRS at both waves, with 74% of all employers using them at wave 2. Other common sources of information were emails from HMRC, general media and talking to other employers, as shown in Figure 3.2 (overleaf).

CJRS awareness, understanding and customer experience 12
OFFICIAL
Figure 3.2: Sources of information about CJRS Q: Have you looked for or received information on CJRS from any of the following sources? (Top nine mentioned only from waves 1 and 2)
68%
44%40% 39%
31%27% 26% 25%
21%
74%
46%
39%36%
31%
25% 26% 27%
20%
Wave 1 Wave 2
Local
authority
website
Other pages
on GOV.UK
Trade
Association/
Chamber of
Commerce
Finance/
business
websites
Govt
Business
Support
website
General
media
Talking to
other
employers
Email from
HMRC
HMRC
webpages
on GOV.UK
Base (unweighted): All employers who had heard of CJRS at wave 1 (1,021) and wave 2 (3,648). Responses do not sum to 100% as this was a multicoded question.
There were no clear patterns by size, sector or impact of coronavirus in terms of which employers looked for or received information on CJRS in the form of HMRC emails or from local authority websites. For the remaining seven information sources shown in Figure 3.2 above, in wave 1 medium and large and small employers were more likely to have accessed information from these sources than micro employers., There was a similar pattern in wave 2, although medium and large companies were more likely to use general media than both small and micro companies. Employers who had heard of CJRS were also asked whether they planned to look for (further) information on the scheme from the same range of sources (Figure 3.3, overleaf). Again, HMRC webpages on GOV.UK were most commonly mentioned here (57% of employers at wave 2).

CJRS awareness, understanding and customer experience 13
OFFICIAL
Figure 3.3: Sources of information on CJRS that employers planned to consult Q: Do you plan to look for (further) information on CJRS from any of the following sources? (Top nine mentioned only from waves 1 and 2)
58%
26%21%
18% 16% 15%12% 11% 10%
57%
22% 22%19%
13% 15% 17%13% 11%
Wave 1 Wave 2
Local
authority
website
Finance/
business
websites
Trade
Association/
Chamber of
Commerce
General
media
HMRC
Business
Tax
Account
Other
pages on
GOV.UK
Talking to
other
employers
Govt
Business
Support
website
HMRC
webpages
on GOV.UK
Base (unweighted): All employers who had heard of CJRS at wave 1 (1,021) and wave 2 (3,648). Responses do not sum to 100% as this was a multicoded question.
As seen with information already looked for or received, medium and large employers tended to be more likely than micro employers to plan to consult information sources. For example, around seven in ten medium and large employers planned to look for information on the HMRC webpages on GOV.UK (wave 1: 69%; wave 2: 72%) compared to just over half of micro employers (wave 1: 56; wave 2: 54%). At both waves, employers were asked whether there was anything they would like to know about CJRS that they had not been able to find out. The majority of employers did not have any further questions (wave 1: 79%; wave 2: 76%). At wave 2, amongst those who did still have questions, the most commonly cited gaps were:
• General information on how the scheme worked currently and how it would change in the future (31%).
• Furlough rules and how these apply to staff (for example around pension contributions, redundancies, tips, holiday pay, maternity/paternity pay, sick pay) (14%).
• Clarity on bringing back staff part time (13%).
• Eligibility criteria on which types of organisations could apply, and which types of employees could be claimed for (11%).

CJRS awareness, understanding and customer experience 14
OFFICIAL
Applications made to CJRS The findings in this section are from wave 2 only, as CJRS was not open for applications at the time of the wave 1 survey. Please note that the most complete source of data on types of employers applying to CJRS are the Official Statistics published on GOV.UK, which cover all employers who have applied.4
Key findings
• Almost six in ten (57%) employers in wave 2 had applied for the scheme at the time they took part in the survey (the scheme was not open during wave 1 so this question was not asked then).
• At the time of the wave 2 survey, three-quarters (74%) had received funds from CJRS.
Applications made to CJRS
Almost six in ten (57%) employers participating in the wave 2 survey had applied for the scheme at the time of the interview. As shown in Figure 4.1 below, small and medium and large employers were more likely than micro employers to have submitted an application. Figure 4.1: Applications made for CJRS by organisation size Q: Has your organisation submitted any applications for CJRS to HMRC?
69
70
54
57
28
27
42
39
3
3
3
3
1
1
1
Medium and large
Small
Micro
Overall
Yes No Not sure Prefer not to say
Base (unweighted): All employers who had heard of CJRS at wave 2 (3,648). The number of medium and large employers selecting ‘Prefer not to say’ was greater than zero but less than one per cent.
4 see Coronavirus Job Retention Scheme Statistics: July 2020 at https://www.gov.uk/government/publications/coronavirus-job-retention-scheme-statistics-july-2020/coronavirus-job-retention-scheme-statistics-july-2020#employer-size

CJRS awareness, understanding and customer experience 15
OFFICIAL
Employers who had been more negatively affected by coronavirus were more likely to have applied for CJRS. For example:
• Almost eight in in ten employers who had already furloughed staff (78%) had applied for CJRS.
• Approximately two-thirds of employers who said they had ‘no trade’ (68%) had applied for CJRS.
Just over half of employers who had applied for CJRS had submitted more than one application (53%). Table 4.1: Number of applications submitted Wave 2 One application 38% Two applications 41%
Three applications 5%
Four or more applications 7% Not sure 10%
Q: How many separate applications for CJRS has your organisation submitted? Please include any applications which were submitted but turned down by HMRC. Base (unweighted): All employers who had submitted a CJRS application at wave 2 (2,252).
Employers were asked whether they had submitted or intended to submit future applications through an agent, or whether they had submitted/planned to submit the application themselves. There was an equal split between employers who had applied or intended to apply for the scheme directly (48%) or through an agent (49%). Medium and large employers (84%) were more likely to have applied or intended to apply directly, compared with 64% of small employers and 43% of micro employers. A small number of employers (2%) reported that they had started a CJRS application which they did not submit to HMRC.
Receipt of CJRS funds
At the time of the wave 2 survey, 74% of employers surveyed who had applied to the scheme had received all of the funds from their application(s). Almost two in ten (18%) had received some, but not all funds they had applied for. One in twenty (5%) had not yet received any funds and the remaining four per cent were not sure. Among employers who had applied but reported not receiving any funds at the time of the survey, four per cent had had an application turned down. The remaining employers were either waiting to receive the funds (90%) or were not sure (6%). All of the employers who had had an application turned down were micro employers.

CJRS awareness, understanding and customer experience 16
OFFICIAL
Knowledge and understanding of CJRS and planned future use of the scheme
Key findings
• At wave 1, there was near universal awareness of the fundamentals of the scheme. However, there was less knowledge about the specifics of the scheme, such as the eligibility of particular groups of workers.
• Awareness of changes to the scheme was high at wave 2, with eight in ten (80%) aware that furloughed employees could be brought back to work part-time from August .
• At wave 1, just under eight in ten (78%) of employers said they were likely to apply for the scheme and seven in ten (69%) employers expected to furlough staff in the next four weeks.
• Over half of employers in wave 2 said they were likely to bring some furloughed workers back part-time before CJRS ended (58% thought they would do this in August and 55% in September/October).
• Most employers in wave 2 were not planning to take on new staff on permanent (89%) or temporary (87%) contracts or increase hours for non-furloughed staff (79%) in the next three months.
Knowledge of CJRS
Employers were shown a series of statements about CJRS and asked if they were true or false, or if they were unsure. Each statement shown during wave 1, and the proportion of employers answering correctly, is shown in Table 5.1 below. Table 5.1: Employer true or false statements (wave 1, continued overleaf) Answered
correctly Answered incorrectly
Not sure
80% of wage costs are covered up to a maximum of £2,500 for each member of staff (TRUE)
98% 1% 1%
Staff you claim for must be paid through your PAYE system (TRUE)
93% 1% 6%
Staff must not do any work for you during the period you claim for (TRUE)
93% 2% 5%
Payments under the scheme are a grant (not a loan) and will not have to be repaid (TRUE)
90% 6% 4%
The scheme covers wages from 1st March 2020 onwards (TRUE)
83% 8% 10%
Company directors and Company Office Holders are eligible for the scheme, if paid through PAYE (TRUE)
83% 6% 10%

CJRS awareness, understanding and customer experience 17
OFFICIAL
You will still need to pay employer NICs and mandatory pension contributions for furloughed workers, although the grant will cover these (TRUE)
77% 4% 19%
You can only claim for workers who were employed by you on 19th March 2020 (TRUE)
68% 20% 12%
There is no maximum number of weeks staff can be furloughed for, during the lifetime of the scheme (TRUE)
62% 19% 18%
You cannot claim for staff on these types of contract part-time, casual, fixed-term, zero hours (FALSE)
58% 17% 25%
There is no minimum period of time staff must be furloughed for (FALSE)
57% 24% 19%
You can claim for staff still working for you but with reduced hours and/ or pay (FALSE)
55% 23% 22%
You can claim for staff who also have jobs with other employers (TRUE)
49% 16% 35%
You can re-employ and claim for any staff who worked for you on 19th March 2020, but changed job after this date (TRUE)
48% 16% 36%
You do not need to calculate how much you claim, HMRC will do this automatically (FALSE)
34% 37% 29%
Agency staff can be furloughed by the recruitment agency they work for (TRUE)
29% 9% 62%
Q: For each of the following statements about CJRS, can you say if you think they are true, false, or you are not sure? Base (unweighted): All employers who had heard of CJRS at wave 1 (1,021).5
In wave 1, levels of knowledge were high, with near universal awareness of the fundamentals of the scheme. For example, almost all employers (98%) were aware that the scheme covered 80% of an employee’s wages, up to a maximum of £2,500 for each employee. However, there was less knowledge about the specifics of the scheme, such as the eligibility of particular groups of workers (58% were aware that they could claim for staff on part-time, casual, fixed-term or zero hours contracts).
Employers were asked about a different series of statements during wave 2 (Table 5.2, overleaf).
5 Respondents could answer definitely true, probably true, probably false, definitely false, or not sure. Answering correctly was defined as choosing ‘definitely true’ or ‘probably true’ if the statement was true, or ‘definitely false’ or probably false’ if the statement was false. Respondents were asked not to guess if they did not know.

CJRS awareness, understanding and customer experience 18
OFFICIAL
Table 5.2: Employer true or false statements (wave 2) Answered
correctly Answered incorrectly
Not sure
Grants from the scheme are only to be used for the payment of employees' salaries, and related National Insurance and pension contributions (TRUE)
89% 6% 6%
The scheme is currently planned to close at the end of October (i.e. no further grants towards wages will be provided after this time) (TRUE)
85% 4% 11%
Employers in all countries and regions of the UK can access the scheme until it closes. (TRUE)
81% 5% 13%
Nothing about the scheme will change until the end of July (TRUE)
81% 11% 8%
From 1 August, employers can bring furloughed workers back to work part-time. Part of their wages will be covered by the Job Retention Scheme and part by the employer. (TRUE)
80% 5% 15%
Employers in all sectors of the economy can access the scheme until it closes. (TRUE)
79% 11% 11%
Q: For each of the following statements about CJRS, can you say if you think they are true, false, or you are not sure? Base (unweighted): All employers who had heard of CJRS at wave 2 (3,648)6.
The following groups of employers were more likely to answer every statement correctly:
• Medium and large and small employers compared to micro employers.
• Employers who had applied for CJRS.
• Employers who had applied directly compared to those who had used agents.
• Employers who had furloughed staff and were planning on furloughing more (with the exception of the statement ‘employers in all sectors of the economy can access the scheme until it closes’).
Future applications for CJRS
In wave 2, 76% of employers who had already applied for CJRS said it was likely they would do so again (Figure 5.1, overleaf).
6 Respondents could answer definitely true, probably true, probably false, definitely false, or not sure. Answering correctly was defined as choosing ‘definitely true’ or ‘probably true’ if the statement was true, or ‘definitely false’ or probably false’ if the statement was false. Respondents were asked not to guess if they did not know.

CJRS awareness, understanding and customer experience 19
OFFICIAL
Figure 5.1: Likelihood to submit another CJRS application Q: How likely is it that your organisation will apply/submit another application for CJRS?
48%
17%11%
5%9%
2%7%
22%
8%3%
11%
25% 26%
4%
Certain to apply Very likely Quite likely Quite unlikely Very unlikely Certain not toapply
Not sure
Already applied for CJRS Have not applied for CJRS
Of those who have
not applied, are
certain or likely to34%
Of those who have
already applied, plan
to again76%
Base (unweighted): All employers who had already applied for CJRS at Wave 2 (2,252). All employers who know something about the scheme, but had not applied at Wave 2 (1,264).
Overall, 59% of employers who had heard of CJRS said they were likely to apply to the scheme in the future. Likelihood to apply increased with the size of employer, with 81% of medium and large employers saying they were likely to apply again, compared to 56% of micro employers. Employers in Construction (68%), Retail and Hospitality (68%) and Manufacturing (66%) were more likely to say they would make an application in the future compared to employers in Professional and Technical Services (52%) and Transport and Communications (47%). Employers who were negatively affected by coronavirus were more likely to say they would apply in the future, with 81% of those with ‘no trade or sales’ saying they were likely to do so. Among employers who had already furloughed staff and planned to furlough more, 85% said they were likely to apply again.
Future plans to furlough staff
At wave 2, six in ten (60%) of all employers said they planned to place staff on furlough in the next four weeks. The majority of this group had already furloughed staff (see Figure 5.2, overleaf).

CJRS awareness, understanding and customer experience 20
OFFICIAL
Figure 5.2: Proportions of employers furloughing and planning to furlough staff7 Q: Which, if any, of the following have you already done in response to coronavirus, either for all or some of your staff? Q: Which, if any, of the following do you plan to do in the next four weeks in response to coronavirus, either for all or some of your staff?
Base (unweighted): All employers at Wave 2 (3,708).
Small (73%) and medium and large (76%) employers were more likely to be planning to furlough staff at the time of interview, compared to micro employers (57%), as were those in the Manufacturing sector (70%). The intention to furlough more staff was more prevalent among employers who had reported being most affected by coronavirus, with 80% of employers with ‘no trade or sales’ planning to do so. The proportion was also higher among employers who had already applied for CJRS (81%).
Other measures planned in response to coronavirus
Employers were asked what other measures, if any, they planned to take in the four weeks following the survey in response to coronavirus. At wave 2, two in ten employers (20%) planned to reduce the number of hours staff worked, one in ten (9%) intended to ask staff to take a pay cut, and six per cent said they intended to make staff redundant (Figure 5.3, overleaf).
7 The remaining 5% responded with ‘Not sure’ or ‘Prefer not to say’ at one or both of these questions, and were therefore not assigned to one of the four groups.

CJRS awareness, understanding and customer experience 21
OFFICIAL
Figure 5.3: Actions planned in the next four weeks Q: Which, if any, of the following do you plan to do in the next four weeks in response to coronavirus, either for all or some of your staff?
60%
20%
9%
6%
5%
4%
Place staff on furlough
Reduce the number of hours staff work
Ask staff to take a pay cut
Make staff redundant
Reduce staff benefits, (e.g. pensions, medical insurance)
Ask staff to take unpaid leave
Base (unweighted): All employers at Wave 2 (3,708).
Bringing workers back from furlough
In May, the Chancellor announced that, from August, employers would be able to bring furloughed workers back part-time and claim for the hours they were still furloughed through CJRS. This change was later brought forward to July, an announcement which was made after wave 2 fieldwork concluded. As noted in Chapter 3, 72% of employers at wave 2 had placed staff on furlough in response to the coronavirus pandemic. At wave 2, employers were asked how they thought the number of staff they currently had on furlough might change over the four weeks following the survey (Figure 5.4). Figure 5.4: Expected number of staff on furlough in four weeks’ time Q: And four weeks from now, do you expect to have more, less, or around the same number of staff on furlough?
3%
59%
31%
7%
More staff on furlough Around the same number ofstaff on furlough
Fewer staff on furlough Not sure
Base (unweighted): All employers at Wave 2 who had put staff on furlough (2,866).

CJRS awareness, understanding and customer experience 22
OFFICIAL
Micro employers (62%) were more likely than small (47%) employers to expect to have the same number of staff on furlough in four weeks’ time. Employers in Retail and Hospitality (65%) and Public and Other Services (69%) were more likely to expect to have the same amount of staff on furlough than employers in Manufacturing (52%) and Construction (40%). The majority of employers with ‘no trade or sales’ expected the numbers of staff on furlough would remain the same in four weeks (75%). Employers were also asked whether they planned to bring workers back part-time, and claim CJRS for the hours they worked. Over half of employers in wave 2 said they were likely to bring some furloughed workers back part-time before CJRS scheme ended – 58% thought this was likely to happen in August and 55% in September/October. Figure 5.5: Likelihood to furlough employees part-time and claim through CJRS Q: How likely or unlikely is it that your business/organisation will furlough some workers part-time, and claim through CJRS for part of their wages?
58%
55%
Net certain /
likely to
12
15
21
21
22
21
8
8
10
11
8
9
19
15
Will do this for some/all furloughed workers in September orOctober (%)
Will do this for some/all furloughed workers in August (%)
Certain to Very likely Quite likely Quite unlikely Very unlikely Certain not to Not sure
Base (unweighted): All employers who knew something about CJRS and had already furloughed or planned to furlough workers at Wave 2. ‘Not sure’ includes those who responded ‘prefer not to say’ (2,886).
Medium and large employers (64%) were more likely than micro employers (53%) to say they would bring back some furloughed workers part-time in September/October.

CJRS awareness, understanding and customer experience 23
OFFICIAL
Customer experience of CJRS
Key findings
• Employers reported a largely positive experience of CJRS. Almost nine in ten employers (86%) who applied for CJRS directly rated their overall experience as good, with 62% saying it was ‘very good’.
• Overall, almost two in ten (17%) employers who had heard of CJRS had contacted HMRC about the scheme. Information on how to apply was the main reason for contacting HMRC.
• Among employers who submitted an application themselves, eight in ten (79%) found the process easy, with 39% saying it was ‘very easy’.
• A large majority agreed that the steps in the application process (75%), when their application had been submitted (90%), and when they would receive the funds were made clear (80%).
• Among employers who had received funds from the scheme, almost all were satisfied with the time taken for this (94% satisfied).
Contacting HMRC
At wave 1, just under seven in ten employers (67%) had consulted the HMRC webpages on GOV.UK for information on CJRS (see Section 3.3 for further details) and a small proportion (7%) of employers who were aware of CJRS had contacted HMRC about the scheme (see Section 3.2 for further details). Of those who had contacted HMRC, the most common reasons for doing so were to find out more information on how to apply (67%) and to find out when to apply (42%). Figure 6.1: Reasons for contacting HMRC (wave 1) Q: Why did you/do you plan to contact HMRC about the scheme?
Base (unweighted): All employers who are aware of CJRS and had contacted or planned to contact HMRC at wave 1 (430).
There were no consistent patterns by employer size in terms of the reasons for contacting HMRC about the scheme at wave 1.
67%
42%
18% 16% 4% 3% 1%7%
For moreinformation onhow to apply
To know whenorganisationswere able to
apply
Not sure iforganisationwas eligible
Could not findanswer to
question in theguidance
Generalinformation on
how thescheme works
Questionsspecific to the
business
Other Not sure

CJRS awareness, understanding and customer experience 24
OFFICIAL
At wave 2, three-quarters of employers (74%) who had heard of CJRS had consulted the HMRC webpages on GOV.UK for information on CJRS (see Section 3.3 for further details). Over four in ten employers (44%) who had heard of CJRS had already contacted HMRC about the scheme, and four per cent planned to do so in the future (see Section 3.2 for further details). At wave 2, employers were asked an additional question about whether they had contacted HMRC, or planned to contact them, about applications for CJRS. Just under two in ten employers who had heard of CJRS (17%) had done so and four per cent planned to (14% were not sure). Levels of contact about CJRS applications at wave 2 varied by different types of employer:
• Employers who had submitted the application themselves (28%) were more likely than those who had used an agent (18%) to have contacted HMRC.
• Medium and large employers (34%) were more likely than small employers (23%) and micro employers (15%) to have contacted HMRC. This reflects the fact that, as discussed in Section 5.1, larger employers were more likely to apply to the scheme and to make the application themselves.
Employers were then asked why they contacted HMRC. Questions about the application and how to apply were the main reasons for contacting or planning to contact HMRC about CJRS (67%). Eligibility criteria (18%), changes to the scheme (14%) and following up a payment (12%) were other common reasons. Figure 6.2: Reasons for contacting HMRC Q: Why did you/do you plan to contact HMRC about CJRS? (Top seven responses shown only)
HMRC CJRS Presentation W2 | June 2020 | Internal/Client Use Only22
67%
18% 14% 12%3% 3% 2%
9%
To find moreinformation onhow to apply
To find out ifthe
organisationwas eligible
For informationon changes to
the scheme
To follow up apayment due
from thescheme
Log-in ortechnicalqueries
Clarificationqueries on NIcontributions
Incorrectinformation or
errors made onapplication
Not sure
Base (unweighted): All employers who have contacted HMRC about CJRS, or plan to do so at wave 2 (905). Responses do not sum to 100% as this was a multicoded question. “To find more information on how to apply” is a combination of “To ask questions about making an application to the scheme” (33%) and “For information on how to apply to the scheme” (33%).
Medium and large employers were more likely to get in touch with questions about making an application (52%) than small (36%) or micro (32%) employers . By sector, employers in Transport and Communications (30%) were most likely to contact HMRC about eligibility criteria, and those in Construction were most likely to have been in touch to follow up a payment (27%).

CJRS awareness, understanding and customer experience 25
OFFICIAL
Resolving customer queries
Three-quarters (75%) of those who had contacted HMRC about CJRS said they were good at resolving their issue, with 52% saying HMRC were ‘very good’. One in ten (10%) said HMRC had been poor. There were few differences across subgroups, although employers who had submitted applications themselves were more likely than those who had used an agent to rate HMRC as ‘very good’ (59% versus 42%). Employers in the North, Northern Ireland and Scotland were less likely to rate HMRC as ‘very good’ (34%). Figure 6.3: Rating of HMRC for resolving customer queries Q: How good or poor were HMRC at resolving your query?
Base (unweighted): All employers who had contacted HMRC about CJRS at Wave 2 (759). Not sure includes prefer not to say.
Applying for CJRS and receiving the funds
Almost nine in ten employers (86%) who applied for CJRS directly (rather than through an agent) rated their overall experience of applying for CJRS as good, with 62% saying it was ‘very good’. Figure 6.4: Rating of overall experience of applying for CJRS Q: How would you rate your overall experience of applying for CJRS?
Base (unweighted): All employers who had submitted a CJRS application and were involved in the process at Wave 2 (2,027). Not sure includes prefer not to say.
The majority of employers who submitted an application themselves found the process easy (79%), with 39% saying it was ‘very easy’. A small proportion (7%) said the process was difficult.

CJRS awareness, understanding and customer experience 26
OFFICIAL
Figure 6.5: Ease of applying for CJRS Q: How easy or difficult did you find applying for CJRS?
Base (unweighted): All employers who had applied for CJRS directly at Wave 2 (1,742). Not sure includes prefer not to say.
There were few differences across the main subgroups. Micro employers were more likely than medium and large employers to rate the process as ‘very easy’ (41% versus 30%). Among employers who had received funds from the scheme, almost all (94%) were satisfied with the time taken to receive funds, with 77% being ‘very satisfied’. Figure 6.6: Satisfaction with the time taken to receive funds Q: How satisfied or dissatisfied are you with the time taken to receive the funds from the scheme?
Base (unweighted): All employers who had received funds from CJRS at Wave 2 (2,034). Not sure includes prefer not to say.
Among employers who had applied but not yet received funds, 33% were satisfied with the time it had taken to reach the stage their application was currently at, while 24% were dissatisfied and 19% were neutral8. The remainder were not sure or preferred not to say.
Clarity of the application process
Employers who had submitted a CJRS application were asked to rate the clarity of the application process, including the steps in the process, when the application had been submitted and when the grant would be received (Figure 6.7, overleaf).
8 Base sizes are too small to allow for any subgroup comparisons.

CJRS awareness, understanding and customer experience 27
OFFICIAL
Figure 6.7: Ratings of clarity of the process Q: To what extent do you agree or disagree with the following statements about your application(s) for CJRS?
Base (unweighted): All employers who had submitted a CJRS application at Wave 2 (2,252). All who applied directly at Wave 2 (1,389). All who had received funds at Wave 2 (2,034).
Most employers who submitted an application were positive about the clarity of the process. Three-quarters (75%) agreed that ‘HMRC made the steps in the application process clear.’ Employers who submitted the application themselves (86%) were more likely to agree than those who used an agent (65%). Nine in ten (90%) of employers agreed ‘HMRC made it clear when my application had been submitted’ and eight in ten (80%) employers who received funds agreed that ‘HMRC made it clear when the grant would be received.’ Once again, employers who submitted applications themselves (86%) were more likely to agree with this than those who used an agent (74%).

CJRS awareness, understanding and customer experience 28
OFFICIAL
Employees’ knowledge and understanding of CJRS
Key findings
• Four in ten employees (41%) reported their employer had stopped trading due to coronavirus, and almost six in ten (57%) reported coronavirus having a negative effect on their employer’s sales and trade.
• Just over a third (35%) of employees said they had been placed on furlough at the time of survey in April 2020.
• Nine in ten employees (88%) were aware of CJRS. Levels of knowledge of the specifics of the scheme were variable. Understanding of the amounts paid was highest but knowledge about eligibility was lower.
• Most employees (79%) on furlough or likely to be put on furlough were confident that their wages would be covered by the scheme.
• Discussing the scheme with employers (39%) and looking for information on GOV.UK (33%) were the most common actions taken by employees.
• Most employees had received and/or sought information on CJRS, with HMRC webpages (26%) and employers/trade unions (24%) the most common sources used, closely followed by the media (22%).
Reported impact on employees’ organisations
Around half (53%) of employees reported working for organisations that were still actively trading. Four in ten employees (41%) said their organisation had stopped trading because of coronavirus - for 30% this was temporary, with plans to reopen. Just over three-quarters of respondents (77%) said they were permanent employees. Eight per cent said they were temporary, and one in ten (11%) said they had a casual (or zero hours) contract. Permanent employees (60%) were more likely than temporary employees (38%), who in turn were more likely than employees on casual contracts (24%), to say their employer was still actively trading. Professional and Technical Services employees (61%) were more likely than those working in Public and Other Services (52%), Manufacturing and Construction (45%) and Retail and Hospitality (40%) to report that their employer was still trading. Almost six in ten (57%) employees said their employer had been negatively affected by coronavirus (having ‘no trade’, ‘a lot less trade’ or ‘a little less trade’). Two in ten (21%) had

CJRS awareness, understanding and customer experience 29
OFFICIAL
‘no trade or sales’ at all and a similar proportion had ‘a lot less sales or trade’ (22%). Fourteen per cent reported more sales or trade.9 Employees aged 16-35 were more likely to say their organisation had been negatively affected by coronavirus (67%), as were those in Retail and Hospitality – just under four in ten employees (37%) in this sector reported their employer had ‘no trade’.
Impact on employees
Over three in ten (35%) employees reported having been furloughed, and a further 5% reported having been made redundant. Almost two in ten (18%) had seen their hours reduced and 8% had seen their rate of pay reduced. Figure 7.1: Impact of coronavirus on employees Q: Have any of the following happened to you as a result or coronavirus?
35%
18%
9%
8%
8%
5%
I have been put on furlough
I am still working, but the hours I am
expected to work have been reduced
I have been asked/told to take unpaid holiday/annual leave
I am still working but my rate of pay has been reduced
My other benefits have been reduced
(e.g. pensions, medical insurance)
I have been made redundant
Base (unweighted): All employees (1,026).
Being put on furlough was less prevalent among employees in the Public and Other Services sector (21%). There were also differences by contract type (see Table 7.1, overleaf):
• Employees on casual contracts (48%) were more likely to have been put on furlough than temporary (35%) or permanent (33%) employees.
• Temporary workers were more likely to have had their hours reduced (35%) than permanent (15%) or casual (20%) employees.
9 These figures differ from employers, where 91% reported less trade and sales and 5% more sales or trade (see Section 2.2 for more details). Employees were also likely to be unsure (15% compared to 1% of employers).

CJRS awareness, understanding and customer experience 30
OFFICIAL
• Employees on casual (18%) or temporary contracts (17%) were more likely than employees on permanent contracts (5%) to have been asked to take unpaid leave.
• Employees on temporary contracts (16%) were more likely than employees on permanent contracts (6%) to have had other benefits reduced (e.g. pension, medical insurance).
Table 7.1: Impact of coronavirus on employees by contract type
Casual Temporary Permanent
I have been put on furlough 48% 35% 33% I am still working, but the hours I am expected to work have been reduced
20% 35% 15%
I am still working but my rate of pay has been reduced
10% 17% 6%
My other benefits have been reduced
12% 16% 6%
I have been made redundant 11% 10% 3% I have been asked / told to take unpaid holiday / annual leave
18% 17% 5%
Q: Have any of the following happened to you as a result of coronavirus? Base (unweighted): All employees on casual contract (130), temporary contract (86), permanent contract (787). Figures in italics should be treated with caution due to small base sizes.
Employees were also asked what they thought might happen to them in the next four weeks:
• 22% thought it was likely that their hours or pay would be reduced;
• 12% expected to be put on furlough;
• 12% expected to be told to take unpaid leave;
• 11% expected to be made redundant; and,
• 10% expected their benefits would be reduced. In contrast, employers were much more likely to be planning to place staff on furlough in the next four weeks (69%), but were less likely to expect to make staff redundant (6%) or to ask them to take unpaid leave (5%) or a pay cut (10%). The proportion expecting to reduce employees’ hours (22%) was similar to the findings amongst employees. As was the case with impacts already experienced, 16-35 year olds were more likely than older employees to expect that each impact described above would happen to them. Employees in the Manufacturing and Construction sectors (22%) were more likely to expect to be put on furlough than those in Public and Other Services (7%). Employees on temporary contracts were most likely to think they would be put on furlough (24%) and have their benefits reduced (24%), while employees on temporary and casual contracts were more likely than permanent employees to say they thought they would have their hours reduced, their pay cut, be asked to take unpaid leave or be made redundant (Table 7.2, overleaf).

CJRS awareness, understanding and customer experience 31
OFFICIAL
Table 7.2: Expected impact of coronavirus on employees by contract type10 Overall Casual Temporary Permanent
I will be put on furlough 12% 9% 24% 11% The hours I am expected to work will be reduced
22% 34% 32% 19%
My rate of pay will be reduced 22% 31% 39% 18% My other benefits will be reduced 10% 12% 24% 8% I will be made redundant 11% 19% 24% 8% I will be asked / told to take unpaid annual leave / holiday
12% 19% 21% 10%
Q: How likely or unlikely do you think it is that the following may happen to you as a result of coronavirus in the next four weeks? Percentages based on combined score for ‘very likely’ and ‘quite likely’.
Awareness of CJRS
As with the employer survey, employees were provided with the following description of CJRS:
‘Under this scheme, the government will pay part of the wages of any workers temporarily asked to stop working and placed on leave due to the impact of coronavirus on their employer. This is known as being placed on furlough, so staff aren’t made redundant’.
Almost nine in ten (88%) employees said they were aware of CJRS at the time of the survey. Permanent employees (92%) had higher levels of awareness than those on temporary (81%) and zero hours (75%) contracts. Among employees aware of the scheme, over six in ten (64%) said they knew at least ‘a fair amount’ about CJRS, with 11% saying they knew ‘a great deal’.
Confidence in being eligible for CJRS
Eight in ten (79%) employees on furlough or reporting themselves likely to be put on furlough were confident that their wages would be covered by CJRS, while 15% said they were not confident. Confidence was higher among employees on permanent contracts (84%), compared to those on temporary (67%) or casual (66%) contracts.
10 Base varies for each question i.e. all who have not been put on furlough (659), all who have not had their hours reduced
(833), all who have not had their rate of pay reduced (938), all who have not had their benefits reduced (940), all who have not been made redundant (972), all who have not been asked to take unpaid leave (933). Base for all casual workers ranges from 67 to 116, for all temporary workers base ranges from 54 to 77, for all permanent workers base ranges from 523 to 761. Figures in italics should be treated with caution due to small base sizes.

CJRS awareness, understanding and customer experience 32
OFFICIAL
Figure 7.2: Confidence that employers would be able to claim a grant for wages Q: How confident, if at all, are you that your employer will be able to claim a grant to cover your wages?
35%
45%
12%
3%
5%
Very confident
Fairly confident
Not very confident
Not confident at all
Not sure
79%
Base (unweighted): All employees on furlough or likely to go on furlough (451). ‘Very confident’ and ‘Fairly confident’ sum to 79% rather than 80% due to rounding.
Actions taken by employees
Four in ten employees reported having had discussions with or information shared about the scheme from their employers (39%), whilst just under one in ten had contacted HMRC (8%). Table 7.3: Actions taken in relation to CJRS
Have done Plan to do
Discuss(ed) with / received information from my employer
39% 9%
Look(ed) for information and guidance on GOV.UK 33% 11% Check(ed) if I am eligible for the scheme 28% 11% Contact(ed) HMRC about the scheme 8% 9%
Q: Which, if any, of the following have you done/plan to do in relation to CJRS? Base (unweighted): All employees aware of the scheme (902). Responses do not sum to 100% as a multicoded question.
There were few differences in terms of employee age, although those aged 16-35 were more likely to have checked they were eligible for the scheme (34%) than those aged 55 and above (24%). By sector, employees in Public and Other Services were less likely to have looked on GOV.UK (21%) or to have checked their eligibility for the scheme (14%) than employees overall, likely reflecting relative expectations of being put on furlough. Retail and Hospitality (56%) and Manufacturing and Construction (52%) employees were more likely than those working in Professional and Technical Services (32%) and Public and Other Services (22%) to have sought information from their employer.

CJRS awareness, understanding and customer experience 33
OFFICIAL
Employees on casual contracts were more likely to have looked for information on GOV.UK (45%, versus 33% of temporary and 31% of permanent employees). They were also more likely to have checked if they were eligible for the scheme (40%, versus 25% of temporary and 18% of permanent employees). Meanwhile, permanent employees (49%) were more likely than those on casual contracts (32%) not to have already spoken to their employers, or to be planning to. Employees who felt unlikely to be furloughed were less likely to have already taken or planning to take any of the actions asked about. Employees already furloughed tended to be more likely to have already taken these actions, while those who thought they were likely to be furloughed in the next four weeks were more likely to plan to engage in these actions.
Information sources
Almost two-thirds of employees (63%) had sought and/or received information on CJRS, with HMRC web pages (26%) and employers/trade unions (24%) being the most common sources (Table 7.4). Table 7.4: Information sources on CJRS
Used Plan to use HMRC webpages on GOV.UK 26% 26% My employer / trade union 24% 15% General media 22% 9% Friends and family 16% 7% TV shows about coronavirus 13% 6% Finance / money websites 10% 6% Other webpages on GOV.UK 10% 10% None of these 32% 41%
Q: Have you looked for/received information/Do you plan to look for information on CJRS from any of the following sources? Base (unweighted): All employees (1,026). Responses do not sum to 100% as this was a multicoded question.
Employees who felt they were unlikely to be furloughed tended to be less likely to have sought or received information. Employees who thought they were likely to be put on furlough were more likely to sought/received information from the general media (34%), while those already on furlough were more likely to mention their employer/trade union (43%).
Knowledge of CJRS
Employees were shown a series of statements about CJRS and asked if they thought they were true or false, or if they were unsure. Levels of knowledge of the scheme varied. Employees’ understanding was highest around the amounts paid, with 85% answering this correctly. There was less knowledge about eligibility for the scheme, with 36% aware that agency workers and those on casual contracts were eligible (Table 7.5, overleaf).

CJRS awareness, understanding and customer experience 34
OFFICIAL
Table 7.5: Employee knowledge of CJRS Answered
correctly Answered incorrectly
Not sure
Under the scheme, each furloughed worker should receive at least 80% of their wages from their employer to a max of £2500 per month (TRUE)
85% 6% 9%
Furloughed workers will receive pay in the usual way, through employers' payroll system (TRUE)
72% 7% 21%
Businesses can claim financial support for staff put on furlough from 1st March 2020 onwards (TRUE)
71% 12% 18%
Payments to furloughed employees will have Income Tax and National Insurance deducted (TRUE)
59% 10% 31%
Workers who left their job after 19 March 2020 can ask their employer on this date to take them back and furlough them (TRUE)11
47% 26% 27%
Workers must be furloughed for at least three weeks to be eligible for the scheme (TRUE)
49% 20% 31%
Agency workers and those with part-time, casual, zero hour and fixed term contracts are not eligible for the scheme (FALSE)
36% 32% 32%
Staff who are still working but have had their pay or hours reduced are eligible for the scheme (FALSE)
36% 31% 33%
If someone has more than one job, they are eligible for the scheme for any of their jobs they are furloughed from (TRUE)
59% 19% 21%
Q: For each of the following statements about the Coronavirus Job Retention Scheme can you say if you think they are true, false, or you are not sure? Base (unweighted): All employees at wave 1 (1,026).12
Employees aged over 55 were more likely to know that furloughed workers are paid in the usual way (82% versus 72% overall). Employees from the Public and Other Services (67%) and Professional and Technical Services (68%) sectors were less likely than those from Retail and Hospitality (82%) or Manufacturing and Construction (79%) to correctly identify that furloughed employees are paid in the usual way. Permanent employees were more likely than employees on temporary contracts to identify the entitlement to 80% of wages up to a maximum of £2,500 (88% versus 77%), to recognise that financial support can be claimed for staff put on furlough since 1 March (73% versus 62%), and to understand that furloughed employees will be paid in the usual way (74% versus
11 Please note that this date changed from 28 February 2020 a few days before the survey was launched, which may explain the level of awareness. 12 Respondents could answer definitely true, probably true, probably false, definitely false, or not sure. Answering correctly was defined as choosing ‘definitely true’ or ‘probably true’ if the statement was true, or ‘definitely false’ or probably false’ if the statement was false. They were asked not to guess if they did not know.

CJRS awareness, understanding and customer experience 35
OFFICIAL
64%). Employees who were not, or thought they were unlikely to be, put on furlough were less likely to understand some elements of the scheme.

CJRS awareness, understanding and customer experience 36
OFFICIAL
Appendix – Technical Approach
Sample design
Employers
The sample of employers was designed to provide an estimate of behaviours, experiences and intentions of the employer population eligible for the Coronavirus Job Retention Scheme (CJRS). Data was collected using an online survey. The sample included UK employers with at least one employee. The employer sample was proportionately stratified by region, and disproportionately stratified by size and sector. An entirely proportionately stratified sample would not have allowed sufficient subgroup analysis by size and sector. The sample was not designed to reflect the UK employer population by legal status. This meant that charitable organisations, whilst included in the research, were not proportionately sampled and the findings for charities should therefore be treated as indicative. We have therefore not reported on charities as a separate subgroup, but they are included in the overall results. For details of the proportion of respondents that were charities, please see Table A1 below. Table A1: Legal status Unweighted Weighted Wave 1 Wave 2 Wave 1 Wave 2
Legal status Limited company 920 (90%) 3,258 (88%) 90% 91%
Charity 58 (6%) 270 (7%) 4% 5%
Partnership 31 (3%) 112 (3%) 4% 3%
Social enterprise 4 (*%) 23 (1%) 1% 1%
Other 14 (1%) 45 (1%) 2% 1% Note: the weighted percentage for legal status is not the same across both waves as the sample was not weighted for this.
Sole traders who have employees are eligible for CJRS. This group was not included in the survey due to time restrictions on sourcing a reliable sample frame. We estimate this amounts to 15% of all employers eligible for the furlough scheme. Public bodies were also excluded as, at the time of the survey, they were not expected to access the scheme in significant numbers. The sample was drawn from the DBS Data commercial database, a commercially-available directory of organisations in the UK. Although this database is large it did not include details of all UK employers eligible for the survey, meaning findings should be interpreted with caution.

CJRS awareness, understanding and customer experience 37
OFFICIAL
Employees
The survey of employees was conducted via Ipsos MORI’s online omnibus survey, with quotas and weighting set to be representative of the UK population.
Fieldwork
Ipsos MORI carried out fieldwork using online surveys. A bespoke survey of employers was designed and Ipsos MORI’s online omnibus survey was used to reach employees.
Employers
In total, 4,735 interviews were achieved with employers across two waves. The first wave of fieldwork took place between 16-19 April 2020 (1,027 employers), and the second between 21- 31 May 2020 (3,708 employers). Each employer received one invitation email for the survey, and two separate reminders for those who had not completed it. At the beginning of the survey, a screener identified an appropriate individual to take part (someone within the organisation with responsibility and involvement in decisions about finances and staffing) and ensure the employer was eligible for the survey. At this point, the following organisations were screened out as ineligible: public sector organisations and sole traders; organisations with no staff on the payroll; and organisations which had permanently stopped trading, either due to coronavirus or other reasons. During the interview, employers were asked to verify information in the sample frame related to their industry sector. Where this differed from the sample the response provided during the survey was deemed most accurate and used for analysis.
Employees
Employees were surveyed through Ipsos MORI’s online omnibus survey, with 1,026 achieved interviews. Fieldwork took place between 16-19 April 2020, before CJRS opened to applications from employers on 20 April. At the beginning of the survey, screening questions identified whether the respondent was self-employed or paid through PAYE, and likely to be eligible for CJRS if their employer wanted to claim for them. Self-employed people who were also directors of a limited company, and were not paid through PAYE, were excluded as they were not eligible for CJRS.

CJRS awareness, understanding and customer experience 38
OFFICIAL
Data Processing and weighting
Employers
Weighting was applied to make the data reflect the profile of the UK employer population for both waves 1 and 2. Data was weighted by size, sector and region in accordance with the UK employer population. The weights applied are summarised in Table A2. Table A2: Weighting for employers Description Weights Size (number of employees)
1-9 82% 10-49 15% 50-249 2.5% 250+ 0.5%
Sector Agriculture, Extraction & Utilities 4.3%
Manufacturing 6.3% Construction 12.5% Wholesale and Retail Trade 17.2% Transportation and Communications 9.7% Food or Hospitality 9.6% Finance, Real Estate and Administration 14% Professional, Scientific or Technical Services 14% Education, Health, Arts, Services 12.4%
Region North East 2.9% North West 10.1% Yorkshire and the Humber 7.3% West Midlands 8.3% East Midlands 6.8% East of England 10.2% South West 8.8% South East 14.9% London 17.3%
Wales 4% Scotland 6.9% Northern Ireland 2.5%
Employees
Weighting was applied to make the data representative of the UK population (see Table A3). Table A3: Weighting for employees (continued overleaf) Description Weights Gender Male 54.33% Female 45.67%
Age 16-24 9.80%

CJRS awareness, understanding and customer experience 39
OFFICIAL
25-34 23.88% 35-44 22.68% 45-54 24.15%
55-64 16.51% 65-75 2.98%
Region North East 3.80% North West 10.68% Yorkshire and the Humber 7.84% West Midlands 8.60% East Midlands 7.58% East of England 9.32% South West 8.33% South East 14.42%
London 14.51%
Wales 4.08% Scotland 7.94% Northern Ireland 2.90%
Statistical reliability
The respondents to the research were a sample of the total ‘population’ of UK employers and employees, so we cannot be certain that the figures obtained are exactly those we would have if all in the population had been interviewed (the ‘true’ values). Due to the limitations of the sampling approach possible in the time available, significance testing of differences in findings between sub-groups and different waves was not conducted. In the report, only differences of 10 percentage points or higher, are mentioned in the text, where base sizes were sufficient to allow for comparisons. It is judged these were more likely to be ‘true’ differences between different groups surveyed.