corporate author - united states department of agriculture · corporate author rodort/artiolb titlo...
TRANSCRIPT

°43oi D
Author Birge, Wesley J.
Corporate Author
RODOrt/ArtiOlB TitlO Aquatic Toxicology of Trace Elements of Coal and FlyAsh
JOUmal/BOOk TltlU Energy and Environmental Stress in Aquatic Systems: s
Year 1978
Month/Day
Color D
Number of Images 22
DflSCriptOn NOtOS Alvin L- Youn9 filed tnese documents together under thelabel, "Arsenic/Cacodylic Acid and Herbicide Blue". Doc. No.CONF-771114
Thursday, February 14, 2002 Page 4301 of 4919

-from "^JvA/icaJl J>-<or/A«'6<« C*r., UUS
Series - V*. / 977
AQUATIC TOXICOLOGY OF TRACE ELEMENTSOF COAL AND FLY ASH
WESJ_Ey.T SIR G KT. H. Morgan School of Biological Sciences, University of Kentucky,Lexington, Kentucky
ABSTRACT
Aquatic bioassays were performed on 22 coal elements, with developmental andjuvenile stages of fish and amphibians used as test organisms. For more sensitivetest species, LC50 values of 0.1 ppm or less were observed for 15 trace elements,and LC] values ranged down to 0.1 to 0.2 ppb for mercury and silver. Studiesalso were performed on the aqueous leaching characteristics and toxicologicalproperties of coal-produced fly ash. A 52-kg sample of precipitator-collected flyash was subjected to continuous flow-through washing for 2000 consecutivehours in a bench-scale ash-settling pond. Chemical characteristics of thesimulated effluent compared closely with those recorded for actual ash-settlingponds. During the first 500 hr of operation, conductivity averaged 690iUmhos/cm, and a mean of 0.56 g/liter was observed for total dissolved solids.Gradual decreases were observed thereafter. Ef f luen t pH averaged 4.3 during thefirst 500 hr but approached the level of inf luent water (7.1 to 7.9) by 2000 hr.Maximum ef f luen t concentrations detected for seven selected metals were 126ppm Al, 766 ppb Zn, 518 ppb Cu, 500 ppb Cd, 370 ppb Ni, 87 ppb Hg, and 8ppb Ag. Mean concentrat ions for the f i rs t 500 hr of elut ion were 32.6 ppm Al,350 ppb Zn, 156 ppb Cd, 1 55 ppb Ni , 1 1 0 ppb Cu. '2.1 ppb Ag, and 1.8 ppb Hg.All metals except mercury reached maximum levels wi th in 500 hr, andconcentrations declined thereafter. Mean mercury levels increased to 27 and 15ppb for the second and th i rd 500-hr e lu t ion in te rva l s Af t e r 522 and 1033 hr ofe lut ion time, continuous-flow treatment with undi lu ted ash ef f luent produced100% mortality of frog and .sunt'ish eggs. A 0.1 d i l u t i o n at 1033 hr resul ted in42'" h a t e h a b i i i t y of sunf i sh eggs. A f t e r 1775 hr of cont inuous leach ing ,und i lu t ed ash e f f l u e n t and 0.1 and 0.01 d i l u t i o n s gave surviva l f requencies of 57,76, and (S89f for goldf ish eggs, compared w i t h 92~ for controls. Metals analyzedfor undi luted e f f l u e n t administered to goldfish were well below LCj determina-tions, except a l u m i n u m , which was present at the LC; ;, l eve l .
220 BIRGE
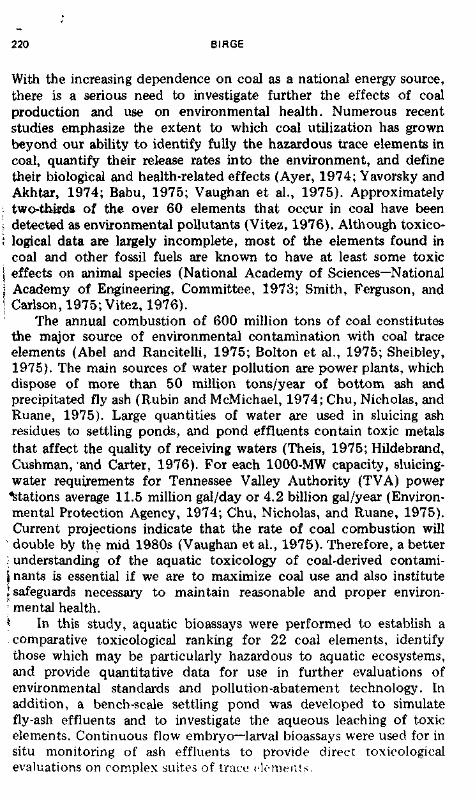
With the increasing dependence on coal as a national energy source,there is a serious need to investigate further the effects of coalproduction and use on environmental health. Numerous recentstudies emphasize the extent to which coal utilization has grownbeyond our ability to identify fully the hazardous trace elements incoal, quantify their release rates into the environment, and definetheir biological and health-related effects (Ayer, 1974; Yavorsky andAkhtar, 1974; Babu, 1975; Vaughan et al., 1975). Approximatelytwo-thikds of the over 60 elements that occur in coal have beendetected as environmental pollutants (Vitez, 1976). Although toxico-logical data are largely incomplete, most of the elements found incoal and other fossil fuels are known to have at least some toxiceffects on animal species (National Academy of Sciences—NationalAcademy of Engineering, Committee, 1973; Smith, Ferguson, andCarlson, 1975; Vitez, 1976).
The annual combustion of 600 million tons of coal constitutesthe major source of environmental contamination with coal traceelements (Abel and Rancitelli, 1975; Bolton et al., 1975; Sheibley,1975). The main sources of water pollution are power plants, whichdispose of more than 50 million tons/year of bottom ash andprecipitated fly ash (Rubin and McMichael, 1974; Chu, Nicholas, andRuane, 1975). Large quantities of water are used in sluicing ashresidues to settling ponds, and pond effluents contain toxic metalsthat affect the quality of receiving waters (Theis, 1975; Hildebrand,Cushman, and Carter, 1976). For each 1000-MW capacity, sluicing-water requirements for Tennessee Valley Authority (TVA) powerStations average 11.5 million gal/day or 4.2 billion gal/year (Environ-mental Protection Agency, 1974; Chu, Nicholas, and Ruane, 1975).Current projections indicate that the rate of coal combustion will
1 double by the mid 1980s (Vaughan et al., 1975). Therefore, a better; understanding of the aquatic toxicology of coal-derived contami-\ nants is essential if we are to maximize coal use and also instituteJ safeguards necessary to maintain reasonable and proper environ-: mental health.* In this study, aquatic bioassays were performed to establish acomparative toxicological ranking for 22 coal elements, identifythose which may be particularly hazardous to aquatic ecosystems,and provide quantitative data for use in further evaluations ofenvironmental standards and pollution-abatement technology. Inaddition, a bench-scale settling pond was developed to simulatefly-ash effluents and to investigate the aqueous leaching of toxicelements. Continuous flow embryo—larval bioassays were used for insitu monitoring of ash effluents to provide direct toxicologicalevaluations on complex suites of trace c loments .
AQUATIC TOXICOLOGY OF TRACE ELEMENTS 221
MATERIALS AND METHODS
Aquatic Bioassays
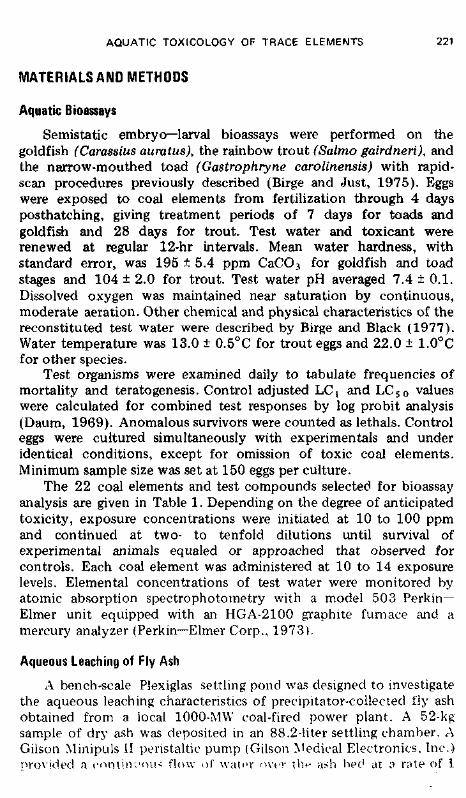
Semistatic embryo—larval bioassays were performed on thegoldfish (Carassius auratus), the rainbow trout (Salmo gairdneri), andthe narrow-mouthed toad (Gastrophryne carolinensis) with rapid-scan procedures previously described (Birge and Just, 1975). Eggswere exposed to coal elements from fertilization through 4 daysposthatching, giving treatment periods of 7 days for toads andgoldfish and 28 days for trout. Test water and toxicant wererenewed at regular 12-hr intervals. Mean water hardness, withstandard error, was 195 ± 5.4 ppm CaCO3 for goldfish and toadstages and 104 ± 2.0 for trout. Test water pH averaged 7.4 ± 0.1.Dissolved oxygen was maintained near saturation by continuous,moderate aeration. Other chemical and physical characteristics of thereconstituted test water were described by Birge and Black (1977).Water temperature was 13.0 ± 0.5°C for trout eggs and 22.0 ± 1.0°Cfor other species.
Test organisms were examined daily to tabulate frequencies ofmortality and teratogenesis. Control adjusted LC1 and LCSO valueswere calculated for combined test responses by log probit analysis(Daum, 1969). Anomalous survivors were counted as lethals. Controleggs were cultured simultaneously with experimentals and underidentical conditions, except for omission of toxic coal elements.Minimum sample size was set at 150 eggs per culture.
The 22 coal elements and test compounds selected for bioassayanalysis are given in Table 1. Depending on the degree of anticipatedtoxicity, exposure concentrations were initiated at 10 to 100 ppmand continued at two- to tenfold dilutions until survival ofexperimental animals equaled or approached that observed forcontrols. Each coal element was administered at 10 to 14 exposurelevels. Elemental concentrations of test water were monitored byatomic absorption spectrophotornetry with a model 503 Perkin—Elmer unit equipped with an HGA-2100 graphite furnace and amercury analyzer (Perkin—Elmer Corp., 1973).
Aqueous Leaching of Fly Ash
A bench-scale Plexiglas settling pond was designed to investigatethe aqueous leaching characteristics of precipitator-collected fly ashobtained from a local 1000-MW coal-fired power plant. A 52-kgsample of dry ash was deposited in an 88.2-liter settling chamber. AGilson Minipuls II peristaltic pump (Gilson Medical Electronics, Inc.)provided a c n n u n i ' o u ^ f low of water o\vr the ash bee1 at a rate of 1

222 BIRGE
TABLE 1
COAL TRACE ELEMENTS SELECTEDFOR BIO ASSAY EVALUATIONS
Traceelement
AluminumAntimonyArsenicCadmiumCobaltChromium
CopperGermaniumLanthanumLeadManganeseMercury
MolybdenumNickelSilverSeleniumStrontiumThallium
TinTungstenVanadiumZinc
Bioassaytest compound
A1C13
SbCl3
NaAsO2
CdCl2
Co(NCM2
Cr03
CuSC-4Ge02
LaCl3
PbCl2
MnCl2
HgCl2
Na2MoO4
NiCl2
AgN03
Na2SeO4
SrCl2
T1C13
SnCl2
Na2WO4
V205
ZnCl2
Concentration*in coal, ppm
10,440—12,9000.50—1.264.45-14.020.47—2.522.90—9.57
13.75—18.00
8.30-15.161.00—6.593.80—10.004.90—34.78
33.80-49.400.12—0.20
5.00-7.5416.00—21.070.03-0.122.08-2.20
10.00—23.000.29—2.00
0.03-4.790.10—3.00
28.50-32.7146—272
*The majority of values are from Ruch,Gluskoter, and Shimp (1974), Fulkerson et al.(1975), and Carter (1975) and represent means formultiple coal samples taken largely from western•Kentucky and southern Illinois. Lower means forAg, Tl, Sn, and W are from Lloyd (1976), and theupper mean for Ag is from Vaughan et al. (1975).
liter/hr, giving a detention time of 42 hr. Water was discharged fromthe settling chamber into an overflow-equipped effluent reservoir.The ash-to-water ratio and the detention time were calculated toapproach conditions observed for a local ash-settling pond (Freemanand Birge, 1978). Also, the detention time was in good agreementwith times reported for a number of TVA ash ponds (Chu, Ruane,and Steiner, 1976). Influent and effluent water samples were takenat 1- to 2-day intervals for 2000 hr of continuous operation toobserve changes in water-quality parameters. Determinations weremade on pH, conductivity, alkalinity, and total dissolved solids, and

AQUATIC TOXICOLOGY OF TRACE ELEMENTS 223
analyses were performed for seven selected metals (Ag, Al, Cd, Cu,Hg, Ni, and Zn). Alkalinity and total dissolved solids were deter-mined according to standard methods (American Public HealthAssociation, 1975), and metals were analyzed by atomic absorptionspectrophotometry. Fly ash displayed good settling characteristics,and effluent water was essentially free of ash participates. The fly-ashbed compacted sufficiently to impede interstitial percolation, limit-ing water movement primarily to surface flow. Through the first 770hr of operation, influent water was distilled and deionized and had aconductivity less than 0.25 jumhos/cm and a pH of 6.8. Totaldissolved solids and trace metals were not detectable. During theremainder of the leaching period, the settling chamber was suppliedwith carbon-filtered tap water, which had a pH of 7.1 to 7.9,conductivity of 141 to 252 jumhos/cm, alkalinity of 54 to 70 ppmCaCO3, and total dissolved solids of 0.19 to 0.24 g/liter. Watertemperatures ranged from 24.4 to 26.0°C.
Bioassay Monitoring of Fly-Ash Effluent
Continuous-flow bioassays were performed on the simulated asheffluent to evaluate toxicological properties of the aqueous leachates.Eggs of the goldfish (Carassius auratus), redear sunfish (Lepomismicrolophus), leopard frog (Rana pipiens), and Fowler's toad (Bufofowleri) were used as test organisms. Full-strength effluent and serialdilutions thereof were perfused continuously through 300-ml eggchambers at flow rates of 200 to 300 ml/hr. Effluent dilutions of0.1, 0.01, 0.001, and 0.0001 were achieved with a proportionaldiluter (Freeman and Birge, 1978). Exposure was maintained fromfertilization through hatching, and results were expressed as percentsurvival (hatchability). Hatching times averaged 1.5 days for Fowler'stoad, 2.5 days for the leopard frog, and 3 days for sunfish andgoldfish. Minimum sample size was set at 100 eggs. Control eggchambers received the same influent water as that supplied to thesimulated ash-settling pond. Bioassays were initiated after 522, 1033,and 1775 hr of continuous aqueous leaching of the original 52-kgfly-ash sample.
RESULTS
Embryo-Larval Bioassays
Fish and amphibian eggs were exposed to each of 22 selectecoal elements (Table 1) from fertilization through 4 days poshatching, giving treatment periods of 28 days for trout and 7 da\for the narrow-mouthed toad and goldfish. Probit-derived LC? 0 an.

224 BIRGE
LCj values expressed in parts per million and parts per billion,respectively, are summarized in Table 2. In order of decreasingtoxicity, on the basis of LCSO determinations, the 12 elements mostlethal to trout were Hg, Ag, La, Ge, Ni, Cu, Cd, V, Tl, Pb, Cr, and Sr.The LCSO values were 0.005, 0.01, and 0.02 for Hg, Ag, and La,respectively; 0.05 for Ge and Ni; 0.09 for Cu; 0.13 for Cd; and 0.16to 0.20 for V, Tl, Pb, Cr, and Sr. The calculated LC, 's for themore toxic elements were 0.2 for Hg and Ag, 0.4 for Ge, 0.6 for Ni,0.8 for La, 1.8 for Cu, 2.5 for Pb, and 6.0 to 6.1 for Sr and Cd(Table 2).
The goldfish was the least sensitive of the three test species. The12 elements most toxic to goldfish eggs were Ag, Hg, Al, Cd, As, Cr,Co, Pb, Ni, Sn, Zn, and V. The LC50 values were 0.03, 0.12, 0.15,0.17, 0.49, 0.66, 0.81, and 1.66 for the first eight, respectively; 2.14for Ni and Sn; 2.54 for Zn; and 4.60 for V. The LCj values obtainedfor these metals ranged from as low as 0.4 and 0.6 ppb for Al and Agto 400 ppb for Zn. Certain coal elements (e.g., Ag and Hg) weremore toxic to fish embryos; others (e.g., Al, Cd, Ge, and Pb)exhibited considerable toxicity to posthatched juveniles.
In bioassays with the narrow-mouthed toad, the 12 most lethalelements were Hg, Ag, Zn, Cr, Pb, Cd, Cu, As, Ge, Co, Ni, and Al.The LC50 values were 0.001, 0.01, 0.01, and 0.03 ppm for the firstfour elements, respectively; 0.04 ppm for Pb, Cd, Cu, and As; and0.05 ppm for Ge, Co, Ni, and Al. The calculated LCj 's rangedonly from 0.1 and 0.6 ppb for Hg and Ag to 1.6 and 3.2 ppb for Cdand Pb.
The LCS o values were averaged for all animal species (Table 3) toprovide a simplified toxicological index for the 22 elements. Thismean toxicity index provided a convenient ranking, consisting ofthree general toxicity groups. Group 1 included ten highly toxicelements with mean LC50 values below 1 ppm; group 2 includednine elements with LC5 0 values of 1 to 5 ppm; and group 3 includedthree elements with an LC5 0 range of 20 to 47 ppm.
The selected coal elements were also ranked according to a mostsensitive species index (Table 3) based on median lethal concentra-tions determined for the animal species exhibiting highest sensitivityto each of the 22 elements. The LC5 0 values ranged from 0.001 ppmHg to 2.90 ppm W. Elements with approximately the same LC5 0concentration were further differentiated on the basis of LCi values.
Aqueous Leaching of Fly Ash
A 52-kg sample of precipitator-collected fly ash was subjected tocontinuous washing for 2000 hr at a flow rate of 1 liter'hr.

AQUATIC TOXICOLOGY OF TRACE ELEMENTS
TABLE 2
COAL-ELEMENT LC, ANDLC5 0 VALUESWITH 95% CONFIDENCE LIMITS
Elementand
animal species
AluminumTroutGoldfishToad
AntimonyTroutGoldfishToad
ArsenicTroutGoldfishToad
CadmiumTroutGoldfishToad
ChromiumTroutGoldfishToad
CobaltTroutGoldfishToad
CopperTroutGoldfishToad
GermaniumTroutGoldfishToad
LanthanumTroutGoldfishToad
LeadTroutGoldfishToad
ManganeseTroutGoldfishI'oad
. _ Confidence limit _ c
ppm
0.560.150.05
0.5811.30.30
0.540.490.04
0.130.170.04
0.180.660.03
0.470.810.05
0.095.200.04
0.055.600.05
0.0260.4
0.29
0.181.660.0-1
2.91*v22I -12
Lower
0.400.020.04
0.343.990.18
0.420.390.02
0.100.130.03
0.070.400.03
0.380.270.02
0.054.130.03
0.031.760.03
0.0130.3
0.19
0.100.850.02
1.N52.390 ,-1 \
Upper
0.700.820.08
0.9255.0
0.51
0.670.610.07
0.180.210.05
0.311.100.04
0.582.270.08
0.156.410.05
0.077.840.08
0.0-1105
0.43
0.323.050.07
1.372-1.6
2 !D
ppb
2560.42.3
28.6111
3.8
39.715.5
1.6
6.115.01.6
19.18.11.0
34.26.80.9
1.8299
1.0
0.4143
1.2
0.81987
7.5
2.514.6
3.2
3hb2 1 . :>
'} 0
Confidence limit
-\- Lower
52.70.00.7
4.60.10.7
15.57.50.2
1.84.40.9
0.41.50.6
13.80.00.3
1.0101
0.3
0.12.70 1
0.0136
2.3
U.21.40.1
66 20 1: ' ~
Upper
3715.64.8
72.2663
10.7
71.626.6
4.4
12.919.22.5
56.522.1
1.5
60.842.6
2.0
4.5571
1.3
0567
3>
2 76503
16.2
8.!53.1
9.1
800I h 2
9 X

226 B I R G E
TABLE 2 (Continued)
Elementand
animal species
MercuryTroutGoldfishToad
MolybdenumTroutGoldfishToad
NickelTroutGoldfishToad
SeleniumTroutGoldfishToad
SilverTroutGoldfishToad
StrontiumTroutGoldfishToad
ThalliumTroutGoldfishToad
TinTroutGoldfishToad
TungstenTroutGoldfishToad
VanadiumTroutGoldfishToad
ZincTroutGoldfishToad
j _, Confidence limit
ppm
0.0050.120.001
0.7360.0
0.96
0.052.140.05
4.188.780.09
0.010.030.01
0.208.580.16
0.177.000.11
0.402.140.09
15.61120
2.90
0.164.600.25
1.062.540,01
Lower
0.0040.100.001
0.307.940.58
0.041.190.03
2.827.230.08
0.010.020.01
0.102.110.12
0.091.940.09
0.230.360.08
6.7192.3
2.44
0.070.510.13
0.751.590.01
Upper
0.0050.140.002
1.4092.2
1.60
0.063.630.09
5.8210.60.15
0.020.030.03
0.3821.2
0.21
0.309.960.14
0.673.450.13
31.98156
3.50
0.309.100.44
1.394.180.04
LC,,ppb
0.214.30.1
22.339.33.1
0.655.8
0.4
79.5506
5.0
0.20.60.6
6.045.3
2.4
8.452.5
2.4
15.568.8
1.7
828345
10.7
6.955.2
7.4
20.0400
0.6
Confidence limit
Lower
0.18.20.0
1.20.90.6
0.27.90.0
17.5267
0.7
0.10.40.0
0.30.01.0
0.71.11.1
2.10.00.3
14.24.74.5
0.30.00.6
5.726.5
0.0
Upper
0.321.2
0.3
83.4261
9.5
1.2160
1.5
202805
7.3
0.40.92.0
19.9396
4.6
24.8266
4.5
42.5390
4.5
28102139
21.2
22.8116
23.0
33.2500
2.2

AQUATIC TOXICOLOGY OF TRACE ELEMENTS 227
TABLE 3
COMPARATIVE TOXICITY OF COALELEMENTS TO FISH AND AMPHIBIAN
EMBRYO-LARVAL STAGES
Mean toxieity index* Most sensitive species index
Element
Toxicity group 1SilverMercuryCadmiumAluminumCobaltArsenicChromiumLeadNickelTin
Toxicity group 2ZincVanadiumCopperGermaniumThalliumStrontiumAntimonyManganeseSelenium
Toxicity group 3LanthanumMolybdenumTungsten
LCso,ppm Element
0.020.040.110.250.290.360.450.620.750.88
1.201.671.781.902.432.984.074.184.35
20.2520.5647.17
MercurySilverZincLanthanumChromiumCopperCadmiumArsenicLeadNickelCobaltGermaniumAluminumTinSeleniumThalliumStrontiumVanadiumAntimonyMolybdenumManganeseTungsten
Species
ToadTroutToadTroutToadToadToadToadToadTroutToadToadToadToadToadToadToadTroutToadTroutToadToad
LCso,ppm
0.0010.010.010.020.030.040.040.040.040.050.050.050.050.090.090.110.160.160.300.731.422.90
LC,,ppb
0.10.20.60.81.01.01.61.63.20.60.91.22.31.75.02.42.46.93.8
22.33.0
10.7
*LC5o values at 4 days posthatching averaged for three species,narrow-mouthed toad, goldfish, and rainbow trout.
Detention time was 42 hr, and water-quality parameters were plottedand averaged for each of four 500-hr elution intervals. Totaldissolved solids, conductivity, and pH showed marked decreasesduring the first 100 hr of elution time {Fig. 1). Total dissolvedsolids decreased from 2.2 g/liter at 18 hr to 0.5 g/liter at 94 hr,averaging 0.56 g/liter for the first 500 hr. Conductivity (jUmhos)decreased from 2400 at 20 hr to 900 at 94 hr and continued to dropslowly to 200 at 500 hr. The sharpest decline was observed for pH,which decreased from 7.7 at 1 hr to about 4.0 at 18 hr, averaging 4.3

228 BIRGE
8.0
,pH
A , Total dissolved solids
• , Conductivity
100 200 300FLY ASH LEACHING TIME, hr
400 5000.0
Fig. 1 Changes in fly-ash effluent with leaching time.
for the first elution interval. As seen in Fig. 1, changes in theseeffluent parameters were most pronounced during the initial 4 daysof ash-leaching time, presumably correlating with the period duringwhich leachable components were most rapidly removed from the flyash. Mean, values for the first 500 hr are given in Table 4.
Midway in the second elution interval, at 770 hr, the influent• source was changed to carbon-filtered tap water. This action was
taken to determine whether influent water of higher pH and greaterbuffering capacity would alter the leaching process. Initially,conductivity and total dissolved solids of the effluent rose propor-tionately with increases observed for the new influent water, butvalues for these parameters declined steadily over the third andfourth elution intervals, closely approaching those obtained forinfluent water by 2000 hr (see Materials and Methods section). Afterthe change to influent tap water, effluent pH for the second elutioninterval increased steadily from 4.5 to 7.1. A gradual increasecontinued thereafter, and, during the last two elution intervals, pHranges of 7.1 to 7.9 and 7.0 to 7.7 were recorded for influent andeffluent water, respectively. Although total alkalinity was notdetermined during the first 1000 hr, ranges for the third and fourthelution intervals were 32 to 55 and 46 to 62 ppm CaCO3, comparedwith 54 to 69 ppm for influent tap water. After 2000 hr ofcontinuous washing of the original fly-ash sample, influent and

AQUATIC TOXICOLOGY OF TRACE ELEMENTS 229
TABLE 4
CHARACTERISTICS OF SIMULATED ASH-POND EFFLUENT
Characteristic Simulated effluent* TVA range*
Total dissolved solids, g/literpHConductivity, /jmhos/cmAlkalinity, $ mg/liter CaCO3Ag, Mg/literAl, mg/literCd, Mg/literCu, Mg/literHg, Mg/literNi, Mg/literZn, Mg/literInput, ml/hrOutput, ml/hr% evaporation
0.56 ±0.174.3 ±0.1
690 + 8043 + 32.1 ± 0.9
32.6 + 6.1156 + 35110 + 261.8 + 0.5
155 ±16350 ± 33969 + 10897 + 18
8 + 2
0.14—0.524.4—11.3
242—85540—154
1.4-7.21-37
10—3100.2-3831—110030—1510
*Mean ± standard error for initial 500 hr of continuous operation.tRange of mean values for 14 TVA ash ponds (Chu, Ruane, and Steiner,
1976).I Alkalinity determined for the third 500-hr elution interval.
effluent water did not differ substantially in pH, alkalinity, conduc-tivity, or total dissolved solids.
Effluent concentrations for the seven selected metals monitoredthrough 1500 hr are summarized in Table 5. Maximum concentra-tions, which in most instances were observed during the first 100 hrof elution time, were 126 ppm Al, 766 ppb Zn, 518 ppb Cu, 500 ppbCd, 370 ppb Ni, 87 ppb Hg, and 8 ppb Ag. Mean concentrations forthe first 500 hours were 32.6 ppm Al, 350 ppb Zn, 156 ppb Cd, 155ppb Ni, 110 ppb Cu, 2.1 ppb Ag, and 1.8 ppb Hg. The 500-hr elutiorpatterns for Al, Cu, Ni, and Zn are illustrated in Fig. 2. Elevafconcentrations observed at about 300 hr correlated with mechanicdisturbances that temporarily facilitated water filtration through thefly-ash bed. Concentrations for all metals except mercury continuedto decline progressively with further leaching time, resulting in meanvalues for the third elution interval of 540 ppb Al, 61.4 ppb Zn, 33.6ppb Ni, 25.7 ppb Cd, 4.1 ppb Cu, and 0.2 ppb Ag (Table 5). Mercun.fluctuated from 0.3 to 7.4 ppb during the first 500 hr but increaseisubstantially thereafter, with mean values of 27.4 and 14.9 ppb fo<the second and third elution intervals. However, the mercury leveidropped markedly toward the end of the third elution period,averaging 2.6 + 0.7 ppb after 1360 hr. Metals were not detected ir

23d BIRGE
TABLE 5
METAL CONCENTRATIONS FOR FLY-ASH EFFLUENT
Element
AgAlCdCuHgNiZn
Maximum
tration, ppb
8126,000
50051887
370766
Mean concentration for three elution intervals, ppb*
0—500 hr
2.1 ±0.932,600 + 6,100
156 ± 35110+ 261.8 ±0.5
155 + 16350 + 33
500—1000 hr
0.2 + 0.21,570 ±260
93.8 + 24.814 + 1.8
27.4 + 11.758 + 10
106 ± 20
1000— 1500 hr
0.2 + 0.2540 + 8025.7 ± 11.34.1 ± 0.8
14.9 + 5.333.6 + 2.361.4 +4.1
Influentconcen-
tration, ppb
0.0230 ± 291.7 + 0.83.5 ± 0.90.03.3 + 1.44.9 + 3.1
*Mean values with standard errors were based on analyses taken at 1- to 3-day intervals.
100 200 300FLY ASH LEACHING TIME, hr
400 500
Fig. 2 Leaching patterns for fly-ash metals.
the distilled—deionized influent water used for the first 770 hr, andbackground values for the carbon-filtered tap water are given inTable 5.
Bioassay Analysis of Fly-Ash Effluent
Four sets of embryo—larval bioassays were performed on fly-asheffluent by use of a continuous-flow system. Tests were initiated

AQUATIC TOXICOLOGY OF TRACE ELEMENTS 231
after 522, 1033, and 1775 hr of continuous aqueous leaching of theoriginal 52-kg sample of precipitator-collected fly ash. At 522 hrtests were conducted on eggs of the leopard frog and Fowler's toadwith undiluted ash effluent. Prog eggs suffered rapid and completemortality, and a hatching frequency of 46% was observed forFowler's toad. Survival was 97 to 99% for control populationstreated with the same influent water source used to supply the fly-ash leaching chamber (Table 6). Bioassays were initiated at 1033 hron eggs of the redear sunfish. Undiluted effluent produced completemortality, and 0.1 and 0.01 dilutions gave survival frequencies of 42and 90%, which closely approached control survival. In tests withgoldfish eggs conducted at 1775 hr, survival averaged 57, 76, and88% for undiluted effluent and 0.1 and 0.01 dilutions, respectively.Control survival was 92%.
Effluent metal concentrations observed for the amphibianbioassays approximated mean values given for the second elutioninterval (Table 5). Although ash toxicants produced a near-LC50
response for toad eggs, the exposure period was limited to only 1.5days. In addition, developmental stages of Fowler's toad are highlyresistant to trace metals, compared with other amphibian and piscinespecies (Birge, 1976). Animal species used for the initial toxicological
TABLE 6
EMBRYO-LARVAL BIOASSAYS ON FLY-ASH EFFLUENT
Species
Leopard frog(Rana pipiens)
Fowler's toad(Bufo fowleri)
Redear sunfish(Lepomixmicrolophux)
Goldfish(Carasxiusaura tun)
Elutioninterval,
hr
522-582
522-558
1033—1105
1775-1847
Exposuretime,days
2.5
1.5
3.0
3.0
Bioassaysolution
Ash effluentControlAsh effluentControlAsh effluentDiluted effluent
0.10.010.0010.0001
ControlAsh effluentDiluted e f f luen t
0.10.01
Control
Percentsurvival
at hatching
0974699
0
429093958957
768892

232 BIRGE
characterization of coal elements were not available for the first twosets of effluent bioassays. Sunfish eggs, however, have the samehatching time (exposure period) as goldfish and generally exhibitsimilar sensitivity when used in aquatic bioassays (Birge, Black,and Westerman, 1978). During the exposure period for sunfish eggs,mean effluent metal concentrations, with standard errors, were0.4 ± 0.2 ppb Ag, 1070 ± 230 ppb Al, 72.0 ± 43.0 ppb Cd, 5.5 ± 1.8ppb Cu, 20.6 ± 4.8 ppb Hg, 31.5 ± 1.4 ppb Ni, and 70.0 ± 6.7 ppbZn. At the 0.1 dilution, which gave 42% survival for sunfish eggs(Table 6), all analyzed metals except aluminum were well belowgoldfish LC! values. Aluminum was present at approximatelytwo-thirds of the LCSO value. Although the effluent was notanalyzed for all possible toxicants, this correlation tends to supportapplication of the toxicological index given for coal elements(Tables 2 and 3). Before the goldfish bioassays were initiated,effluent metal concentrations had dropped to 0 ppb Ag, 160 ± 10ppb Al, 1.5 ±1.5 ppb Cd, 4.5 ± 1.8 ppb Cu, 3.8 ± 0.7 ppb Hg,23.0 ± 3.0 ppb Ni, and 44.5 ± 8.0 ppb Zn. These values were allbelow LCi 's calculated for goldfish, except aluminum, which waspresent at about the LC50 level (Table 2). The undiluted effluentgave 57% survival.
DISCUSSION
The embryo—larval bioassays reported in Table 2 demonstrate'the high toxicity of numerous inorganic coal elements to aquaticbiota. Depending on the animal species, LC50 values of 0.1 ppm orless were observed for 15 coal elements, and calculated LC] 'sranged down, to 0.1 to 0.2 ppb for mercury and silver. Tungsten wasthe least toxic element in all cases, with LC50 values ranging from2.90 ppm for the toad to 120 ppm for the goldfish. When the test
1 data were averaged, the increasing order of sensitivity of animalspecies was goldfish, trout, and toad.
The order of toxicity of the 22 elements, as determined by LC50
values, varied somewhat for embryo—larval stages of the threespecies. Only Ag, Cd, Cr, Hg, Ni, and Pb occurred among the 12 mosttoxic elements for all three, but Al, As, Co, Cu, Ge, V, and Zn wereincluded in this group for two species (Table 2). Of particularinterest were the consistent extreme toxicity of mercury and silver todevelopmental stages of all species and certain selective responses,such as the high relative toxicity of aluminum to goldfish, germa-nium and lanthanum to trout, and selenium and zinc to the toad.

AQUATIC TOXICOLOGY OF TRACE ELEMENTS 233
100 H£
0 -
0.0001 0.001 0.01 0.1SILVER CONCENTRATION, ppm
Fig. 3 Effects of silver on embryo—larval stages.
1.0
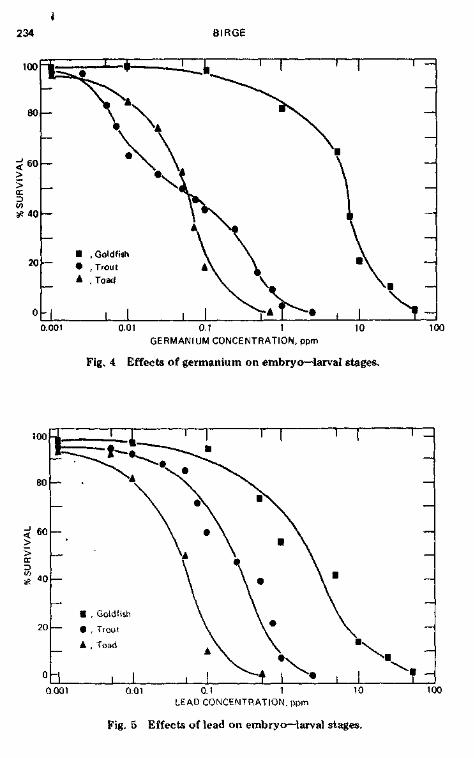
Several patterns of response were discernible concerning thedifferential sensitivity of the three test organisms. Highest uniformitywas obtained for silver, which gave an exceptionally narrow range ofLC50 values (0.01 to 0.03 ppm). As seen in Fig. 3, this relationshipheld for the full range of exposure concentrations. Germaniumproduced similar effects on the two most sensitive test animals, troutand toads, but was substantially less toxic to the goldfish (Fig. 4).This same pattern was given by Cu, Mo, Ni, Sb, Sr, Tl, and V. A stillmore heterogeneous response occurred for Pb (Fig. 5), Hg, andcertain other elements (e.g., La, Sn, and W). Considering the responsepatterns summarized in Figs. 3 to 5, it is probable that the diversity ofaquatic species affected by pollution would increase in the order ofPb, Ge, and Ag. Although elements such as Pb and Ge likelywould affect fewer species, these toxicants probably would con-tribute to an ecological imbalance of aquatic biota. As noted, Se,Zn, and certain other elements (e.g., As and Co) were more selectivefor the toad, and, on the basis of LC5 0 values, the toad was the mostsensitive species for 17 of the 22 elements. This suggests thatamphibians may constitute particularly sensitive target sites for cordcontaminants. For example, goldfish LCS (l determinations forselenium and zinc exceeded those for the toad about 100 and 250times, respectively.
234 BIRGE
0 -
0.001 0.01 0.1 1GERMANIUM CONCENTRATION, ppm
Fig. 4 Effects of germanium on embryo—larval stages.
100
100
0 -I
0.001 0.01 0.1 1LEAD CONCENTRATION, ppm
100
Fig. 5 Effects of lead on embryo—larval stages.

AQUATIC TOXICOLOGY OF TRACE ELEMENTS 235
The heterogeneity of response observed for the three animalspecies somewhat complicates application of the bioassay data oncoal elements to impact assessment and pollution-abatement tech-nology. Therefore, the mean LCS 0 and sensitive species indexes(Table 3) were developed to provide a simplified data base for energyand environmental engineers. The sensitive-species ranking for coalelements was used to delineate upper limits of toxicity observed forthe 66 independent bioassays, and the mean index summarizedaverage test responses. Despite some notable exceptions (e.g., Al andLa), the toxicological orders given in the two indexes were generallysimilar. Principal differences in relative order were attributed toelements exhibiting disproportionate selective toxicity for a particu-lar animal species. The only extreme disparity involved lanthanum,for which mean and sensitive species LC50 values differed by threeorders of magnitude. We should note that several recent publicationsreview additional bioassay data for some of the trace metals found incoal (National Academy of Sciences—National Academy of Engineer-ing, Committee, 1973; Vaughan et al., 1975; Environmental Protec-tion Agency, 1976).
In the fly-ash leaching study, characteristics of the simulatedeffluent were compared with those recorded for 14 TVA ash ponds.As seen in Table 4, good agreement was obtained for all testparameters except aluminum and cadmium, but concentrations forthese metals were within TVA ranges early in the third elutioninterval. The high initial values for aluminum and cadmium may haveresulted from use of distilled influent water, which contributed tolow pH in the simulated ash pond. These and other results indicatethat the quality of effluent water may be improved somewhat byregulating certain parameters (e.g., pH and alkalinity) of influentwater used for ash sluicing.
Appreciable metal leaching continued, however, even after 770hr, when the change was made in influent water (Table 5). Theresulting suite of toxic metals produced lethality of test organismsthrough 1775 to 1847 hr of continuous elution time (Table 6).Effluent metal concentrations (Table 5) were compared to fresh-water guidelines (National Academy of Sciences—National Academyof Engineering, Committee, 1973; Environmental Protection Agency,1976) to further evaluate potential effects of fly-ash leaching onaquatic biota. Through 1775 hr, mercury remained well above thelimit of 0.05 ppb, and aluminum exceeded the 100-ppb levelconsidered deleterious to growth and survival of fish. Cadmium wasover the trout standard of 0.4 to 1.2 ppb for 1775 hr and exceededthe maximum limit for other aquatic species (4 to 12 ppb) for 1050

236 BIRGE
to 1435 hr. On the basis of the Environmental Protection Agency's(EPA) application factor (0.01) and the trout, toad, and goldfishembryo—larval LCS 0 values, nickel and zinc concentrations exceededrecommended levels for all test species through 1775 hr, and silverwas above acceptable limits for 1050 to 1266 hr. Copper, with anapplication factor of 0.1, exceeded calculated concentrations fortrout and toad through 1000 to 1500 hr but was over the goldfishlimit for only 22 hr. Using embryo—larval rather than adult LCSO
values resulted in more stringent limits for Ag, Cu, Ni, and Zn.However, freshwater standards should permit adequate protectionfor sensitive life-cycle stages. Except for copper, the suggested EPAapplication factors appeared acceptable for embryo—larval stages. Onthe basis of data in Table 2, 0.01 to 0.05 of LC5 0 determinationsgave values that generally fell within or near 95% confidence limitsfor LC, 's. In comparison with the EPA value of 0.1, a more suitableapplication factor for copper was found to be 0.05 for goldfish andtrout and 0.01 for the toad.
Since combined toxicological effects of complex suites of tracemetals are difficult to quantify by existing hazard-assessment criteria,direct bioassay monitoring was used to provide further characteriza-tion of ash effluent. As noted, after 1033 hr of continuous elution,undiluted ash effluent produced 100% mortality of sunfish eggs, andsurvival of goldfish eggs was reduced to 57% when exposure wasinitiated at 1775 hr. A 0.1 dilution produced an approximate LC50
for sunfish, and 0.01 gave essentially control-level survival for bothspecies. When median survival was obtained, concentrations of allmonitored metals except aluminum were at or below goldfish LCjvalues, and aluminum was present at about the LC50 level (Table 2).Effluent dilutions that gave control-level survival did not contain anymonitored metals at concentrations exceeding goldfish LC] values.Although ash effluent was not analyzed for all possible toxicants,results obtained by direct effluent monitoring were in goodagreement with the independent embryo—larval bioassays for coalelements. Also, trace metals present at or below the probit LCi 's didnot exert any overt synergistic effects. In addition, results indicatethat continuous-flow embryo—larval test systems are highly suitablefor in situ toxicological monitoring of complex coal effluents.
Although not intended to serve in lieu of actual field studies,simulated ash ponds can be used to characterize aqueous leachingprocesses and to evaluate ash effluents for potential environmentalhazards. Test parameters can be manipulated individually to deter-mine effects on metal elution rates, and such model systems can beparticularly useful in comparing ash residues of coal from different

AQUATIC TOXICOLOGY OF TRACE ELEMENTS 237
formations. The chemical composition of bottom and fly ash ishighly variable, depending on the source of the coal used, combus-tion conditions, and such factors as the efficiency of emission -control equipment (Moulton, 1973; Chu, Nicholas, and Ruane, 1975;Cooper, 1975). In addition to differences in ash composition,numerous physical and chemical factors may affect the leaching oftrace elements and the final composition of ash-pond water. Thesefactors include the quantity of water used for sluicing; its tempera-ture, pH, and hardness; and various performance characteristics ofthe settling pond. As noted by Chu, Nicholas, and Ruane (1975), theeffects of such variables on the quality of ash-pond effluents are notsufficiently understood. It is known, however, that a number ofcoal-derived inorganic elements reach appreciable concentrations inash-pond waters. Since 1973, TVA has analyzed for 17 traceelements in quarterly grab samples from bottom ash, fly ash, andcombined ash ponds, and the results have been summarized by Chuand co-workers (Chu, Nicholas, and Ruane, 1975; Chu, Krenkel, andRuane, 1976). Discharges from fly-ash ponds were reported tocontain up to 7.3 ppm Al, 0.3 ppm Ba, 0.04 ppm Cd, 0.1 ppm Cr,0.3 ppm Cu, 0.08 ppm Pb, 13.4 ppm Mn, 1.1 ppm Ni, and 1.5 ppmZn. Ranges for a number of these metals are summarized in Table 4.
Other investigators also have considered various problemsassociated with fly-ash disposal (Guthrie, Cherry, and Rodgers, 1974;Theis, 1975: Holland et al., 1975). Theis (1975) indicated that theproduction of metal leachates and alterations of pH and dissolvedoxygen may affect receiving waters. He also demonstrated significantrelease rates for trace metals when fly ash was dispersed in distilledwater. Holland et al. (1975) investigated the environmental effects oftrace elements in the pond disposal of ash and flue-gas desulfuriza-tion sludge. Samples of ash and sludge from five generating stationswere studied by simulated ponding. In general, concentrations ofaqueous leachates were low, but Ba, B, Cr, Hg, and Se exceeded EPAguidelines for public water supplies. However, these investigators didnot compare their findings with EPA standards for freshwater biota,which generally are more stringent, and they did not consider thecombined toxic effects of the resulting metal mixtures. Guthrie,Cherry, and Rodgers (1974) evaluated the impact on biota inwaters receiving ash-basin effluent from a coal-fired power plant.Bacterial, plant, and animal diversities were reduced at sites affectedby ash effluents. Abiotic water parameters affected by ash-basineffluents included temperature, turbidity, dissolved oxygen, and pH.Concentrations of coal-ash leachates (e.g., Cd, Cr. Cu, Hg, and Zn)were lowest in effluent water, somewhat greater in aquatic biota, and
238 BIRGE
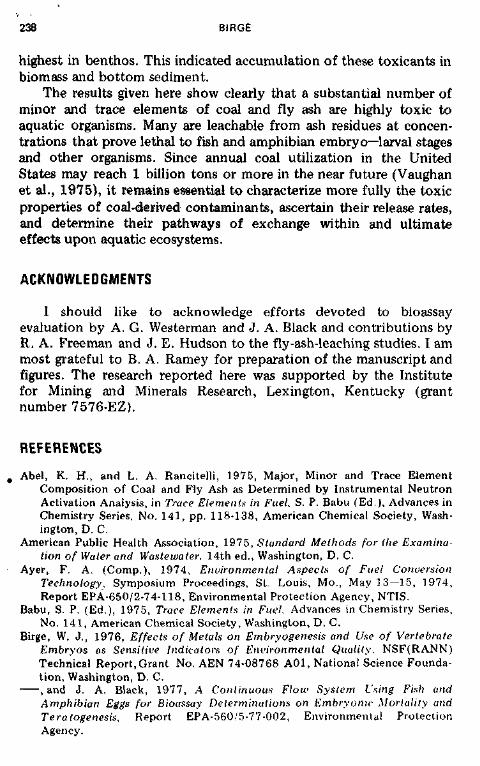
highest in benthos. This indicated accumulation of these toxicants inbiomass and bottom sediment.
The results given here show clearly that a substantial number ofminor and trace elements of coal and fly ash are highly toxic toaquatic organisms. Many are leachable from ash residues at concen-trations that prove lethal to fish and amphibian embryo—larval stagesand other organisms. Since annual coal utilization in the UnitedStates may reach 1 billion tons or more in the near future (Vaughanet al., 1975), it remains essential to characterize more fully the toxicproperties of coal-derived contaminants, ascertain their release rates,and determine their pathways of exchange within and ultimateeffects upon aquatic ecosystems.
ACKNOWLEDGMENTS
I should like to acknowledge efforts devoted to bioassayevaluation by A. G. Westerman and J. A. Black and contributions byR. A. Freeman and J. E. Hudson to the fly-ash-leaching studies. I ammost grateful to B. A. Ramey for preparation of the manuscript andfigures. The research reported here was supported by the Institutefor Mining and Minerals Research, Lexington, Kentucky (grantnumber 7576-EZ).
REFERENCES
Abel, K. H., and L. A. Rancitelli, 1975, Major, Minor and Trace ElementComposition of Coal and Fly Ash as Determined by Instrumental NeutronActivation Analysis, in Trace Elements in Fuel. S. P. Babu (Ed.), Advances inChemistry Series, No. 141, pp. 118-138, American Chemical Society, Wash-ington, D. C.
American Public Health Association, 1975, Standard Methods for the Examina-tion of Water and Wastewater, 14th ed., Washington, D. C.
Ayer, F. A. (Comp.), 1974, Environmental Aspects of Fuel ConversionTechnology, Symposium Proceedings, St. Louis, Mo., May 13—15, 1974,Report EPA-650/2-74-118, Environmental Protection Agency, NTIS.
Babu, S. P. (Ed.), 1975, Trace Elements in Fuel. Advances in Chemistry Series,No. 141, American Chemical Society, Washington, D. C.
Birge, W. J., 1976, Effects of Metals on Embryogenesis and Use of VertebrateEmbryos as Sensitive Indicators of Environmental Quality, NSF(RANN)Technical Report, Grant No. AEN 74-08768 A01, National Science Founda-tion, Washington, D. C., and J. A. Black, 1977, A Continuous Flow System Using Fish andAmphibian Eggs for Bioassay Determinations on Embryonic Mortality andTeratogenesis, Report EPA-560/5-77-002, Environmental ProtectionAgency.

AQUATIC TOXICOLOGY OF TRACE ELEMENTS 239
, J. A. Black, and A. G. Westerman, 1978, Embryo—Larval Bioassays withGoldfish and Redear Sunfish, unpublished data., and J. J. Just, 1975, Bioassay Procedures Using Developmental Stages asTest Organisms, Research Report No. 84, U. S. Department of the Interior,Washington, D. C.
Bolton, N. E., et al., 1975, Trace Element Mass Balance Around a Coal-FiredSteam Plant, in Trace Elements in Fuel, S. P. Babu (Ed.), Advances inChemistry Series, No. 141, pp. 175-187, American Chemical Society, Wash-ington, D. C.
Carter, J. A., 1975, Trace Element Composition of Coal-Derived Materials(NSF—RANN), in Coal Technology Program Quarterly Progress ReportNo. 1 for the Period Ending December 31, 1974, pp. 66-69, ERDA ReportORNL-5026, Oak Ridge National Laboratory, NTIS.
Chu, T. J., P. A. Krenkel, and R. J. Ruane, 1976, Characterization and Reuse ofAsh Pond Effluents in Coal-Fired Power Plants, paper presented at 49thAnnual Water Pollution Control Federation Conference, Minneapolis, Minn.,Oct. 3-8, 1976.
-—, W. R. Nicholas, and R. J. Ruane, 1975, Complete Reuse of Ash PondEffluents in Fossil-Fueled Power Plants, paper presented at 68th AnnualMeeting of the American Institute of Chemical Engineers, Los Angeles,Calif., Nov. 16—20, 1975., R. J. Ruane, and G. R. Steiner, 1976, Characteristics of WastewaterDischarges from Coal-Fired Power Plants, paper presented at the 31st AnnualPurdue Industrial Waste Conference, Purdue University, West Lafayette,Ind., May 4—6, 1976.
Cooper, H. B., Jr., 1975, The Ultimate Disposal of Ash and Other Solids fromElectric Power Generation, in Water Management by the Electric PowerIndustry, E. F. Gloyna, H. H. Woodson, and H. R. Drew (Eds.), pp. 183-195,Water Resources Symposium No. 8, Center for Research in Water Resources,The University of Texas, Austin.
Daum, R. J., 1969, A Revision of Two Computer Programs for Probit Analysis,Bull. Entomol. Soc. Am., 16: 10-15.
Environmental Protection Agency, 1974, Steam Electric Power Generating PointSource Category, Report EPA-440/1-74 029-a, group 1, EnvironmentalProtection Agency, GPO.
—-, 1976, Quality Criteria for Water, Washington, D. C.Freeman, R. A., and W. J. Birge, 1978, Aqueous Leaching of Toxic Metals from
Coal-Produced Fly Ash, unpublished data.Fulkerson, W., et al., 1975, Allen Steam Plant Study, in Energy Division Annua l
Progress Report for Period Ending December 31, 1974, pp. 77-82, ERDAReport ORNL-5030, Oak Ridge National Laboratory, NTIS.
Guthrie, R. K., U. S. Cherry, and J. H. Rodgers, 1974, The Impact of Ash BasinEf f luen t on Biota in the Drainage System, in Mid Atlantic Industrial WasteConference, Vol. 7, pp. 17-43, Drexel University, Philadelphia, Pa.
Hildebrand, S. G., R. M. Cushman, and J. A. Carter, 1976. The Potent ialToxicity and Bioaccumulation in Aqua t ic Systems of Trace Elements Presentin Aqueous Coal Conversion E f f l uen t s , in Truce Substances in EnvironmentalHealth X. D. D. Hemphil! ( E d . ) , pp. 305-313, University of Missouri Press,Columbia, Mo.
Hol l and , W. F., K. A W i l d e , J. L. Parr, P. S. Lowell , and R. F. Pohler, 1975. TheEiu'irunmentul Effect* of Truce Elements in the Pnnd Disposal o/ ' .Wi and

,240 BIRGE
Flue Gas Desulfurization Sludge, prepared by Radian Corporation, Austin,Tex., for the Electric Power Research Institute, Palo Alto, Calif.
Lloyd, W. G., 1976, Mercury in Texas Coal Samples, unpublished report,Institute for Mining and Minerals Research, University of Kentucky,Lexington.
Moulton, L. K., 1973, Bottom Ash and Boiler Slag, in Information Circular No.8640, U. S. Bureau of Mines, Pittsburgh, Pa.
National Academy of Sciences—National Academy of Engineering Committee onWater Quality Criteria, 1973, Water Quality Criteria 1972, GPO.
Perkin—Elmer Corp., 1973, Analytical Methods for Atomic AbsorptionSpectrophotometry, Norwalk, Conn.
Rubin, E. S., and A. McMichael, 1974, Some Implications of EnvironmentalRegulatory Activities on Coal Conversion Processes, in EnvironmentalAspects of Fuel Conversion Technology, Symposium Proceedings, St. Louis,Mo., May 13-15, 1974, pp. 69-90, Report EPA-650/2-74-118, Environ-mental Protection Agency, NTIS.
Ruch, R. R., H. J. Gluskoter, and N. F. Shimp, 1974, Distribution of TraceElements in Coal, in Environmental Aspects of Fuel Conversion Technology,Symposium Proceedings, St. Louis, Mo., May 13—15, 1974, Report650/2-74-118, Environmental Protection Agency, NTIS.
Sheibley, D. W., 1975, Trace Elements by Instrumental Neutron ActivationAnalysis for Pollution Monitoring, in Trace Elements in Fuel, S. P. Babu(Ed.), Advances in Chemistry Series, No. 141, pp. 98-117, AmericanChemical Society, Washington, D. C.
Smith, I. C., T. L. Ferguson, and B. L. Carson, 1975, Metals in New and UsedPetroleum Products and By-Products—Quantities and Sequences, in TheRole of Trace Metals in Petroleum, T. F. Yen (Ed.), pp. 123-148, Ann ArborScience Pubs., Inc., Ann Arbor, Mich.
Theis, T. L., 1975, The Potential Trace Metal Contamination of Water ResourcesThrough the Disposal of Fly Ash, paper presented at 2nd NationalConference on Complete Water Reuse, American Institute of ChemicalEngineers and Environmental Protection Agency, Chicago, 111., May 4—8,1975.'
Vaughan, B. E., et al., 1975, Review of Potential Impact on Health andEnvironmental Quality from Metals Entering the Environment as a Result ofCoal Utilization, ERDA file No. NP-20585, Battelle Pacific Northwest Labs.,Richland, Wash.
Vitez, B., 1976, Trace Elements in Flue Gases and Air Quality Criteria, PowerEng., January: 56-60.
Yavorsky, P. M., and S. Akhtar, 1974, Environmental Aspects of CoalLiquefaction, in Environmental Aspects of Fuel Conversion Technology,Symposium Proceedings, St. Louis, Mo., May 13—15, 1974, pp. 325-330,Report EPA-650/2-74-118, Environmental Protection Agency, NTIS.