corporate bond valuations improve - hsbc...09/08/2018 investment monthly 2 source: hsbc global asset...
TRANSCRIPT

09 August 2018
This commentary has been produced by HSBC Global Asset Management to provide a high level overview of the recent economic and financial market environment, and is for information purposes only. The views expressed were held at the time of preparation; are subject to change without notice and may not reflect the views expressed in other HSBC Group communications or strategies. This marketing communication does not constitute investment advice or a recommendation to any reader of this content to buy or sell investments nor should it be regarded as investment research. The content has not been prepared in accordance with legal requirements designed to promote the independence of investment research and is not subject to any prohibition on dealing ahead of its dissemination. You should be aware that the value of any investment can go down as well as up and investors may not get back the amount originally invested. Furthermore, any investments in emerging markets are by their nature higher risk and potentially more volatile than those inherent in established markets. Any performance information shown refers to the past and should not be seen as an indication of future returns. You should always consider seeking professional advice when thinking about undertaking any form of investment.
2 August 2018
Corporate bond valuations improve
Key takeaways A stronger investment case for corporate bonds
We move from underweight to neutral on US investment-grade (IG) and high-yield (HY) corporate bonds, resulting in a move from underweight to neutral for global IG and HY corporate bonds. We also move from underweight to neutral on US dollar (USD) emerging-market (EM) debt
Global equity markets rose in July, as upbeat corporate earnings results outweighed lingering global trade concerns
Amid strong economic data and despite rising trade tensions, Federal Reserve (Fed) Chair Powell testified that interest rates would keep gradually rising, “for now”
Recent eurozone activity indicators suggest growth has stabilised, following a weakening in Q1. The European Central Bank (ECB) remains on course to terminate its net bond-buying programme by the end of the year
In China, monetary easing, a slower pace of regulatory tightening and more funding for local government projects should help contain the risk of a sharp growth slowdown
The Bank of Japan downgraded its inflation forecasts for the next three years and reiterated monetary policy will remain very accommodative “for an extended period of time”
Global economic growth slowed at the start of 2018, but has since stabilised at a good pace. Meanwhile, corporate fundamentals remain solid and default rates low. Yet recently, we think corporate bonds have become increasingly attractive on a valuation basis, especially in the US. Therefore, we move from underweight to neutral on US investment-grade (IG) and high-yield (HY) corporate bonds, resulting in an upgrade to our stance on global IG and HY corporate bonds from underweight to neutral. We are also more positive on European equivalents, although
we remain underweight here as the improvement in valuations has not been as significant. Elsewhere, the recent sell-off in EM assets has improved valuations for USD-denominated EM debt, and we also upgrade our
view to neutral from underweight.
Our previous preference was to be invested in global equities and US Treasuries as a way to mimic the payoff from corporate bonds. We counterbalance this month’s view changes by moving away from this stance. Nevertheless, global equities remain a superior way to benefit from the
robust global environment, and increased volatility presents buying opportunities, in our view. Meanwhile, we think US Treasuries are still relatively attractive versus other DM
government-bond markets, especially for two-year notes, although higher US inflation is a key risk for this asset class.
Equities Government bonds Corporate bonds & other Asian assets
Asset Class View
View Move
Asset Class View
View Move
Asset Class View View
Move Asset Class View
View Move
Global OW – Developed Market (DM) UW – Global investment grade (IG) N
EM Asian fixed income UW –
US N – US UW – USD IG N
Asia ex-Japan equities OW –
UK N – UK UW – EUR and GBP IG UW – China OW –
Eurozone OW – Eurozone UW – Asia IG N – India OW –
Japan OW – Japan UW – Global high-yield N
Hong Kong N –
Emerging Markets (EM) OW – EM (local currency) OW – US N
Singapore OW –
CEE & Latam N – Europe UW – South Korea OW –
Asia N – Taiwan N –
EM agg bond (USD) N
Gold N –
Other commodities N –
` Real estate N –
OW = Overweight; N = Neutral; UW = Underweight

09/08/2018 Investment Monthly 2 Source: HSBC Global Asset Management. All numbers rounded to one decimal place Past performance is not an indication of future returns.
Long-term asset class positioning (>12 months)
Basis of Views and Definitions of ‘Long term Asset class positioning’ table
Views are based on regional HSBC Global Asset Management Asset Allocation meetings held throughout July 2018, HSBC Global Asset Management’s long-term expected return forecasts which were generated as at 29 June 2018, our portfolio optimisation process and actual portfolio positions.
Icons: View on this asset class has been upgraded – No change View on this asset class has been downgraded
Underweight, overweight and neutral classifications are the high-level asset allocations tilts applied in diversified, typically multi-asset portfolios, which reflect a combination of our long-term valuation signals, our shorter-term cyclical views and actual positioning in portfolios. The views are expressed with reference to global portfolios. However, individual portfolio positions may vary according to mandate, benchmark, risk profile and the availability and riskiness of individual asset classes in different regions.
“Overweight” implies that, within the context of a well-diversified typically multi-asset portfolio, and relative to relevant internal or external benchmarks, HSBC Global Asset Management has (or would have) a positive tilt towards the asset class.
“Underweight” implies that, within the context of a well-diversified typically multi-asset portfolio, and relative to relevant internal or external benchmarks, HSBC Global Asset Management has (or would) have a negative tilt towards the asset class.
“Neutral” implies that, within the context of a well-diversified typically multi-asset portfolio, and relative to relevant internal or external benchmarks HSBC Global Asset Management has (or would have) neither a particularly negative or positive tilt towards the asset class
For global investment-grade corporate bonds, the underweight, overweight and neutral categories for the asset class at the aggregate level are also based on high-level asset allocation considerations applied in diversified, typically multi-asset portfolios. However, USD investment-grade corporate bonds, EUR and GBP, and Asia investment-grade corporate bonds are determined relative to the global investment-grade corporate bond universe.
For Asia ex Japan equities, the underweight, overweight and neutral categories for the region at the aggregate level are also based on high-level asset allocation considerations applied in diversified, typically multi-asset portfolios. However, individual country views are determined relative to the Asia ex Japan equities universe as of 31 July 2018.
Similarly, for EM government bonds, the underweight, overweight and neutral categories for the asset class at the aggregate level are also based on high-level asset allocation considerations applied in diversified, typically multi-asset portfolios. However, EM Asian Fixed income views are determined relative to the EM government bonds (hard currency) universe as of 31 July 2018.
Equities
Asset class View Movement Rationale
Global Overweight
Rationale of overweight views: Our measure of the global equity risk premium (excess return over cash) is still reasonable given where we are in the profits cycle. Global economic growth remains solid, driving global equity markets to deliver positive returns over the long term. Overall, support from still-loose monetary policy and fiscal policy (if needed) will, in the medium and longer term, likely outweigh any headwinds from more modest Chinese growth, monetary policy normalisation in DM economies, and political uncertainty in many regions. Risks to consider: Fairly narrow implied equity risk premiums limit the ability of the market to absorb bad news. Episodic volatility may be triggered by concerns surrounding global trade protectionism, Chinese growth, and/or a potentially more rapid than expected Fed, ECB or BoJ normalisation of policy, coupled with political risks. A notable and persistent deterioration of the global economic outlook could also dampen our view.
US Neutral
Positive factors: Despite a recent pickup in market volatility, corporate fundamentals remain strong, the earnings growth outlook looks solid (with upside risks from tax reform), and the US macroeconomic backdrop is still robust. Overall, our measure of the implied risk premium (excess returns over cash) remains consistent with a neutral positioning. Risks to consider: The magnitude of the boost to GDP growth from tax reform is likely to be small given where we are in the cycle. Further Fed policy tightening also poses risks. We are getting closer to the critical point where we need to reassess whether we are being offered enough return to take on equity risk in this market. Risks from US protectionism also need to be considered, especially if further rounds of tit-for-tat actions materialise.
UK Neutral
Positive factors: Major UK equity indices are heavily weighted to financial and resource stocks which should benefit from higher commodity prices and rising interest rates. Overall, however, current valuations are consistent with a neutral positioning, in our view. Risks to consider: The prospective reward for bearing equity risk in the UK is relatively low compared to other markets. The UK economy is underperforming amid low real wage growth and Brexit-related uncertainty.
Eurozone Overweight
Rationale of overweight views: Eurozone equities benefit from relatively high implied risk premiums and scope for better earnings news given the region’s earlier point in the activity cycle. Ultra-low ECB policy interest rates are likely to persist until the end of the decade. Risks to consider: The recent softening of activity indicators requires monitoring. EU-US trade barriers pose a significant risk to the outlook, as does the new populist government in Italy and Brexit negotiations. ECB monetary policy may also be less accommodative than expected.
09/08/2018 Investment Monthly 3 Source: HSBC Global Asset Management. All numbers rounded to one decimal place Past performance is not an indication of future returns.
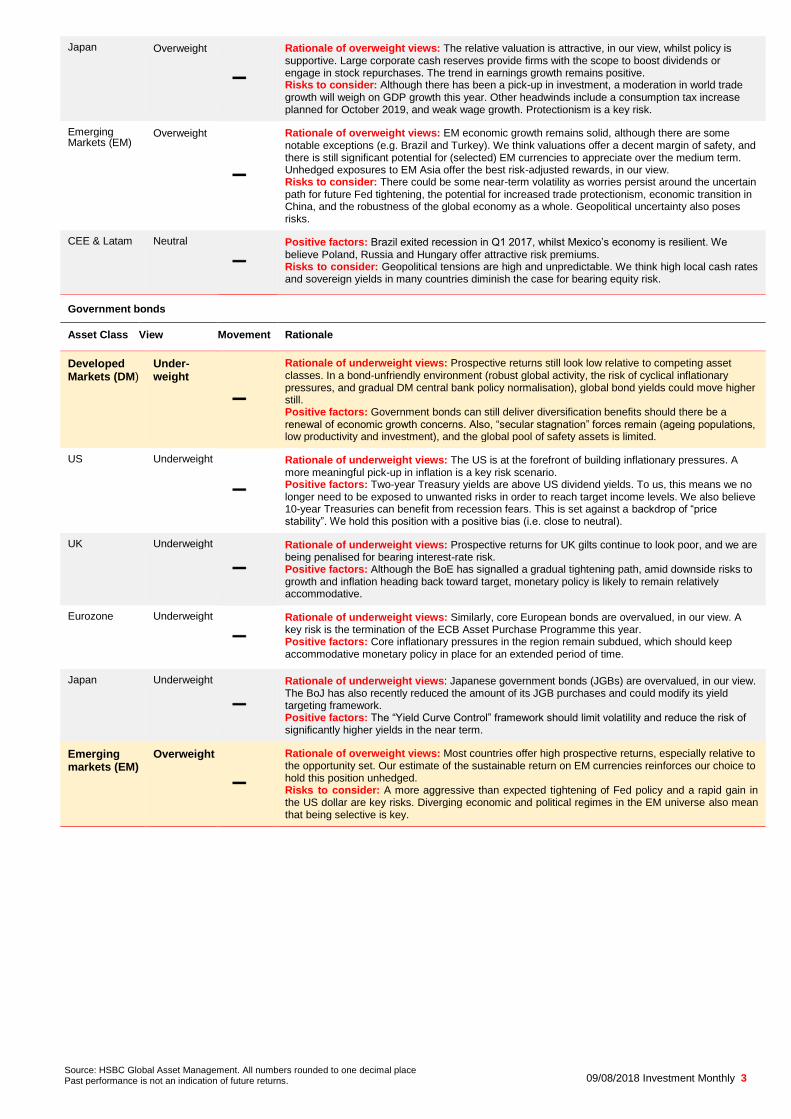
Japan Overweight
Rationale of overweight views: The relative valuation is attractive, in our view, whilst policy is supportive. Large corporate cash reserves provide firms with the scope to boost dividends or engage in stock repurchases. The trend in earnings growth remains positive. Risks to consider: Although there has been a pick-up in investment, a moderation in world trade growth will weigh on GDP growth this year. Other headwinds include a consumption tax increase planned for October 2019, and weak wage growth. Protectionism is a key risk.
Emerging Markets (EM)
Overweight
Rationale of overweight views: EM economic growth remains solid, although there are some notable exceptions (e.g. Brazil and Turkey). We think valuations offer a decent margin of safety, and there is still significant potential for (selected) EM currencies to appreciate over the medium term. Unhedged exposures to EM Asia offer the best risk-adjusted rewards, in our view. Risks to consider: There could be some near-term volatility as worries persist around the uncertain path for future Fed tightening, the potential for increased trade protectionism, economic transition in China, and the robustness of the global economy as a whole. Geopolitical uncertainty also poses risks.
CEE & Latam Neutral
Positive factors: Brazil exited recession in Q1 2017, whilst Mexico’s economy is resilient. We believe Poland, Russia and Hungary offer attractive risk premiums. Risks to consider: Geopolitical tensions are high and unpredictable. We think high local cash rates and sovereign yields in many countries diminish the case for bearing equity risk.
Government bonds
Asset Class View Movement Rationale
Developed Markets (DM)
Under-weight
Rationale of underweight views: Prospective returns still look low relative to competing asset classes. In a bond-unfriendly environment (robust global activity, the risk of cyclical inflationary pressures, and gradual DM central bank policy normalisation), global bond yields could move higher still. Positive factors: Government bonds can still deliver diversification benefits should there be a renewal of economic growth concerns. Also, “secular stagnation” forces remain (ageing populations, low productivity and investment), and the global pool of safety assets is limited.
US Underweight
Rationale of underweight views: The US is at the forefront of building inflationary pressures. A more meaningful pick-up in inflation is a key risk scenario. Positive factors: Two-year Treasury yields are above US dividend yields. To us, this means we no longer need to be exposed to unwanted risks in order to reach target income levels. We also believe 10-year Treasuries can benefit from recession fears. This is set against a backdrop of “price stability”. We hold this position with a positive bias (i.e. close to neutral).
UK Underweight
Rationale of underweight views: Prospective returns for UK gilts continue to look poor, and we are being penalised for bearing interest-rate risk. Positive factors: Although the BoE has signalled a gradual tightening path, amid downside risks to growth and inflation heading back toward target, monetary policy is likely to remain relatively accommodative.
Eurozone Underweight
Rationale of underweight views: Similarly, core European bonds are overvalued, in our view. A key risk is the termination of the ECB Asset Purchase Programme this year. Positive factors: Core inflationary pressures in the region remain subdued, which should keep accommodative monetary policy in place for an extended period of time.
Japan Underweight
Rationale of underweight views: Japanese government bonds (JGBs) are overvalued, in our view. The BoJ has also recently reduced the amount of its JGB purchases and could modify its yield targeting framework. Positive factors: The “Yield Curve Control” framework should limit volatility and reduce the risk of significantly higher yields in the near term.
Emerging markets (EM)
Overweight
Rationale of overweight views: Most countries offer high prospective returns, especially relative to the opportunity set. Our estimate of the sustainable return on EM currencies reinforces our choice to hold this position unhedged. Risks to consider: A more aggressive than expected tightening of Fed policy and a rapid gain in the US dollar are key risks. Diverging economic and political regimes in the EM universe also mean that being selective is key.
09/08/2018 Investment Monthly 4 Source: HSBC Global Asset Management. All numbers rounded to one decimal place Past performance is not an indication of future returns.
Corporate bonds
Asset Class View Movement Rationale
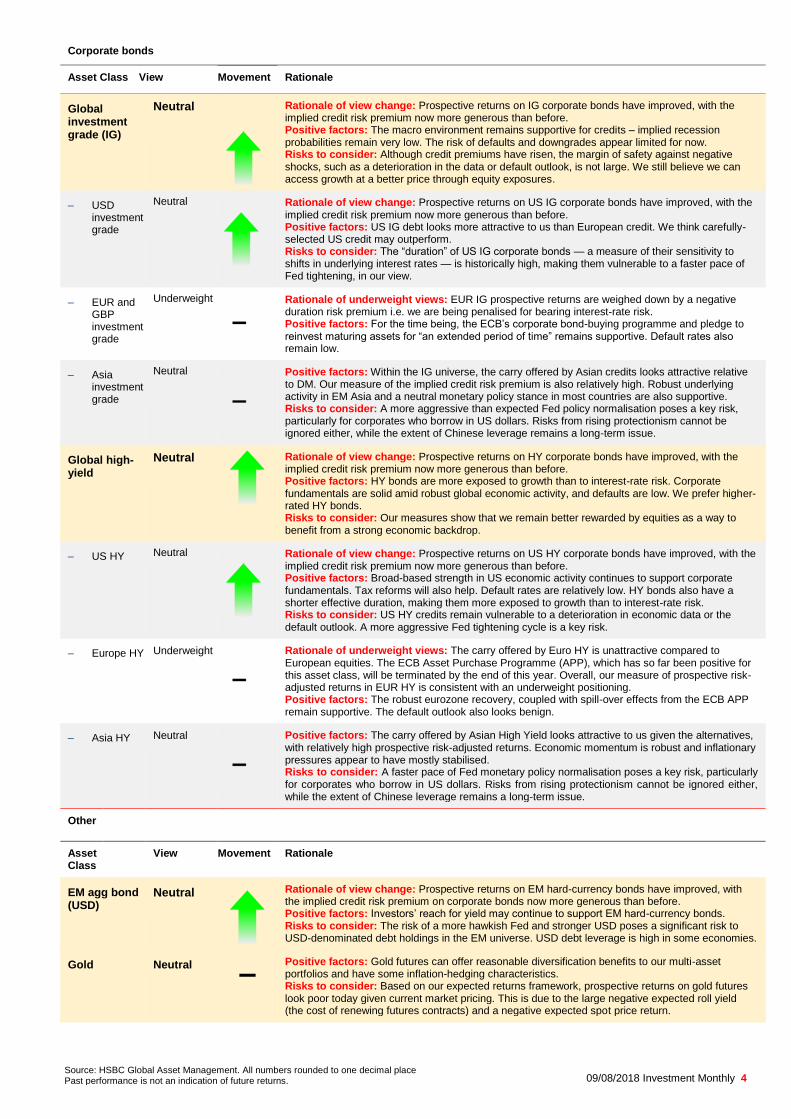
Global investment grade (IG)
Neutral
Rationale of view change: Prospective returns on IG corporate bonds have improved, with the implied credit risk premium now more generous than before. Positive factors: The macro environment remains supportive for credits – implied recession probabilities remain very low. The risk of defaults and downgrades appear limited for now. Risks to consider: Although credit premiums have risen, the margin of safety against negative shocks, such as a deterioration in the data or default outlook, is not large. We still believe we can access growth at a better price through equity exposures.
– USD investment grade
Neutral
Rationale of view change: Prospective returns on US IG corporate bonds have improved, with the implied credit risk premium now more generous than before. Positive factors: US IG debt looks more attractive to us than European credit. We think carefully-selected US credit may outperform. Risks to consider: The “duration” of US IG corporate bonds — a measure of their sensitivity to shifts in underlying interest rates — is historically high, making them vulnerable to a faster pace of Fed tightening, in our view.
– EUR and GBP investment grade
Underweight
Rationale of underweight views: EUR IG prospective returns are weighed down by a negative duration risk premium i.e. we are being penalised for bearing interest-rate risk. Positive factors: For the time being, the ECB’s corporate bond-buying programme and pledge to reinvest maturing assets for “an extended period of time” remains supportive. Default rates also remain low.
– Asia investment grade
Neutral
Positive factors: Within the IG universe, the carry offered by Asian credits looks attractive relative to DM. Our measure of the implied credit risk premium is also relatively high. Robust underlying activity in EM Asia and a neutral monetary policy stance in most countries are also supportive. Risks to consider: A more aggressive than expected Fed policy normalisation poses a key risk, particularly for corporates who borrow in US dollars. Risks from rising protectionism cannot be ignored either, while the extent of Chinese leverage remains a long-term issue.
Global high-yield
Neutral
Rationale of view change: Prospective returns on HY corporate bonds have improved, with the implied credit risk premium now more generous than before. Positive factors: HY bonds are more exposed to growth than to interest-rate risk. Corporate fundamentals are solid amid robust global economic activity, and defaults are low. We prefer higher-rated HY bonds. Risks to consider: Our measures show that we remain better rewarded by equities as a way to benefit from a strong economic backdrop.
– US HY Neutral
Rationale of view change: Prospective returns on US HY corporate bonds have improved, with the implied credit risk premium now more generous than before. Positive factors: Broad-based strength in US economic activity continues to support corporate fundamentals. Tax reforms will also help. Default rates are relatively low. HY bonds also have a shorter effective duration, making them more exposed to growth than to interest-rate risk. Risks to consider: US HY credits remain vulnerable to a deterioration in economic data or the default outlook. A more aggressive Fed tightening cycle is a key risk.
– Europe HY Underweight
Rationale of underweight views: The carry offered by Euro HY is unattractive compared to European equities. The ECB Asset Purchase Programme (APP), which has so far been positive for this asset class, will be terminated by the end of this year. Overall, our measure of prospective risk-adjusted returns in EUR HY is consistent with an underweight positioning. Positive factors: The robust eurozone recovery, coupled with spill-over effects from the ECB APP remain supportive. The default outlook also looks benign.
– Asia HY Neutral
Positive factors: The carry offered by Asian High Yield looks attractive to us given the alternatives, with relatively high prospective risk-adjusted returns. Economic momentum is robust and inflationary pressures appear to have mostly stabilised. Risks to consider: A faster pace of Fed monetary policy normalisation poses a key risk, particularly for corporates who borrow in US dollars. Risks from rising protectionism cannot be ignored either, while the extent of Chinese leverage remains a long-term issue.
Other
Asset Class
View Movement Rationale
EM agg bond (USD)
Neutral
Rationale of view change: Prospective returns on EM hard-currency bonds have improved, with the implied credit risk premium on corporate bonds now more generous than before. Positive factors: Investors’ reach for yield may continue to support EM hard-currency bonds. Risks to consider: The risk of a more hawkish Fed and stronger USD poses a significant risk to USD-denominated debt holdings in the EM universe. USD debt leverage is high in some economies.
Gold Neutral
– Positive factors: Gold futures can offer reasonable diversification benefits to our multi-asset portfolios and have some inflation-hedging characteristics. Risks to consider: Based on our expected returns framework, prospective returns on gold futures look poor today given current market pricing. This is due to the large negative expected roll yield (the cost of renewing futures contracts) and a negative expected spot price return.
09/08/2018 Investment Monthly 5 Source: HSBC Global Asset Management. All numbers rounded to one decimal place Past performance is not an indication of future returns.
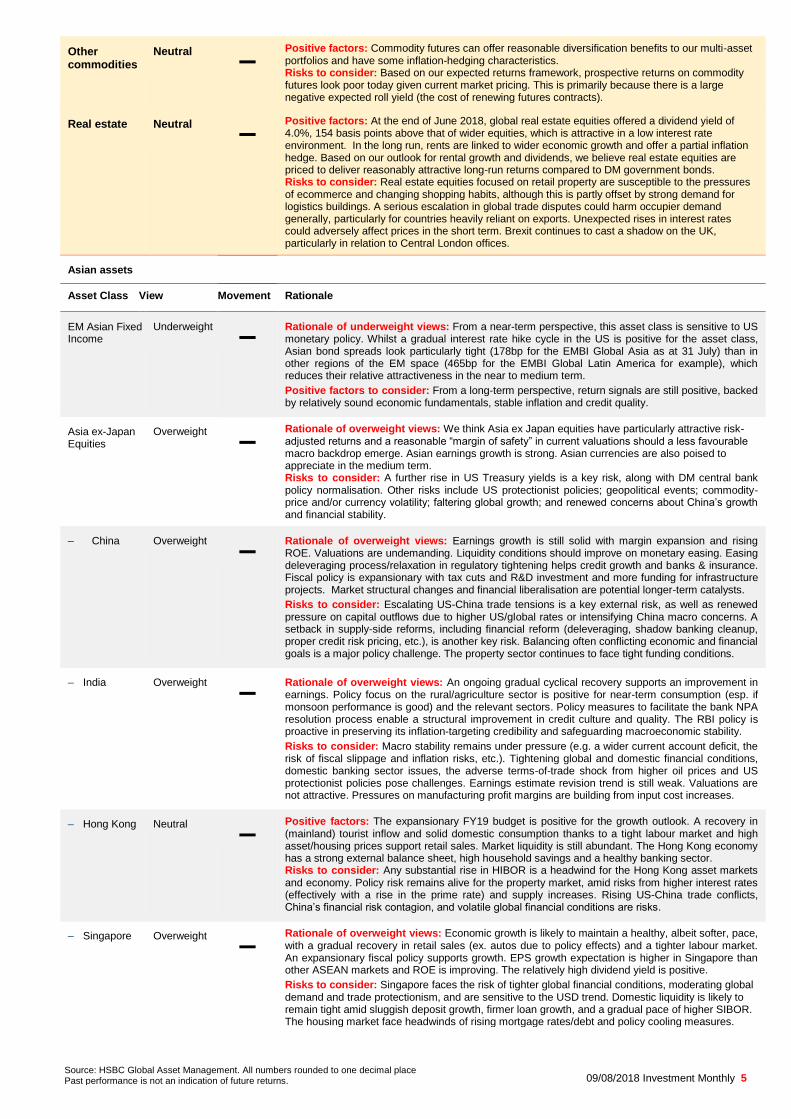
Other commodities
Neutral
– Positive factors: Commodity futures can offer reasonable diversification benefits to our multi-asset portfolios and have some inflation-hedging characteristics. Risks to consider: Based on our expected returns framework, prospective returns on commodity futures look poor today given current market pricing. This is primarily because there is a large negative expected roll yield (the cost of renewing futures contracts).
Real estate
Neutral
– Positive factors: At the end of June 2018, global real estate equities offered a dividend yield of 4.0%, 154 basis points above that of wider equities, which is attractive in a low interest rate environment. In the long run, rents are linked to wider economic growth and offer a partial inflation hedge. Based on our outlook for rental growth and dividends, we believe real estate equities are priced to deliver reasonably attractive long-run returns compared to DM government bonds. Risks to consider: Real estate equities focused on retail property are susceptible to the pressures of ecommerce and changing shopping habits, although this is partly offset by strong demand for logistics buildings. A serious escalation in global trade disputes could harm occupier demand generally, particularly for countries heavily reliant on exports. Unexpected rises in interest rates could adversely affect prices in the short term. Brexit continues to cast a shadow on the UK, particularly in relation to Central London offices.
Asian assets
Asset Class View Movement Rationale
EM Asian Fixed Income
Underweight
– Rationale of underweight views: From a near-term perspective, this asset class is sensitive to US monetary policy. Whilst a gradual interest rate hike cycle in the US is positive for the asset class, Asian bond spreads look particularly tight (178bp for the EMBI Global Asia as at 31 July) than in other regions of the EM space (465bp for the EMBI Global Latin America for example), which reduces their relative attractiveness in the near to medium term.
Positive factors to consider: From a long-term perspective, return signals are still positive, backed by relatively sound economic fundamentals, stable inflation and credit quality.
Asia ex-Japan Equities
Overweight
– Rationale of overweight views: We think Asia ex Japan equities have particularly attractive risk-adjusted returns and a reasonable “margin of safety” in current valuations should a less favourable macro backdrop emerge. Asian earnings growth is strong. Asian currencies are also poised to appreciate in the medium term. Risks to consider: A further rise in US Treasury yields is a key risk, along with DM central bank policy normalisation. Other risks include US protectionist policies; geopolitical events; commodity-price and/or currency volatility; faltering global growth; and renewed concerns about China’s growth and financial stability.
– China Overweight
– Rationale of overweight views: Earnings growth is still solid with margin expansion and rising ROE. Valuations are undemanding. Liquidity conditions should improve on monetary easing. Easing deleveraging process/relaxation in regulatory tightening helps credit growth and banks & insurance. Fiscal policy is expansionary with tax cuts and R&D investment and more funding for infrastructure projects. Market structural changes and financial liberalisation are potential longer-term catalysts.
Risks to consider: Escalating US-China trade tensions is a key external risk, as well as renewed pressure on capital outflows due to higher US/global rates or intensifying China macro concerns. A setback in supply-side reforms, including financial reform (deleveraging, shadow banking cleanup, proper credit risk pricing, etc.), is another key risk. Balancing often conflicting economic and financial goals is a major policy challenge. The property sector continues to face tight funding conditions.
– India Overweight
–
Rationale of overweight views: An ongoing gradual cyclical recovery supports an improvement in earnings. Policy focus on the rural/agriculture sector is positive for near-term consumption (esp. if monsoon performance is good) and the relevant sectors. Policy measures to facilitate the bank NPA resolution process enable a structural improvement in credit culture and quality. The RBI policy is proactive in preserving its inflation-targeting credibility and safeguarding macroeconomic stability.
Risks to consider: Macro stability remains under pressure (e.g. a wider current account deficit, the risk of fiscal slippage and inflation risks, etc.). Tightening global and domestic financial conditions, domestic banking sector issues, the adverse terms-of-trade shock from higher oil prices and US protectionist policies pose challenges. Earnings estimate revision trend is still weak. Valuations are not attractive. Pressures on manufacturing profit margins are building from input cost increases.
– Hong Kong Neutral
– Positive factors: The expansionary FY19 budget is positive for the growth outlook. A recovery in (mainland) tourist inflow and solid domestic consumption thanks to a tight labour market and high asset/housing prices support retail sales. Market liquidity is still abundant. The Hong Kong economy has a strong external balance sheet, high household savings and a healthy banking sector. Risks to consider: Any substantial rise in HIBOR is a headwind for the Hong Kong asset markets and economy. Policy risk remains alive for the property market, amid risks from higher interest rates (effectively with a rise in the prime rate) and supply increases. Rising US-China trade conflicts, China’s financial risk contagion, and volatile global financial conditions are risks.
– Singapore Overweight
– Rationale of overweight views: Economic growth is likely to maintain a healthy, albeit softer, pace, with a gradual recovery in retail sales (ex. autos due to policy effects) and a tighter labour market. An expansionary fiscal policy supports growth. EPS growth expectation is higher in Singapore than other ASEAN markets and ROE is improving. The relatively high dividend yield is positive.
Risks to consider: Singapore faces the risk of tighter global financial conditions, moderating global demand and trade protectionism, and are sensitive to the USD trend. Domestic liquidity is likely to remain tight amid sluggish deposit growth, firmer loan growth, and a gradual pace of higher SIBOR. The housing market face headwinds of rising mortgage rates/debt and policy cooling measures.

09/08/2018 Investment Monthly 6 Source: HSBC Global Asset Management. All numbers rounded to one decimal place Past performance is not an indication of future returns.
– South Korea Overweight
– Rationale of overweight views: Export growth ex. shipbuilding still holds up. The potential for reduced North Korea-related geopolitical risk and corporate governance reform create longer-term re-rating potential. The ‘income-led growth’ policy agenda/tax reform and an expansionary fiscal policy supports domestic demand. Earnings growth remain solid and valuations are attractive. Risks to consider: Labour market headwinds to consumption persist, partly reflecting the impact of the minimum wage policy and corporate restructurings. Regulation weighs on the housing market. Korea is exposed to trade protectionism, slower global demand and geopolitical risks. Corporate income tax hike, labour policy and higher energy prices will likely raise costs and weigh on margins.
– Taiwan Neutral
– Positive factors: External demand outlook remains broadly benign, with recent data showing a moderate improvement in tech exports following several months of weak performance. There are new growth drivers in the tech sector such as artificial intelligence, Internet of Things and 5G. The multi-year public infrastructure investment plan begins to roll out. Dividend yield is relatively high. Risks to consider: Escalating US-China trade tensions and any global demand slowdown are major risks, considering Taiwan’s heavy involvement in the regional (tech) supply chain. Taiwan’s tech sector is facing tough competition from China. Global financial market volatility, geopolitical tensions and rising political and military pressure on Taiwan by China, and any oil shock are risks.
09/08/2018 Investment Monthly 7 Source: HSBC Global Asset Management. All numbers rounded to one decimal place Past performance is not an indication of future returns.
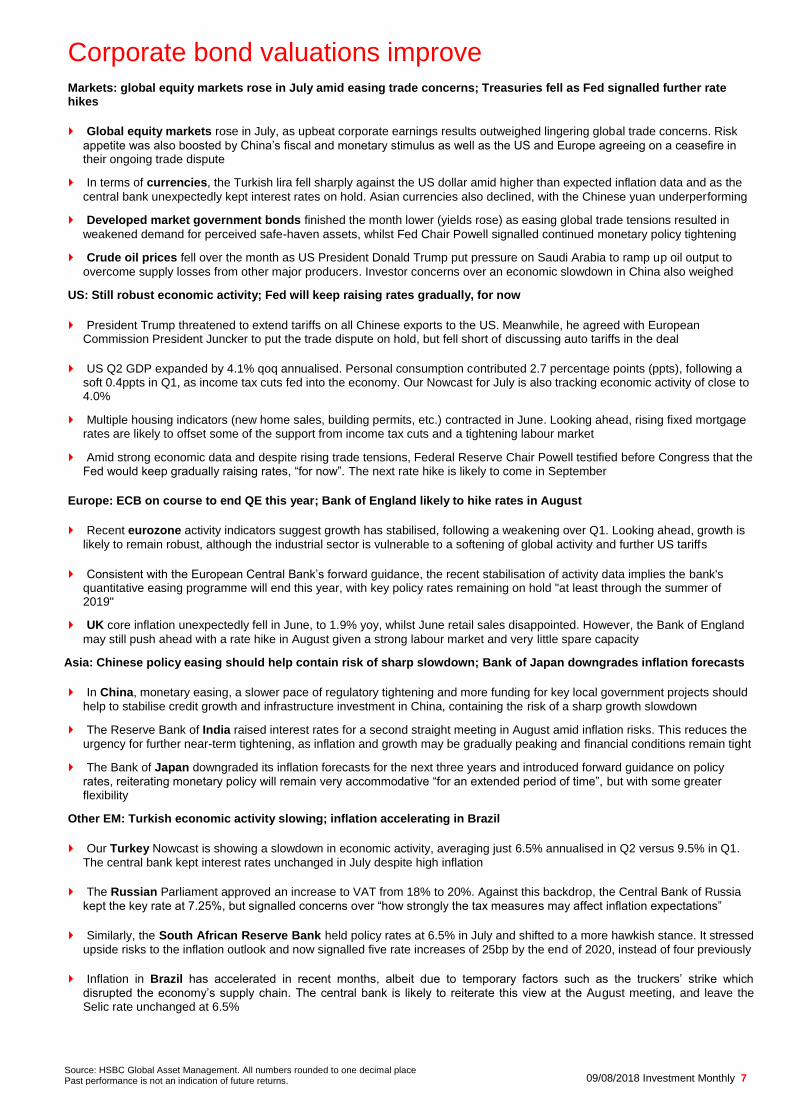
Corporate bond valuations improve Markets: global equity markets rose in July amid easing trade concerns; Treasuries fell as Fed signalled further rate hikes
Global equity markets rose in July, as upbeat corporate earnings results outweighed lingering global trade concerns. Risk
appetite was also boosted by China’s fiscal and monetary stimulus as well as the US and Europe agreeing on a ceasefire in their ongoing trade dispute
In terms of currencies, the Turkish lira fell sharply against the US dollar amid higher than expected inflation data and as the
central bank unexpectedly kept interest rates on hold. Asian currencies also declined, with the Chinese yuan underperforming
Developed market government bonds finished the month lower (yields rose) as easing global trade tensions resulted in
weakened demand for perceived safe-haven assets, whilst Fed Chair Powell signalled continued monetary policy tightening
Crude oil prices fell over the month as US President Donald Trump put pressure on Saudi Arabia to ramp up oil output to
overcome supply losses from other major producers. Investor concerns over an economic slowdown in China also weighed
US: Still robust economic activity; Fed will keep raising rates gradually, for now
President Trump threatened to extend tariffs on all Chinese exports to the US. Meanwhile, he agreed with European Commission President Juncker to put the trade dispute on hold, but fell short of discussing auto tariffs in the deal
US Q2 GDP expanded by 4.1% qoq annualised. Personal consumption contributed 2.7 percentage points (ppts), following a soft 0.4ppts in Q1, as income tax cuts fed into the economy. Our Nowcast for July is also tracking economic activity of close to 4.0%
Multiple housing indicators (new home sales, building permits, etc.) contracted in June. Looking ahead, rising fixed mortgage rates are likely to offset some of the support from income tax cuts and a tightening labour market
Amid strong economic data and despite rising trade tensions, Federal Reserve Chair Powell testified before Congress that the Fed would keep gradually raising rates, “for now”. The next rate hike is likely to come in September
Europe: ECB on course to end QE this year; Bank of England likely to hike rates in August
Recent eurozone activity indicators suggest growth has stabilised, following a weakening over Q1. Looking ahead, growth is
likely to remain robust, although the industrial sector is vulnerable to a softening of global activity and further US tariffs
Consistent with the European Central Bank’s forward guidance, the recent stabilisation of activity data implies the bank's quantitative easing programme will end this year, with key policy rates remaining on hold "at least through the summer of 2019"
UK core inflation unexpectedly fell in June, to 1.9% yoy, whilst June retail sales disappointed. However, the Bank of England
may still push ahead with a rate hike in August given a strong labour market and very little spare capacity
Asia: Chinese policy easing should help contain risk of sharp slowdown; Bank of Japan downgrades inflation forecasts
In China, monetary easing, a slower pace of regulatory tightening and more funding for key local government projects should
help to stabilise credit growth and infrastructure investment in China, containing the risk of a sharp growth slowdown
The Reserve Bank of India raised interest rates for a second straight meeting in August amid inflation risks. This reduces the
urgency for further near-term tightening, as inflation and growth may be gradually peaking and financial conditions remain tight
The Bank of Japan downgraded its inflation forecasts for the next three years and introduced forward guidance on policy
rates, reiterating monetary policy will remain very accommodative “for an extended period of time”, but with some greater flexibility
Other EM: Turkish economic activity slowing; inflation accelerating in Brazil
Our Turkey Nowcast is showing a slowdown in economic activity, averaging just 6.5% annualised in Q2 versus 9.5% in Q1.
The central bank kept interest rates unchanged in July despite high inflation
The Russian Parliament approved an increase to VAT from 18% to 20%. Against this backdrop, the Central Bank of Russia
kept the key rate at 7.25%, but signalled concerns over “how strongly the tax measures may affect inflation expectations”
Similarly, the South African Reserve Bank held policy rates at 6.5% in July and shifted to a more hawkish stance. It stressed
upside risks to the inflation outlook and now signalled five rate increases of 25bp by the end of 2020, instead of four previously
Inflation in Brazil has accelerated in recent months, albeit due to temporary factors such as the truckers’ strike which
disrupted the economy’s supply chain. The central bank is likely to reiterate this view at the August meeting, and leave the Selic rate unchanged at 6.5%

Sources: Bloomberg, HSBC Global Asset Management. Data as at close of business 31 July 2018. Past performance is not an indication of future returns.
09/08/2018 Investment Monthly 8
Market Data
MTD 3M 1-year YTD 52-week 52-week Fwd
Close Change Change Change Change High Low P/E
Equity Indices (% ) (% ) (% ) (% ) (X)
World
MSCI AC World Index (USD) 520 2.9 2.0 8.8 1.3 551 470 15.7
North America
US Dow Jones Industrial Average 25,415 4.7 5.2 16.1 2.8 26,617 21,600 16.3
US S&P 500 Index 2,816 3.6 6.4 14.0 5.3 2,873 2,417 17.5
US NASDAQ Composite Index 7,672 2.2 8.6 20.9 11.1 7,933 6,177 22.9
Canada S&P/TSX Composite Index 16,434 1.0 5.3 8.5 1.4 16,586 14,786 15.9
Europe
MSCI AC Europe (USD) 476 3.2 -1.8 2.7 -2.3 524 452 14.3
Euro STOXX 50 Index 3,525 3.8 -0.3 2.2 0.6 3,709 3,262 14.2
UK FTSE 100 Index 7,749 1.5 3.2 5.1 0.8 7,904 6,867 13.8
Germany DAX Index* 12,806 4.1 1.5 5.7 -0.9 13,597 11,727 13.4
France CAC-40 Index 5,511 3.5 -0.2 8.2 3.7 5,657 4,995 14.8
Spain IBEX 35 Index 9,871 2.6 -1.1 -6.0 -1.7 10,758 9,328 12.9
Asia Pacific
MSCI AC Asia Pacific ex Japan (USD) 543 0.7 -4.6 2.5 -4.7 617 515 13.3
Japan Nikkei-225 Stock Average 22,554 1.1 0.4 13.2 -0.9 24,129 19,240 16.4
Australian Stock Exchange 200 6,280 1.4 5.0 9.8 3.5 6,306 5,639 16.1
Hong Kong Hang Seng Index 28,583 -1.3 -7.2 4.6 -4.5 33,484 26,864 11.5
Shanghai Stock Exchange Composite Index 2,876 1.0 -6.7 -12.1 -13.0 3,587 2,691 11.3
Hang Seng China Enterprises Index 11,025 -0.4 -10.6 1.8 -5.8 13,963 10,405 7.8
Taiwan TAIEX Index 11,058 2.0 3.7 6.0 3.9 11,270 10,189 14.1
Korea KOSPI Index 2,295 -1.3 -8.8 -4.5 -7.0 2,607 2,244 9.1
India SENSEX 30 Index 37,607 6.2 7.0 15.7 10.4 37,712 31,082 19.8
Indonesia Jakarta Stock Price Index 5,936 2.4 -1.0 1.6 -6.6 6,693 5,558 15.4
Malaysia Kuala Lumpur Composite Index 1,784 5.5 -4.6 1.4 -0.7 1,896 1,658 17.1
Philippines Stock Exchange PSE Index 7,672 6.6 -1.9 -4.3 -10.4 9,078 6,924 18.0
Singapore FTSE Straits Times Index 3,320 1.6 -8.1 -0.3 -2.4 3,642 3,176 13.3
Thailand SET Index 1,702 6.7 -4.4 8.0 -3.0 1,853 1,556 15.8
Latam
Argentina Merval Index 29,287 12.5 -2.4 35.7 -2.6 35,462 20,845 8.5
Brazil Bovespa Index* 79,220 8.9 -8.0 20.2 3.7 88,318 65,925 11.9
Chile IPSA Index 5,434 2.5 -4.8 7.3 -2.3 5,895 4,847 16.1
Colombia COLCAP Index 1,527 -3.2 -2.5 3.1 0.9 1,598 1,415 14.6
Mexico S&P/BMV IPC Index 49,698 4.3 2.8 -2.6 0.7 51,722 44,429 17.6
EEMEA
Russia MOEX Index 2,321 1.1 0.6 20.9 10.0 2,379 1,921 5.9
South Africa JSE Index 57,432 -0.3 -1.4 4.0 -3.5 61,777 53,027 14.3
Turkey ISE 100 Index* 96,952 0.4 -7.0 -9.8 -15.9 121,532 88,169 7.0 *Indices expressed as total returns. All others are price returns.
3-month YTD 1-year 3-year 5-year
Change Change Change Change Change
Equity Indices - Total Return (% ) (% ) (% ) (% ) (% )
Global equities 2.6 2.6 11.0 29.3 54.1
US equities 6.7 6.3 15.6 39.1 79.1
Europe equities -0.8 -0.2 5.6 13.7 28.2
Asia Pacific ex Japan equities -3.5 -3.1 5.3 30.8 41.9
Japan equities -3.1 -1.6 8.8 19.8 42.4
Latam equities -9.0 -3.0 0.7 26.5 -2.2
Emerging Markets equities -5.5 -4.6 4.4 29.3 29.2 All total returns quoted in USD terms and subject to one-day lag. Data sourced from MSCI AC World Total Return Index, MSCI USA Total Return Index, MSCI AC Europe Total Return Index, MSCI AC Asia Pacific ex Japan Total Return Index, MSCI Japan Total Return Index, MSCI Latam Total Return Index and MSCI Emerging Markets Total Return Index.
Sources: Bloomberg, HSBC Global Asset Management. Data as at close of business 31 July 2018. Past performance is not an indication of future returns.
09/08/2018 Investment Monthly 9
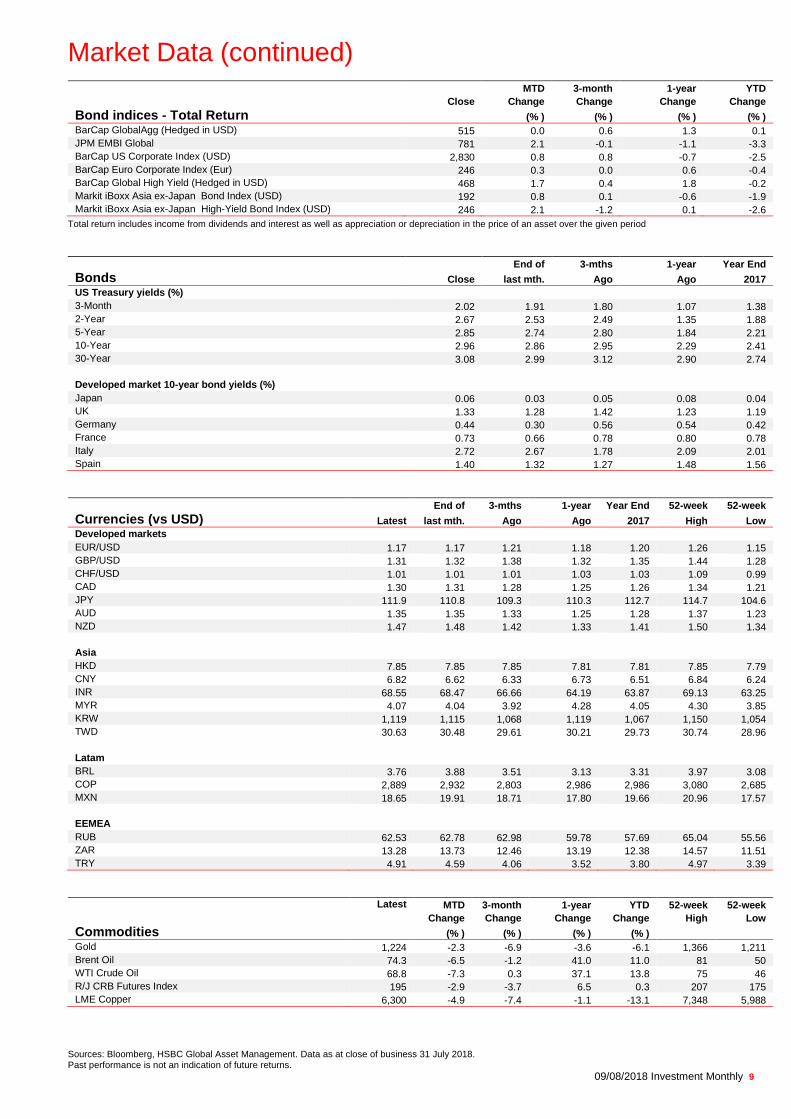
Market Data (continued)
MTD 3-month 1-year YTD
Close Change Change Change Change
Bond indices - Total Return (% ) (% ) (% ) (% )
BarCap GlobalAgg (Hedged in USD) 515 0.0 0.6 1.3 0.1
JPM EMBI Global 781 2.1 -0.1 -1.1 -3.3
BarCap US Corporate Index (USD) 2,830 0.8 0.8 -0.7 -2.5
BarCap Euro Corporate Index (Eur) 246 0.3 0.0 0.6 -0.4
BarCap Global High Yield (Hedged in USD) 468 1.7 0.4 1.8 -0.2
Markit iBoxx Asia ex-Japan Bond Index (USD) 192 0.8 0.1 -0.6 -1.9
Markit iBoxx Asia ex-Japan High-Yield Bond Index (USD) 246 2.1 -1.2 0.1 -2.6
Total return includes income from dividends and interest as well as appreciation or depreciation in the price of an asset over the given period
End of 3-mths 1-year Year End
Bonds Close last mth. Ago Ago 2017
US Treasury yields (%)
3-Month 2.02 1.91 1.80 1.07 1.38
2-Year 2.67 2.53 2.49 1.35 1.88
5-Year 2.85 2.74 2.80 1.84 2.21
10-Year 2.96 2.86 2.95 2.29 2.41
30-Year 3.08 2.99 3.12 2.90 2.74
Developed market 10-year bond yields (%)
Japan 0.06 0.03 0.05 0.08 0.04
UK 1.33 1.28 1.42 1.23 1.19
Germany 0.44 0.30 0.56 0.54 0.42
France 0.73 0.66 0.78 0.80 0.78
Italy 2.72 2.67 1.78 2.09 2.01
Spain 1.40 1.32 1.27 1.48 1.56
End of 3-mths 1-year Year End 52-week 52-week
Currencies (vs USD) Latest last mth. Ago Ago 2017 High Low
Developed markets
EUR/USD 1.17 1.17 1.21 1.18 1.20 1.26 1.15
GBP/USD 1.31 1.32 1.38 1.32 1.35 1.44 1.28
CHF/USD 1.01 1.01 1.01 1.03 1.03 1.09 0.99
CAD 1.30 1.31 1.28 1.25 1.26 1.34 1.21
JPY 111.9 110.8 109.3 110.3 112.7 114.7 104.6
AUD 1.35 1.35 1.33 1.25 1.28 1.37 1.23
NZD 1.47 1.48 1.42 1.33 1.41 1.50 1.34
Asia
HKD 7.85 7.85 7.85 7.81 7.81 7.85 7.79
CNY 6.82 6.62 6.33 6.73 6.51 6.84 6.24
INR 68.55 68.47 66.66 64.19 63.87 69.13 63.25
MYR 4.07 4.04 3.92 4.28 4.05 4.30 3.85
KRW 1,119 1,115 1,068 1,119 1,067 1,150 1,054
TWD 30.63 30.48 29.61 30.21 29.73 30.74 28.96
Latam
BRL 3.76 3.88 3.51 3.13 3.31 3.97 3.08
COP 2,889 2,932 2,803 2,986 2,986 3,080 2,685
MXN 18.65 19.91 18.71 17.80 19.66 20.96 17.57
EEMEA
RUB 62.53 62.78 62.98 59.78 57.69 65.04 55.56
ZAR 13.28 13.73 12.46 13.19 12.38 14.57 11.51
TRY 4.91 4.59 4.06 3.52 3.80 4.97 3.39
Latest MTD 3-month 1-year YTD 52-week 52-week
Change Change Change Change High Low
Commodities (% ) (% ) (% ) (% )
Gold 1,224 -2.3 -6.9 -3.6 -6.1 1,366 1,211
Brent Oil 74.3 -6.5 -1.2 41.0 11.0 81 50
WTI Crude Oil 68.8 -7.3 0.3 37.1 13.8 75 46
R/J CRB Futures Index 195 -2.9 -3.7 6.5 0.3 207 175
LME Copper 6,300 -4.9 -7.4 -1.1 -13.1 7,348 5,988

09/08/2018 Investment Monthly 10
Important Information for Customers: WARNING: THE CONTENTS OF THIS DOCUMENT HAVE NOT BEEN REVIEWED BY ANY REGULATORY AUTHORITY IN HONG KONG OR ANY OTHER JURISDICTION. YOU ARE ADVISED TO EXERCISE CAUTION IN RELATION TO THE INVESTMENT AND THIS DOCUMENT. IF YOU ARE IN DOUBT ABOUT ANY OF THE CONTENTS OF THIS DOCUMENT, YOU SHOULD OBTAIN INDEPENDENT PROFESSIONAL ADVICE. This document has been issued by The Hongkong and Shanghai Banking Corporation Limited (the "Bank") in the conduct of its regulated business in Hong Kong and may be distributed in other jurisdictions where its distribution is lawful. It is not intended for anyone other than the recipient. The contents of this document may not be reproduced or further distributed to any person or entity, whether in whole or in part, for any purpose. This document must not be distributed to the United States, Canada or Australia or to any other jurisdiction where its distribution is unlawful. All non-authorised reproduction or use of this document will be the responsibility of the user and may lead to legal proceedings. This document has no contractual value and is not and should not be construed as an offer or the solicitation of an offer or a recommendation for the purchase or sale of any investment or subscribe for, or to participate in, any services. The Bank is not recommending or soliciting any action based on it. The information stated and/or opinion(s) expressed in this document are provided by HSBC Global Asset Management Limited. We do not undertake any obligation to issue any further publications to you or update the contents of this document and such contents are subject to changes at any time without notice. They are expressed solely as general market information and/or commentary for general information purposes only and do not constitute investment advice or recommendation to buy or sell investments or guarantee of returns. The Bank has not been involved in the preparation of such information and opinion. The Bank makes no guarantee, representation or warranty and accepts no responsibility for the accuracy and/or completeness of the information and/or opinions contained in this document, including any third party information obtained from sources it believes to be reliable but which has not been independently verified. In no event will the Bank or HSBC Group be liable for any damages, losses or liabilities including without limitation, direct or indirect, special, incidental, consequential damages, losses or liabilities, in connection with your use of this document or your reliance on or use or inability to use the information contained in this document. In case you have individual portfolios managed by HSBC Global Asset Management Limited, the views expressed in this document may not necessarily indicate current portfolios' composition. Individual portfolios managed by HSBC Global Asset Management Limited primarily reflect individual clients' objectives, risk preferences, time horizon, and market liquidity. The information contained within this document has not been reviewed in the light of your personal circumstances. Please note that this information is neither intended to aid in decision making for legal, financial or other consulting questions, nor should it be the basis of any investment or other decisions. You should carefully consider whether any investment views and investment products are appropriate in view of your investment experience, objectives, financial resources and relevant circumstances. The investment decision is yours but you should not invest in any product unless the intermediary who sells it to you has explained to you that the product is suitable for you having regard to your financial situation, investment experience and investment objectives. The relevant product offering documents should be read for further details. Some of the statements contained in this document may be considered forward-looking statements which provide current expectations or forecasts of future events. Such forward looking statements are not guarantees of future performance or events and involve risks and uncertainties. Such statements do not represent any one investment and are used for illustration purpose only. Customers are reminded that there can be no assurance that economic conditions described herein will remain in the future. Actual results may differ materially from those described in such forward-looking statements as a result of various factors. We can give no assurance that those expectations reflected in those forward-looking statements will prove to have been correct or come to fruition, and you are cautioned not to place undue reliance on such statements. We do not undertake any obligation to update the forward-looking statements contained herein, whether as a result of new information, future events or otherwise, or to update the reasons why actual results could differ from those projected in the forward-looking statements. Investment involves risk. It is important to note that the capital value of investments and the income from them may go down as well as up and may become valueless and investors may not get back the amount originally invested. Past performance contained in this document is not a reliable indicator of future performance whilst any forecasts, projections and simulations contained herein should not be relied upon as an indication of future results. Past performance information may be out of date. For up-to-date information, please contact your Relationship Manager. Investment in any market may be extremely volatile and subject to sudden fluctuations of varying magnitude due to a wide range of direct and indirect influences. Such characteristics can lead to considerable losses being incurred by those exposed to such markets. If an investment is withdrawn or terminated early, it may not return the full amount invested. In addition to the normal risks associated with investing, international investments may involve risk of capital loss from unfavourable fluctuations in currency values, from differences in generally accepted accounting principles or from economic or political instability in certain jurisdictions. Narrowly focused investments and smaller companies typically exhibit higher volatility. There is no guarantee of positive trading performance. Investments in emerging markets are by their nature higher risk and potentially more volatile than those inherent in some established markets. Economies in emerging markets generally are heavily dependent upon international trade and, accordingly, have been and may continue to be affected adversely by trade barriers, exchange controls, managed adjustments in relative currency values and other protectionist measures imposed or negotiated by the countries with which they trade. These economies also have been and may continue to be affected adversely by economic conditions in the countries in which they trade. Mutual fund investments are subject to market risks. You should read all scheme related documents carefully. Copyright © The Hongkong and Shanghai Banking Corporation Limited 2018. All rights reserved. No part of this publication may be reproduced, stored in a retrieval system, or transmitted, on any form or by any means, electronic, mechanical, photocopying, recording, or otherwise, without the prior written permission of The Hongkong and Shanghai Banking Corporation Limited.
Issued by The Hongkong and Shanghai Banking Corporation Limited Expiry: 1 Feb 2019

2018 年 8 月 2 日
本投資分析市場評論由滙豐環球投資管理製作,就近期經濟環境提供簡單基本的概要,僅供參考用途。所載之內容只反映製作本文件時之觀點,並
會不時轉變而不另行通知,而且可能並不反映在滙豐集團其他通訊或策略的意見。本市場傳訊資料不應被讀者視為投資意見或作為出售或購入投資
產品的建議,也不應被視為投資研究。所載之內容並非因應旨在提供獨立投資研究的法定要求而準備,亦無受到發放此文件前禁止進行交易的約
束。閣下必須注意,投資價值可升亦可跌,投資者有機會未能取回投資本金。此外,與成熟市場相比,新興市場投資涉及較高風險,而且較為波
動。本文件所載之表現屬歷史數據,過去業績並不代表將來的表現。閣下考慮作出任何投資時,應尋求專業的意見。
滙豐每月專訊
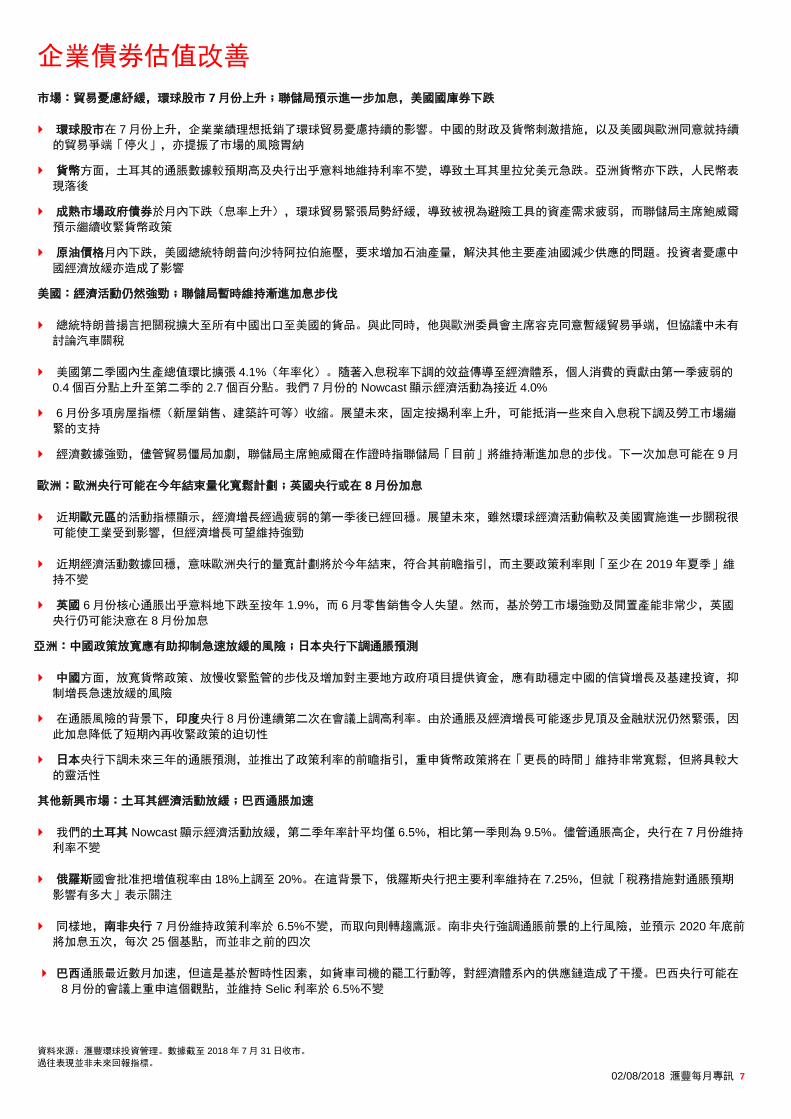
企業債券估值改善
概要 投資企業債券的理據增加
我們對美國投資級別及高收益企業債券的觀點由偏低轉為
中性,導致對環球投資級別及高收益企業債券的觀點亦由
偏低轉為中性。我們對美元新興市場債券的觀點亦由偏低
轉為中性
環球股市 7 月份上升,企業業績理想,抵銷了對環球貿易
的持續憂慮
經濟數據強勁,儘管貿易方面的緊張局勢加劇,聯儲局主
席鮑威爾在作證時指「目前」會維持漸進加息的步伐
近期歐元區的活動指標顯示,在疲弱的第一季過後,經濟
增長已趨於穩定。歐洲央行仍很可能在年底前終止淨買入
債券的計劃
中國方面,放寬貨幣政策、放慢收緊監管的步伐及增加向
地方政府項目提供資金,應有助抑制經濟增長急速放緩的
風險
日本央行下調未來三年的通脹預測,並重申貨幣政策將在
「更長的時期」維持非常寬鬆
環球經濟增長在 2018 年初放緩,但自此穩步回穩。與此
同時,企業的基本因素仍然穩健,違約率偏低。然而,近
期我們認為企業債券的估值越趨吸引,尤其是美國的企業
債券。因此,我們對美國投資級別及高收益企業債券的觀
點由偏低轉為中性,導致我們對環球投資級別債券及高收
益企業債券的觀點亦由偏低提升至中性。我們對歐洲同類
型債券亦更趨樂觀,雖則由於相關估值改善的幅度未算太
大,因此我們對其的觀點仍然維持偏低。其他地區方面,
近期新興市場資產的拋售已改善了美元計值新興市場債券
的估值,我們對該等債券的投資觀點亦由偏低上調至中
性。
我們先前偏向以投資於環球股票及美國國庫券來模仿企業
債券的收益。為了平衡本月份觀點轉變所帶來的影響,我
們會減少這方面的偏向。雖然如此,我們認為環球股票仍
然是從強勁的環球經濟環境中得益的較佳方法,而波幅上
升可帶來買入的機會。與此同時,我們認為美國國庫券仍
較其他成熟市場政府債券吸引(尤其兩年期的票據),雖
則美國通脹上升仍是這項資產類別的主要風險。
股票 政府債券 企業債券及其他 亞洲資產
資產類別 觀點 觀點變動 資產類別 觀點 觀點變動 資產類別 觀點 觀點變動 資產類別 觀點 觀點變動
環球 偏高 – 成熟市場 偏低 – 環球投資級別 中性
新興亞洲固定收益 偏低 –
美國 中性 – 美國 偏低 – 美元投資級別 中性
亞洲日本除外股票 偏高 –
英國 中性 – 英國 偏低 – 歐元及英鎊投資級別 偏低 – 中國 偏高 –
歐元區 偏高 – 歐元區 偏低 – 亞洲投資級別 中性 – 印度 偏高 –
日本 偏高 – 日本 偏低 – 環球高收益 中性
香港 中性 –
新興市場 偏高 – 新興市場(本幣) 偏高 – 美國 中性
新加坡 偏高 –
中、東歐及拉美 中性 – 歐洲 偏低 – 韓國 偏高 –
¤ 亞洲 中性 – 台灣 中性 –
新興市場綜合債券
(美元)
中性
黃金 中性 –
其他商品 中性 –
房地產
中性 –

資料來源:滙豐環球投資管理。所有數字四捨五入至一個小數位。
過往表現並非未來回報指標。
02/08/2018 滙豐每月專訊 2
長線資產類別比重(十二個月以上)
長線資產類別比重概覽的觀點基礎和定義
投資觀點根據 2018 年 7 月期間舉行的滙豐環球投資管理資產配置區域會議、滙豐環球投資管理於 2018 年 6 月 29 日計算的長線預
期回報預測、我們的投資組合優化過程及實際投資組合比重而定。
標誌: 此資產的觀點獲上調 – 沒有變動 此資產的觀點獲下調
偏低、偏高和中性比重分類,是在分散投資、典型的多元資產投資組合中應用的概括性資產配置傾向,反映我們的長線估值訊號、
短線周期性觀點以及實際投資組合比重。上述比重參考了環球投資組合。然而,個別投資組合的比重,可能因應委託、基準、風險
狀況、和個別資產類別在不同地區是否可選以及風險程度而有分別。
「偏高」意味著,在一個充份分散投資的典型多元資產投資組合狀況下,以及相對有關的內部或外部基準,滙豐環球投資會(或應
該會)對該資產類別持正面傾向。
「偏低」意味著,在一個充份分散投資的典型多元資產投資組合狀況下,以及相對有關的內部或外部基準,滙豐環球投資會(或應
該會)對該資產類別持負面傾向。
「中性」意味著,在一個充份分散投資的典型多元資產投資組合狀況下,以及相對有關的內部或外部基準,滙豐環球投資會(或應
該會)對該資產類別沒有特定的負面或正面傾向。
環球投資級別企業債券方面,整體資產類別的偏低、偏高和中性分類,也是基於在分散投資、典型的多元資產投資組合中應用的概
括性資產配置傾向。然而,美元投資級別企業債券、歐元及英鎊,以及亞洲投資級別企業債券的觀點,取決於相對整體環球投資級
別企業債券市場的比重。
亞洲日本除外股票方面,整體區域的偏低、偏高和中性分類,也是基於在分散投資、典型的多元資產投資組合中應用的概括性資產
配置傾向。然而,個別國家的觀點則取決於相對整體亞洲日本除外股票截至 2018 年 7 月 31 日的比重。
同樣地,對新興市場政府債券而言,整體資產類別的偏低、偏高和中性分類,也是基於在分散投資、典型的多元資產投資組合中應
用的概括性資產配置傾向。然而新興亞洲定息資產的觀點則取決於相對整體新興市場政府債券(硬貨幣)截至 2018 年 7 月 31 日的
比重。
股票
資產類別 觀點 變動 簡評
環球 偏高
– 偏高比重的理據﹕就現時所處的盈利週期而言,我們計算所得的環球股票風險溢價
(與現金相比的額外回報)仍見合理。環球經濟增長仍穩健,帶動環球股市在長期錄
得正回報。整體而言,依然寬鬆的貨幣政策及財政政策(如有需要)帶來支持,將在
中長期有望抵銷多項負面影響,包括中國增長放緩、成熟經濟體推行貨幣政策正常化
及不少地區的政治不明朗因素
風險因素﹕股票的隱含風險溢價頗狹窄,限制了市場吸納不利消息的能力。市場關注
環球貿易保護主義、中國經濟狀況,以及/或聯儲局、歐洲央行及日本央行政策正常
化速度可能較預期快,以及政治風險等,或導致市場波幅不時上升。環球經濟展望顯
著和持續走弱亦可為我們的觀點帶來影響
美國 中性
–
正面因素﹕儘管市場波幅近期上升,但企業基本因素仍然強勁,盈利增長前景穩健
(稅務改革或帶來上行風險),美國宏觀經濟環境依然強勁。整體而言,我們計算的
隱含風險溢價(與現金相比的額外回報)仍跟中性觀點吻合
風險因素﹕鑑於當前所處的經濟週期階段,稅務改革對本地生產總值增長的刺激力度
可能較小。聯儲局進一步收緊政策也會帶來風險。目前情況正進一步靠近導致我們重
新評估此市場的股票風險回報是否充分的臨界點。我們也要考慮美國保護主義的風險
(尤其是若進一步採取「以牙還牙」行動的情況出現)

資料來源:滙豐環球投資管理。所有數字四捨五入至一個小數位。
過往表現並非未來回報指標。
02/08/2018 滙豐每月專訊 3
英國 中性
–
正面因素﹕英國主要股票指數中金融及資源股比重較大,應有望受惠於商品價格上升
及利率攀升。整體而言,我們認為目前的估值水平跟中性觀點吻合
風險因素﹕承受英國股票風險的預期回報低於其他市場。實質工資增長偏低及脫歐相
關的變數使英國經濟表現落後
歐元區 偏高
–
偏高比重的理據﹕歐元區股票受惠於隱含風險溢價較高,而歐元區處於早期的經濟活
動週期階段,有利企業盈利好轉。超低的歐洲央行政策利率有望在2020年之前持續
風險因素﹕近期區內經濟活動指標偏軟值得留意。歐盟與美國的貿易壁壘、意大利的
新任民粹政府及英國脫歐談判均對前景構成重大風險。另外,歐洲央行的貨幣政策亦
可能會不及預期寬鬆
日本 偏高
–
偏高比重的理據﹕我們認為相對估值吸引,而政策可帶來支持。大型企業坐擁龐大現
金,意味企業有空間提高派息或進行股份回購。盈利增長趨勢仍見理想
風險因素﹕雖然投資有所回升,但全球貿易增長放緩將令本年度的國內生產總值增長
受壓。其他風險因素包括計劃在2019年10月提高消費稅和薪金增長疲弱。貿易保護主
義為主要風險
新興市場 偏高
– 偏高比重的理據﹕新興市場經濟增長保持穩健,但仍有部分值得留意的例外情況(如
巴西和土耳其)。我們認為估值提供吸引的安全邊際,(個別)新興市場貨幣在中期
仍有顯著升值潛力。我們認為新興亞洲市場的非對沖配置提供最佳的風險調整回報
風險因素﹕關於聯儲局收緊政策的步伐不明朗、貿易保護主義可能升溫、中國經濟轉
型,以及對環球經濟情況的憂慮,均可能在短期內為市場帶來波動。地緣政治不明朗
亦帶來風險
中、東歐及拉丁
美洲
中性
–
正面因素﹕巴西在2017年首季擺脫經濟衰退;墨西哥經濟則表現穩健。我們相信波
蘭、俄羅斯及匈牙利提供吸引的風險溢價
風險因素﹕地緣政治風險高而難以預測。我們認為不少國家的本地現金利率及主權債
息率較高,削弱承受股票風險的理據
政府債券
資產類別 觀點 變動 簡評
成熟市場 偏低
–
偏低比重的理據﹕預期回報仍低於其他資產類別。在利淡債券的環境中(環球經濟活
動強勁、週期性通脹壓力的風險,以及成熟經濟體央行政策逐步正常化),環球債券
息率仍有機會進一步上升
正面因素﹕若市場對經濟增長的憂慮重燃,政府債券仍可提供分散投資的好處。此
外,經濟「長期停滯」的壓力猶在(包括人口老化、生產力及投資低落),而環球安
全資產的供應有限
美國 偏低
–
偏低比重的理據﹕美國正面臨通脹壓力增加。通脹若顯著上升將帶來主要風險
正面因素﹕兩年期國庫劵息率高於美國股息率。我們認為這反映目前毋須承受多餘的
風險便可達致目標收益水平。我們也認為十年期國庫劵可受惠於經濟衰退憂慮。此乃
以「價格穩定」的環境為考慮依據。我們維持現時觀點,保持正面偏向(即接近中
性)
英國 偏低
–
偏低比重的理據﹕英國政府債券的預期回報持續欠佳,承受利率風險要面臨損失
正面因素﹕儘管英國央行在增長面臨下行風險及通脹率正朝向目標水平之下暗示政策
將逐步收緊,但貨幣政策仍有望保持相對寬鬆
歐元區 偏低
–
偏低比重的理據﹕我們認為核心歐洲債券估值過高。主要風險因素來自歐洲央行將在
本年度結束資產購買計劃
正面因素﹕區內核心通脹壓力仍低企,有助寬鬆貨幣政策維持更長時間
日本 偏低
–
偏低比重的理據﹕我們認為日本政府債券的估值過高,日本央行近期也減少購買政府
債券,並有機會調整孳息目標框架
正面因素﹕「孳息曲線管控」的政策框架應會限制市場的波動性,並減低短期息率大
幅上升的風險
新興市場 偏高
–
偏高比重的理據﹕大部分國家的高預期回報(尤其是相對於各種投資機會而言)。我
們預期新興市場貨幣可帶來持續回報,這鞏固了我們繼續以非對沖方式持有此類資產
的看法
風險因素﹕聯儲局收緊貨幣政策步伐或較預期快,以及美元急速升值均為主要風險。
新興市場的經濟及政治制度分歧,也反映選擇性配置是關鍵所在

資料來源:滙豐環球投資管理。所有數字四捨五入至一個小數位。
過往表現並非未來回報指標。
02/08/2018 滙豐每月專訊 4
企業債券
資產類別 觀點 變動 簡評
環球投資級別 中性
觀點變動的理據﹕投資級別企業債券的潛在回報改善,現時的隱含信貸風險溢價較
先前更佳
正面因素﹕宏觀環境仍為信貸帶來支持。隱含的衰退機會仍處於極低水平。違約風
險及降級風險目前似乎有限
風險因素﹕儘管信貸溢價增加,應對負面因素(如數據或違約前景轉差)的安全邊
際不高。我們仍然認為,通過投資股票來受惠於增長機遇的價格較佳
- 美元投資
級別
中性
觀點變動的理據﹕美國投資級別企業債券的潛在回報改善,現時的隱含信貸風險溢
價較先前更佳
正面因素﹕我們認為美國投資級別債券較歐洲信貸吸引。經審慎挑選的美國信貸或
有機會表現領先
風險因素﹕美國投資級別企業債券的「存續期」(對於整體利率變動的敏感度)處
於歷史高位;我們認為,若聯儲局加快收緊政策步伐,有關債券會較受影響
- 歐元及英鎊
投資級別
偏低
–
偏低比重的理據﹕歐元投資級別債券的潛在回報受累於存續期風險溢價呈負數(即
要為承受利率風險面臨損失)
正面因素﹕歐洲央行的企業債購買計劃和聲稱將重新投資到期資產「一段較長時
間」目前繼續帶來支持,違約率保持偏低
- 亞洲
投資級別
中性
– 正面因素﹕在投資級別領域中,亞洲信貸提供的利差較成熟市場吸引。我們計算所
得的隱含信貸風險溢價較高。新興亞洲市場的整體活動強勁,以及大部分國家的貨
幣政策取向中性,也帶來支持
風險因素﹕聯儲局政策正常化的步伐較預期快帶來主要風險,尤其是對借入美元的
企業而言。保護主義升溫的風險也不容忽視,而中國槓桿水平也是長期問題
環球高收益 中性
觀點變動的理據﹕高收益企業債券的潛在回報改善,現時的隱含信貸風險溢價較先
前更佳
正面因素﹕高收益債券面對增長風險多於利率風險。隨着環球經濟活動強勁,企業
基本因素穩健,違約率偏低。我們偏好較高評級的高收益債券
風險因素﹕我們的計算顯示,透過股票來受惠於強勁的經濟環境,可達致更佳回報
- 美國高收益 中性
觀點變動的理據﹕美國高收益企業債券的潛在回報改善,現時的隱含信貸風險溢價
較先前更佳
正面因素﹕美國經濟活動普遍走強,持續支持企業基本因素。稅務改革亦有幫助。
違約率偏低。高收益債券的有效存續期較短,較易面對增長風險多於利率風險
風險因素﹕美國高收益信貸較受經濟數據或違約前景轉差所影響。聯儲局政策緊縮
周期更進取將帶來主要風險
- 歐洲高收益 偏低
偏低比重的理據﹕歐元高收益債券的利差與歐洲股票比較吸引力較遜。歐洲央行的
資產購買計劃(迄今利好此資產類別)將於今年年底終結。整體而言,我們計算所
得的歐元高收益債券潛在經風險調整回報與偏低的配置吻合
正面因素﹕歐元區經濟復甦強勁,加上歐洲央行資產購買計劃的溢出影響仍帶來支
持。違約前景亦似乎良性
- 亞洲高收益 中性
正面因素﹕我們認為亞洲高收益債券的利差似乎較吸引,其經風險調整回報較高。
經濟增長動力強勁,通脹壓力似乎大致企穩
風險因素﹕聯儲局加快貨幣政策正常化的步伐,或會帶來主要風險,尤其是對借入
美元的企業而言。保護主義升溫的風險也不容忽視,而中國槓桿水平也是長期問題
其他
資產類別 觀點 變動 簡評
新興市場綜合債券
(美元)
中性
觀點變動的理據﹕新興市場主流貨幣債券的潛在回報改善,現時的隱含信貸風險溢
價較先前更佳
正面因素﹕投資者尋求收益或持續支持新興市場主流貨幣債券
風險因素﹕聯儲局取向趨於鷹派及美元轉強,為新興市場的美元計價債券帶來重大
風險。不少經濟體的美元債務槓桿水平高企
黃金 中性
–
正面因素﹕黃金期貨為我們的多元資產投資組合提供合理的分散投資優勢,並具備
對沖通脹的作用
風險因素﹕根據我們的預期回報框架,在目前的市場價格下,黃金期貨的潛在回報
似乎欠佳。這是由於預期轉倉收益(期貨合約續期的成本)呈高負數,加上預期現
貨價格回報呈負數

資料來源:滙豐環球投資管理。所有數字四捨五入至一個小數位。
過往表現並非未來回報指標。
02/08/2018 滙豐每月專訊 5
其他商品 中性
–
正面因素﹕商品期貨為我們的多元資產投資組合提供合理的分散投資優勢,並具備
對沖通脹的作用
風險因素﹕根據我們的預期回報框架,在目前的市場價格下,商品期貨的潛在回報
似乎欠佳。這主要由於預期轉倉收益(期貨合約續期的成本)呈高負數
房地產 中性
–
正面因素﹕環球房地產股的股息率截至2018年6月底為4.0%,比普遍股份的股息率
高154個基點,在低息環境下具有吸引力。長遠而言,租金與整體經濟增長關係密
切,提供了若干通脹對沖。鑑於我們對租金增長和股息的展望,我們認為房地產股
票的長線回報較成熟市場政府債券合理地吸引
風險因素﹕專注於零售地產的房地產股較受電子商貿壓力和購物習慣改變影響,但
此影響被物流樓宇的強勁需求部分抵銷。環球貿易爭議急速升溫或影響租戶的普遍
需求,尤其是高度依賴出口的國家。利率出乎意料上調或對短期價格構成不利影
響。脫歐繼續令英國蒙上陰霾,對倫敦市中心的辦公室影響尤甚
亞洲資產
資產類別 觀點 變動 簡評
新興亞洲固定收益
市場
偏低
–
偏低比重的理據﹕短期而言,這類資產對美國貨幣政策敏感。美國採取較緩慢的加
息週期,將利好此資產類別。亞洲債券息差(摩根大通新興市場債券環球亞洲指數
息差在7月31日為178基點)相對其他新興市場顯得尤其狹窄(以摩根大通新興市場
債券環球拉丁美洲指數為例,息差為465基點),削弱其中短期的相對吸引力
正面因素﹕長線回報訊號維持正面,受穩健經濟基調、通脹穩定及信貸質素所支持
亞洲日本除外股票 偏高
–
偏高比重的理據﹕我們認為亞洲(日本除外)股票的風險調整回報尤其吸引,而若
宏觀經濟環境轉趨不利時,目前估值的「安全邊際」亦合理。亞洲的盈利增長強
勁。亞洲貨幣在中期有升值空間
風險因素﹕美國國庫劵息率進一步上升和成熟經濟體的政策正常化是主要風險。其
他風險包括美國貿易保護主義政策、地緣政治事件、商品價格及/或貨幣波動、環球
增長步伐減弱,以及市場再次憂慮中國增長及金融穩定性
- 中國 偏高
–
偏高比重的理據﹕盈利增長依然穩健,邊際利潤擴張,股本回報亦上升。估值並不
偏高。流動性在貨幣寬鬆下有望改善。去槓桿化過程緩和/放寬收緊的規管政策,
有助信貸增長和銀行及保險。財政政策具擴張性,提供減稅措施和研發投資,並為
基建項目提供更多資金。潛在長遠催化劑包括市場結構性改變及金融自由化
風險因素﹕主要外圍風險為中美貿易緊張關係升溫,以及美國/環球利率提高或中
國的宏觀憂慮加深,導致資金外流壓力重燃。供給側改革的挫敗為另一項主要風
險,當中包括金融改革(去槓桿化、清除影子銀行、合理的信貸風險定價等)。平
衡不斷互相抵觸的經濟和金融目標為主要政策挑戰。房地產行業繼續面對資金緊絀
的情況
- 印度 偏高 – 偏高比重的理據﹕週期性復甦持續支持盈利改善。政策聚焦於鄉村/農業,利好短
期消費(尤其是如雨季情況向好)及相關行業。改善銀行不良資產解決程序的政策
措施可讓信貸文化與質素得到結構性改善。印度央行採取積極主動的政策,保障其
控制通脹的公信力和確保宏觀經濟穩定
風險因素﹕宏觀穩定性持續受壓(如經常賬赤字擴大、財政下行風險和通脹風險
等)。環球和國內金融環境緊絀、國內銀行業問題、油價高企令貿易條件受打擊和
美國保護主義均帶來挑戰。盈利估算的修訂趨勢仍然疲弱。估值欠吸引力。生產成
本上升令製造業的邊際利利潤受壓。
- 香港 中性
–
正面因素﹕擴張性的2019財年預算案利好增長前景。(內地)入境旅客復甦及本地
內需消費穩健(受惠於勞動市場趨緊及資產/樓價高企),支持零售銷售表現。市
場流動性仍見充裕。香港經濟具備強勁的對外資產負債表、家庭儲蓄較高及銀行業
穩健
風險因素﹕港元銀行同業拆息(HIBOR)的任何顯著上升將不利香港資產市場及經
濟。除加息(連帶最優惠利率上升)和供應增加的風險外,樓市的政策風險持續。
中美貿易摩擦升溫、中國金融風險蔓延和環球金融狀況波動乃風險所在
- 新加坡 偏高
–
偏高比重的理據﹕零售銷售(因政策影響而撇除汽車)緩步復甦、勞動市場緊張,
經濟增長有望維持穩健(但步伐略為放緩)。具擴張性的財政政策支持增長。新加
坡的每股盈利增長預期高於其他東盟市場,且股本回報正在提高。股息率相對偏高
是利好因素
風險因素﹕新加坡面對環球金融環境趨緊、全球需求放緩和貿易保護主義的風險,
也對美元走勢較敏感。國內流動性可能繼續緊絀,原因包括存款增長疲弱、借貸增
長穩健和新加坡銀行同業拆息(SIBOR)逐步提高。物業市場面臨按揭利率/債務
上升和政策冷卻措施的風險

資料來源:滙豐環球投資管理。所有數字四捨五入至一個小數位。
過往表現並非未來回報指標。
02/08/2018 滙豐每月專訊 6
- 韓國 偏高
–
偏高比重的理據﹕出口增長(不包括造船)仍穩健。北韓的地緣政治風險有望減退
和企業管治改革,長遠或帶來估值重估的可能性。「收入主導增長」的政策計劃/
稅務改革和財政政策具擴張性,支持國內需求。盈利增長維持穩健,估值具吸引力
風險因素﹕勞動市場持續影響消費,部分反映最低工資政策和企業重組的影響。規
管措施令房屋市場受壓。韓國面對貿易保護主義、環球需求放緩及地緣政治風險影
響。企業入息稅增加、勞工政策和能源價格上升將可能增加成本,對利潤率構成壓
力
- 台灣 中性
–
正面因素﹕外圍需求前景普遍持續向好,近期數據顯示科技產品出口經歷數個月的
疲弱表現後有溫和改善。科技業的新增長動力包括人工智能、物聯網及 5G 系統等。
政府開始實施多年的公共基建投資計劃。股息率相對較高
風險因素﹕中美貿易摩擦升溫及環球增長若放緩是主要風險,因台灣偏重地區性
(科技)供應鏈。台灣科技業面對中國的競爭加劇。風險因素包括環球金融市場波
動、地緣政治局勢緊張和中國對台灣施加政治和軍事壓力及油價帶來衝擊
資料來源:滙豐環球投資管理。數據截至 2018 年 7 月 31 日收市。
過往表現並非未來回報指標。
02/08/2018 滙豐每月專訊 7
企業債券估值改善
市場︰貿易憂慮紓緩,環球股市 7 月份上升﹔聯儲局預示進一步加息,美國國庫券下跌
環球股市在 7 月份上升,企業業績理想抵銷了環球貿易憂慮持續的影響。中國的財政及貨幣刺激措施,以及美國與歐洲同意就持續
的貿易爭端「停火」,亦提振了市場的風險胃納
貨幣方面,土耳其的通脹數據較預期高及央行出乎意料地維持利率不變,導致土耳其里拉兌美元急跌。亞洲貨幣亦下跌,人民幣表
現落後
成熟市場政府債券於月內下跌(息率上升),環球貿易緊張局勢紓緩,導致被視為避險工具的資產需求疲弱,而聯儲局主席鮑威爾
預示繼續收緊貨幣政策
原油價格月內下跌,美國總統特朗普向沙特阿拉伯施壓,要求增加石油產量,解決其他主要產油國減少供應的問題。投資者憂慮中
國經濟放緩亦造成了影響
美國︰經濟活動仍然強勁﹔聯儲局暫時維持漸進加息步伐
總統特朗普揚言把關稅擴大至所有中國出口至美國的貨品。與此同時,他與歐洲委員會主席容克同意暫緩貿易爭端,但協議中未有
討論汽車關稅
美國第二季國內生產總值環比擴張 4.1%(年率化)。隨著入息稅率下調的效益傳導至經濟體系,個人消費的貢獻由第一季疲弱的
0.4 個百分點上升至第二季的 2.7 個百分點。我們 7 月份的 Nowcast 顯示經濟活動為接近 4.0%
6 月份多項房屋指標(新屋銷售、建築許可等)收縮。展望未來,固定按揭利率上升,可能抵消一些來自入息稅下調及勞工市場繃
緊的支持
經濟數據強勁,儘管貿易僵局加劇,聯儲局主席鮑威爾在作證時指聯儲局「目前」將維持漸進加息的步伐。下一次加息可能在 9 月
歐洲︰歐洲央行可能在今年結束量化寬鬆計劃﹔英國央行或在 8 月份加息
近期歐元區的活動指標顯示,經濟增長經過疲弱的第一季後已經回穩。展望未來,雖然環球經濟活動偏軟及美國實施進一步關稅很
可能使工業受到影響,但經濟增長可望維持強勁
近期經濟活動數據回穩,意味歐洲央行的量寬計劃將於今年結束,符合其前瞻指引,而主要政策利率則「至少在 2019 年夏季」維
持不變
英國 6 月份核心通脹出乎意料地下跌至按年 1.9%,而 6 月零售銷售令人失望。然而,基於勞工市場強勁及閒置產能非常少,英國
央行仍可能決意在 8 月份加息
亞洲︰中國政策放寬應有助抑制急速放緩的風險﹔日本央行下調通脹預測
中國方面,放寬貨幣政策、放慢收緊監管的步伐及增加對主要地方政府項目提供資金,應有助穩定中國的信貸增長及基建投資,抑
制增長急速放緩的風險
在通脹風險的背景下,印度央行 8 月份連續第二次在會議上調高利率。由於通脹及經濟增長可能逐步見頂及金融狀況仍然緊張,因
此加息降低了短期內再收緊政策的迫切性
日本央行下調未來三年的通脹預測,並推出了政策利率的前瞻指引,重申貨幣政策將在「更長的時間」維持非常寬鬆,但將具較大
的靈活性
其他新興市場︰土耳其經濟活動放緩﹔巴西通脹加速
我們的土耳其 Nowcast 顯示經濟活動放緩,第二季年率計平均僅 6.5%,相比第一季則為 9.5%。儘管通脹高企,央行在 7 月份維持
利率不變
俄羅斯國會批准把增值稅率由 18%上調至 20%。在這背景下,俄羅斯央行把主要利率維持在 7.25%,但就「稅務措施對通脹預期
影響有多大」表示關注
同樣地,南非央行 7 月份維持政策利率於 6.5%不變,而取向則轉趨鷹派。南非央行強調通脹前景的上行風險,並預示 2020 年底前
將加息五次,每次 25 個基點,而並非之前的四次
巴西通脹最近數月加速,但這是基於暫時性因素,如貨車司機的罷工行動等,對經濟體系內的供應鏈造成了干擾。巴西央行可能在
8 月份的會議上重申這個觀點,並維持 Selic 利率於 6.5%不變
資料來源:滙豐環球投資管理。數據截至 2018 年 7 月 31 日收市。
過往表現並非未來回報指標。
02/08/2018 滙豐每月專訊 8
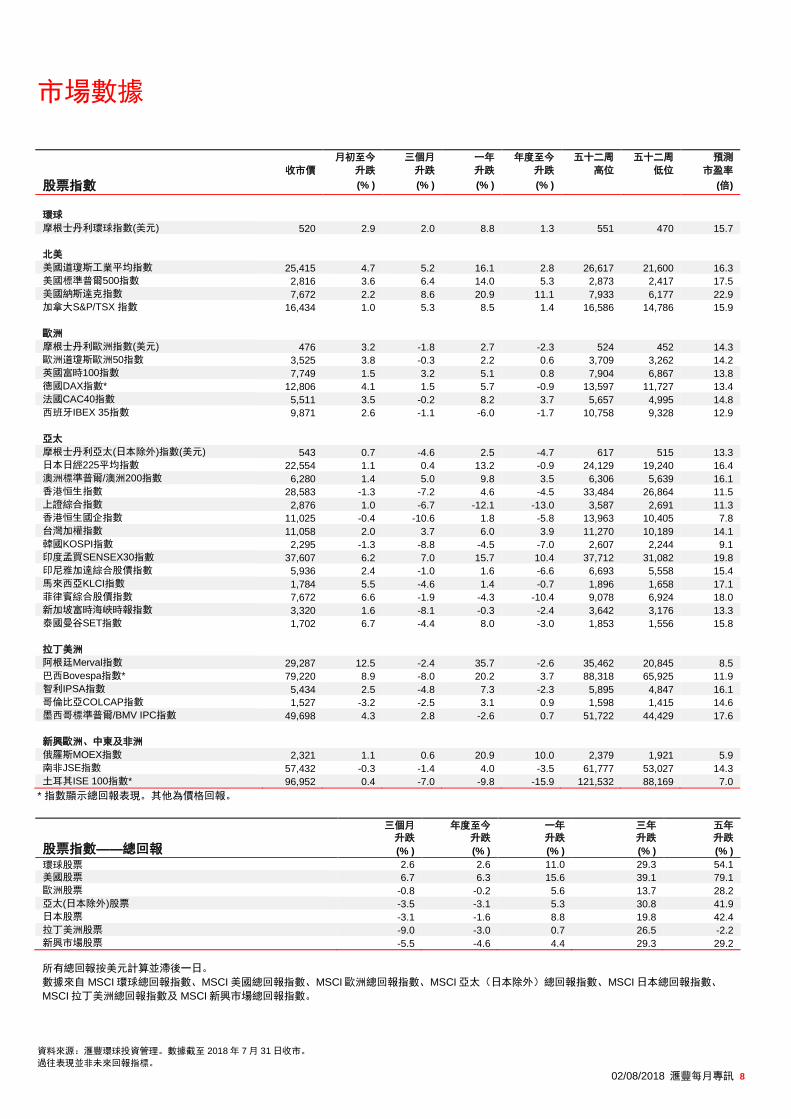
市場數據
月初至今 三個月 一年 年度至今 五十二周 五十二周 預測
收市價 升跌 升跌 升跌 升跌 高位 低位 市盈率
股票指數 (% ) (% ) (% ) (% ) (倍)
環球
摩根士丹利環球指數(美元) 520 2.9 2.0 8.8 1.3 551 470 15.7
北美
美國道瓊斯工業平均指數 25,415 4.7 5.2 16.1 2.8 26,617 21,600 16.3
美國標準普爾500指數 2,816 3.6 6.4 14.0 5.3 2,873 2,417 17.5
美國納斯達克指數 7,672 2.2 8.6 20.9 11.1 7,933 6,177 22.9
加拿大S&P/TSX 指數 16,434 1.0 5.3 8.5 1.4 16,586 14,786 15.9
歐洲
摩根士丹利歐洲指數(美元) 476 3.2 -1.8 2.7 -2.3 524 452 14.3
歐洲道瓊斯歐洲50指數 3,525 3.8 -0.3 2.2 0.6 3,709 3,262 14.2
英國富時100指數 7,749 1.5 3.2 5.1 0.8 7,904 6,867 13.8
德國DAX指數* 12,806 4.1 1.5 5.7 -0.9 13,597 11,727 13.4
法國CAC40指數 5,511 3.5 -0.2 8.2 3.7 5,657 4,995 14.8
西班牙IBEX 35指數 9,871 2.6 -1.1 -6.0 -1.7 10,758 9,328 12.9
亞太
摩根士丹利亞太(日本除外)指數(美元) 543 0.7 -4.6 2.5 -4.7 617 515 13.3
日本日經225平均指數 22,554 1.1 0.4 13.2 -0.9 24,129 19,240 16.4
澳洲標準普爾/澳洲200指數 6,280 1.4 5.0 9.8 3.5 6,306 5,639 16.1
香港恒生指數 28,583 -1.3 -7.2 4.6 -4.5 33,484 26,864 11.5
上證綜合指數 2,876 1.0 -6.7 -12.1 -13.0 3,587 2,691 11.3
香港恒生國企指數 11,025 -0.4 -10.6 1.8 -5.8 13,963 10,405 7.8
台灣加權指數 11,058 2.0 3.7 6.0 3.9 11,270 10,189 14.1
韓國KOSPI指數 2,295 -1.3 -8.8 -4.5 -7.0 2,607 2,244 9.1
印度孟買SENSEX30指數 37,607 6.2 7.0 15.7 10.4 37,712 31,082 19.8
印尼雅加達綜合股價指數 5,936 2.4 -1.0 1.6 -6.6 6,693 5,558 15.4
馬來西亞KLCI指數 1,784 5.5 -4.6 1.4 -0.7 1,896 1,658 17.1
菲律賓綜合股價指數 7,672 6.6 -1.9 -4.3 -10.4 9,078 6,924 18.0
新加坡富時海峽時報指數 3,320 1.6 -8.1 -0.3 -2.4 3,642 3,176 13.3
泰國曼谷SET指數 1,702 6.7 -4.4 8.0 -3.0 1,853 1,556 15.8
拉丁美洲
阿根廷Merval指數 29,287 12.5 -2.4 35.7 -2.6 35,462 20,845 8.5
巴西Bovespa指數* 79,220 8.9 -8.0 20.2 3.7 88,318 65,925 11.9
智利IPSA指數 5,434 2.5 -4.8 7.3 -2.3 5,895 4,847 16.1
哥倫比亞COLCAP指數 1,527 -3.2 -2.5 3.1 0.9 1,598 1,415 14.6
墨西哥標準普爾/BMV IPC指數 49,698 4.3 2.8 -2.6 0.7 51,722 44,429 17.6
新興歐洲、中東及非洲
俄羅斯MOEX指數 2,321 1.1 0.6 20.9 10.0 2,379 1,921 5.9
南非JSE指數 57,432 -0.3 -1.4 4.0 -3.5 61,777 53,027 14.3
土耳其ISE 100指數* 96,952 0.4 -7.0 -9.8 -15.9 121,532 88,169 7.0
* 指數顯示總回報表現。其他為價格回報。
三個月 年度至今 一年 三年 五年
股票指數——總回報
升跌 升跌 升跌 升跌 升跌
(% ) (% ) (% ) (% ) (% )
環球股票 2.6 2.6 11.0 29.3 54.1
美國股票 6.7 6.3 15.6 39.1 79.1
歐洲股票 -0.8 -0.2 5.6 13.7 28.2
亞太(日本除外)股票 -3.5 -3.1 5.3 30.8 41.9
日本股票 -3.1 -1.6 8.8 19.8 42.4
拉丁美洲股票 -9.0 -3.0 0.7 26.5 -2.2
新興市場股票 -5.5 -4.6 4.4 29.3 29.2
所有總回報按美元計算並滯後一日。
數據來自 MSCI 環球總回報指數、MSCI 美國總回報指數、MSCI 歐洲總回報指數、MSCI 亞太(日本除外)總回報指數、MSCI 日本總回報指數、
MSCI 拉丁美洲總回報指數及 MSCI 新興市場總回報指數。

資料來源:滙豐環球投資管理。數據截至 2018 年 7 月 31 日收市。
過往表現並非未來回報指標。
02/08/2018 滙豐每月專訊 9
市場數據(續)
月初至今 三個月 一年 年度至今
債券指數
收市價 升跌 升跌 升跌 升跌
(% ) (% ) (% ) (% )
巴克萊環球綜合債券指數(以美元對沖) 515 0.0 0.6 1.3 0.1
摩根大通全球新興市場債券指數 781 2.1 -0.1 -1.1 -3.3
巴克萊美國企業債券指數(美元) 2,830 0.8 0.8 -0.7 -2.5
巴克萊歐洲企業債券指數(歐元) 246 0.3 0.0 0.6 -0.4
巴克萊環球高收益債券指數(以美元對沖) 468 1.7 0.4 1.8 -0.2
Markit iBoxx 亞洲(日本除外)債券指數(美元) 192 0.8 0.1 -0.6 -1.9
Markit iBoxx 亞洲(日本除外)高收益債券指數(美元) 246 2.1 -1.2 0.1 -2.6
總回報包括股息和利息收入,以及資產價格在期內的升值或貶值。
債券
上個月 三個月前 一年前 2017年底
收市價 收市價 收市價 收市價 收市價
美國國庫債券孳息率(%)
三個月 2.02 1.91 1.80 1.07 1.38
兩年期 2.67 2.53 2.49 1.35 1.88
五年期 2.85 2.74 2.80 1.84 2.21
十年期 2.96 2.86 2.95 2.29 2.41
三十年期 3.08 2.99 3.12 2.90 2.74
成熟市場10年期債券孳息率(%)
日本 0.06 0.03 0.05 0.08 0.04
英國 1.33 1.28 1.42 1.23 1.19
德國 0.44 0.30 0.56 0.54 0.42
法國 0.73 0.66 0.78 0.80 0.78
意大利 2.72 2.67 1.78 2.09 2.01
西班牙 1.40 1.32 1.27 1.48 1.56
上個月 三個月前 一年前 2017年底 五十二周 五十二周
貨幣(兌美元) 收市價 收市價 收市價 收市價 收市價 高位 低位
成熟市場
歐元 1.17 1.17 1.21 1.18 1.20 1.26 1.15
英鎊 1.31 1.32 1.38 1.32 1.35 1.44 1.28
瑞士法郎 1.01 1.01 1.01 1.03 1.03 1.09 0.99
加元 1.30 1.31 1.28 1.25 1.26 1.34 1.21
日圓 111.9 110.8 109.3 110.3 112.7 114.7 104.6
澳元 1.35 1.35 1.33 1.25 1.28 1.37 1.23
新西蘭元 1.47 1.48 1.42 1.33 1.41 1.50 1.34
亞洲
港元 7.85 7.85 7.85 7.81 7.81 7.85 7.79
人民幣 6.82 6.62 6.33 6.73 6.51 6.84 6.24
印度盧比 68.55 68.47 66.66 64.19 63.87 69.13 63.25
馬來西亞令吉 4.07 4.04 3.92 4.28 4.05 4.30 3.85
韓國圜 1,119 1,115 1,068 1,119 1,067 1,150 1,054
新台幣 30.63 30.48 29.61 30.21 29.73 30.74 28.96
拉丁美洲
巴西雷亞爾 3.76 3.88 3.51 3.13 3.31 3.97 3.08
哥倫比亞披索 2,889 2,932 2,803 2,986 2,986 3,080 2,685
墨西哥披索 18.65 19.91 18.71 17.80 19.66 20.96 17.57
東歐、中東及非洲
俄羅斯盧布 62.53 62.78 62.98 59.78 57.69 65.04 55.56
南非蘭特 13.28 13.73 12.46 13.19 12.38 14.57 11.51
土耳其里拉 4.91 4.59 4.06 3.52 3.80 4.97 3.39 月初至今 三個月 一年 年度至今 五十二周 五十二周
升跌 升跌 升跌 升跌 高位 低位
商品 收市價 (% ) (% ) (% ) (% )
黃金 1,224 -2.3 -6.9 -3.6 -6.1 1,366 1,211
歐洲原油 74.3 -6.5 -1.2 41.0 11.0 81 50
美國原油 68.8 -7.3 0.3 37.1 13.8 75 46
R/J CRB 期貨指數 195 -2.9 -3.7 6.5 0.3 207 175
LME 銅價 6,300 -4.9 -7.4 -1.1 -13.1 7,348 5,988

致客戶的重要資訊:
警告:本文件的內容未經任何香港或任何其他司法管轄區的監管機構審閱。建議您就相關投資及本文件內容審慎行事。如您對本文件的
內容有任何疑問,應向獨立人士尋求專業意見。
本文件由香港上海滙豐銀行有限公司(「本行」)在 香港經營受管制業務期間發佈,可在其他可合法分發本文件的司法管轄區進行分
發,並僅供收件人使用。本文件內容不得複製或進一步分發予任何人士或實體作任何用途,不論是全部或部分內容。本文件不得分發予
美國、加拿大或澳洲,或任何其他分發本文件屬非法行為的司法管轄區。所有未經授權複製或使用本文件的行為均屬使用者的責任,並
可能引致法律訴訟。
本文件沒有合約價值,並不是且不應被詮釋為進行任何投資買賣,或認購或參與任何服務的要約或要約招攬或建議。本行並沒有建議或
招攬任何基於本文件的行動。
本文件內列明的資訊及/或表達的意見由滙豐環球投資管理有限公司提供。我們沒有義務向您發佈任何進一步的刊物或更新本文件的內
容,該等內容或隨時變更,並不另行通知。該等內容僅表示作為一般資訊用途的一般市場資訊及/或評論,並不構成買賣投資項目的投
資建議或推薦或回報保證。本行沒有參與有關資訊及意見的準備工作。本行對本文件內的資訊及/或意見之準確性及/或完整性不作任
何擔保、申述或保證,亦不承擔任何責任,包括任何從相信為可靠但未有獨立進行驗證的來源取得之第三方資訊。任何情況下,本行或
滙豐集團均不對任何與您使用本文件或依賴或使用或無法使用本文件內資訊相關的任何損害、損失或法律責任承擔任何責任,包括但不
限於直接或間接、特殊、附帶、相應而生的損害、損失或法律責任。
如您持有滙豐環球投資管理有限公司管理的個人投資組合,本文件內的意見不一定代表目前投資組合的構成部分。滙豐環球投資管理有
限公司管理的個人投資組合主要反映個別客戶的投資目標、風險喜好、投資年期及市場流動性。
本文件內含的資訊未有按您的個人情況審閱。請注意,此資訊並非用作協助作出法律、財政或其他諮詢問題的決定,亦不應作為任何投
資或其他決定的依據。您應根據您的投資經驗、目標、財政資源及有關情況,仔細考慮所有投資觀點及投資產品是否合適。您可自行作
出投資決定,但除非向您出售產品的中介人根據您的財政情況、投資經驗及投資目標,向您說明該產品適合您,否則不應投資於任何產
品。您應細閱相關產品銷售文件了解詳情。
本文件內部分陳述可視為前瞻性陳述,提供目前對未來事件的預期或預測。有關前瞻性陳述並非未來表現或事件的擔保,並涉及風險及
不穩定因素。該等陳述不代表任何一項投資,僅用作說明用途。客戶須注意,不能保證本文件內描述的經濟狀況會在未來維持不變。實
際結果可能因多種因素而與有關前瞻性陳述所描述的情況有重大差異。我們不保證該等前瞻性陳述內的期望將獲證實或能夠實現,警告
您不要過份依賴有關陳述。我們沒有義務更新本文件內的前瞻性陳述,不論是基於新資訊、未來事件或其他原因,亦沒有義務更新實際
結果與前瞻性陳述預期不同的原因。
投資涉及風險,必須注意投資的資本價值,且所得收益可升可跌,甚至變得毫無價值,投資者可能無法取回最初投資的金額。本文件內
列出的過往表現並非未來表現的可靠指標,不應依賴任何此內的預測、預期及模擬作為未來結果的指標。有關過往表現的資料可能過
時。有關最新資訊請聯絡您的客戶經理。
任何市場的投資均可能出現極大波動,並受多種因直接及間接因素造成不同幅度的突發波動影響。這些特徵可導致涉及有關市場的人士
蒙受巨大損失。若提早撤回或終止投資,或無法取回投資全額。除一般投資風險外,國際投資可能涉及因貨幣價值出現不利波動、公認
會計原則之差別或特定司法管轄區經濟或政治不穩而造成的資本損失風險。範圍狹窄的投資及較小規模的公司一般會出現較大波動。不
能保證交易表現正面。新興市場的投資本質上涉及較高風險,可能較其他成熟市場固有的投資出現較大波動。新興市場的經濟大幅取決
於國際貿易,因此一直以來並可能繼續會受貿易壁壘、外匯管制、相對幣值控制調整及其他貿易國家實施或協商的保障措施不利影響。
有關經濟亦一直並可能繼續受其貿易國的經濟情況不利影響。互惠基金投資受市場風險影響,您應細閱所有計劃相關文件。
版權所有 © 香港上海滙豐銀行有限公司 2018。保留一切權利。未經香港上海滙豐銀行有限公司事先書面許可,不得以任何形式或任何
方式(無論是電子、機械、影印、攝錄或其他方式)複製或傳送本刊物任何部分或將其任何部分儲存於檢索系統內。
由香港上海滙豐銀行有限公司刊發
Issued by The Hongkong and Shanghai Banking Corporation Limited
Expiry: 1 Feb 2019