corporate financing trends and balance sheet risks in · pdf file ·...
TRANSCRIPT
WP/15/10
Corporate Financing Trends and Balance Sheet
Risks in Latin America:
Taking Stock of “The Bon(d)anza”
Fabiano Rodrigues Bastos, Herman Kamil, and Bennett Sutton
© 2015 International Monetary Fund WP/15/10
IMF Working Paper
Western Hemisphere Department
Corporate Financing Trends and Balance Sheet Risks in Latin America: Taking Stock of
“The Bon(d)anza”1
Prepared by Fabiano Rodrigues Bastos, Herman Kamil, and Bennett Sutton
Authorized for distribution by Krishna Srinivasan
January 2015
Abstract
Easy global liquidity conditions, stronger risk appetite and a retrenchment in cross-border bank
lending led to a surge in emerging market firms’ bond issuance in international markets (what we
term “The Bon(d)anza”). Using firm-level data for five large Latin American economies, we
provide evidence of a significant change in companies’ external funding strategies and liability
structures after 2010, as well as in the balance sheet risks that firms face. We find that stepped up
bond issuance was mostly aimed at re-financing rather than funding investment projects, as firms
extended the average duration of their debt while securing lower fixed-rates, reducing roll-over and
interest rate risks. The shift towards safer maturity structures has come at the expense of a
leveraging-up in foreign-currency-denominated financial debt in several countries— reversing a de-
dollarization trend seen during the last decade. We also provide evidence that a substantial part of
these bonds were issued through offshore vehicles, suggesting regulatory and tax arbitrage
strategies. For some corporations, rising dollar debt and high leverage will be particularly taxing in
an environment of US dollar strengthening, less buoyant commodity prices and slowing domestic
activity.
JEL Classification Numbers: G32, G15, E44
Keywords: Bond issuance, financial markets, corporate leverage, Latin America
Author’s E-Mail Addresses: [email protected], [email protected],
1 We would like to thank Andre Meier, Alejandro Werner, Krishna Srinivasan, Hamid Faruqee, Alfredo Cuevas,
Mercedes Garcia-Escribano, and participants at the IMFs Western Hemisphere seminar and Inter-Departmental
Surveillance meetings for useful comments. We are grateful to Chris Walker, Luigi Ruggerone, Julian Chow, Evan
Papageorgiou, and especially Shamir Tanna (all from the Monetary and Capital Markets Department) for insightful
discussions and help with the data. All remaining errors and omissions are our own responsibility.
This Working Paper should not be reported as representing the views of the IMF.
The views expressed in this Working Paper are those of the author(s) and do not necessarily
represent those of the IMF or IMF policy. Working Papers describe research in progress by the
author(s) and are published to elicit comments and to further debate.

2
Contents Page
I. Introduction ............................................................................................................................3
II. Data .......................................................................................................................................5
III. Overview of NFCs Bond Issuance in LA-5 Economies ......................................................6
IV. Leverage and Debt Service Capacity ...................................................................................7
V. Shifts in Liability Structures ...............................................................................................12
VI. Issuance Through Foreign Subsidiaries .............................................................................14
VII. Conclusions ......................................................................................................................15 References ................................................................................................................................16
Annex .......................................................................................................................................18
Figures
1. Nonfinancial Corporates Bond ..............................................................................................7 2. Nonfinancial Corporates Bond Issuance ................................................................................7
3. Median Debt to Equity Ratio .................................................................................................9 4. Weak Tail (25th Percentile) of Debt to Equity Ratio ............................................................9 5. Net Debt to Earnings ............................................................................................................10
6. Interest Coverage Ratio........................................................................................................10 7. Investment to Total Debt .....................................................................................................11
8. Cash To Gross Interest Expenses .........................................................................................11 9. LA5: Corporate Term Loan Financing ................................................................................12
10. LA5: Investment Grade Yield Curves for Nonfinancial Companies––Fixed-Rate Dollar
Denominated Bonds .................................................................................................................13

3
I. INTRODUCTION
Corporates in many emerging markets have taken advantage of unusually easy international
liquidity conditions and a search for yield to ramp-up their bond financing, including in
external markets. Global real interest rates have been low, particularly after 2009, against a
backdrop of unconventional monetary policies in advanced economies and strong investor
appetite. In Latin American countries, strong bond issuance was underpinned by stable
domestic macroeconomic fundamentals and supportive commodity prices.
Companies’ greater access to international capital markets is welcome given that Latin
America remains characterized by relatively low domestic saving and investment rates. Yet,
the strong rise in bond issuance has also generated concerns that the corporate sector may
have overburdened itself with debt, especially in foreign currency, storing up trouble for the
future. The build-up of exposures could leave firms exposed to a sudden rise in exchange
rates or tighter external financing, as the U.S. continues to normalize its monetary policy.
These concerns have been compounded by an environment of less buoyant commodity prices
over the recent years, as well as lower potential domestic growth.
If such risks were to materialize, the credit-quality of some corporations could deteriorate,
pushing up borrowing costs and financing constraints, which could then become a drag on
overall economic growth. Balance sheet pressures on corporations could also potentially
affect the domestic banking system, if firms faced difficulties to repay their loan obligations
or chose to withdraw their deposits.2
The analysis of balance sheet vulnerabilities in the corporate sector using micro-level data
has been scant, but a few recent studies have shed light on how corporate exposures have
evolved over time. Gonzalez-Miranda (2012) uses balance-sheet data to show evidence of
rising leverage and reduced buffers in the non-financial corporate sector in Latin America
between 2000 and 2011. The author also presents evidence from a panel of 18 emerging
economies suggesting that vulnerability (as measured by the probability of firm’s cash flows
falling below short-term debt obligations) increases with leverage and net foreign currency
liabilities, reducing with exchange rate flexibility and firm size.
Didier and Schmukler (2014) document major debt trends in emerging economies since the
1990s, showing that economies have generally moved towards less vulnerable positions. In
Latin America, they show that the average maturity of bonds in the private sector increased
between 1990–99 and 2000–09. Using transaction-level bond issuance data, Caballero and
Powell (2014) document that, since the global crisis, the structure of corporate bond debt in
the major Latin American countries has moved from a market largely dependent on domestic
issuance towards a more globally integrated market.
2 The literature highlights different channels through which vulnerabilities can build up in an environment of
ample liquidity (Caballero and Krishnamurthy (2003)), and how corporate performance may be a source of
spillovers and systemic risk (Claessens et al (2011).
4
To gauge the extent of corporate vulnerabilities and provide a more granular picture of recent
trends in bond financing in Latin America, our analysis combines micro-level data on bond
issuance (Bloomberg, Dealogic) and corporate balance sheets (S&P Capital IQ) for about
1,000 listed non-financial firms between 2003 and 2013 in Brazil, Chile, Colombia, Mexico,
and Peru. Using this database, we provide an assessment of the evolution of leverage, debt
service capacity, bond issuance dynamics and its main characteristics such as yield, maturity,
and currency composition over this period. On this basis, we analyze whether corporate
balance sheets have become more vulnerable to financial shocks and how the nature of risks
has changed.
Our main results are as follows. First, the surge in bond issuance by Latin American firms
has led to a compositional shift away from bank loans and toward bond financing. Both
micro and macro-level data indicate that corporates have reduced their relative reliance on
longer-term loans, including syndicated cross-border loans. This pattern likely reflects the
sharp curtailment of loan supply from European banks—a traditional source of credit for the
group of country in the analysis—during the financial crisis as well as re-pricing of bank
loans in the context of regulatory reform, which has made bond market finance relatively
more attractive.
Second, the shift in liability composition has reduced some dimensions of risk but potentially
increased others. Through stepped-up issuance of longer-term bonds, firms have increased
the average maturity of their debt, and smoothed the amortization profile. They have done so
while securing lower interest rates across the yield curve and keeping the share of floating-
rate debt relatively low. Yet, the available data suggest that dollarization on corporate
balance sheets remains an issue in some Latin American countries, and the share of foreign-
currency debt has increased in recent years. The extent of un-hedged exchange rate exposure
in the corporate sector cannot be ascertained with a significant degree of confidence, given
that systematic and comprehensive information on relevant offsetting variables (notably
natural hedges from net export proceeds, foreign currency income from multinational
operations and FX derivative positions) is not simple to construct.
In the absence of more specific information on natural and financial hedges, we use issuer
sectors as a proxy indicator. Commodity producers and manufactures exporters, for example,
derive a large share of their revenues from sales in foreign currencies, and thus are in a better
position to accommodate the rising debt service costs associated with currency depreciation.
On the other hand, issuers with mostly domestic revenue (i.e., domestic telecoms,
construction companies and utilities) or net importers selling in domestic markets have
typically lower foreign currency buffers. Our analysis suggests that sectors linked to exports
and commodities, such as mining and oil and gas, explain a relevant portion of bond
issuances since 2009. Still, there has been meaningful issuance activity associated with
domestically-oriented sectors.
Fourth, consistent with evidence in Chui, Fender and Sushko ( 2014), balance sheet leverage
ratios have clearly increased over the recent years, although they remain below the levels
seen a decade ago. Part of the increase in debt ratios since 2010 has been a rebound from
5
earlier declines in leverage, and the rise in some instances debt has been offset by a fall in
non-debt liabilities.
Fifth, debt servicing capacity has remained broadly stable, but there are areas of weakness
that require close monitoring. Median interest coverage ratios (EBITDA/interest payments)
appear robust in most of the LA-5 countries, but non-negligible subsets of firms exhibit
lower ratios and thus appear more vulnerable to shocks. Quantitatively, these weaknesses are
most relevant in some parts of the Mexican corporate sector, and in Brazil. Interestingly,
however, Brazilian corporates have lived with below-average interest coverage ratios for a
long time, and if anything, they feature somewhat stronger debt servicing capacity today than
before the global financial crisis. One attenuating factor may be the important role of policy
banks in Brazil, which typically lend at subsidized interest rates. Nonetheless, sectors and
firms with particularly low buffers need to be monitored closely.
Sixth, bond issuance data point to cycles of investor risk appetite, but there is no indication of
a general trend toward weaker issuer quality. We document episodes of exuberance as the
share of low-rated companies underwent temporary increases, although the median rating of
recently issued bonds is no worse than it has been on average over the past ten years, as
earlier episodes of exuberance (such as late 2012/early 2013) were typically followed by
periods of moderation. Nonetheless, monitoring marginal issuer trends can provide useful
insights into the market’s risk appetite for surveillance purposes, as well as maintaining
awareness about the tendency towards pro-cyclical ratings.
Finally, we provide granular evidence that Latin American corporates have been building up
debt through foreign subsidiaries and other off-shore vehicles, which would not be directly
registered in residency-based external debt statistics or BOP flows. Off-shore issuance by
emerging market firms is a novel channel through which vulnerabilities can potentially build
up, and has received growing attention in policy-oriented analytical studies (Caballero and
Powell, 2013, Avdjiev, Chui and Shin, 2014 and Chung et al, 2014). Our closer look at the
data reveals that this phenomenon chiefly applies to Brazil in the Latin America sample
considered, and that the timing of debt issuance through off-shore centers appears linked to
capital controls measures, though more work is needed to establish causal relationships. For
surveillance purposes, monitoring consolidated balance sheet data is important to better
capture external debt issuance in off-shore centers, and augment the standard macro-level
indicators of external indebtedness.
The paper is organized as follows. The next section describes the data sources. Section III
provides an overview of issuance behavior in LA-5 countries. Section IV discusses leverage
and debt-servicing capacity. Section V discusses changes in the liability structure of NFCs,
and section VI concludes.
II. DATA
We use Dealogic as the data source for bond issuance, focusing on NFCs of LA-5 countries
between 2003 and 2013. Dealogic allows the construction of an issuance-by-issuance cross-
sectional database, offering a rich perspective not found in more aggregate information. The

6
database contains key information about each deal as reported by underwriting banks at the
time of issuance such as the transaction size, maturity, coupon rate, currency, placement
(foreign versus domestic issuance), yield to maturity, among other details. Dealogic also
records information on the issuers’ country of incorporation, parent ownership and parent
nationality. This information is crucial for constructing residency- and nationality-based
issuance measures. Distinction between domestic and foreign placement is based on the
place/market in which underwriters are auctioning the security.
The paper also uses the Standard and Poors’ Capital IQ as its second main data source,
covering balance sheet, income and cash flow statements which are drawn from end-year
reports leverage and interest coverage ratios. The sample covers non-financial corporation’s
in LA-5 (Brazil, Chile, Colombia, Mexico and Peru) countries between 2003 and 2013. The
reports are originally in local currency, and later converted to U.S. dollars using end-of-
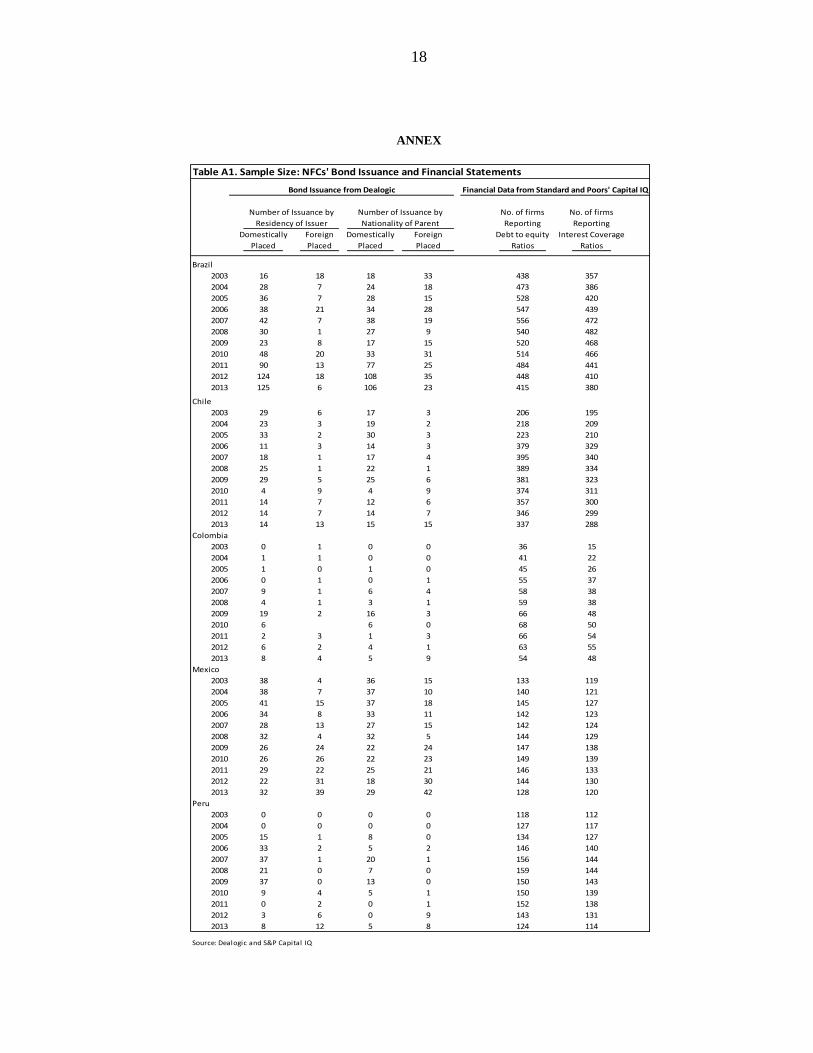
period exchange rates. Table A1 at the appendix presents the sample size for each year in the
Dealogic and S&P Capital IQ databases.
III. OVERVIEW OF NFCS BOND ISSUANCE IN LA-5 ECONOMIES
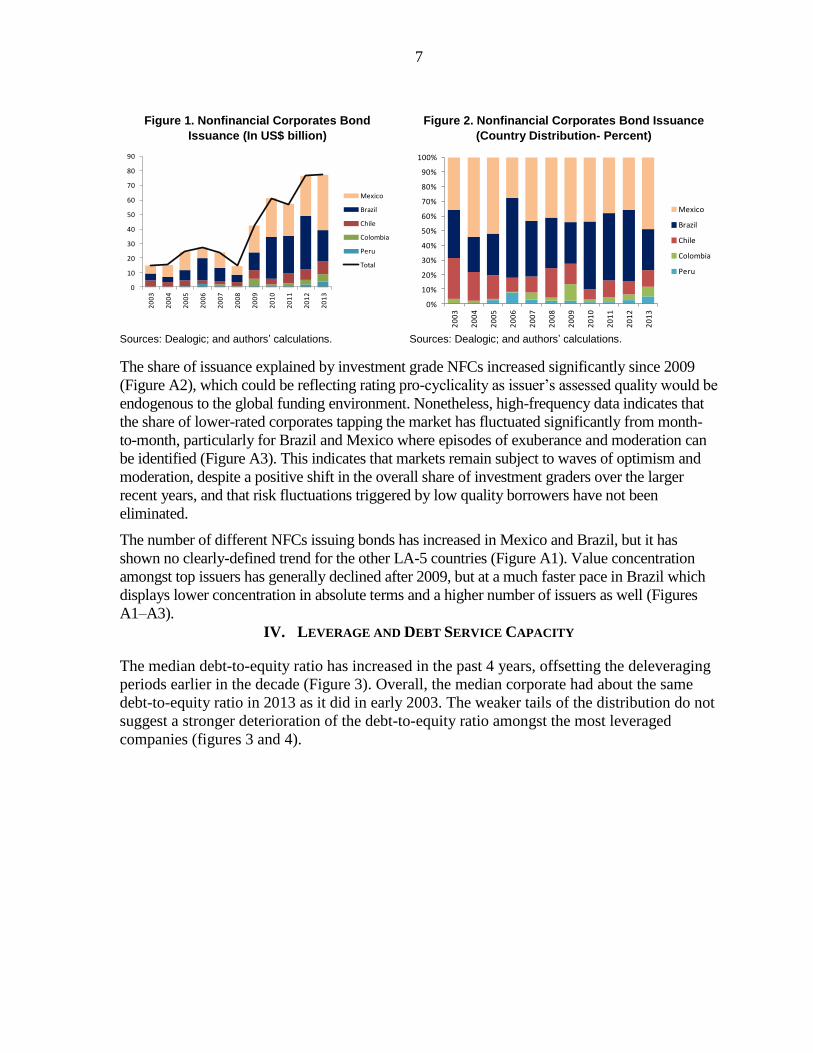
Gross bond issuance by NFCs in LA-5 countries increased from US$ 15 billion in 2003
(approximately 1 percent of the combined GDP) to US$77 billion in 2013 (1.8 percent of the
combined GDP) totaling US$435 billion over the entire period (Figure 1). NFCs from Brazil
and Mexico have dominated LA-5 issuance (Figure 2): Mexico accounted for nearly
42 percent of NFC issuance between 2003 and 2013, followed by Brazil (39 percent), Chile
(12 percent), Colombia (4 percent) and Peru (3 percent). NFCs from Brazil, Chile and
Mexico started from a similar (absolute) base, but issuance has grown more rapidly in
Mexico and Brazil.3 In Colombia and Peru, NFC issuance grew very fast, but from a low
base.4
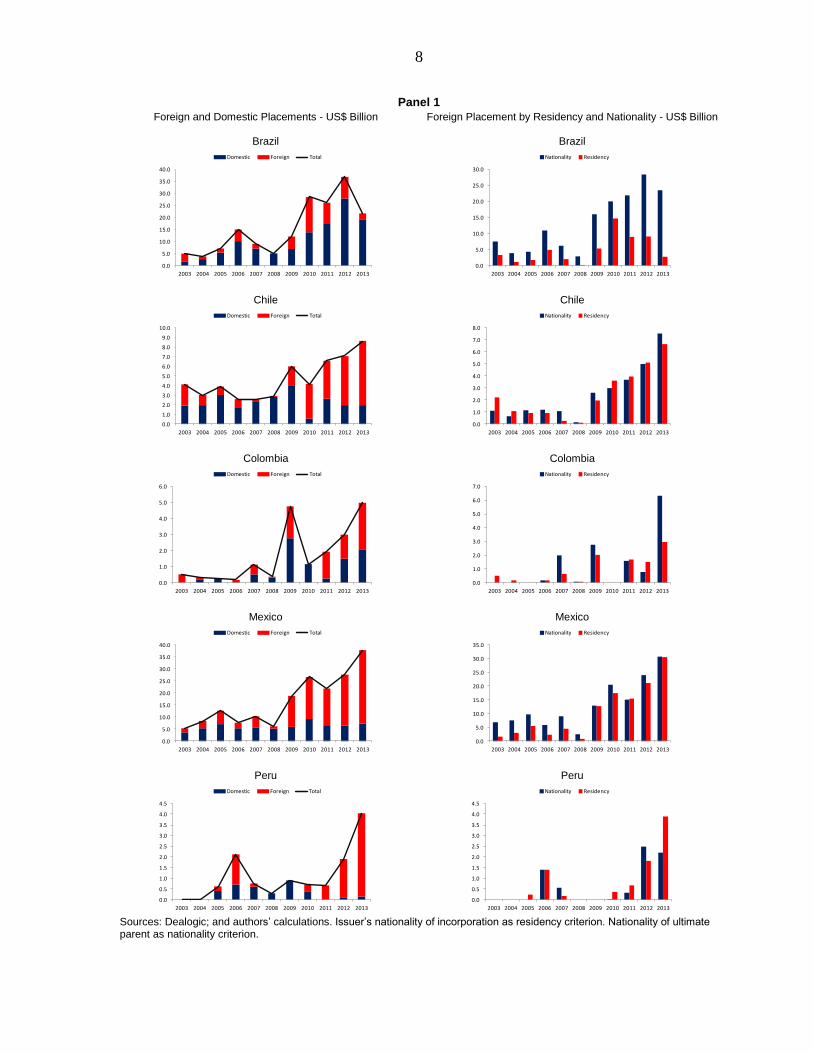
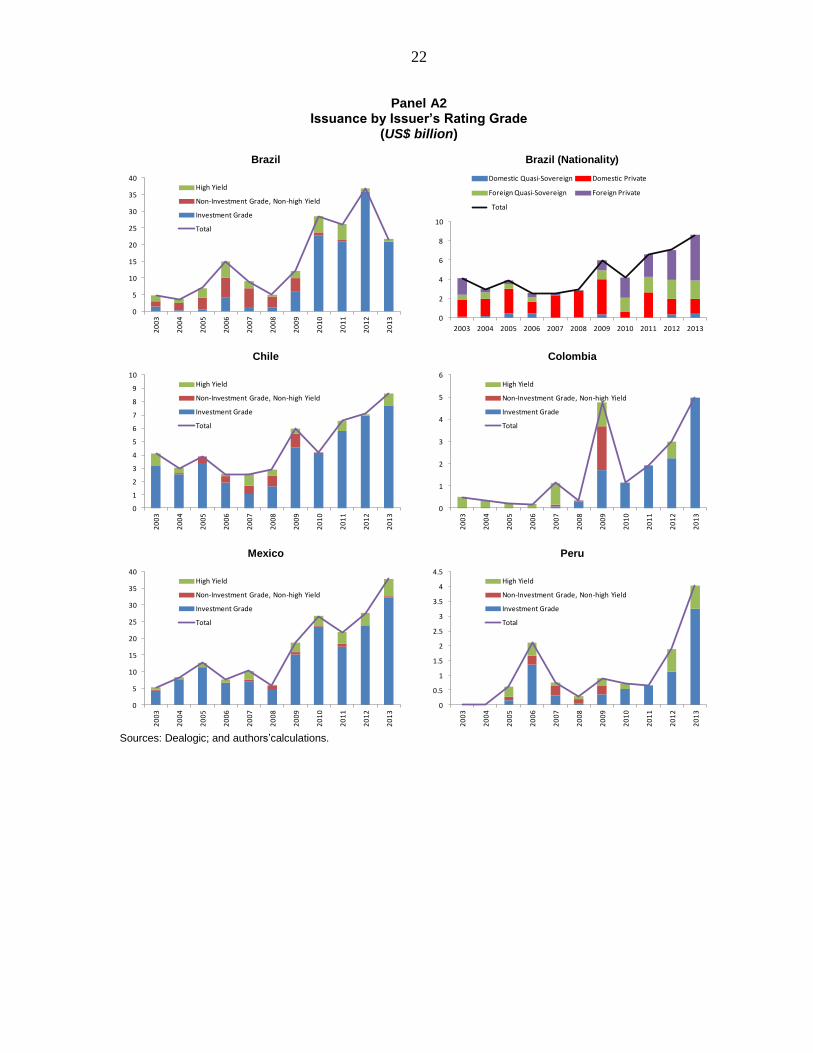
Quasi-sovereign NFCs have played an important role in foreign bond issuance (Panel A1),
while foreign placements have led the increase since 2009 (Figure 1). Brazil appears to be an
exception with domestic bonds showing up as an important driver. In part, this captures the
development of local bond markets in Brazil. However, it also reflects the fact that the
majority of foreign issuance associated with Brazilian NFCs has taken place through
subsidiaries located outside the country. So, calculating total issuance based on a residency
criterion misses a significant amount of bond issuance that can be linked back to Brazil on a
nationality basis (Panel 1).
3 The National Development Bank of Brazil (BNDES) provided substantial funding to Brazilian companies
through loans and equity injections after the global crisis. This is likely to have contributed to lower bond
issuance amongst Brazilians NFCs than it would otherwise have been the case.
4 Information on who holds the NFC bonds in LA-5 economies is incomplete. Data from Bloomberg allows a
view of bond holders associated to individual large issuances. The information relies on public fillings
requirements and coverage is better amongst U.S. holders. The data points to the importance of U.S.
institutional investors. While some large investors such as PIMCO and Vanguard have leading positions, there
is also non-negligible presence (often larger than 50 percent) of other investors such as small pension funds.
7
Figure 1. Nonfinancial Corporates Bond
Issuance (In US$ billion)
Figure 2. Nonfinancial Corporates Bond Issuance
(Country Distribution- Percent)
Sources: Dealogic; and authors’ calculations. Sources: Dealogic; and authors’ calculations.
The share of issuance explained by investment grade NFCs increased significantly since 2009
(Figure A2), which could be reflecting rating pro-cyclicality as issuer’s assessed quality would be
endogenous to the global funding environment. Nonetheless, high-frequency data indicates that
the share of lower-rated corporates tapping the market has fluctuated significantly from month-
to-month, particularly for Brazil and Mexico where episodes of exuberance and moderation can
be identified (Figure A3). This indicates that markets remain subject to waves of optimism and
moderation, despite a positive shift in the overall share of investment graders over the larger
recent years, and that risk fluctuations triggered by low quality borrowers have not been
eliminated.
The number of different NFCs issuing bonds has increased in Mexico and Brazil, but it has
shown no clearly-defined trend for the other LA-5 countries (Figure A1). Value concentration
amongst top issuers has generally declined after 2009, but at a much faster pace in Brazil which
displays lower concentration in absolute terms and a higher number of issuers as well (Figures
A1–A3).
IV. LEVERAGE AND DEBT SERVICE CAPACITY
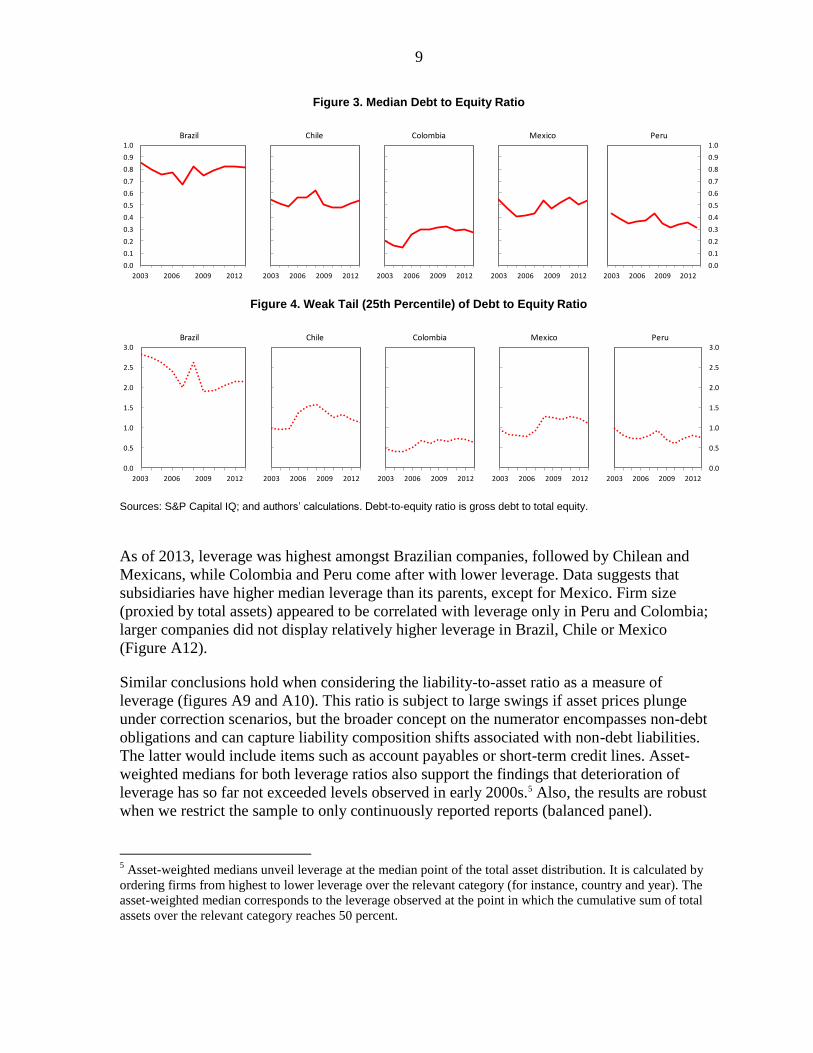
The median debt-to-equity ratio has increased in the past 4 years, offsetting the deleveraging
periods earlier in the decade (Figure 3). Overall, the median corporate had about the same
debt-to-equity ratio in 2013 as it did in early 2003. The weaker tails of the distribution do not
suggest a stronger deterioration of the debt-to-equity ratio amongst the most leveraged
companies (figures 3 and 4).
0
10
20
30
40
50
60
70
80
902
00
3
20
04
20
05
20
06
20
07
20
08
20
09
20
10
20
11
20
12
20
13
Mexico
Brazil
Chile
Colombia
Peru
Total
0%
10%
20%
30%
40%
50%
60%
70%
80%
90%
100%
20
03
20
04
20
05
20
06
20
07
20
08
20
09
20
10
20
11
20
12
20
13
Mexico
Brazil
Chile
Colombia
Peru
8
Panel 1
Foreign and Domestic Placements - US$ Billion Foreign Placement by Residency and Nationality - US$ Billion
Brazil
Brazil
Chile
Chile
Colombia
Colombia
Mexico
Mexico
Peru
Peru
Sources: Dealogic; and authors’ calculations. Issuer’s nationality of incorporation as residency criterion. Nationality of ultimate parent as nationality criterion.
0.0
5.0
10.0
15.0
20.0
25.0
30.0
35.0
40.0
2003 2004 2005 2006 2007 2008 2009 2010 2011 2012 2013
Domestic Foreign Total
0.0
5.0
10.0
15.0
20.0
25.0
30.0
2003 2004 2005 2006 2007 2008 2009 2010 2011 2012 2013
Nationality Residency
0.0
1.0
2.0
3.0
4.0
5.0
6.0
7.0
8.0
9.0
10.0
2003 2004 2005 2006 2007 2008 2009 2010 2011 2012 2013
Domestic Foreign Total
0.0
1.0
2.0
3.0
4.0
5.0
6.0
7.0
8.0
2003 2004 2005 2006 2007 2008 2009 2010 2011 2012 2013
Nationality Residency
0.0
1.0
2.0
3.0
4.0
5.0
6.0
2003 2004 2005 2006 2007 2008 2009 2010 2011 2012 2013
Domestic Foreign Total
0.0
1.0
2.0
3.0
4.0
5.0
6.0
7.0
2003 2004 2005 2006 2007 2008 2009 2010 2011 2012 2013
Nationality Residency
0.0
5.0
10.0
15.0
20.0
25.0
30.0
35.0
40.0
2003 2004 2005 2006 2007 2008 2009 2010 2011 2012 2013
Domestic Foreign Total
0.0
5.0
10.0
15.0
20.0
25.0
30.0
35.0
2003 2004 2005 2006 2007 2008 2009 2010 2011 2012 2013
Nationality Residency
0.0
0.5
1.0
1.5
2.0
2.5
3.0
3.5
4.0
4.5
2003 2004 2005 2006 2007 2008 2009 2010 2011 2012 2013
Domestic Foreign Total
0.0
0.5
1.0
1.5
2.0
2.5
3.0
3.5
4.0
4.5
2003 2004 2005 2006 2007 2008 2009 2010 2011 2012 2013
Nationality Residency
9
Figure 3. Median Debt to Equity Ratio
Figure 4. Weak Tail (25th Percentile) of Debt to Equity Ratio
Sources: S&P Capital IQ; and authors’ calculations. Debt-to-equity ratio is gross debt to total equity.
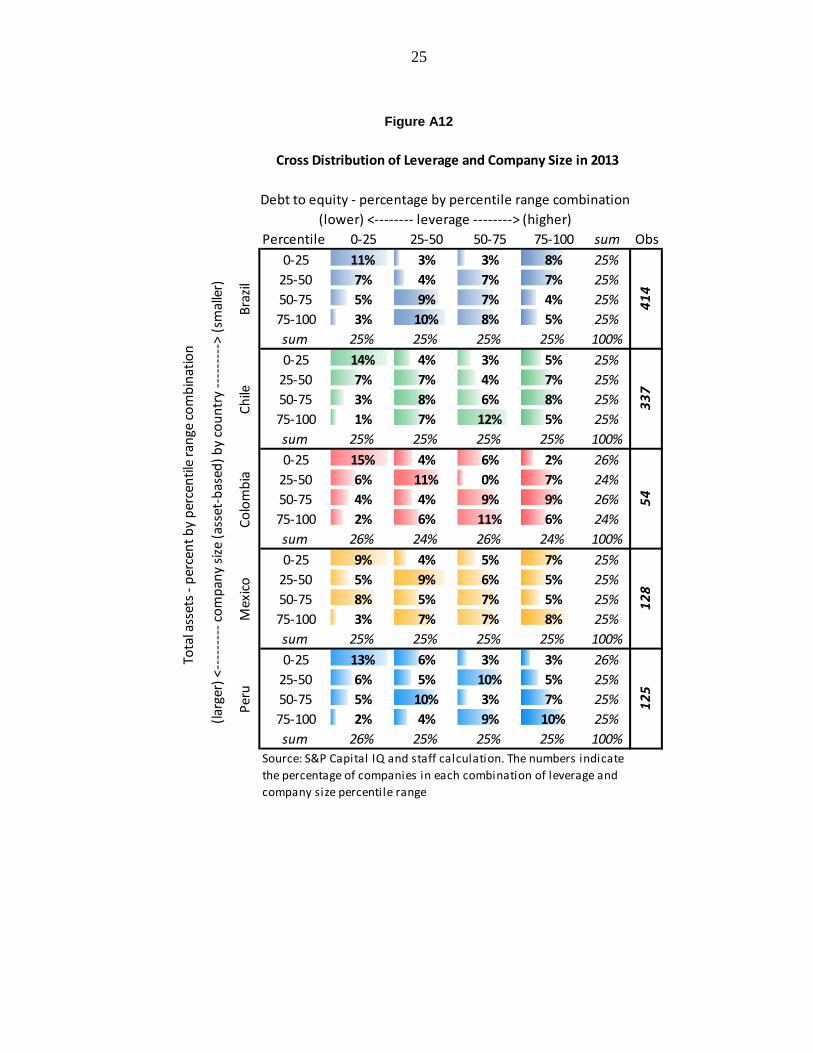
As of 2013, leverage was highest amongst Brazilian companies, followed by Chilean and
Mexicans, while Colombia and Peru come after with lower leverage. Data suggests that
subsidiaries have higher median leverage than its parents, except for Mexico. Firm size
(proxied by total assets) appeared to be correlated with leverage only in Peru and Colombia;
larger companies did not display relatively higher leverage in Brazil, Chile or Mexico
(Figure A12).
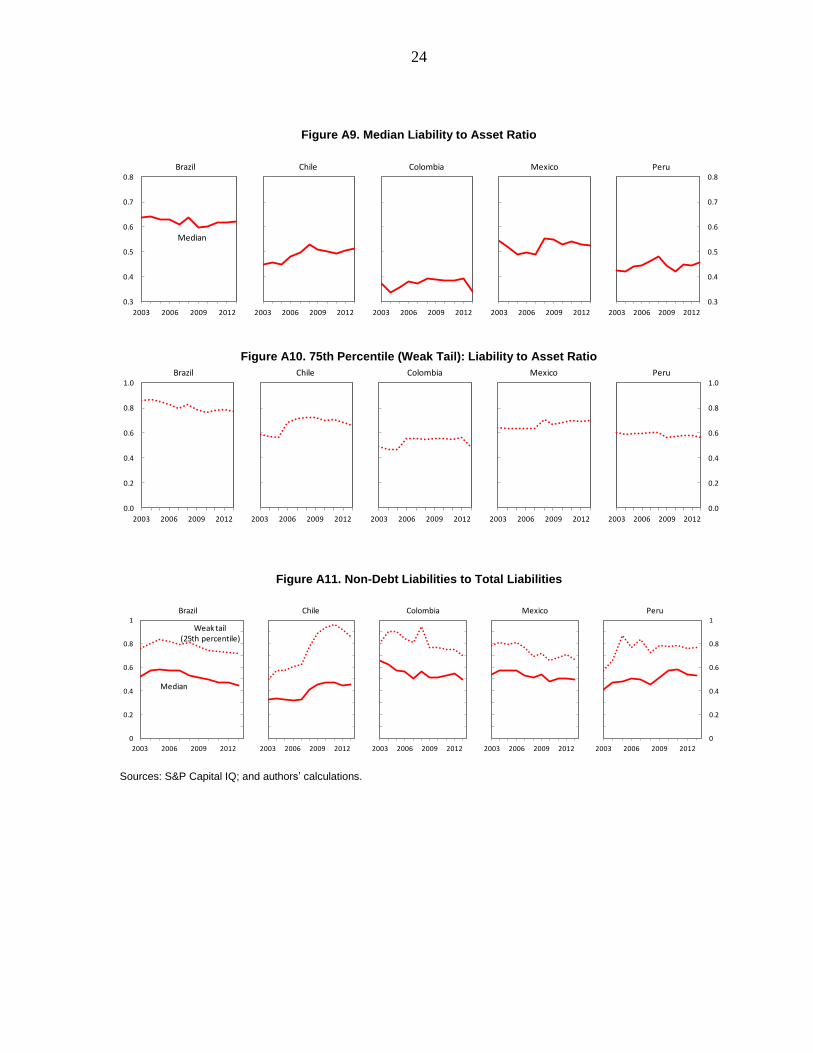
Similar conclusions hold when considering the liability-to-asset ratio as a measure of
leverage (figures A9 and A10). This ratio is subject to large swings if asset prices plunge
under correction scenarios, but the broader concept on the numerator encompasses non-debt
obligations and can capture liability composition shifts associated with non-debt liabilities.
The latter would include items such as account payables or short-term credit lines. Asset-
weighted medians for both leverage ratios also support the findings that deterioration of
leverage has so far not exceeded levels observed in early 2000s.5 Also, the results are robust
when we restrict the sample to only continuously reported reports (balanced panel).
5 Asset-weighted medians unveil leverage at the median point of the total asset distribution. It is calculated by
ordering firms from highest to lower leverage over the relevant category (for instance, country and year). The
asset-weighted median corresponds to the leverage observed at the point in which the cumulative sum of total
assets over the relevant category reaches 50 percent.
0.0
0.1
0.2
0.3
0.4
0.5
0.6
0.7
0.8
0.9
1.0
2003 2006 2009 2012
Brazil
2003 2006 2009 2012
Chile
2003 2006 2009 2012
Colombia
2003 2006 2009 2012
Mexico
2003 2006 2009 2012
0.0
0.1
0.2
0.3
0.4
0.5
0.6
0.7
0.8
0.9
1.0Peru
0.0
0.5
1.0
1.5
2.0
2.5
3.0
2003 2006 2009 2012
Brazil
2003 2006 2009 2012
Chile
2003 2006 2009 2012
Colombia
2003 2006 2009 2012
Mexico
0.0
0.5
1.0
1.5
2.0
2.5
3.0
2003 2006 2009 2012
Peru

10
The net-debt-to-earnings ratio, as opposed to the other leverage measures considered above,
points to a more marked increase in leverage over the decade, particularly for Brazil and
Colombia (Figures 5 and 6). This measure combines stock (numerator) and flows
(denominator) variables, and ultimately reveals that earnings growth has not kept pace with
debt build-up, drawing attention to issues related to debt-servicing capacity and liquidity. In
that regard, however, median interest coverage ratios (EBITDA/gross interest payments)
have remained either stable or improved somewhat over the decade. The weaker tail of the
debt-servicing capacity distribution has also remained broadly stable (Figure 5).6
Figure 5. Net Debt to Earnings
Figure 6. Interest Coverage Ratio
Sources: S&P Capital IQ; and authors’ calculations. Figure 5: Net debt-to-earnings before interest, taxes, depreciation and amortization (EBITDA). Figure 6: Earnings before interest, taxes, depreciation and amortization (EBITDA) to interest expense.
Lower borrowing costs more recently has compensated for slower earnings growth. Going
forward, however, the global financing environment is expected to become less favorable and
borrowing costs for new lending should go up, though this could be partially offset due to
stronger prospects for growth in the advanced economies. Overall, the subdued growth
outlook for Latin America, and structural growth challenges faced by each LA-5 country,
create downside risks for the financial strength of companies. In this context, despite no clear
deterioration in debt-service capacity, firms could still find it challenging to withstand a
prolonged environment of depressed earnings. In addition, even if leverage indicators do not
point to excessive debt burdens currently, liquidity challenges could feed into higher leverage
in the absence of earnings growth.
6 Similar conclusions hold when debt-servicing capacity is measured using EBIT, instead of EBITDA.
0
1
2
3
4
5
6
7
8
9
10
2003 2006 2009 2012
Brazil
Median
Weak tail(25th percentile)
2003 2006 2009 2012
Chile
2003 2006 2009 2012
Colombia
2003 2006 2009 2012
Mexico
0
1
2
3
4
5
6
7
8
9
10
2003 2006 2009 2012
Peru
0
2
4
6
8
10
12
14
2003 2006 2009 2012
Brazil
Median
Weak tail(25th percentile)
2003 2006 2009 2012
Chile
2003 2006 2009 2012
Colombia
2003 2006 2009 2012
Mexico
0
2
4
6
8
10
12
14
2003 2006 2009 2012
Peru
11
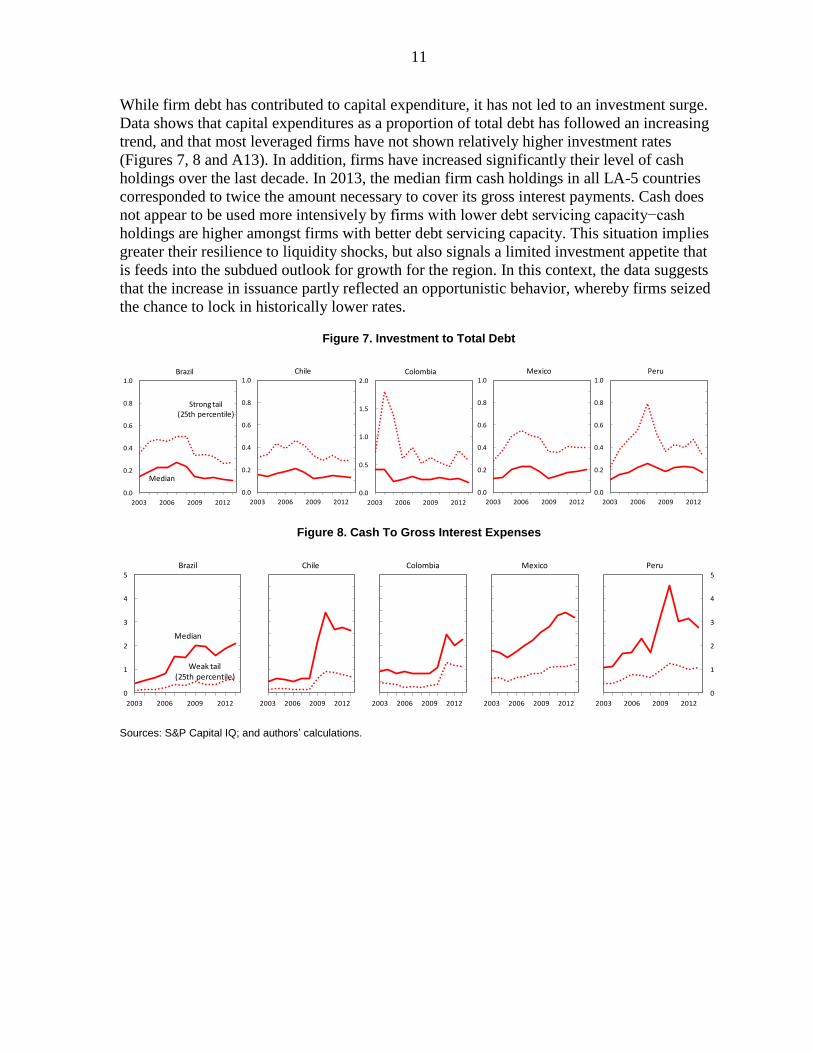
While firm debt has contributed to capital expenditure, it has not led to an investment surge.
Data shows that capital expenditures as a proportion of total debt has followed an increasing
trend, and that most leveraged firms have not shown relatively higher investment rates
(Figures 7, 8 and A13). In addition, firms have increased significantly their level of cash
holdings over the last decade. In 2013, the median firm cash holdings in all LA-5 countries
corresponded to twice the amount necessary to cover its gross interest payments. Cash does
not appear to be used more intensively by firms with lower debt servicing capacity−cash
holdings are higher amongst firms with better debt servicing capacity. This situation implies
greater their resilience to liquidity shocks, but also signals a limited investment appetite that
is feeds into the subdued outlook for growth for the region. In this context, the data suggests
that the increase in issuance partly reflected an opportunistic behavior, whereby firms seized
the chance to lock in historically lower rates.
Figure 7. Investment to Total Debt
Figure 8. Cash To Gross Interest Expenses
Sources: S&P Capital IQ; and authors’ calculations.
0.0
0.2
0.4
0.6
0.8
1.0
2003 2006 2009 2012
Brazil
Median
Strong tail(25th percentile)
0.0
0.2
0.4
0.6
0.8
1.0
2003 2006 2009 2012
Chile
0.0
0.5
1.0
1.5
2.0
2003 2006 2009 2012
Colombia
0.0
0.2
0.4
0.6
0.8
1.0
2003 2006 2009 2012
Mexico
0.0
0.2
0.4
0.6
0.8
1.0
2003 2006 2009 2012
Peru
0
1
2
3
4
5
2003 2006 2009 2012
Brazil
Median
Weak tail(25th percentile)
2003 2006 2009 2012
Chile
2003 2006 2009 2012
Colombia
2003 2006 2009 2012
Mexico
0
1
2
3
4
5
2003 2006 2009 2012
Peru

12
V. SHIFTS IN LIABILITY STRUCTURES
Increased bond issuance has been accompanied by changes on the liability structure of NFCs.
These changes have reflected both new supply-side conditions and active liability
management by companies. On the supply-side, banks have cut back on the pace of cross-
border lending, which has been an important source of firms’ funding in the past. This has
been caused by efforts to clean and deleverage balance sheets in the aftermath of the
financial crises and by stricter regulatory rules, which are likely to be a permanent feature of
bank activity. Data shows that bank terms loans as a share of total debt have declined
amongst NFCs in LA-5 countries. Similarly, the volume of syndicated lending to private
non-financials has reduced in 2008 and, although generally rising, has not recovered yet to
the levels observed in 2007 (Figure 9).
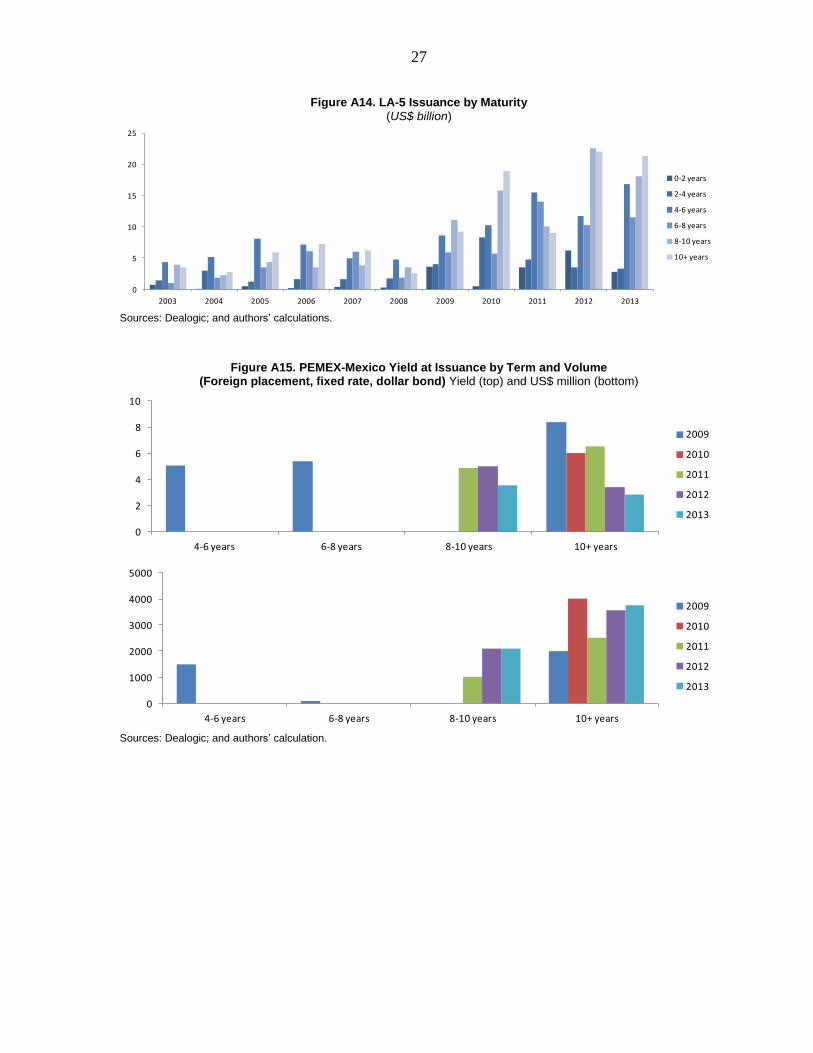
NFCs have also taken advantage of the favorable financing environment to manage their
liabilities. Issuance volume increased across maturity ranges, indicating that firms had more
options to shape their liability maturity profile (Figures 10 and A14). The increase in
maturities above 8 years is noticeable and shows that firms were able to access longer-term
funding through capital markets. The ability to issue short-term bonds at low rates has also
been exploited, playing important role for management/repayment of more expensive short-
term debt and other non-debt liabilities.7
7 Figure A11 shows that Non-debt liabilities as a proportion of total liabilities have decreased in Brazil and
Mexico after 2009.
0
10
20
30
40
50
60
70
80
90
2003 2004 2005 2006 2007 2008 2009 2010 2011 2012 2013
Term loan share of total debt (percent)
Syndicated lending to private nonfinancial companies (US$ billion)
Figure 9. LA5: Corporate Term Loan Financing
Sources: S&P Capital IQ; Dealogic; and IMF staff calculations.Note: Bars refer to nonfinancial companies.
13
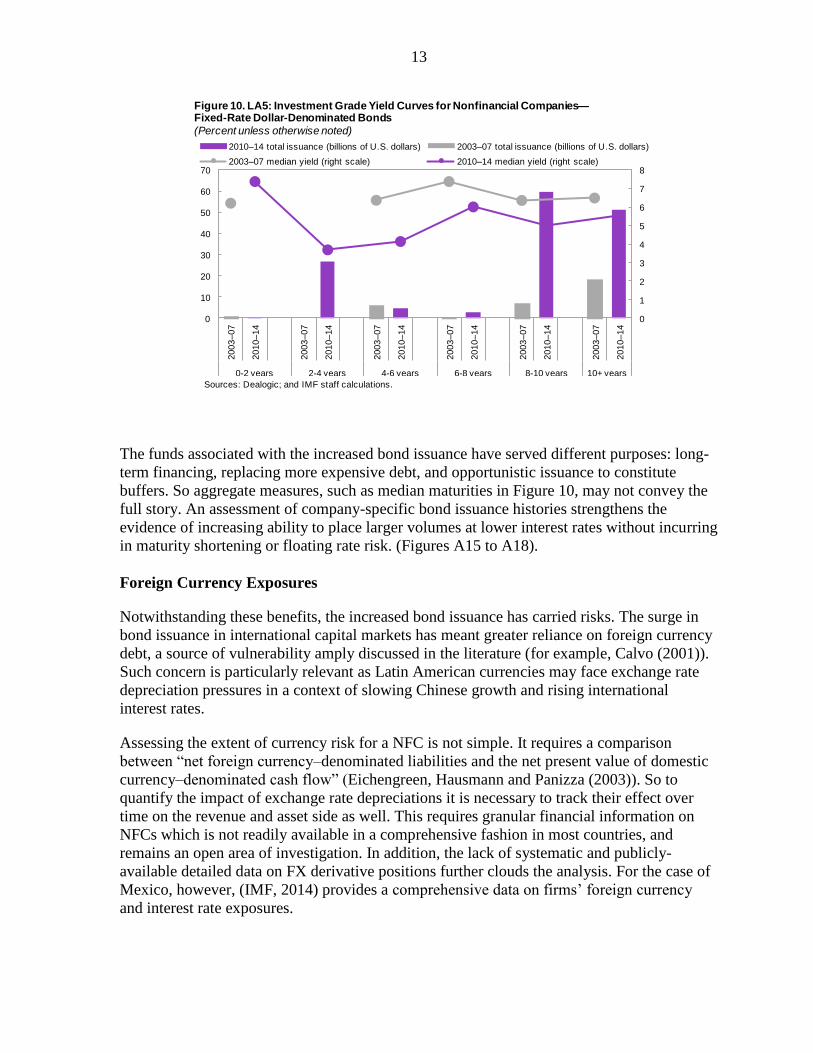
The funds associated with the increased bond issuance have served different purposes: long-
term financing, replacing more expensive debt, and opportunistic issuance to constitute
buffers. So aggregate measures, such as median maturities in Figure 10, may not convey the
full story. An assessment of company-specific bond issuance histories strengthens the
evidence of increasing ability to place larger volumes at lower interest rates without incurring
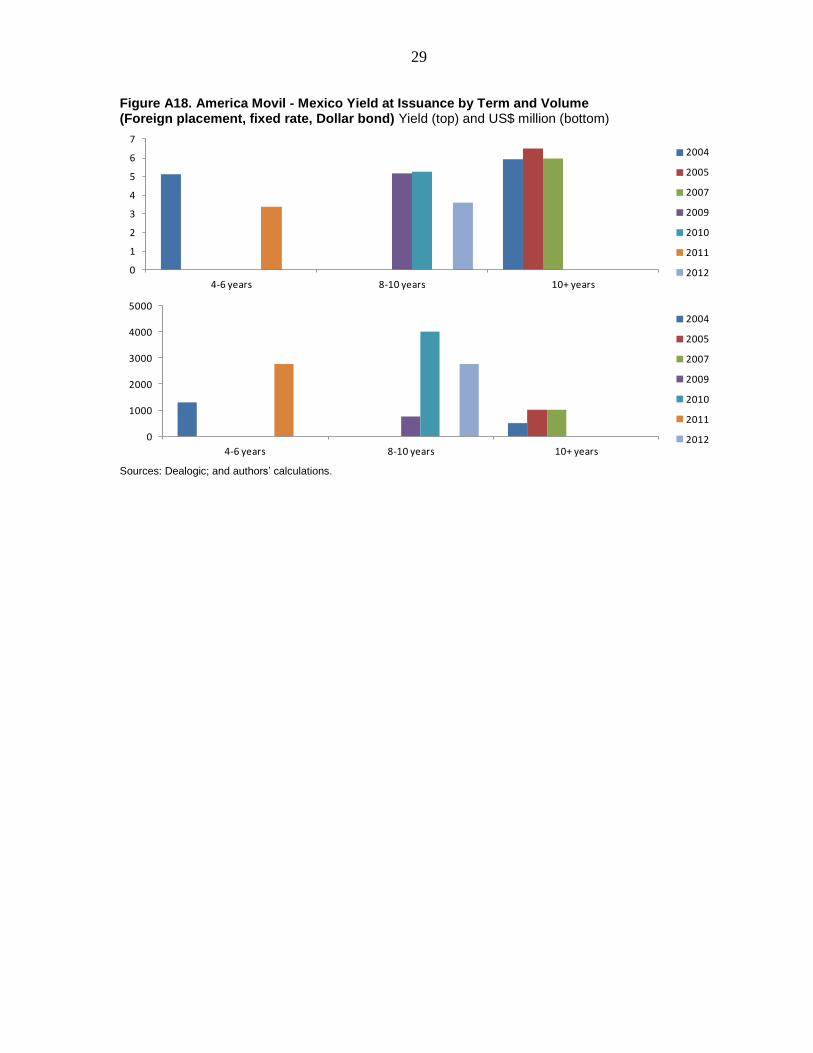
in maturity shortening or floating rate risk. (Figures A15 to A18).
Foreign Currency Exposures
Notwithstanding these benefits, the increased bond issuance has carried risks. The surge in
bond issuance in international capital markets has meant greater reliance on foreign currency
debt, a source of vulnerability amply discussed in the literature (for example, Calvo (2001)).
Such concern is particularly relevant as Latin American currencies may face exchange rate
depreciation pressures in a context of slowing Chinese growth and rising international
interest rates.
Assessing the extent of currency risk for a NFC is not simple. It requires a comparison
between “net foreign currency–denominated liabilities and the net present value of domestic
currency–denominated cash flow” (Eichengreen, Hausmann and Panizza (2003)). So to
quantify the impact of exchange rate depreciations it is necessary to track their effect over
time on the revenue and asset side as well. This requires granular financial information on
NFCs which is not readily available in a comprehensive fashion in most countries, and
remains an open area of investigation. In addition, the lack of systematic and publicly-
available detailed data on FX derivative positions further clouds the analysis. For the case of
Mexico, however, (IMF, 2014) provides a comprehensive data on firms’ foreign currency
and interest rate exposures.
0
1
2
3
4
5
6
7
8
0
10
20
30
40
50
60
70
2003
–07
2010
–14
2003
–07
2010
–14
2003
–07
2010
–14
2003
–07
2010
–14
2003
–07
2010
–14
2003
–07
2010
–14
0-2 years 2-4 years 4-6 years 6-8 years 8-10 years 10+ years
2010–14 total issuance (billions of U.S. dollars) 2003–07 total issuance (billions of U.S. dollars)
2003–07 median yield (right scale) 2010–14 median yield (right scale)
Figure 10. LA5: Investment Grade Yield Curves for Nonfinancial Companies—Fixed-Rate Dollar-Denominated Bonds
(Percent unless otherwise noted)
Sources: Dealogic; and IMF staff calculations.
14
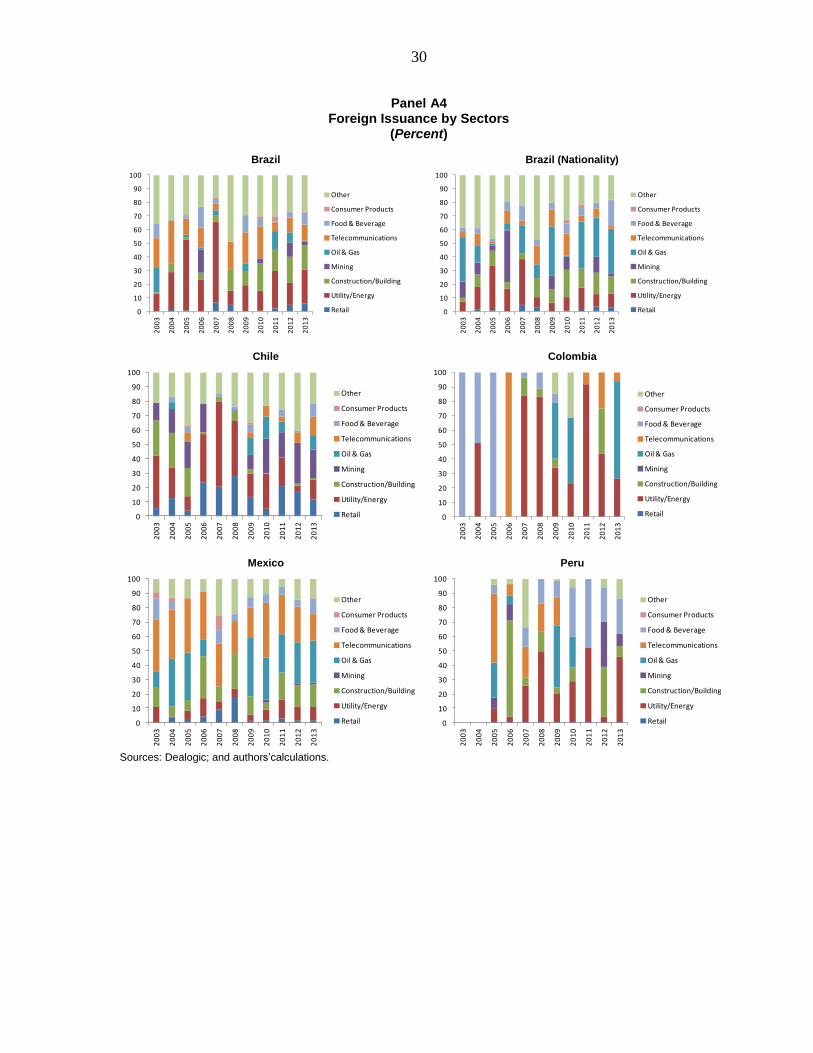
Bond issuance by sector can shed additional light into the question. In principle, the impact
of currency depreciations would be more harmful amongst the NFCs in more domestically-
oriented sectors or whose cash flows is primarily in local currency. The data shows that
sectors linked to exports and commodities, such as mining and oil and gas, explain a relevant
portion of annual issuances since 2009. On the other hand, there has been meaningful
issuance activity associated with domestically-oriented sectors−for instance, Brazilian and
Mexican NFCs in the construction sector have together issued approximately US$3.5 billion
after 2009; NFCs from Chile in the retail sector respond for 15 percent of total issuance since
2011 (Panel A4).
Overall currency exposure from NFC foreign issuance has been partly mitigated by the
increase in international reserves in the region. Going forward, caution is needed so that these
reserves do not become a source of moral hazard behavior in the private sector. The reserves
provide countries with strong ammunition to mitigate excessive volatility and/or to smooth
equilibrium adjustments in the exchange rate, but a false expectation of currency stability can
induce excessive risk-taking in the private sector and/or amplify currency corrections when
adjustment cannot be delayed anymore. Ultimately, exchange rate flexibility is the most
efficient incentive for NFCs to manage risks pro-actively (Kamil (2012)).
VI. ISSUANCE THROUGH FOREIGN SUBSIDIARIES
Residency criterion, used in the compilation of balance of payment statistics and aggregate
external positions, could mask the build-up of private sector foreign liabilities associated
with a particular country when foreign subsidiaries are used for issuing abroad. The
nationality-based criterion would capture the increase of foreign liabilities that are linked to a
country given the nationality of the parent company, regardless of the location of issuing
subsidiaries. Based on Bank for International Settlements data on international debt
securities, Turner (2014) and Shin (2013) have highlighted the phenomenon of issuance
abroad by nationals of Brazil and China. Brazil and China have significantly higher levels of
outstanding international debt securities measured under the nationality-based criterion than
under the residency-based criterion. Such differences have existed since the early 2000s, but
it has increased strongly after 2010. Shin argues that international debt issuance involving
foreign subsidiaries could be serving different purposes, from hedging U.S. dollar receivables
to allowing for speculative carry trade, while potentially increasing currency mismatches.8
We information on the location of issuer and location of the parent company from Dealogic
to construct residency and nationality issuance measures. The difference between the two
criteria is not meaningful for Mexico, Chile and Peru, while in Colombia there has been a
wedge in 2013 only. In contrast, the data confirms Shin’s findings for Brazil: external
8 From a systemic risk perspective, Shin notes that corporate deposits in the domestic banking systems have
increased along with offshore issuance. So corporate distress can trigger withdrawals and shocks to the banking
sector at home. In addition, aggregate shocks leading to deterioration of economic fundamentals can reduce the
appetite of asset managers for holding EM corporate bonds in general. This, in turn, would limit corporate
funding under adverse scenarios, and induce downward adjustments in capital expenditures that would further
weaken economy-wide growth prospects and fundamentals.
15
issuance of Brazilian NFCs has been substantially larger under the nationality criterion than
under the residency. There has been a long-standing difference between nationality-based
and residency-based foreign bond placements in Brazil. However, the difference between the
two measures has widened substantially after 2009, which coincided with the post-global
crisis environment of ample liquidity.
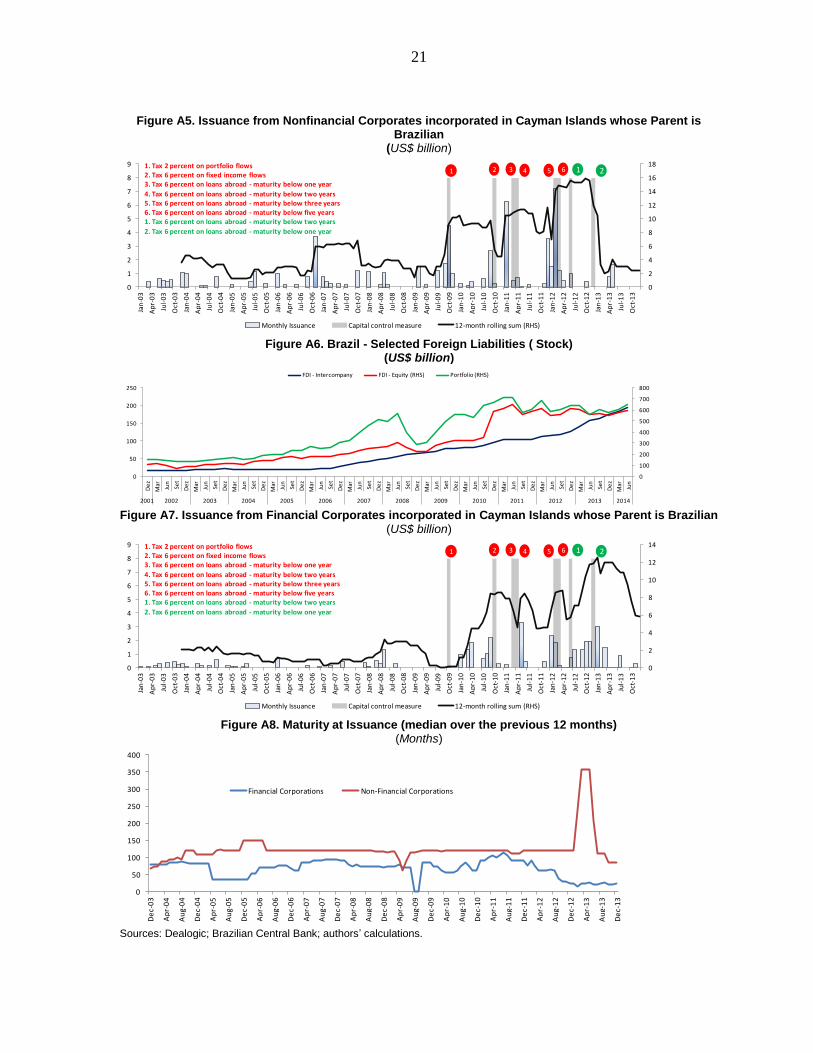
The growing wedge between residency and nationality criteria since 2010 has coincided with
stepped up efforts from the Brazilian government to mitigate currency appreciation pressures
through capital control measures (figure A5). In particular, between early 2011 and early
2012, the government progressively increased the maturity of the debt issued abroad subject
to foreign exchange taxation. Because foreign subsidiaries are non-residents from a balance
of payments perspective, they would not be subject to the tax unless the proceeds were
repatriated. Interestingly, issuance through Cayman Islands has increased after the tax
tightening, and reduced after the tax loosening between 2010 and 2012. In addition, FDI
intercompany loans (one possible repatriation channel of the proceeds from foreign issuance)
have increased after tax loosening as well, while portfolio and FDI-equity stabilized (figure
A6).9
More work is necessary to establish causal relationships, but evidence suggests that structural
incentives may be at play. Anecdotal evidence suggests that the regulatory environment,
including the foreign exchange legislation, could be the source of complexities which
contribute to NFCs’ decision to issue abroad through foreign subsidiaries. In contrast,
another driver could be the fact that the bulk of foreign issuance is led by global Brazilian
companies who have set up subsidiaries abroad to carry out its international operations.
VII. CONCLUSIONS
Bond issuance from NFCs in LA-5 economies has been increasing over the past decade,
more significantly after 2009. Companies have had greater space to manage liabilities,
raising cheaper funds across different maturities without increasing floating-rate debt. Strong
bond issuance has contributed to financial markets development in LA-5 economies, as
NFCs had to meet more stringent regulatory and disclosure pre-requisites to issue publically-
traded securities. This is important given the low domestic savings of the region and that
capital markets and non-bank financial institutions are expected to play a greater financing
role in the future given stricter banking regulatory requirements.
NFC foreign-currency debt has increased, but assessing currency risks at the firm level
remains an area of on-going research. Data gaps preclude a comprehensive assessment of the
implications from exchange rate depreciations to firm revenues, as well as the extent to
which financial market hedging is in place. From a more aggregate perspective, foreign
issuance has been strong in sectors with revenues linked to foreign currency (natural hedges).
9 This paper focuses on NFCs, but it is worthy of note that issuance through Cayman Islands by Brazilian
financial corporations merits a separate analysis as well. As an illustration, Figures A7 and A8 indicate a less
clear association between issuance and foreign exchange rate tax from a timing perspective, but show that banks
have been issuing at lower maturities than NFCs more recently.
16
On the other hand, domestically-oriented sectors (such as construction) have also incurred in
foreign currency debt and potential currency risks originating in the financial sector remains
hard to write off−particularly from non-bank financial institutions which are less regulated.
The data does not suggest flagrant financial excesses in terms of leverage and debt-servicing
capacity, but there is no room for complacency. Further increases in leverage would be a
cause for concern after the recent re-leveraging observed. NFC debt has outpaced earnings
and capital expenditure growth, while cash holding levels have increased. This bodes poorly
for growth and possibly reflects structural impediments that are beyond financing, though it
also means the firms have some liquidity buffers. The current outlook of subdued regional
growth coupled with the expected normalization of U.S. monetary policy reinforces concerns
about NFCs financial strength and performance going forward. Even if major financial stress
is avoided, NFCs may not necessarily escape mediocre performance despite the period of
cheap funding.
Macro policy frameworks also play an important role in cushioning near-term economic
volatility stemming from global developments such as the normalization of U.S. monetary
policy. Exchange rate flexibility is critical. Large international reserves enable governments
to limit excessive exchange rate volatility, but providing full insurance against currency
fluctuation may discourage pro-active currency risk management. Authorities face the
challenge of balancing intervention and adjustment, resisting the temptation of delaying the
latter when fundamentals call for it.
References
Avdjiev, S., M. Chui and H.S. Shin, 2014, “Non-financial corporations from emerging
market economies and capital flows”, BIS Quarterly Review, December 2014.
Caballero, Ricardo, and A. Krishnamurthy, 2003, “Excessive Dollar Debt: Financial
Development and Underinsurance,” The Journal of Finance, Vol. 58, pp. 967–893.
Caballero, J. and A. Powell, 2014, “Balance Sheets and Credit Growth”. In A. Powell,
Coord. In Global Recovery and Monetary Normalization: Escaping a Chronicle
Foretold? 2014 Latin American and Caribbean Macroeconomic Report, Chapter 4.
Calvo, Guillermo, 2001, “Capital Markets and the Exchange Rate with Special Reference to
the Dollarization Debate in Latin America,” Journal of Money, Credit, and Banking,
Vol. 33(2), pp.312–34.
Chui, M., I. Fender and V. Sushko, 2014, Risks related to EME corporate balance sheets: the
role of leverage and currency mismatch. BIS Quarterly Review, pp 35–47.
Chung, K, J-E Lee, E Loukoianova, H Park and H S Shin (2014): “Global liquidity
through the lens of monetary aggregates”, IMF Working Papers, no 14/9.
Claessens, Stijn, Tong Hui, and Wei Shang-Jin, 2011, “From the Financial Crisis to the Real
Economy: Using Firm-Level Data to Identify Transmission Channels,” NBER

17
Working Paper 17360 (Cambridge, Massachusetts: National Bureau of Economic
Research).
Didier, Tatiana, and Sergio Schmukler, 2014, “Debt Markets in Emerging Economies: Major
Trends,” Comparative Economic Studies, Palgrave Macmillan Journals, Vol. 56(2),
pp. 200–28, June.
Eichengreen, Barry, and Ricardo Hausmann, and Ugo Panizza, 2003, “Currency Mismatches,
Debt Intolerance and Original Sin: Why They are Not the Same and Why it Matters,”
NBER Working Paper No. w10036 (Cambridge, Massachusetts: National Bureau of
Economic Research).
Gonzalez-Miranda, Maria, 2012, “Nonfinancial Firms in Latin America: A Source of
Volatility?” IMF Working Paper 12/279 (Washington: International Monetary Fund).
International Monetary Fund, 2014, Staff Report for Mexico’s Article IV Consultation.
Kamil, Herman, 2012, “How do Exchange Rate Regimes Affect Firms’ Incentives to Hedge
Currency Risk? Micro Evidence from Latin America,” IMF Working Paper 12/69.
Shin, Hyun Song, 2013, “The Second Phase of Global Liquidity and Its Impact on Emerging
Economies,” remarks at 2013 Federal Reserve Bank of San Francisco Asia Economic
Policy Conference.
Turner, P (2014): “The global long-term interest rate, financial risks and policy
choices in EMEs”, BIS Working Papers, no 44.
World Bank, 2005, Corporate Reestructuring. Lessons from Experience, ed. by Michael
Pomerleano and William Shaw.
18
ANNEX
Table A1. Sample Size: NFCs' Bond Issuance and Financial Statements
No. of firms No. of firms
Reporting Reporting
Domestically Foreign Domestically Foreign Debt to equity Interest Coverage
Placed Placed Placed Placed Ratios Ratios
Brazil
2003 16 18 18 33 438 357
2004 28 7 24 18 473 386
2005 36 7 28 15 528 420
2006 38 21 34 28 547 439
2007 42 7 38 19 556 472
2008 30 1 27 9 540 482
2009 23 8 17 15 520 468
2010 48 20 33 31 514 466
2011 90 13 77 25 484 441
2012 124 18 108 35 448 410
2013 125 6 106 23 415 380
Chile
2003 29 6 17 3 206 195
2004 23 3 19 2 218 209
2005 33 2 30 3 223 210
2006 11 3 14 3 379 329
2007 18 1 17 4 395 340
2008 25 1 22 1 389 334
2009 29 5 25 6 381 323
2010 4 9 4 9 374 311
2011 14 7 12 6 357 300
2012 14 7 14 7 346 299
2013 14 13 15 15 337 288
Colombia
2003 0 1 0 0 36 15
2004 1 1 0 0 41 22
2005 1 0 1 0 45 26
2006 0 1 0 1 55 37
2007 9 1 6 4 58 38
2008 4 1 3 1 59 38
2009 19 2 16 3 66 48
2010 6 6 0 68 50
2011 2 3 1 3 66 54
2012 6 2 4 1 63 55
2013 8 4 5 9 54 48
Mexico
2003 38 4 36 15 133 119
2004 38 7 37 10 140 121
2005 41 15 37 18 145 127
2006 34 8 33 11 142 123
2007 28 13 27 15 142 124
2008 32 4 32 5 144 129
2009 26 24 22 24 147 138
2010 26 26 22 23 149 139
2011 29 22 25 21 146 133
2012 22 31 18 30 144 130
2013 32 39 29 42 128 120
Peru
2003 0 0 0 0 118 112
2004 0 0 0 0 127 117
2005 15 1 8 0 134 127
2006 33 2 5 2 146 140
2007 37 1 20 1 156 144
2008 21 0 7 0 159 144
2009 37 0 13 0 150 143
2010 9 4 5 1 150 139
2011 0 2 0 1 152 138
2012 3 6 0 9 143 131
2013 8 12 5 8 124 114
Source: Dealogic and S&P Capital IQ
Bond Issuance from Dealogic Financial Data from Standard and Poors' Capital IQ
Number of Issuance by Number of Issuance by
Residency of Issuer Nationality of Parent

19
Figure A1. Number of NFC Issuers (Units)
Figure A2. Share of Issuance by Top 5 Issuers (Percent)
Sources: Dealogic; and authors’ calculations. Sources: Dealogic; and authors’ calculations.
Figure A3. Share of Issuance by Top 10 Issuers
(Percent) Figure A4. Brazil: Foreign Placement - Nationality
(Percent)
Sources: Dealogic; and authors’ calculations. Sources: Dealogic; and authors’ calculations.
0
20
40
60
80
100
120
140
0
5
10
15
20
25
30
35
40
45
502
00
3
20
04
20
05
20
06
20
07
20
08
20
09
20
10
20
11
20
12
20
13
Chile Colombia Mexico Peru Brazil (RHS)
0
10
20
30
40
50
60
70
80
90
100
Brazil Chile Colombia Mexico Peru
2010
2013
0
10
20
30
40
50
60
70
80
90
100
Brazil Chile Colombia Mexico Peru
2010
2013
0.0
5.0
10.0
15.0
20.0
25.0
30.0
2003 2004 2005 2006 2007 2008 2009 2010 2011 2012 2013
Nationality Nationality - located abroad component Cayman Islands

20
Panel A1 Issuance Breakdown – US$ billion
Brazil (Nationality)
Chile
Colombia
Mexico
Peru
Sources: Dealogic; and authors’ calculations.
0
10
20
30
40
50
60
2003 2004 2005 2006 2007 2008 2009 2010 2011 2012 2013
Domestic Quasi-Sovereign Domestic Private
Foreign Quasi-Sovereign Foreign Private
Total
0
2
4
6
8
10
2003 2004 2005 2006 2007 2008 2009 2010 2011 2012 2013
Domestic Quasi-Sovereign Domestic Private
Foreign Quasi-Sovereign Foreign Private
Total
0
1
2
3
4
5
6
2003 2004 2005 2006 2007 2008 2009 2010 2011 2012 2013
Domestic Quasi-Sovereign Domestic Private
Foreign Quasi-Sovereign Foreign Private
Total
0
5
10
15
20
25
30
35
40
2003 2004 2005 2006 2007 2008 2009 2010 2011 2012 2013
Domestic Quasi-Sovereign Domestic Private
Foreign Quasi-Sovereign Foreign Private
Total
0
0.5
1
1.5
2
2.5
3
3.5
4
4.5
2003 2004 2005 2006 2007 2008 2009 2010 2011 2012 2013
Domestic Quasi-Sovereign Domestic Private
Foreign Quasi-Sovereign Foreign Private
Total
21
Figure A5. Issuance from Nonfinancial Corporates incorporated in Cayman Islands whose Parent is
Brazilian (US$ billion)
Figure A6. Brazil - Selected Foreign Liabilities ( Stock)
(US$ billion)
Figure A7. Issuance from Financial Corporates incorporated in Cayman Islands whose Parent is Brazilian
(US$ billion)
Figure A8. Maturity at Issuance (median over the previous 12 months)
(Months)
Sources: Dealogic; Brazilian Central Bank; authors’ calculations.
0
2
4
6
8
10
12
14
16
18
0
1
2
3
4
5
6
7
8
9
Jan
-03
Ap
r-0
3
Jul-
03
Oct
-03
Jan
-04
Ap
r-0
4
Jul-
04
Oct
-04
Jan
-05
Ap
r-0
5
Jul-
05
Oct
-05
Jan
-06
Ap
r-0
6
Jul-
06
Oct
-06
Jan
-07
Ap
r-0
7
Jul-
07
Oct
-07
Jan
-08
Ap
r-0
8
Jul-
08
Oct
-08
Jan
-09
Ap
r-0
9
Jul-
09
Oct
-09
Jan
-10
Ap
r-1
0
Jul-
10
Oct
-10
Jan
-11
Ap
r-1
1
Jul-
11
Oct
-11
Jan
-12
Ap
r-1
2
Jul-
12
Oct
-12
Jan
-13
Ap
r-1
3
Jul-
13
Oct
-13
Monthly Issuance Capital control measure 12-month rolling sum (RHS)
1 3 54 6 2121. Tax 2 percent on portfolio flows2. Tax 6 percent on fixed income flows3. Tax 6 percent on loans abroad - maturity below one year
4. Tax 6 percent on loans abroad - maturity below two years5. Tax 6 percent on loans abroad - maturity below three years6. Tax 6 percent on loans abroad - maturity below five years1. Tax 6 percent on loans abroad - maturity below two years
2. Tax 6 percent on loans abroad - maturity below one year
0
100
200
300
400
500
600
700
800
0
50
100
150
200
250
De
z
Mar
Jun
Set
De
z
Mar
Jun
Set
De
z
Mar
Jun
Set
De
z
Mar
Jun
Set
De
z
Mar
Jun
Set
De
z
Mar
Jun
Set
De
z
Mar
Jun
Set
De
z
Mar
Jun
Set
De
z
Mar
Jun
Set
De
z
Mar
Jun
Set
De
z
Mar
Jun
Set
De
z
Mar
Jun
Set
De
z
Mar
Jun
2001 2002 2003 2004 2005 2006 2007 2008 2009 2010 2011 2012 2013 2014
FDI - Intercompany FDI - Equity (RHS) Portfolio (RHS)
0
2
4
6
8
10
12
14
0
1
2
3
4
5
6
7
8
9
Jan
-03
Ap
r-0
3
Jul-
03
Oct
-03
Jan
-04
Ap
r-0
4
Jul-
04
Oct
-04
Jan
-05
Ap
r-0
5
Jul-
05
Oct
-05
Jan
-06
Ap
r-0
6
Jul-
06
Oct
-06
Jan
-07
Ap
r-0
7
Jul-
07
Oct
-07
Jan
-08
Ap
r-0
8
Jul-
08
Oct
-08
Jan
-09
Ap
r-0
9
Jul-
09
Oct
-09
Jan
-10
Ap
r-1
0
Jul-
10
Oct
-10
Jan
-11
Ap
r-1
1
Jul-
11
Oct
-11
Jan
-12
Ap
r-1
2
Jul-
12
Oct
-12
Jan
-13
Ap
r-1
3
Jul-
13
Oct
-13
Monthly Issuance Capital control measure 12-month rolling sum (RHS)
1 3 54 6 2121. Tax 2 percent on portfolio flows2. Tax 6 percent on fixed income flows3. Tax 6 percent on loans abroad - maturity below one year
4. Tax 6 percent on loans abroad - maturity below two years5. Tax 6 percent on loans abroad - maturity below three years6. Tax 6 percent on loans abroad - maturity below five years1. Tax 6 percent on loans abroad - maturity below two years
2. Tax 6 percent on loans abroad - maturity below one year
0
50
100
150
200
250
300
350
400
De
c-0
3
Ap
r-0
4
Au
g-0
4
De
c-0
4
Ap
r-0
5
Au
g-0
5
De
c-0
5
Ap
r-0
6
Au
g-0
6
De
c-0
6
Ap
r-0
7
Au
g-0
7
De
c-0
7
Ap
r-0
8
Au
g-0
8
De
c-0
8
Ap
r-0
9
Au
g-0
9
De
c-0
9
Ap
r-1
0
Au
g-1
0
De
c-1
0
Ap
r-1
1
Au
g-1
1
De
c-1
1
Ap
r-1
2
Au
g-1
2
De
c-1
2
Ap
r-1
3
Au
g-1
3
De
c-1
3
Financial Corporations Non-Financial Corporations
22
Panel A2 Issuance by Issuer’s Rating Grade
(US$ billion)
Brazil
Brazil (Nationality)
Chile
Colombia
Mexico
Peru
Sources: Dealogic; and authors’calculations.
0
5
10
15
20
25
30
35
40
20
03
20
04
20
05
20
06
20
07
20
08
20
09
20
10
20
11
20
12
20
13
High Yield
Non-Investment Grade, Non-high Yield
Investment Grade
Total
0
2
4
6
8
10
2003 2004 2005 2006 2007 2008 2009 2010 2011 2012 2013
Domestic Quasi-Sovereign Domestic Private
Foreign Quasi-Sovereign Foreign Private
Total
0
1
2
3
4
5
6
7
8
9
10
20
03
20
04
20
05
20
06
20
07
20
08
20
09
20
10
20
11
20
12
20
13
High Yield
Non-Investment Grade, Non-high Yield
Investment Grade
Total
0
1
2
3
4
5
6
20
03
20
04
20
05
20
06
20
07
20
08
20
09
20
10
20
11
20
12
20
13
High Yield
Non-Investment Grade, Non-high Yield
Investment Grade
Total
0
5
10
15
20
25
30
35
40
20
03
20
04
20
05
20
06
20
07
20
08
20
09
20
10
20
11
20
12
20
13
High Yield
Non-Investment Grade, Non-high Yield
Investment Grade
Total
0
0.5
1
1.5
2
2.5
3
3.5
4
4.5
20
03
20
04
20
05
20
06
20
07
20
08
20
09
20
10
20
11
20
12
20
13
High Yield
Non-Investment Grade, Non-high Yield
Investment Grade
Total

23
Panel A3 Percent of Non-Investment Grade Issuance (Monthly)
(Percent)
Brazil
Brazil (Nationality)
Chile
Colombia
Mexico
Peru
Sources: Dealogic; and author s’calculations.
0
10
20
30
40
50
60
70
80
20
10
m1
20
10
m3
20
10
m5
20
10
m7
20
10
m9
20
10
m1
1
20
11
m1
20
11
m3
20
11
m5
20
11
m7
20
11
m9
20
11
m1
1
20
12
m1
20
12
m3
20
12
m5
20
12
m7
20
12
m9
20
12
m1
1
20
13
m1
20
13
m3
20
13
m5
20
13
m7
20
13
m9
20
13
m1
1
0
10
20
30
40
50
60
70
80
20
10
m1
20
10
m3
20
10
m5
20
10
m7
20
10
m9
20
10
m1
1
20
11
m1
20
11
m3
20
11
m5
20
11
m7
20
11
m9
20
11
m1
1
20
12
m1
20
12
m3
20
12
m5
20
12
m7
20
12
m9
20
12
m1
1
20
13
m1
20
13
m3
20
13
m5
20
13
m7
20
13
m9
20
13
m1
1
0
10
20
30
40
50
60
70
80
90
100
20
10
m1
20
10
m3
20
10
m5
20
10
m7
20
10
m9
20
10
m1
1
20
11
m1
20
11
m3
20
11
m5
20
11
m7
20
11
m9
20
11
m1
1
20
12
m1
20
12
m3
20
12
m5
20
12
m7
20
12
m9
20
12
m1
1
20
13
m1
20
13
m3
20
13
m5
20
13
m7
20
13
m9
20
13
m1
1
0
10
20
30
40
50
60
70
80
90
100
20
10
m1
20
10
m3
20
10
m5
20
10
m7
20
10
m9
20
10
m1
1
20
11
m1
20
11
m3
20
11
m5
20
11
m7
20
11
m9
20
11
m1
1
20
12
m1
20
12
m3
20
12
m5
20
12
m7
20
12
m9
20
12
m1
1
20
13
m1
20
13
m3
20
13
m5
20
13
m7
20
13
m9
20
13
m1
1
0
10
20
30
40
50
60
70
80
90
100
20
10
m1
20
10
m3
20
10
m5
20
10
m7
20
10
m9
20
10
m1
1
20
11
m1
20
11
m3
20
11
m5
20
11
m7
20
11
m9
20
11
m1
1
20
12
m1
20
12
m3
20
12
m5
20
12
m7
20
12
m9
20
12
m1
1
20
13
m1
20
13
m3
20
13
m5
20
13
m7
20
13
m9
20
13
m1
1
0
10
20
30
40
50
60
70
80
90
100
20
10
m1
20
10
m3
20
10
m5
20
10
m7
20
10
m9
20
10
m1
1
20
11
m1
20
11
m3
20
11
m5
20
11
m7
20
11
m9
20
11
m1
1
20
12
m1
20
12
m3
20
12
m5
20
12
m7
20
12
m9
20
12
m1
1
20
13
m1
20
13
m3
20
13
m5
20
13
m7
20
13
m9
20
13
m1
1
24
Figure A9. Median Liability to Asset Ratio
Figure A10. 75th Percentile (Weak Tail): Liability to Asset Ratio
Figure A11. Non-Debt Liabilities to Total Liabilities
Sources: S&P Capital IQ; and authors’ calculations.
0.3
0.4
0.5
0.6
0.7
0.8
2003 2006 2009 2012
Brazil
Median
2003 2006 2009 2012
Chile
2003 2006 2009 2012
Colombia
2003 2006 2009 2012
Mexico
0.3
0.4
0.5
0.6
0.7
0.8
2003 2006 2009 2012
Peru
0.0
0.2
0.4
0.6
0.8
1.0
2003 2006 2009 2012
Brazil
2003 2006 2009 2012
Chile
2003 2006 2009 2012
Colombia
2003 2006 2009 2012
Mexico
0.0
0.2
0.4
0.6
0.8
1.0
2003 2006 2009 2012
Peru
0
0.2
0.4
0.6
0.8
1
2003 2006 2009 2012
Brazil
Median
Weak tail(25th percentile)
2003 2006 2009 2012
Chile
2003 2006 2009 2012
Colombia
2003 2006 2009 2012
Mexico
0
0.2
0.4
0.6
0.8
1
2003 2006 2009 2012
Peru
25
Figure A12
Percentile 0-25 25-50 50-75 75-100 sum Obs
0-25 11% 3% 3% 8% 25%
25-50 7% 4% 7% 7% 25%
50-75 5% 9% 7% 4% 25%
75-100 3% 10% 8% 5% 25%
sum 25% 25% 25% 25% 100%
0-25 14% 4% 3% 5% 25%
25-50 7% 7% 4% 7% 25%
50-75 3% 8% 6% 8% 25%
75-100 1% 7% 12% 5% 25%
sum 25% 25% 25% 25% 100%
0-25 15% 4% 6% 2% 26%
25-50 6% 11% 0% 7% 24%
50-75 4% 4% 9% 9% 26%
75-100 2% 6% 11% 6% 24%
sum 26% 24% 26% 24% 100%
0-25 9% 4% 5% 7% 25%
25-50 5% 9% 6% 5% 25%
50-75 8% 5% 7% 5% 25%
75-100 3% 7% 7% 8% 25%
sum 25% 25% 25% 25% 100%
0-25 13% 6% 3% 3% 26%
25-50 6% 5% 10% 5% 25%
50-75 5% 10% 3% 7% 25%
75-100 2% 4% 9% 10% 25%
sum 26% 25% 25% 25% 100%
Tota
l ass
ets
- p
erce
nt
by
per
cen
tile
ran
ge c
om
bin
atio
n
(lar
ger)
<--
----
---
com
pan
y si
ze (
asse
t-b
ased
) b
y co
un
try
----
----
-> (
smal
ler)
Bra
zil
Per
u
125
Source: S&P Capital IQ and staff calculation. The numbers indicate
the percentage of companies in each combination of leverage and
company size percentile range
Cross Distribution of Leverage and Company Size in 2013
414
Ch
ile
337
Co
lom
bia
54
Mex
ico
128
Debt to equity - percentage by percentile range combination
(lower) <-------- leverage --------> (higher)

26
Figure A13
Percentile 0-25 25-50 50-75 75-100 sum Obs
0-25 7% 5% 7% 7% 25%
25-50 6% 7% 7% 5% 25%
50-75 6% 7% 5% 7% 25%
75-100 6% 6% 7% 6% 25%
sum 25% 25% 25% 25% 100%
0-25 9% 2% 4% 9% 25%
25-50 6% 6% 6% 7% 25%
50-75 7% 8% 7% 3% 25%
75-100 3% 8% 8% 6% 25%
sum 25% 25% 25% 25% 100%
0-25 12% 4% 6% 4% 27%
25-50 4% 6% 8% 6% 24%
50-75 4% 4% 8% 8% 24%
75-100 6% 10% 2% 6% 24%
sum 27% 24% 24% 24% 100%
0-25 6% 4% 6% 10% 26%
25-50 8% 6% 7% 4% 25%
50-75 5% 7% 9% 4% 25%
75-100 7% 8% 3% 7% 25%
sum 26% 25% 25% 25% 100%
0-25 7% 9% 4% 5% 25%
25-50 8% 6% 5% 5% 25%
50-75 4% 6% 8% 8% 25%
75-100 6% 3% 8% 7% 25%
sum 25% 25% 25% 25% 100%
Source: S&P Capital IQ and staff calculation. The numbers indicate
the percentage of companies in each combinatinon of leverage and
investment level percentile ranges
Cross Distribution of Leverage and Investment Level in 2013
Debt to equity - percentage by percentile range combination
(lower) <-------- leverage --------> (higher)
Inve
stm
ent
ove
r to
tal a
sset
s -
per
cen
t b
y p
erce
nti
le r
ange
co
mb
inat
ion
(lar
ger)
<--
----
---
Inve
stm
ent
leve
l by
cou
ntr
y --
----
--->
(sm
alle
r)
Bra
zil
338
Ch
ile
272
Co
lom
bia
49
Mex
ico
121
Per
u
118
27
Figure A14. LA-5 Issuance by Maturity (US$ billion)
Sources: Dealogic; and authors’ calculations.
Figure A15. PEMEX-Mexico Yield at Issuance by Term and Volume (Foreign placement, fixed rate, dollar bond) Yield (top) and US$ million (bottom)
Sources: Dealogic; and authors’ calculation.
0
5
10
15
20
25
2003 2004 2005 2006 2007 2008 2009 2010 2011 2012 2013
0-2 years
2-4 years
4-6 years
6-8 years
8-10 years
10+ years
0
2
4
6
8
10
4-6 years 6-8 years 8-10 years 10+ years
2009
2010
2011
2012
2013
0
1000
2000
3000
4000
5000
4-6 years 6-8 years 8-10 years 10+ years
2009
2010
2011
2012
2013

28
Figure A16. Petrobras (Brazil - Cayman Islands subsidiary) Yield at Issuance by Term and Volume (Foreign placment, fixed rate, dollar bond) Yield (top) and US$ million (bottom)
Source: Dealogic and author calculation
Figure A17. Braskem-Brazil Yield at Issuance by Term and Volume (Foreign placement, fixed rate, dollar bond) Yield (top) and US$ million (bottom)
Sources: Dealogic; and authors’ calculations.
0
2
4
6
8
10
12
0-2 years 4-6 years 8-10 years 10+ years
2003
2004
2006
2007
2008
2009
2011
2012
0
1000
2000
3000
4000
5000
6000
7000
8000
0-2 years 4-6 years 8-10 years 10+ years
2003
2004
2006
2007
2008
2009
2011
2012
0
2
4
6
8
10
12
14
0-2 years 4-6 years 6-8 years 8-10 years
2003
2004
2005
2006
0
50
100
150
200
250
300
0-2 years 4-6 years 6-8 years 8-10 years
2003
2004
2005
2006
29
Figure A18. America Movil - Mexico Yield at Issuance by Term and Volume (Foreign placement, fixed rate, Dollar bond) Yield (top) and US$ million (bottom)
Sources: Dealogic; and authors’ calculations.
0
1
2
3
4
5
6
7
4-6 years 8-10 years 10+ years
2004
2005
2007
2009
2010
2011
2012
0
1000
2000
3000
4000
5000
4-6 years 8-10 years 10+ years
2004
2005
2007
2009
2010
2011
2012
30
Panel A4 Foreign Issuance by Sectors
(Percent)
Brazil
Brazil (Nationality)
Chile
Colombia
Mexico
Peru
Sources: Dealogic; and authors’calculations.
0
10
20
30
40
50
60
70
80
90
100
20
03
20
04
20
05
20
06
20
07
20
08
20
09
20
10
20
11
20
12
20
13
Other
Consumer Products
Food & Beverage
Telecommunications
Oil & Gas
Mining
Construction/Building
Utility/Energy
Retail 0
10
20
30
40
50
60
70
80
90
100
20
03
20
04
20
05
20
06
20
07
20
08
20
09
20
10
20
11
20
12
20
13
Other
Consumer Products
Food & Beverage
Telecommunications
Oil & Gas
Mining
Construction/Building
Utility/Energy
Retail