corporate governance and cartel formation -...
TRANSCRIPT
1
Corporate Governance and
Cartel Formation
By
Suha Mahmoud Alawi
A thesis submitted to University of Bath in fulfilment of the requirements
for the degree of Doctor of Philosophy
University of Bath
Management School
2012

2
Declaration
I hereby declare that the materials contained in this thesis have not been previously
submitted for a degree in this or any other university. I further declare that this thesis is
solely base on my own research.
Suha Mahmoud Alawi
Copyright statement
"Attention is drawn to the fact that copyright of this thesis rests with the author. A copy of
this thesis has been supplied on condition that anyone who consults it is understood to
recognise that its copyright rests with the author and that they must not copy it or use
material from it except as permitted by law or with the consent of the author".
Suha Mahmoud Alawi
3
ACKNOWLEDGMENTS
I am grateful to my main supervisor, Professor. Ania Zalewska. I cannot adequately express
my gratitude to her for her endless belief in me from our first meeting and throughout
difficult moments. Professor Ania always provided me with guidance and the motivation
necessary to complete this research. I have learned a great deal of useful knowledge from her
academic expertise and her friendship.
Deep appreciation goes to my secondary supervisor, Dr. Eleanor Morgan, for providing me
with her great knowledge. Even though Dr. Eleanor joined us at a later stage of the research
but still she has provided me with insightful comments and directions on my work. Her
encouragement and patience undoubtedly resulted in significant contributions to the
development of this thesis.
I would like also to express my gratitude to my previous supervisor Dr Tina Chung, her great
advices and knowledge were a mile stone in this research.
I would like to thank my sponsor, King Abdullaziz University, for financing my PhD studies
and for supporting me through my study journey.
Finally, I take this opportunity to express the profound gratitude from my deep heart to my
beloved parents, my sister Dr. Maha Alawi, my brother Dr. Turki Alawi and my daughter
Lamar for their love and continuous support both spiritually and materially. I also would like
to thank a very specially lady Mrs Sunarpiah Siman for giving me the support I needed in
everyday aspect during my journey, I would like to thank her for helping me taking care of
my daughter and for making the journey flow.

4
DEDICATION
This thesis is dedicated to my parents and my little princes Lamar who share
this dream with me.
5
Abstract
A firm’s participation in cartel depends upon the potential problems that may arise due to
price fixing and the incentives provided to the management. The top levels of management
such as the board of directors and the CEO are responsible for deciding if the firm will
participate in the cartel and manage the corporate governance activities of collusive price
fixing agreements.
This study aims to identify which characteristics of the participating firms’ boards of
directors and CEOs are associated with cartel formation. It analyses the empirical
investigation of cartel participation of firms, taking into account corporate governance
characteristics as such as board of directors’ characteristics, ownership structure, CEO
characteristics, and CEO compensation scheme. The study is focused on UK cartel firms
which has the highest representation in the sample. A total number of 150 cartel firms in 52
cases from all around the world between the years 1990 to 2008 are involved in this study, of
which 114 are UK firms. Therefore, this study is dominated by UK firms.
The challenge of this study is that the personal attributes of CEOs and boards can make a
significant contribution to the risk profile of a cartel being formed. This indeed would be to
‘diagnose’ organisational culture in a quite radical direction. The study suggests and finds
that some corporate governance attributes are associated with cartel formation. The results
reveal consistency with prior researches, that cartel firms have different corporate
governance relative to a control sample in the three years prior to cartel formation.
Specifically, the study concludes that UK-based cartel firms characterised by having larger
board size compared to non-cartel firms; lower percentage of independent directors (non-
executive); higher average of board remuneration; less likely that cartel is formed by
family-owned and controlled firm (large shareholders); having older CEOs represented on
the board; having CEO who served a less number of years as a director; less likely to have
a female CEO represented; more likely to have CEOs who’s combined CEO-chairman
position; and a higher average of CEOs bonuses and compensation packages.

6
TABLE OF CONTANTS
Chapter One ................................................................................................................................... 11
Introduction .................................................................................................................................... 11 1.1 Background ................................................................................................................................ 11 1.2 Addressing the Problem ............................................................................................................. 12 1.3 Research Approach .................................................................................................................... 13 1.4 Contributions of the Study ......................................................................................................... 14
1.5 Structure of the Thesis ............................................................................................................... 16
Chapter Two ................................................................................................................................... 18 Cartel ............................................................................................................................................... 18 2.1 Introduction ................................................................................................................................ 18 2.2 Definition and Forms of Cartel .................................................................................................. 18 2.3 Theoretical Framework .............................................................................................................. 20 2.3.1 Oligopoly Theory .................................................................................................................... 20
2.3.2 Game Theory .......................................................................................................................... 22 2.4 Factors that Facilitate and Limit Collusion ................................................................................ 23 2.5 Effects of Cartel Imposition ....................................................................................................... 30 2.5.1 Direct Effects .......................................................................................................................... 31
2.5.2 Indirect Cartel Effects ............................................................................................................. 32 2.6 Who is Accountable? Individual vs. Firm ................................................................................. 32
2.7 Anti-Cartel Enforcement Policies .............................................................................................. 35
2.7.1 The U.S approach (Department of Justice) ............................................................................. 35
2.7.2 The European Approach (European Commission) ................................................................. 41 2.7.3 The UK approach (Competition Commission/ Office of Fair Trading) ................................. 49
2.8 Chapter Summary ...................................................................................................................... 56
Chapter Three ................................................................................................................................ 57 Literature Review and Hypothesis Development........................................................................ 57 3.1 Introduction ................................................................................................................................ 57
3.2 The Concept of Corporate Governance ..................................................................................... 57 3.2.1The Board of Directors Roles in Corporate Governance ......................................................... 59
3.2.2 The CEO Roles in Corporate Governance .............................................................................. 62 3.2.3 Ownership Structure and Corporate Governance ................................................................... 64
3.3 Corporate Governance and Market Competition ....................................................................... 69 3.4 Corporate Governance and Cartel Formation ............................................................................ 72 3.4.1 The CEO and Cartel Formation .............................................................................................. 76 3.4.2 Shareholders and Cartel Formation ........................................................................................ 80 3.5 Theoretical Background ............................................................................................................. 82
3.5.1 Agency Theory........................................................................................................................ 82 3.6 Hypothesis Development ........................................................................................................... 85 3.6.1 Does Board of Director Characteristics Matter? ..................................................................... 86 3.6.2 Does Ownership Structure Matter? ....................................................................................... 105 3.6.3 Does CEO Characteristics Matter? ....................................................................................... 111
3.6.4 Does CEO Compensation Scheme Matter? .......................................................................... 131 3.7 Chapter Summary .................................................................................................................... 135
7
Chapter Four ................................................................................................................................ 136
Data Description........................................................................................................................... 136 4.1 Cartel Data ............................................................................................................................... 136 4.1.1. Sources ................................................................................................................................. 136 4.1.2. Data Collection Methods ..................................................................................................... 136 4.2 Data Description ...................................................................................................................... 140 4.2.1 Description of Cartel Cases .................................................................................................. 141
4.2.2 Description of Cartel Firms .................................................................................................. 144 4.3 Benchmark (Non-Cartel Firms) ............................................................................................... 148 4.4 Benchmark Descriptive Analysis ............................................................................................. 150 4.5 Chapter Summary .................................................................................................................... 154
Chapter Five ................................................................................................................................. 155
Methodology and Empirical Results .......................................................................................... 155 5.1 Outline of Propositions ............................................................................................................ 156
5.1.1 Measurement of the Dependent Variable ............................................................................. 156 5.1.2 Measurement of the Independent Variables ......................................................................... 156 5.1.3 Measurement of Control Variables ....................................................................................... 159 5.2 Empirical Methodology ........................................................................................................... 163
5.3 Descriptive Statistics and Univariate Analysis ........................................................................ 169 5.3.1 Descriptive Statistics Analysis for all Cartel and Non-Cartel Firms .................................... 169
5.3.2 Descriptive Statistics of UK Cartel Firms and UK Non-Cartel firms .................................. 174 5.3.3 Descriptive Statistics of UK Cartel Firms at Home and Abroad .......................................... 177 5.4 Correlation Analysis ................................................................................................................ 180
5.5 Test of Hypotheses (Multivariate Analyses) ............................................................................ 183
5.5.1 Model Descriptions ............................................................................................................... 184 5.6 Empirical results ...................................................................................................................... 188 5.6.1 Board Characteristics Estimation Results ............................................................................. 188
5.6.2 Ownership Structure Estimation Results .............................................................................. 194 5.6.3 CEO Characteristics Estimation Results ............................................................................... 197
5.6.4 Board Characteristics, Ownership Structure and CEO Characteristics Estimation Results . 203 5.6.5 Marginal Effects.................................................................................................................... 205 5.6.6 CEO Compensation Estimation Results ............................................................................... 207
5.7 Chapter Summary .................................................................................................................... 211
Chapter Six ................................................................................................................................... 212
Discussion...................................................................................................................................... 212 6.1 Corporate Governance and Cartel Formation .......................................................................... 212
6.1.1 Ownership Concentration and Cartel Formation .................................................................. 229 6.2 Cartel and Compliance Code Needs ........................................................................................ 232
6.3 Corporate Anti-Cartel Compliance Programme ...................................................................... 239 6.4 Chapter Summary .................................................................................................................... 242
Chapter Seven .............................................................................................................................. 244 Summary and Conclusion ........................................................................................................... 244 7.1 Introduction .............................................................................................................................. 244 7.2 Summary of Research Results ................................................................................................. 244 7.3 Research Recommendations .................................................................................................... 246
7.4 Limitations of the Research ..................................................................................................... 252 7.5 Suggestions for Future Research ............................................................................................. 254

8
7.6 Conclusion ............................................................................................................................... 254
Bibliography ................................................................................................................................. 256
APPENDIX ................................................................................................................................... 289
9
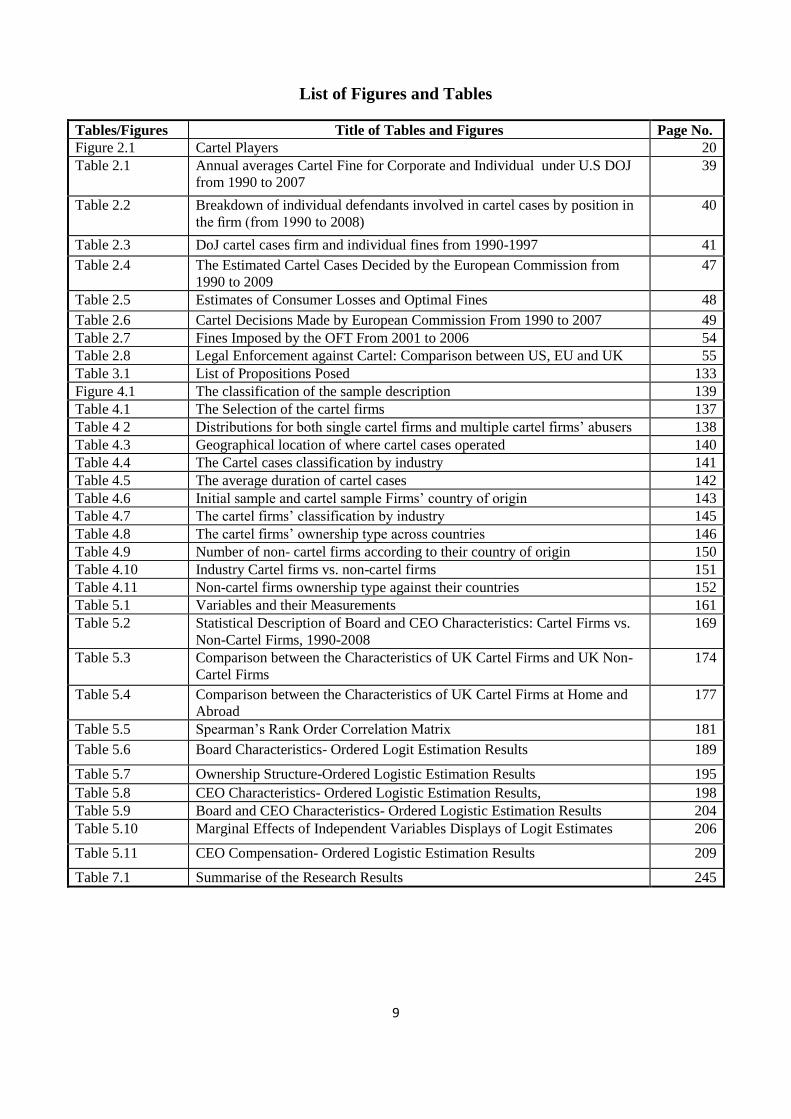
List of Figures and Tables
Tables/Figures Title of Tables and Figures Page No.
Figure 2.1 Cartel Players 20
Table 2.1 Annual averages Cartel Fine for Corporate and Individual under U.S DOJ
from 1990 to 2007
39
Table 2.2 Breakdown of individual defendants involved in cartel cases by position in
the firm (from 1990 to 2008)
40
Table 2.3 DoJ cartel cases firm and individual fines from 1990-1997 41
Table 2.4 The Estimated Cartel Cases Decided by the European Commission from
1990 to 2009
47
Table 2.5 Estimates of Consumer Losses and Optimal Fines 48
Table 2.6 Cartel Decisions Made by European Commission From 1990 to 2007 49
Table 2.7 Fines Imposed by the OFT From 2001 to 2006 54
Table 2.8 Legal Enforcement against Cartel: Comparison between US, EU and UK 55
Table 3.1 List of Propositions Posed 133
Figure 4.1 The classification of the sample description 139
Table 4.1 The Selection of the cartel firms 137
Table 4 2 Distributions for both single cartel firms and multiple cartel firms’ abusers 138
Table 4.3 Geographical location of where cartel cases operated 140
Table 4.4 The Cartel cases classification by industry 141
Table 4.5 The average duration of cartel cases 142
Table 4.6 Initial sample and cartel sample Firms’ country of origin 143
Table 4.7 The cartel firms’ classification by industry 145
Table 4.8 The cartel firms’ ownership type across countries 146
Table 4.9 Number of non- cartel firms according to their country of origin 150
Table 4.10 Industry Cartel firms vs. non-cartel firms 151
Table 4.11 Non-cartel firms ownership type against their countries 152
Table 5.1 Variables and their Measurements 161
Table 5.2 Statistical Description of Board and CEO Characteristics: Cartel Firms vs.
Non-Cartel Firms, 1990-2008
169
Table 5.3 Comparison between the Characteristics of UK Cartel Firms and UK Non-
Cartel Firms
174
Table 5.4 Comparison between the Characteristics of UK Cartel Firms at Home and
Abroad
177
Table 5.5 Spearman’s Rank Order Correlation Matrix 181
Table 5.6 Board Characteristics- Ordered Logit Estimation Results 189
Table 5.7 Ownership Structure-Ordered Logistic Estimation Results 195
Table 5.8 CEO Characteristics- Ordered Logistic Estimation Results, 198
Table 5.9 Board and CEO Characteristics- Ordered Logistic Estimation Results 204
Table 5.10 Marginal Effects of Independent Variables Displays of Logit Estimates 206
Table 5.11 CEO Compensation- Ordered Logistic Estimation Results 209
Table 7.1 Summarise of the Research Results 245
10
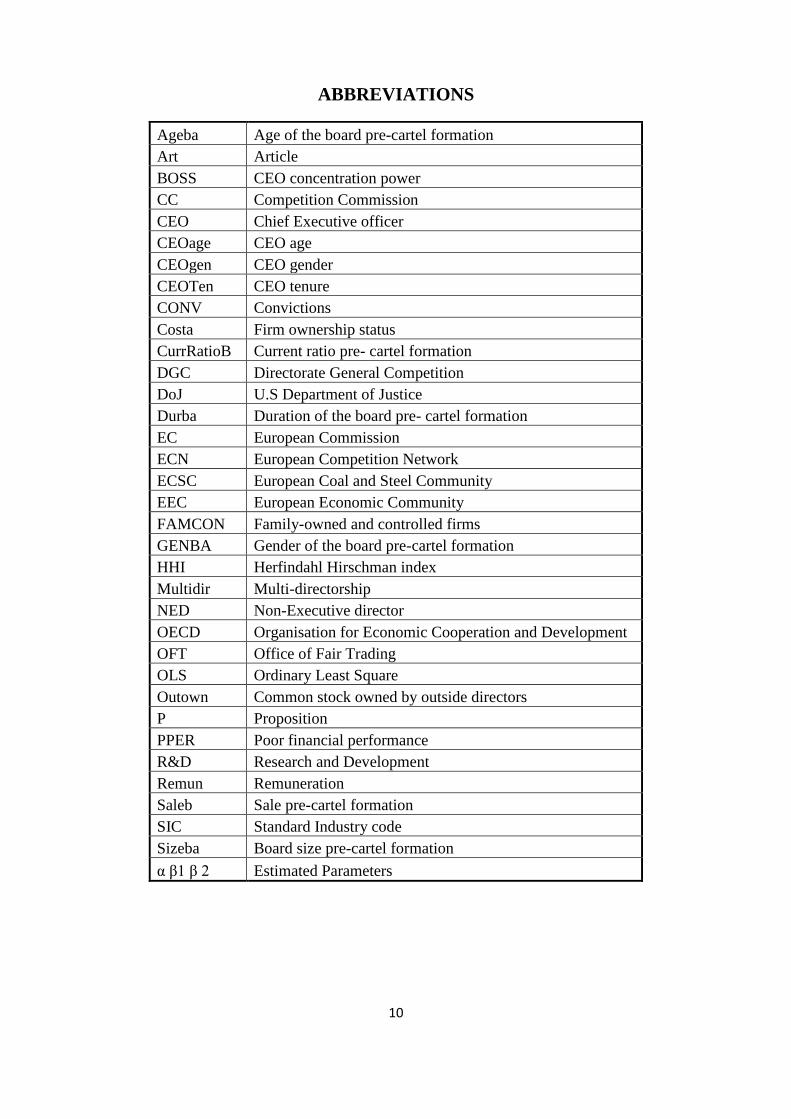
ABBREVIATIONS
Ageba Age of the board pre-cartel formation
Art Article
BOSS CEO concentration power
CC Competition Commission
CEO Chief Executive officer
CEOage CEO age
CEOgen CEO gender
CEOTen CEO tenure
CONV Convictions
Costa Firm ownership status
CurrRatioB Current ratio pre- cartel formation
DGC Directorate General Competition
DoJ U.S Department of Justice
Durba Duration of the board pre- cartel formation
EC European Commission
ECN European Competition Network
ECSC European Coal and Steel Community
EEC European Economic Community
FAMCON Family-owned and controlled firms
GENBA Gender of the board pre-cartel formation
HHI Herfindahl Hirschman index
Multidir Multi-directorship
NED Non-Executive director
OECD Organisation for Economic Cooperation and Development
OFT Office of Fair Trading
OLS Ordinary Least Square
Outown Common stock owned by outside directors
P Proposition
PPER Poor financial performance
R&D Research and Development
Remun Remuneration
Saleb Sale pre-cartel formation
SIC Standard Industry code
Sizeba Board size pre-cartel formation
α β1 β 2 Estimated Parameters
11
Chapter One
Introduction
“Effective competition is crucial to an open market economy. It cuts prices, raises quality,
and expands customer choice. Competition allows technological innovation to flourish”.
— Directorate General Competition website, June 2005
1.1 Background
Firms have been carrying out collusive behaviour in terms of price fixing for many years; in
the 1980s the antitrust authorities around the world started to pay more attention to these
firms. The penalties enforced on the organisations worldwide exceeded $2 billion per year in
the early 2000s. More than 40% of these penalties were settled in private suits. The remaining
60% were fines imposed by the European Union antitrust authorities and the US (Connor and
Helmers, 2007). A cartel is defined as an association which is formed by independent firms to
establish objectives in explicit agreements that would help them reap profits by either
controlling prices or restricting the level of output (Connor and Helmers, 2007).
Not only does price fixing incline firms to join cartel but also management incentives, which
help them carry out this decision (e.g., Levenstein and Suslow, 2006; Spagnolo, 2005).
Collusive agreements are managed at lower discount factors when managers find that there
exists a smoother path for profits and that contracts are able to achieve incentive provisions
such as bonus plans, etc. (Spagnolo, 2005). Since high collusive profits are expected by
shareholders, shareholders are ready to bear the high costs associated with the plan. It is also
observed that in a classical model of repeated oligopoly, a positive correlation exists between
the performance-based incentives of the top hierarchical levels and tacit collusive agreements
(Buccirossi and Spagnolo, 2008).
Two issues have been found requiring attention in a cartel situation: The entry of new firms
and the cheating possibility (Levenstein and Suslow, 2006). The financial statement of the
organisation consists of all kinds of deviations that the firm may carry out as part of the
collusive agreement. The partners in the cartel may start a price war if they find exceptional
12
earnings, and this activity may result in lower earnings overall. The antitrust authorities may
also be alerted and the collusive agreement would be considered weak. Defection from
collusive behaviour may not be attractive since the future costs are very high. Some of the
firms may also enter the market and distort the existing collusive equilibrium. Concentrated
industries are commonly found to have successful cartel that facilitate collusive activities
(Bolotova, Connor, and Miller, 2008).
The management of the organisation is required to enforce cartel agreements (Spagnolo,
2005) and the decision to actually form the cartel is taken by the top management
(Harrington, 2006c). The CEO, Board of directors and top management are all involved in
the collusive price fixing agreements, which are formed by their firms as part of the corporate
governance discussions. Hence, it is necessary to understand whether the corporate
governance within a firm helps determine if a cartel should be formed. Many organisations
may not want to carry out this hard-core activity and establish collusive agreements. Cartel
participation increases if the board of directors is weak; if most power is exercised by the top
management level (concentrated power); and if the incentives provided to the management
depend on their performance levels (Spagnolo, 2005). The empirical literature has not yet
established a link between cartel and firms’ corporate governance characteristics.
1.2 Addressing the Problem
This study’s primary objective is to examine the characteristics of the boards and the CEOs
of firms involved in cartel formation. It is proposed that significant differences in the
corporate governance attributes may exist between cartel and non-cartel firms, and that these
differences might help to explain how corporate governance characteristics are related to
cartel formation and discovery.
The independent variables reflecting corporate governance attributes are grouped in four
different types: board of directors’ characteristics, ownership structure, CEO characteristics,
and CEO compensation scheme. A review of the corporate governance literature reveals
several attributes. These attributes are selected based on any of the following reasons:
13
1. Corporate governance attributes that are proved in the literature to have a link with
financial fraud.
2. Corporate governance attributes that are proved in the literature to have a link with
collusion (Han ( 2010), Spagnolo (2005), Burhop and Lubbers (2008), Gonzalez and
Schmid (2012))
3. Based on the agency theory perspective that will be illustrated in chapter three. This
includes the internal monitoring by boards of directors (Fama (1980) and Fama and
Jensen (1983)), and the use of NEDs (Fama (1980) and Anderson et al., (1993)).
4. Corporate governance attributes that the review of the prior literature reveals a lack of
research in them. For example age of the CEO and the board of directors.
5. Corporate governance attributes that are proved in the literature to have been
associated with competition. This includes CEO compensation scheme (Spagnolo
(2000) and Han, (2010)).
These attributes are used in this research to test the link between corporate governance and
cartel formation. In line with the above illustration, the main research questions are:
Is there any corporate governance characteristics associated with cartel formation?
Can appropriate policies and recommendations regarding a board structure be
designed to reduce the probability of firms creating cartel?
1.3 Research Approach
This research aims to find if there is a link between corporate governance characteristics and
cartel formation in UK-based cartel firms. The cartel data set consists of 150 cartel firms,
where 114 firms are from the UK. These firms have formed cartel and discovered in 52 cartel
cases that operated in all around the world, and were found guilty by DoJ, EC, and OFT/CC
between 1990 and 2008.
Several databases are used in the cartel sample selection and cartel data collection phases of
this study. The ordered logistic estimation model is used to examine the differences in board
characteristics, ownership structure, and CEO characteristics among cartel and non-cartel
14
firms, where Binary model is used to examine the differences in CEO compensation among
cartel and non-cartel firms.
1.4 Contributions of the Study
This study links two literatures by studying the relationship between corporate governance
and cartel formation.
Prior studies have examined the economic consequences of cartel formation. Various criteria
have been applied to evaluate cartel performance (e.g. Levenstein and Valerie, 2006)
including longevity (e.g. Dick, 1996; Simmerman and Connor, 2005; Levenstein and Suslow,
2010), stability (e.g. Porter and Zona, 1993; Villar, 1983, 1973 and 1999), social welfare (e.g.
Bos and Pot 2012; Mott, 2003), and efficiency (e.g. Burhop and Luebbers, 2008; Dick, 1998;
Günster, Carree and Dijk, 2011). However, only few papers have discussed cartel formation
in relation to corporate governance. Specifically, previous studies focus on cartel formation in
connection with compensation, CEO tenure and board characteristics (Han (2010); Spagnolo
(2005); Burhop and Lubbers (2008); and Gonzalez and Schmid (2012)).
However, this thesis offers contributions to the literature by complement the empirical
findings of Spagnolo’s (2005) which are connected to this research. As Spagnolo documented
that collusive agreements are managed at lower discount factors through smoother paths for
profits. He has specified that price fixing and management incentives encourage firms to join
cartel, which provide enlightenment to this research as it discusses corporate governance and
cartel formation. The focus of his study is similar to this current study since both of them
discuss compensation schemes (remuneration) as one of the characteristics of corporate
governance. Spagnolo reinforces the influence of corporate governance on cartel formation as
stated in his paper that to enforce cartel agreements is to require the management of
organisations. Therefore, the current research is complementing the empirical finding of
Spagnolo’s (2005)
Furthermore, this thesis offers contributions to the literature by complement the empirical
findings of Han (2010). Han examines short-term and long-term employment contracts and
their effects on cartel stability. The study shows that firms are more likely to be involved in
15
cartel agreement when CEO tenure (short-term employment contract) is low or when CEO
turnover is high. The author also shows that a short-term contract provides stability to a cartel
formation more than a long-term contract. Therefore, the current research is complementing
the empirical finding of Han’s (2010).
Moreover, the most closely related study in this literature is perhaps the study by Gonzalez
and Schmid (2012). Their research was conducted by using a sample of 1,148 observations
from 1987 to 2009, in 182 various U.S. cartels. Overall, the research studied the link between
possibility of being part of a cartel and financial controls, product market competition and
several corporate governance variables. The corporate governance variables that they use in
their study are; board size, CEO shares, block ownership, % outsiders, combined CEO-
chairman, busy board and finally CEO centrality. The study found that there is direct
involvement posed by the board of directors and the CEO in the potential collusive price
fixing agreements of their firms, leading to an assumption of a significant relationship
between corporate governance and cartel formation. However, in this research the focus on
different board and CEO characteristics in addition to the one used by Gonzalez and Schmid,
also this study uses to test the hypothesis dataset contain mainly UK-based cartel firms.
Therefore, the current research is complementing the empirical finding of Gonzalez and
Schmid (2012).
In an experiment conducted by Hamaguchi et al. (2009), gender was included as an
individual or social background variable, in an experiment mostly designed to look for group
size effects on cartel dissolution, along with leniency programme characteristics. The design
of the research (which also proceeds by logistic regression), is very much alike the research
pursued here in this study. There is certainly more attention being given to individual
characteristics than ever before in the non-econometric analyses. The coefficient for gender
in the logistic regression was significantly negative in showing that women have a positive
impact on cartel dissolution (p<0.05), since “fewer men dissolved their cartels than women”
(Hamaguchi, et al. 2009). Therefore, the current research is complementing the empirical
finding of Hamaguchi, et al. (2009).
In many ways, this study is also complementing the work of Grillo (2002). Instead of focus
on competition law and how market strategies are nullified by the “straightforward co-
16
ordination on market strategies”, the focus of this research describes how multiple firms
design and practice an organisational culture in a cartel arrangement, or what Grillo calls “an
anticompetitive object”. This anti-competitive object can more easily be reproduced amongst
certain kinds of boards and with certain types of CEO – this is the conclusion of this research.
Therefore, the current research is complementing the empirical finding Grillo (2002).
1.5 Structure of the Thesis
The remainder of this thesis is organised as follows: Chapter Two discusses the definition and
formation of cartel and highlights the four main players in cartel formation. It then discusses
the theoretical framework on cartel formation. This is followed by a discussion on cartel
damages and cartel accountability (individual vs. firm). Furthermore, this chapter reviews the
factors facilitating cartel agreement and the development of policy under the three main
jurisdictions used in this study: the U.S Department of Justice, the European Commission,
and the Competition Commission /Office of Fair Trading in the UK.
Chapter Three will first look into the concept of corporate governance and the roles of the
CEO and board of directors in corporate governance. In addition, it discusses the influences
of corporate governance on market competition, and cartel formation. This followed by a
review from the literature on the relationship between cartel formation and CEOs as well as
the impact of cartel formation on shareholders. A discussion of agency theory shall be
presented in tackling the concept of corporate governance and cartel formation. It will then
identify the independent variables and justifies its utilisation in this research as proxies for
corporate governance attributes. Finally, an overview of literature on corporate governance
will be used to justify the inclusion of each independent variable and provide an
understanding as to why these attributes may be associated with the incidence of cartel
formation.
Chapter Four describes the sources of data and method of collection. It discusses how the
cartel sample was obtained, including the two screening stages used to filter the initial set of
cartel identified into a usable sample. The resulting cartel data are then compared with the
initial sample and their characteristics are described in more detail. It discusses how the
benchmark set of firms that have no known cartel participation was obtained, alongside their
characteristics.

17
Chapter Five, which deals with methodology and empirical results, provides a presentation
and discussion of the results using assembled data. It describes six boards, two ownership
structure and eight CEO variables, as well as models, which depends on three environmental
factors – the market environment, legal and regulatory environment, and internal control
environment. Cartel and non-cartel sets are matched, and the analysis of board and CEO
characteristics are being focused by cross comparison, controlling for other environmental
factors.
Chapter Six, on the other hand, provides an analysis of the results reported in Chapter Five in
an effort to address the research questions. It embodies a discussion of the findings as well as
how ownership concentration takes place in cartel formation. It also tackles compliance code
needs in cartel; and corporate anti-cartel compliance programmes.
Chapter Seven presents a summary of this research and draws conclusions and implications.
This chapter also highlights the study’s potential limitations and provides recommendations
and avenues for future research.
18
Chapter Two
Cartel
2.1 Introduction
Cartel is a phenomenon, which have been extensively researched upon to understand their
workings and their effects on society and economy. Many different kinds of theoretical
models and empirical studies have been brought after extensive economic analysis in relation
to cartel. It is found that a firm forms a cartel when it intends to purposely raise prices for the
customers and eventually harm them due to an increasing expense.
Nearly all discovered cartel are operated and formed by managers (CEO/executives) whose
motivation may not be fully aligned with those of the profit-motivated owners (shareholders).
Even though participating in cartel may benefit executives and shareholders during their
period in operation, once caught and sentenced, the effects of such behaviour can result in
high fines and reputational losses on the part of the firm and its management (Agrawal and
Mandelker, 1990). This thesis contributes to the theoretical basis by shedding some light on
the characteristics of the boards and executives of firms involved in cartel formation.
This chapter discusses the definition and formation of cartel and highlights the four main
players in cartel. Moreover, it tackles cartel accountability (individual vs. firm) and reviews
the factors facilitating cartel agreement. Finally it examines the development of policy under
the three main jurisdictions used in this study: the U.S Department of Justice, the European
Commission, and the Competition Commission/Office of Fair Trading in the UK.
2.2 Definition and Forms of Cartel
Cartel is a formal agreement between competitors that attempt to restrict competition between
them in order to increase profitability and/or maintain price. They are generally regarded as
the most serious restrictive practices, especially ‘hard core cartel’ which are generally defined
as agreements that fix prices, limit supply or output, share markets or rig bids (OECD, 2003).
Successful price fixing usually requires more than price to be controlled. For example, in the
19
Citric acid cartel which ran from 1991-1995, firms agreed on a standard price and allowed to
offer discounts to their key clients according to a market sharing agreement (Ellis and
Wilson, 2003).
In addition, cartel formation can either be on an international level (e.g., the lysine cartel
case) or on a domestic level (e.g., sugar cartel in the UK). Moreover, cartel can be public
(e.g., OPEC) which is a legal agreement supported by the government, or private which is an
illegal act viewed as violating antitrust laws in most jurisdictions. In this research, the focus
is on the private cartel, in its international and domestic levels.
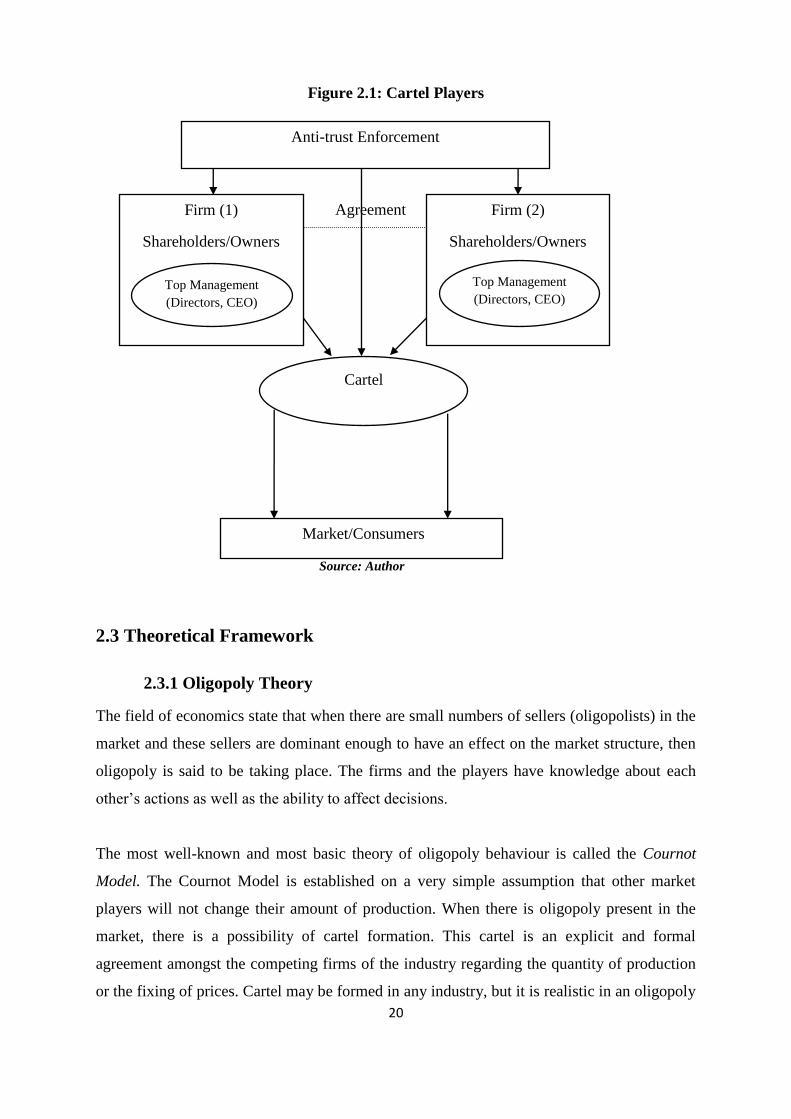
The four-tier hierarchy models below (Figure 2.1) demonstrate the cartel players: manager
(CEO, director), owner (shareholders), anti-cartel enforcement, and consumer.
1. The management of the organisation is required to enforce cartel agreements
(Spagnolo, 2005). The decision to actually form the cartel is taken by the top
management (Harrington, 2006c).
2. Shareholders and/or owners of the firms are assumed to have objectives which are
different from that of the management (Discussed in Chapter Three).
3. Anti-cartel enforcement is one of the pressures on the firms and the cartel agreement.
An anti-cartel enforcement policy is a set of legal instruments to fight cartel and to
protect fair competition in the market.
4. Market/consumers may be forced to pay a higher price for goods and services; or they
might not afford to buy these products at all; and/or they might be forced to buy the
products from abroad.
20
Figure 2.1: Cartel Players
Agreement
Source: Author
2.3 Theoretical Framework
2.3.1 Oligopoly Theory
The field of economics state that when there are small numbers of sellers (oligopolists) in the
market and these sellers are dominant enough to have an effect on the market structure, then
oligopoly is said to be taking place. The firms and the players have knowledge about each
other’s actions as well as the ability to affect decisions.
The most well-known and most basic theory of oligopoly behaviour is called the Cournot
Model. The Cournot Model is established on a very simple assumption that other market
players will not change their amount of production. When there is oligopoly present in the
market, there is a possibility of cartel formation. This cartel is an explicit and formal
agreement amongst the competing firms of the industry regarding the quantity of production
or the fixing of prices. Cartel may be formed in any industry, but it is realistic in an oligopoly
Firm (1)
Shareholders/Owners
Firm (2)
Shareholders/Owners
Market/Consumers
Top Management
(Directors, CEO)
Cartel
Top Management
(Directors, CEO)
Anti-trust Enforcement
21
due to the small number of firms and due to its being bound by many anti-trust laws (Stigler,
1968).
Several issues arise due to the small number of players present in the market for a specific
business situation. The theories and economic models cannot be developed efficiently since
the actions of these players cannot be judged. These players are always acting at their best to
carry out activities and strategies against each other in competition. Their activities may be of
many kinds which involve coming together and performing in a perfectly monopolised
market, enabling them to act as strong rivals and drive the price of the commodity towards a
very low level (Stigler, 1968).
To increase power in the market, the oligopolistic firms form a cartel. This helps them work
together as a group by stating the price that will be charged and the level of output that will
be produced. Forming such a cartel helps them carry out monopolistic activities. A horizontal
market price demand curve will be formed for firms that are in an oligopoly and sell an
undifferentiated product like Lysine. If a cartel is formed by firms and the output and price
are fixed, then the demand curve would then be downward sloping like that of a monopolist.
The monopolist and the cartel usually have the same goal of profit maximisation. The output
level determined by the cartel members is based on the level where the combined marginal
cost is equal to the combined marginal revenue. The output level defined by the cartel helps
maintain a market demand curve that identifies the cartel price. The cartel as well as the
monopolists always chooses to maintain a perfectly competitive market where there is less
output and high price level.
Forming a cartel presents itself with a certain set of rules that need to be efficiently enforced
by the members. The members may not want to remain a part of the cartel and pursue their
own interests since they could increase their levels of output and prices for profit
maximisation. They could sell at a high monopoly price compared to the rest of the cartel
members. If a small firm is part of the cartel and is contributing less towards the market
output, then the price it manages is high and has the ability to provide full capacity
production for profit maximisation. The cartel may always be at risk, but the firms enjoy the
large profits they are able to attain (Stigler, 1968).
22
The classic framework put forward by Stigler (1968) states that for a cartel agreement to be
formed and sustained, firms need to recognise their mutual interdependence. Moreover, they
must see an incentive to cooperate, maintain the agreement, and avoid cheating, e.g., through
some punishment mechanism.
Due to market conditions, the prices do not fluctuate for a small number of firms and they
might be inclined to cheat in their cartel agreements. These firms are required to remain
within the prices that have been set and sell the same product to the buyers.
The distribution of profits is also decided upon by all members which are part of the cartel.
One method that could be used is to pool in all profits with the cartel managers and then
receives equal dividends from this pool. Such an activity is usually observed by professional
sporting leagues since they can share the revenues. The market allocation would be able to
help decide on the distribution of profits for the cartel members. The members may receive
shares as the market has been allocated to the cartel members in some specific way
(Samuelson and Nordhaus, 2006).
2.3.2 Game Theory
Game theory tries to predict how people behave in strategic situations. In other words, game
theory analyses the way that two or more players choose strategies that jointly affect each
other (Brickley and Zimmerman, 2000).
Dixit and Nalebuff (1993), on “Thinking Strategically:” Game theory means rigorous
strategic thinking. It’s the art of anticipating your opponent’s next moves, knowing full well
that your rival is trying to do the same thing to you”.
A basic game theory that shows the problems involved is the Prisoners’ Dilemma, which
assumes that the prisoner’s dilemma is an imaginary position where two individuals are
caught and are charged of carrying out a crime. The two prisoners are kept separately, and
tries are made to encourage each one of them to implicate the other. In the event that neither
of them does confess, each will be set free. This is called the co-operative strategy, which is
available for both prisoners. To be able to induce one or both to confess, each one is informed
23
that a confession implication or a small incentive reward may result to her or his discharge. In
case both admit, both will be jailed. Yet, if one of them implicated the other and not the
opposite, then the implicated one will get a tougher sentence compared to each one of them
implicating the other.
Several strategies used in game theory:
1. Dominant strategy: In considering possible strategies, the simplest case is that of a
dominant strategy. This situation arises when one player has a single best strategy
regardless of the strategy the other player follows.
2. Nash equilibrium (non-cooperative): Each firm considers whether to charge its high
price or to raise its price toward the monopoly price and try to earn monopoly profit.
The firms can raise their price in the hopes of earning monopoly profits. It is also
sometimes called the non-cooperative equilibrium because each party chooses the
strategy which is best for itself with no collusion or co-operation and without
considering the welfare of the society or any other party.
2.4 Factors that Facilitate and Limit Collusion
Two constraints have been defined in theory for a cartel to operate successfully (Mott, 2007).
First, the firms should be able to fulfil the “participation constraint” requirement. Second, the
“incentive compatibility constraint” should be satisfied to ensure that the cartel is operating
successfully. Once the “incentive constraint” is fulfilled, the “participation constraint” is
fulfilled automatically. Violating the “incentive constraint” leads to the deterrence of the
cartel, independent of the “participation constraint” (Buccirossi and Spagnolo 2006, 2007).
Thorough monitoring has been carried out by cartelists to ensure that the firms are not selling
large quantities at the raised price since this would be unfair. If such behaviour is found, the
firms would be penalised, and this punishment can aid in managing stability in the collusive
arrangements. To sustain the formation of a cartel, two constraints need to be satisfied along
with several factors that may help with its stability (Ellis and Wilson. 2003). Several market
characteristics that contribute to cartel stability are discussed below:
1. Presence of Entry Barriers: If barriers to entry are kept low, then reaching
agreements may be difficult for the industry. If any kind of competitive strategy is
24
being set, the low barrier to entry would attract new players to enter with their short
term hit-and-run strategy. This would highly affect the competitive strategy of the
players. The collusion sustainability may also be affected since the risk of future entry
reduces retaliation issues. If entry occurs, the firms may have a less portion of
profitability to lose. The firms may resort to deviation but the future entry prospects
may not affect their short-term benefits. However, the costs associated with future
deviation may be reduced since the profits would also tend to diminish.
If any new entries take place, profits diminish as a result regardless of how much the
organisations may try to build strategies against them. The retaliation occurring
against the deviating firm is also less significant if there is entry in the industry. There
will be undercut of the collusive prices and the collusion process also declines.
An entry barrier has been defined as that aspect which reduces the threat of entry and
allows the incumbent firms to reap profits above the normal levels (Bain, 1954).
Large scale economies may be considered a barrier to entry if only the incumbents
remain at the level of production and the new entrants believe that this level of
production is efficient and will remain throughout to help maximise profit levels. If
the incumbents start to believe that maintaining a lower level of production would
help in increasing profits with a large-scale occurrence of entry, then the future
entrants would also not keep their previous levels of output.
The opinion brought forward by Bain is rejected by Stigler (1968) since the latter
believes that scale economies cannot be considered a barrier to entry. The researcher
clearly stated that the costs which are borne by new players are the basic barriers to
entry and these costs are not borne by those members which are already present in the
industry. He states that the new entrants as well as the incumbents have the benefit of
scale economies if the output is expanded. Hence, his definition does not state that
scale economies are a barrier to entry and the two researchers have different opinions
regarding this aspect. The antitrust lawyers and the economists have been posed with
difficulty due to the conflicting definitions presented by the researchers regarding
entry barriers.
25
Cigarettes and steel are a part of a collusive oligopolistic industry used by Bain (1949)
to state his empirical evidence. To maintain short term profits, the price levels of the
commodities have been kept at lower levels which would act as deterrence for entry
and a limit price model. This limit price is the highest price which has been set by the
incumbent firm to make sure that at least one other firm is able to enter the market.
Before carrying out this activity, the incumbents make sure that they are clear about
the competition levels that they would face along with the market share, which they
would lose to the new entrant. The profits that have been estimated beforehand are
compared to this limit pricing and not compared to the short-run profit maximising
price, which could be set. The short-run prices which the incumbent firms want to set
may be low since they want to reap the small profits all for themselves and maximise
their levels of industry profit to keep the entry barriers high in order to discourage
entry (Bain, 1949).
The limit pricing would help the firms manage long term profitability by letting go of
the short term profits and for this purpose, Bain (1950) aimed to search for
appropriate market conditions. One of the vital elements that were found was freedom
of entry since if new players were to enter the market conveniently, and then the
incumbents would not be able to reap short-term benefits easily. Three factors that
may restrict entry freedom have been identified. First, patents may be used for
production processes or the required resources be controlled. Second, production costs
may be low for the incumbents as compared to the new entrants. Lastly, the
economies of scale and the optimum firm scale may be large as compared to the
market.
Barrier to entry has been defined as a that aspect which allows present firms to
establish pricing above marginal costs, having monopoly in the market and making
the entry of new players unprofitable (Ferguson, 1974). This marginal cost pricing
does not allow long-term profits for incumbents since they would only be able to
achieve them if prices were above-average cost, which usually does not happen due to
competition. At the same time, Fisher (1979) states that if incumbent firm profitability
is high, then entering the market would be difficult. The potential entrants may weigh
the benefits of the society and the industry before entering the market. Von

26
Weizsacker (1980) highlights those costs as barriers to entry, which are borne by the
new player in the market. This may cause a kind of distortion in the resource
allocation of the society.
Entry barriers are usually formed to avoid new players to enter into the market and
reduce competition levels (Gruca and Sudharshan, 1995). These barriers may arise
due to industry characteristics and may require new entrants to bear certain costs in
the form of expenses to compete efficiently (Kerin et al., 1992). The incumbents are
found to have many advantages, such as high level profitability (Yip, 1982) as
compared to the new entrants due to these barriers (Nicholls, 1951; Porter, 1980a).
With the presence of these barriers, competition is likely to remain away from the
market (Shepherd, 1979) along with creating a spill-over effect. This effect takes
place when a firm enters the market without a low price and brand loyalty and the
incumbent firm reaps the advantages since it already has these aspects (Karakaya and
Stahl, 2009).
2. Number of firms: Cartel behaviour is more likely to sustain in industries where there
are a few number of firms. The smaller the number of firms in the industry, the easier
to manage and detect the behaviour of each other. Firms will get a better share of
profits in a concentrated market when prices become higher, and the deviator’s short-
term profit is actually smaller as it started through a larger market share. Hence, the
more concentrated the market, the larger are the gains from collusion and the smaller
is the cost of co-operation (Bain, 1951; Stigler, 1964). A study conduct by Tirole
(1988) finds that the smaller the number of market participants, the more the
likelihood of collusion.
3. Quality differences/product differentiation: Forming a cartel also depends upon the
type of products available, which may be homogeneous or differentiated. The
existence of similar products - in case trust participants report a market share
reduction - is justified through a quantity rise or a price reduced by firm cheating.
Empirical studies have provided mixed results on product differentiation. Some
studies state that in order to promote differentiation in the economy, many
27
organisations find it difficult to engage in collusion (Hay and Kelley 1974; Fraas and
Greer, 1977); others find the opposite (Dick, 1996).
Raith (1996) finds that corporations at times cannot observe the efficient activities of
their competitors and in these cases, it is better that they focus on the set of demands
present in the market and work towards horizontal product differentiation. If the
product is unique in the market, it is possible that the competition between firms
become stronger. In this way, the deviations being brought forward may become
difficult to detect and the deceiving process would be difficult to sustain.
4. Seller concentration: In general, established oligopoly theory is based on static
equilibrium concepts and expects that a high degree of seller concentration in
homogeneous product markets lowers the cost of managing common activities and
therefore favours cartelisation.
Similarly, some find that high seller and capital concentration facilitates collusion, but
others find little or no impact of these determinants (Dick and Hay, 1996). Critical
analysis states that there is bias present in the study relating to these aspects and that
the focus is only on the most elaborate cartel formations. Dick (1996b) finds that in
comparison with other export-oriented industries, the cartel formed by the American
Webb-Pomerene kept the low seller concentration target and sold capital-intensive,
non-durable and standardised products. They required growth in export industries,
especially where the US industries had large market share. Jacquemin et al. (1981)
studied 545 Japanese export cartel in forty sectors between 1960 and 1970. The four-
firm concentration average ratio in these industries was 59.5 percent compared to a
62.7 percent average for all of Japanese manufacturing firms. However, collusion
occurs in both very concentrated and very un-concentrated industries.
5. Capacity constraint and excess capacity: The part that capacity constraints play on
sustaining cartel is unclear. On one hand, a capacity-constrained firm has less to
expand from undercutting its rivals as it is able to accommodate only a fraction of the
extra-demand this would generate. On the other hand, capacity constraints limit firms’
28
disciplinary power. This is because the strongest penalty that firms can expect is to
produce at full.
A study by Brock and Scheinkman (1985) gives a great example of this unclear effect.
Throughout a symmetric environment in which all of the firms within the market have
the identical capacity constraint, the authors demonstrate that a non-monotonic
relationship exists amongst cartel durability as well as the volume of the total capacity
kept by every firm. Whenever the market capacity is sufficiently small, the actual
change restraint effect of capacity restrictions controls, indicating that including
additional capacity can make collusion tougher to continue. When market’s total
capacity is sufficiently large however, the penalty decreasing the impact of capacity
constraints controls.
The punishment-reducing effect of the capacity constraint dominates its position when
the capacity of the industry is large. In order to sustain the collusion, it is essential that
the firms increase their capacity levels. If a firm has the ability to sell a variety of
products, then the process of collusion becomes hard. The reason being that the profit
generated from all these products is high and the market share is also higher than what
it would be if the firm were in a monopolist position. A variety of products enables
benefits to be reaped from deviation greater than the opportunity cost of the
punishment (Symeonidis, 2002).
The cartel’s sustainability has been viewed in terms of the asymmetries which are
present in capacity and its constraints. The aggregate capacity, along with the
asymmetry impact, has been viewed as a combined effect. Studies carried out by
Compte (1998) and Brock and Scheinkman (1985) both indicate that when the
capacity of production is large, collusion is favoured by the firm and if the production
levels are low, then the asymmetric capacity hinders collusion. The literature present
on this aspect is vague; however, many theories promote the use of excess capacity to
support collusion.
6. Buyer power: An additional essential factor for cartel formation is the number of
buyers in the market. Whenever firms set a price in secret, changes from cartel pricing
29
are much easier to identify if there are several small buyers compared to only a few
large buyers:. Increasing the number of consumers increases the possibility that those
last may communicate price reductions to competitors. Therefore, with a large
number of customers, it is tougher to do secret price cut.
Snyder (1996) argues that the impact of occurrence of interaction upon the firms’
capability to collude may be particularly vital in the presence of large buyers. This is
because large buyers can strategically concentrate their orders across time in order to
make firms’ relations less frequent and consequently make collusion harder to sustain.
7. Elasticity of demand: The actual profits from fixing higher prices will certainly
become higher the greater inelastic the market demand is. This is mainly due to the
fact that the contraction in output essential to obtain the greater collusive price will be
less; also the gains accordingly will be higher. Despite the fact that a low market
elasticity of demand raises the probability of a cartel, it does not mean that a high
elasticity of market demand indicates that cartelisation will not occur. This market
elasticity is pre-cartel elasticity, presuming that the firms would not have substantial
market power. Once elasticity during cartel is used, high elasticity may be consistent
with the persistence and existence of a cartel since it has managed to increase prices
closed to the cartel price; that is, high elasticity might be a proof of successful cartel
(Snyder, 1996).
8. Static or declining demand: A cartel is less likely to form when demand is growing
considerably because of the problems of disentangling those sales due to greater
demand from those included by firm undercutting the cartel price.
Game theoretic models challenge the traditional view. When analysing the market, it
is found that the trend in demand is cyclical and this assumption is considered a more
realistic model (Haltiwanger and Harrington, 1991). When the demand for a product
is high, it becomes easier for firms to conspire since the cost of punishment is low and
the short-term gains are at high levels. The demand levels which are persistent and
stochastic have also been researched. It is believed that collusion takes place if the
period of boom is to last for a long period (Bagwell and Staiger, 1997). Within a
30
decline phase, if transitory shocks take place, it becomes very difficult to sustain
collusion. When capacity constraint is present, the collusive prices change according
to changes in the demand conditions. A collusive agreement may also destabilise if
there are long periods of low demand (Staiger and Wolak, 1992).
2.5 Effects of Cartel Imposition
Distribution and supply agreements are part of the vertical agreements which have the ability
to affect the welfare and competition in a positive manner. Firms form agreements which are
to fix the prices or raise them to undermine the competition and carve the market or allocate
market shares. Through this process, the customers are harmed and the firms which are part
of the cartel have considerable advantage. Hence, the formation of cartel is prohibited in the
competition law and referred to as hard-core violations. This law believes that such cartel
reduce the levels of efficiency within firms providing them with an unfair advantage. Any
negative aspects which are present against the competitors are suppressed within the internal
workings of the firm. Competition is removed from the market which distorts the entire
buying and selling process along with attributing pressure on the buying power of the
consumers. Extra costs are applied, which are borne by the consumers along with the
suppliers and the non-participating competitors. The fixing of prices at a high level or
preventing the price erosion process makes the customers of the product suffer in terms of
purchase prices. The firms which are part of the cartel may carry out the following activities
which affect the customers.
Customers, suppliers, non-participating competitors and the final consumers are the ones who
are highly affected by the imposition of cartel. When the purchase is made of the commodity,
the effect of the cartel is felt by the consumer directly while other effects may be felt at a later
point in time. Lost profits, interest and actual losses are direct effects caused by cartel.
Market inefficiencies and several other structural effects may be included in the indirect
effects (Van and Verboven, 2010)
31
2.5.1 Direct Effects
Actual Loss (Overcharge)
Several losses are incurred when the competition law is violated and the overcharge concept
is used to estimate these losses. The customers are affected by several kinds of dimensions
and this overcharge is only a part of the entire cartel agreement which constitutes the lower
end of the losses. Overcharge has been regarded as that difference which exists between the
hypothetical price that would prevail in the market and the actual market price incurred
during the cartel agreement. The loss incurred by a single firm is referred to as the price
overcharge and is multiplied by the product quantity purchased during that specific period to
attain the price effects during the cartel. It has been observed as a fact in the case law that
overcharge is usually at the expense of the rest of the market participants and arise due to
hard-core cartel performed by the firms.
Loss of Profit
Restricting the output quantity is one of the activities of the firm’s engagement in the cartel,
which is why purchasers are subjected to additional damages. If competition is high,
customers would be provided with large supplies of the commodity, which does not happen
in this situation. Hence, the purchasers’ profit is the amount he would save if the purchase
was made at a non-cartelised price. The ECJ Manfredi judgment states that the damage head
that takes into account the total exclusion of the loss of profit consists of the compensation
which should not be accepted. Within the context of commercial or economic litigation, if the
EU law is breached, the total exclusion of the loss of profit would not be able to repair the
damages which have been caused [Cases C-295/04 to C-298/04, para 96].
Interest (Opportunity Cost)
The interest that has been accumulated on the value of the loss is able to account for the
damages that have been cause by cartel formation in the market. This interest may also be
referred to as the opportunity cost or the chance that is forgone to invest. The ECJ Manfredi
judgment [Cases C-295/04 to C-298/04, para 97] states that the damage caused and the
compensation of the loss should not leave out factors such as time effluxion since it could
also reduce the value. The award of interest should be regarded as an essential component of
compensation according to the national rules that are applicable. With the help of this rule, it
is possible to provide the sufferers with the real value of the loss. The EU law also requires
32
that the amount of interest should be paid from the time the damage occurred till it was
actually paid off in full. According to the Marshall case, the amount of interest must be
adequate in keeping with the loss that has been incurred. If there is any breach in the EU law,
the payment should be made according to the national rule thus prescribed, which should be
made in full [Case C 271/91, para 26]. A German Act has also been presented on the
Restraint of Competition which states that on the day the damage takes place, the infringer is
required to pay five percent above the base rate per year of the interest as an obligation for
the damage that has been caused (ACCC Cartels, 2009).
2.5.2 Indirect Cartel Effects
X-Inefficiency
The difference between the minimum and actual attainable average production costs is a gap
which is referred to as the ‘X-Inefficiency’. Since there is less competitive pressure, the cartel
firms maintain high levels of production costs keeping inefficient players in the market. The
R&D activities are reduced along with the improvement of technology. Hence, product
diversity and improvement of product quality suffers; however, a high price is still charged in
the market.
Long-Term Structural Effects on the Market
Many competitors are forced to leave the market due to cartel formation since there is
predatory pricing, common battle funds, increased costs of rivals, and several other damaging
activities by the members. Common standards that have been set also create a barrier for new
entrants. Hence, it is found that cartel have a long lasting effect in the form of increased
prices and profits on the market and competition levels even after termination. The damage is
also continued after it has been thoroughly analysed and fined for the activities performed.
2.6 Who is Accountable? Individual vs. Firm
Preferences and incentives are the two things that drive the decisions people make in an
organisation. When an organisation is found to misbehave, it is usually said that it is not the
organisation but the people who are part of it who should be held accountable. The people
33
who are part of the organisation have formed a relationship with the firm, which is based on
contractual arrangements (Buccirossi and Spagnolo, 2007).
Individual accountability is an important concept to be introduced to apply social control in a
society. Individual accountability is described as “each individual is held responsibility for
his/her own behaviours and actions” (Wells et al., 2011). They are required to provide an
account of the behaviour or conduct that has been carried out and receive sanctions for this
behaviour in order to progress further (Gereffi, 2011). This kind of accountability may be
expected from either an individual or a corporation. It is not only limited to the actions of
individuals. Corporations may be responsible for a criminal activity which requires policy
regulations; it is also necessary to understand that not only may the corporations be held
accountable for their actions but also individuals working within these corporations.
According to Wells et al. (2011), the corporations are usually subjected to antitrust
prosecution, since it is believed that they have the ability to pay the fines. On one hand, these
penalties and fines are intended to motivate organisations to control the behaviour of
management. An organisation is vast with large numbers of personnel, so it can be difficult to
find which individual should be held responsible for the inappropriate action (Becker, 1968;
Elzinga and Breit, 1986; Posner, 1976; Landes, 1983; Posner, 1980). On the other hand,
several arguments state that the punishment for individuals is easier to implement and owing
to their knowledge of this, they are inclined to act correctly. If an individual in an
organisation is being punished, it harms the reputation of the corporation since the incident
would be publicly highlighted and the employee may also engage in whistle-blowing. If an
individual is held responsible for his actions in an organisation, he would be inclined to
discourage activities like price-fixing since it could harm his reputation and job security
(Calkins, 1997; Evans and Hughes, 2003). The individual could also be subjected to penalties
alone and held responsible for this action. Any third party involved would also be subject -
whether an individual or a corporation - to penalties or fines.
Several cases have been observed where the corporation cannot be separated from the actions
of the individual. In one hand, if an individual is being punished, he is found to protect his
assets by combining them with the corporation. On the other hand, if the corporation is being
punished, the individuals would want to save themselves by withdrawing their assets from the
34
organisation. If both the parties are being punished, it is possible that inefficient transfer of
assets would take place. Hence, the two parties are more inclined to carry out behaviour that
is consistent with the antitrust laws present in society (Calkins, 1997; Stephan, 2008b).
A research study by the Centre for Competition Policy is also presented, where it states that
there are several reasons why corporate fines alone are not able to provide efficient
deterrence of such activity. At first, fines are limited and they cannot be applied in a
disproportionate manner. Secondly, it is the individuals who carry out such decisions in the
organisation. Lastly, it is not the organisation that makes the individual to carry out such
activities as price-fixing (Stephan, 2008a).
Furthermore, since individuals work as agents on behalf of the firm, it will make sense to
prevent these individuals directly by frightening them through sanctions, also to enforce this
kind of sanctions once they violate the law. Due to the fact that corporate fines rarely achieve
a level that would likely increase their deterrent effects, they do not give enough incentives
for the firm to effectively control and monitor its agents to prevent them from engaging in
illegal activities and from placing the firm at the risk of getting fined for engaging in an illicit
cartel. Besides, it is doubtful if a firm would at all times have the means to control and
monitor its agents and prevent them from illegal behaviour (OECD, 2004).
If an individual believes that the organisation will be held responsible and be punished for
their actions, this does not ensure that he or she would avoid such activities. The Competition
Authority goes through a long process of imposing fines on organisations and during this
time, the responsible individuals may have switched jobs or even retired. The stockholders
who may have profited considerably from the cartel formation would also have sold their
shares before being subjected to fines. When corporate fines are finally imposed on the
organisation, it is the current employees and stakeholders that will suffer, not the ones who
have left (Stephan, 2008b).
35
2.7 Anti-Cartel Enforcement Policies
The presence or absence of antitrust policy and the efficiency of their enforcement in a
country impact the decisions of firms to collude or not. It also influences the level to which
the market price can be increased if firms decide to form a cartel. Scholars have undertaken
empirical studies of antitrust enforcement in the United States, United Kingdom and other
countries around the world. Several measures of enforcement effort and performance
provided by the Divisions have been applied. The literature review identified five key
elements of an effective legal regime (OFT, 2009):
1. Fines (against firms)
2. Penalties (administrative and criminal) against individuals
3. Amnesty/leniency
4. Settlement
5. Private damages actions
This section discusses the anti-cartel policy development in the three main jurisdictions used
in this research: the U.S. Department of Justice (DoJ), the European Commission (EC), and
Competition Commission/Office of Fair Trading in the UK (CC/OFT).
2.7.1 The U.S approach (Department of Justice)
The Sherman Antitrust Act of 1890 (Gallo, et al., 1994), which was the beginning of the U.S
legislation to manage cartel, was the pioneer in recognising price-fixing contracts as criminal
actions which were liable to economic as well as disciplinary sanctions. It officially declared
the conspiratorial contracts shaped by rivals to restrict competition as illegal, stating that:
‘[E]ach contract arrangement in the shape of conviction or else scheming, in limitation of
business and trade...is to be illegal’.
Subsequently, the Clayton Act of 1914 stretched the US anti-cartel policy and identified the
different types of behaviour to be regarded as illegal restraints of trade, including the most
harmful type of cartel behaviour (Harding and Joshua, 2003).
§ 4 of the U.S Clayton Act, 1914:
36
‘[A]ny person who shall be injured in his business or property by reason of anything
forbidden in the antitrust laws […] shall recover threefold the damage by him sustained, and
the cost of suit, including a reasonable attorney’s fee.'’
The Federal Trade Commission (FTC) was set up under the Clayton Act and its Bureau of
Competition became the main federal body investigating and initiating proceedings against
firms involved in unfair parasites. Eventually, the FTC began to share enforcement of
antitrust laws with the Antitrust Division of the US Department of Justice (DoJ). The DoJ is
empowered to file criminal cases against cartelists and from the late 1970s; it gradually
adopted an increasingly tough policy toward cartel.
Firm sanctions
Heavier sentencing was encouraged by the publication of sentencing guidelines in 1977 and
revised guidelines in 2004 and 2007. Maximum corporate fines have been increased several
times since 1974. Recognising the rising threat to U.S. businesses and consumers caused by
cartel, in June 2004, Congress significantly raised the maximum punishment for criminal
Sherman Act infringement increasing the statutory maximum corporate fine to $100 million
(Hammond, 20005a).
Gallo and Goshal (1996) show in their study that every time the statutory limit was raised in
the years 1974, 1985, and 1990, real average corporate fines afterwards increased many
times. The statutory maximum corporate fine was raised from $1 million to $10 million in
1990 and to $100 million in 2004 (Connor, 2008).
Individual sanctions
The legislative maximum prison time was unaffected for three decades, but individual fine
levels were increased several times between 1974 and 2004. The maximum individual fine
for illicit Sherman Act violations was increased to $250,000 in 1984, through a combination
of the Omnibus Crime Control of 1984 and the Criminal Fines Enforcement Act of 1984.
In 1990, the Sherman Act was modified to raise the individual fine to $350,000, and in 2004
increased the statutory maximum individual fine again to $1 million, and the maximum jail
term to 10 years (Hammond, 2005b).
37
Amnesty programme
In 1978, the US Department of Justice Antitrust Division set up an amnesty programme
according to which corporations or individuals could confess their involvement in illegal acts
and could aid the department in investigation of those acts. This programme was quite lenient
in its operations and led to the reporting of one case per year. This was amended in 1993 and
is currently in action and doing quite well in enforcing actions against major cartel.
According to this programme, a corporation could confess its part in illegal activities and
could cooperate with the Antitrust Division in carrying out investigations of such cases. This
amendment has led to an increase in the number of applications to 20 per year and the
conviction of 30 defendants with the collection of over $1 billion in fines within the last two
years. It was found that more than 90% of the convictions in antitrust cases resulted from
plea-bargaining. The structure of the programme made amnesty automatic if no ongoing
investigation was made before the application.
There is also a possibility of amnesty for those individuals who assisted the department in
carrying out the investigation even if they came forward after the start of enquiries. Further,
there is a possibility of a negotiated settlement at any stage of the investigation. In 1994, the
programme was again amended to provoke individuals involved in antitrust violations to
report to the Antitrust Division. Noteworthy immunity affects the data collected on sentences
in this study. Therefore, the penalties seen are less than otherwise because of the existence of
such policy.
Settlement
Settlement and plea bargaining are methods used to help enforcement and reduce costs.
Under the US regime, 90% of the antitrust cases are settled. A study by Lande and Davis
(2007) reports that private cartel settlements is $8.2 to 9.6 billion since 1990 for both
domestic and international hard-core cartel in the U.S.
Private damages
For nearly a century, private enforcement of the antitrust laws through damages actions has
played a key part in the development of US antitrust law. Under section 4 of the Clayton Act,
38
15 USC. § 5, injured partied can bring lawsuits against infringers and receive three times the
amount of damage actually caused as a result of the anticompetitive behaviour.
Literature on penalty regime of the Department of Justice
Next section discusses a number of studies to show the changes in the sanctions level over the
years for both corporate and individual under the US Department of Justice (DoJ).
A study by Connor (2008) evaluates the effectiveness of the antitrust law of the U.S. to detect
and deter cartel during the period 1990 to 2007. Connor shows that the number of cartel cases
filed by the antitrust fell by 49%. The number of firms charged annually decreased
continuously during 1995 to 2007. Yet, the penalties imposed by the Division on convicted
firms have increased. The total amount of cartel fines imposed is $4.2 billion. At the same
time, the amount imposed for private damages is roughly four times as large. In addition, it
shows that the Division places great attention on the prevention of cartel by imposing high
prison sentence for convicted cartel managers.
Table 2.1 below demonstrate the average fine from 1990 to 2007. There is a solid rising trend
in corporate penalties, which in the early 1990s was an average of $28 million per year .
From 1993 onwards the mean of the annual penalties has surpassed $300 million. Corporate
penalties have averaged $560 million per annum in the period 2005-2007 - and between 1990
and 2007; corporate penalties per enterprise have also risen. It can be calculated that during
the 1990s, the mean corporate penalties were increased 26 times, then experienced a decrease
during George W. Bush’s first term and finally, continued on its path of escalation during the
four years of Bush’s second term. This is supported by data that provide statistical evidence
for the four sub-periods throughout which the mean corporate fine grew from $0.5 to $12.9,
$10.2, and $36.8 million accordingly, and the average mean corporate fine from 1990 to 2007
is $7.5 (Connor, 2010).
Table 2.1 illustrates that the number of persons indicted for breach of the policy was at its
highest, 59, in the first half of the 1990s and in the succeeding years 1995-2006, it averaged
39 per annum. In the first 64 years of the Sherman Act, only 21 individuals were incarcerated
for price-fixing (Posner 1970: 389-391). This movement can be partly attributed to the
change in the Division prosecutions from the secretive contracts of schemes, which included
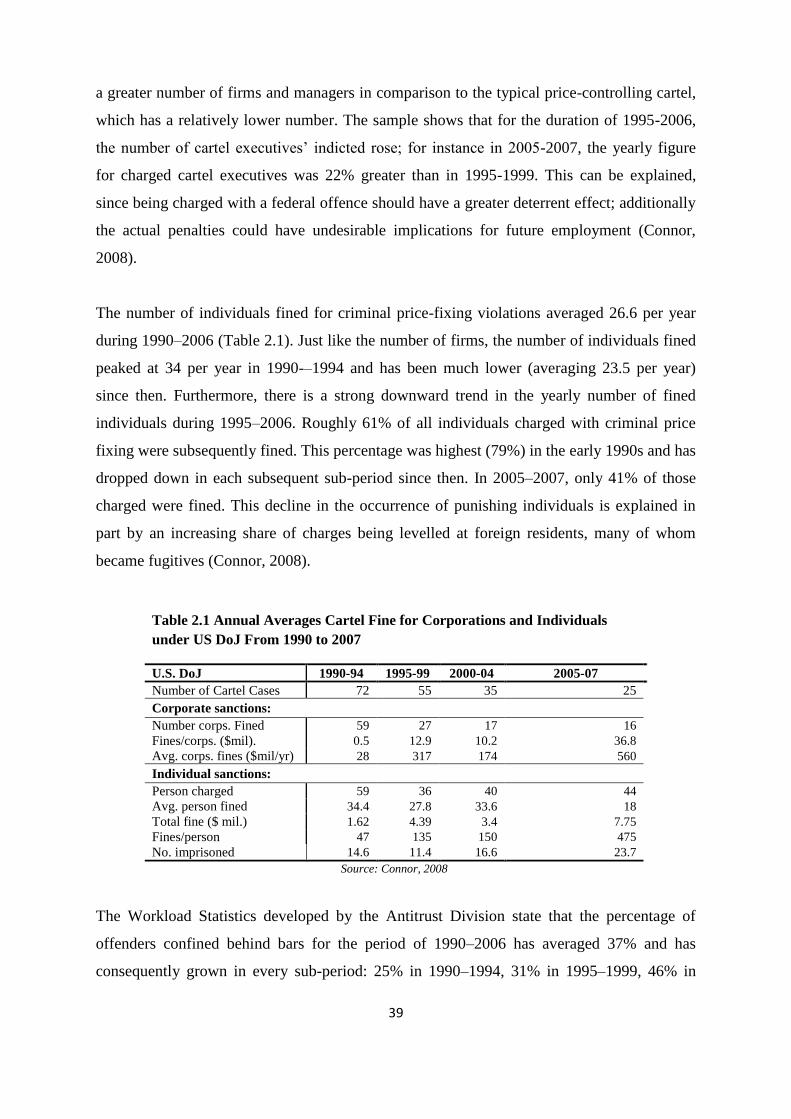
39
a greater number of firms and managers in comparison to the typical price-controlling cartel,
which has a relatively lower number. The sample shows that for the duration of 1995-2006,
the number of cartel executives’ indicted rose; for instance in 2005-2007, the yearly figure
for charged cartel executives was 22% greater than in 1995-1999. This can be explained,
since being charged with a federal offence should have a greater deterrent effect; additionally
the actual penalties could have undesirable implications for future employment (Connor,
2008).
The number of individuals fined for criminal price-fixing violations averaged 26.6 per year
during 1990–2006 (Table 2.1). Just like the number of firms, the number of individuals fined
peaked at 34 per year in 1990-–1994 and has been much lower (averaging 23.5 per year)
since then. Furthermore, there is a strong downward trend in the yearly number of fined
individuals during 1995–2006. Roughly 61% of all individuals charged with criminal price
fixing were subsequently fined. This percentage was highest (79%) in the early 1990s and has
dropped down in each subsequent sub-period since then. In 2005–2007, only 41% of those
charged were fined. This decline in the occurrence of punishing individuals is explained in
part by an increasing share of charges being levelled at foreign residents, many of whom
became fugitives (Connor, 2008).
Table 2.1 Annual Averages Cartel Fine for Corporations and Individuals
under US DoJ From 1990 to 2007
U.S. DoJ 1990-94 1995-99 2000-04 2005-07
Number of Cartel Cases 72 55 35 25
Corporate sanctions: Number corps. Fined 59 27 17 16
Fines/corps. ($mil). 0.5 12.9 10.2 36.8
Avg. corps. fines ($mil/yr) 28 317 174 560
Individual sanctions: Person charged 59 36 40 44
Avg. person fined 34.4 27.8 33.6 18
Total fine ($ mil.) 1.62 4.39 3.4 7.75
Fines/person 47 135 150 475
No. imprisoned 14.6 11.4 16.6 23.7
Source: Connor, 2008
The Workload Statistics developed by the Antitrust Division state that the percentage of
offenders confined behind bars for the period of 1990–2006 has averaged 37% and has
consequently grown in every sub-period: 25% in 1990–1994, 31% in 1995–1999, 46% in
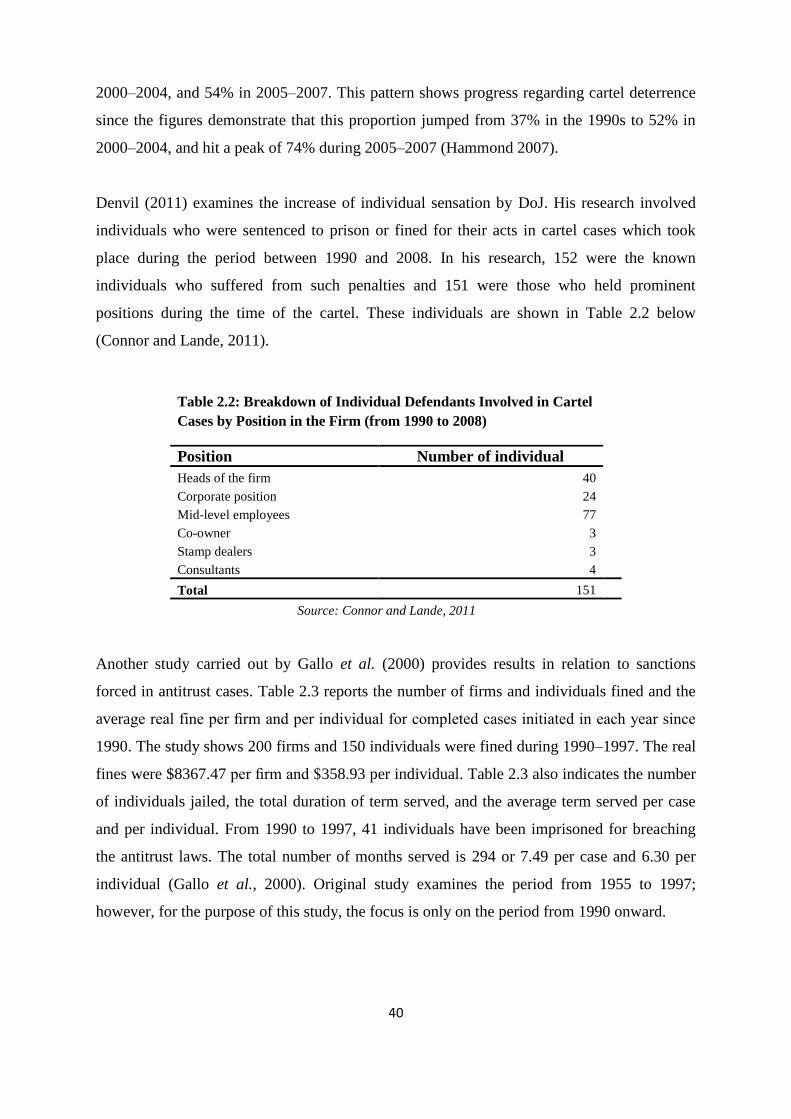
40
2000–2004, and 54% in 2005–2007. This pattern shows progress regarding cartel deterrence
since the figures demonstrate that this proportion jumped from 37% in the 1990s to 52% in
2000–2004, and hit a peak of 74% during 2005–2007 (Hammond 2007).
Denvil (2011) examines the increase of individual sensation by DoJ. His research involved
individuals who were sentenced to prison or fined for their acts in cartel cases which took
place during the period between 1990 and 2008. In his research, 152 were the known
individuals who suffered from such penalties and 151 were those who held prominent
positions during the time of the cartel. These individuals are shown in Table 2.2 below
(Connor and Lande, 2011).
Table 2.2: Breakdown of Individual Defendants Involved in Cartel
Cases by Position in the Firm (from 1990 to 2008)
Position Number of individual
Heads of the firm 40
Corporate position 24
Mid-level employees 77
Co-owner 3
Stamp dealers 3
Consultants 4
Total 151
Source: Connor and Lande, 2011
Another study carried out by Gallo et al. (2000) provides results in relation to sanctions
forced in antitrust cases. Table 2.3 reports the number of firms and individuals fined and the
average real fine per firm and per individual for completed cases initiated in each year since
1990. The study shows 200 firms and 150 individuals were fined during 1990–1997. The real
fines were $8367.47 per firm and $358.93 per individual. Table 2.3 also indicates the number
of individuals jailed, the total duration of term served, and the average term served per case
and per individual. From 1990 to 1997, 41 individuals have been imprisoned for breaching
the antitrust laws. The total number of months served is 294 or 7.49 per case and 6.30 per
individual (Gallo et al., 2000). Original study examines the period from 1955 to 1997;
however, for the purpose of this study, the focus is only on the period from 1990 onward.
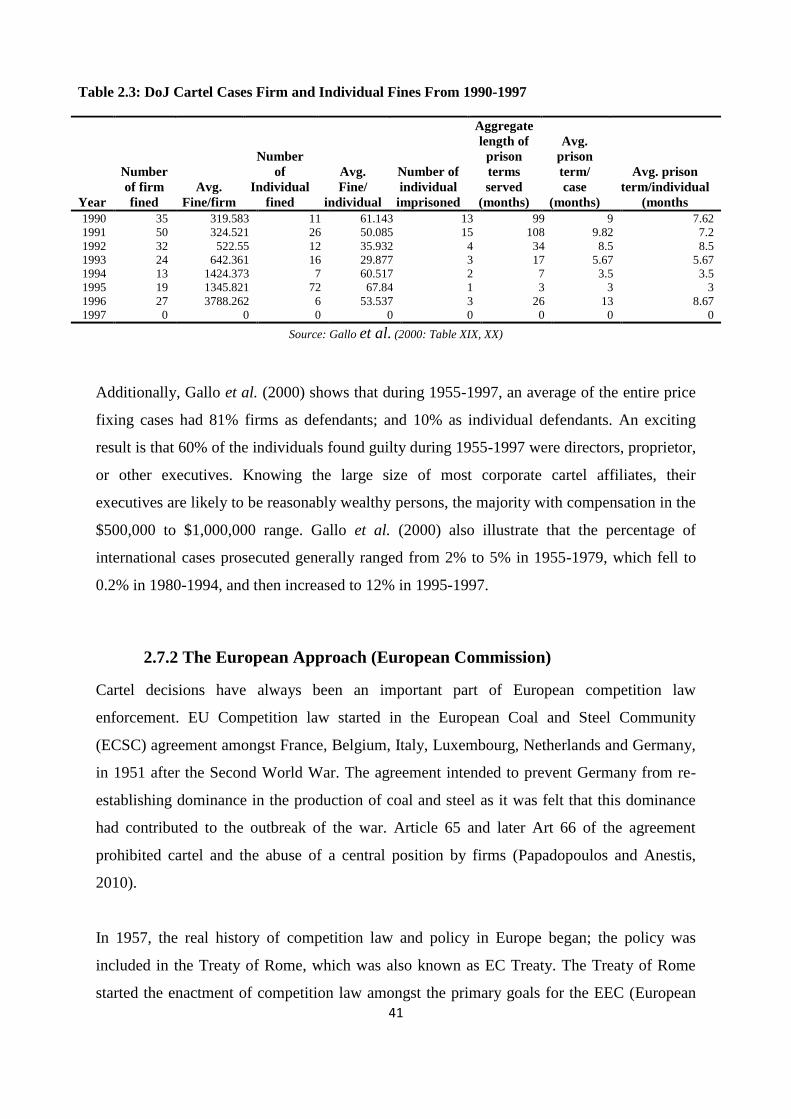
41
Table 2.3: DoJ Cartel Cases Firm and Individual Fines From 1990-1997
Year
Number
of firm
fined
Avg.
Fine/firm
Number
of
Individual
fined
Avg.
Fine/
individual
Number of
individual
imprisoned
Aggregate
length of
prison
terms
served
(months)
Avg.
prison
term/
case
(months)
Avg. prison
term/individual
(months
1990 35 319.583 11 61.143 13 99 9 7.62
1991 50 324.521 26 50.085 15 108 9.82 7.2
1992 32 522.55 12 35.932 4 34 8.5 8.5
1993 24 642.361 16 29.877 3 17 5.67 5.67
1994 13 1424.373 7 60.517 2 7 3.5 3.5
1995 19 1345.821 72 67.84 1 3 3 3
1996 27 3788.262 6 53.537 3 26 13 8.67
1997 0 0 0 0 0 0 0 0
Source: Gallo et al. (2000: Table XIX, XX)
Additionally, Gallo et al. (2000) shows that during 1955-1997, an average of the entire price
fixing cases had 81% firms as defendants; and 10% as individual defendants. An exciting
result is that 60% of the individuals found guilty during 1955-1997 were directors, proprietor,
or other executives. Knowing the large size of most corporate cartel affiliates, their
executives are likely to be reasonably wealthy persons, the majority with compensation in the
$500,000 to $1,000,000 range. Gallo et al. (2000) also illustrate that the percentage of
international cases prosecuted generally ranged from 2% to 5% in 1955-1979, which fell to
0.2% in 1980-1994, and then increased to 12% in 1995-1997.
2.7.2 The European Approach (European Commission)
Cartel decisions have always been an important part of European competition law
enforcement. EU Competition law started in the European Coal and Steel Community
(ECSC) agreement amongst France, Belgium, Italy, Luxembourg, Netherlands and Germany,
in 1951 after the Second World War. The agreement intended to prevent Germany from re-
establishing dominance in the production of coal and steel as it was felt that this dominance
had contributed to the outbreak of the war. Article 65 and later Art 66 of the agreement
prohibited cartel and the abuse of a central position by firms (Papadopoulos and Anestis,
2010).
In 1957, the real history of competition law and policy in Europe began; the policy was
included in the Treaty of Rome, which was also known as EC Treaty. The Treaty of Rome
started the enactment of competition law amongst the primary goals for the EEC (European
42
Economic Community) throughout "Organization of a system insuring that market
competition is not altered”.
The Treaty of Rome, which was signed in 1957, contained Articles 81 and 82 in which
antitrust provisions were highlighted. The treaty empowered the Commission to implement
the regulations passed by the council within the first three years. Article 81 enabled the
European Commission to act according to the principle empowering it to intervene in any
wrongdoings by those in authority, who interfered with fair competition and trading practices
(Buch-Hansen, 2008).
In Article 81(3):
"EC- prohibits agreements and concerted practices which prevent, restrict or distort
competition, insofar as they may affect trade between Member States, unless justified by
improvements in production or distribution in accordance with Article 81(3) “.
Regulation 17/62 was introduced in a pre Van Gend en Loos period in EC legitimate
development, when the supremacy of the EC law was still not completely established. To
prevent various interpretations of EC Competition Law, which might differ from a national
court to another, the Commission has been made to anticipate the role of central enforcement
authority.
Regulation 17/62 Article 101(1) states:
“All agreements between undertakings, decisions by associations of undertakings and
concerted practices which may affect trade between member states and which have as
their object or effect the prevention, restriction or distortion of competition within the
common market.”
However, after the Regulation 17/62 which was passed in February 1962, the desire to
enforce antitrust regulations was boosted, and it enabled the Commission to take actions like
breaking up price cartel and punishing some other anti-competitive acts, which demonstrated
the Commission’s success and was appreciated by the competitor firms (European
Commission, 2009). This regulation had given the Commission a relatively stronger position
with the authority of investigating firms’ acts, making decisions and providing exemptions to
43
agreements. It led to the transformation of the Directorate General (DG) into a union wide
antitrust agency (McGowan and Wilks, 1995; Wilks, 2005; Lehmkuhl, 2008). In that period,
any group of firms was liable to get approval before finalising an agreement between them,
and they had to get that approval from Directorate General IV which is now known as the
Directorate General Competition (DGC). In fact, Regulation 17/1962 had empowered the
European Commission in taking decisions regarding the conformity of cartel with the Rome
Treaties. There could be no agreements between the firms unless they were authorised by the
European Commission. This outcome reflects the success of the Commission and the
working mechanism of the Competition Policy in the Treaty of Rome.
The Commission also shows its authority in altering the structures of practices carried out by
corporations, in particular the ones that are opposing to EU competition law. This authority
was widely used by the Commission especially in the 1990s and in those cases where it was
observed that acts were going against the preferences set by the member states. However, the
Commission introduced the term “modernization Regulation” which currently employed in
EC law circles to refer to changes in the enforcement of Art 81 and 82 of the EC Treaty and
in particular Regulation 17/62. A reform which came into effect on May 1/2004 (Council
Regulation 1/2003) displayed the demands of the member states for increased powers for
national competition authorities which may be seen in the authoritative structure of these
member states. The fundamental method of the new regulatory structure is that the
Commission and National Competition Authorities (NCAs) now share responsibility for
public enforcement of Art 81 and 82 of the EC Treaty (European Communities, 2004).
EU Council Regulation 1/2003 puts the National Competition Authorities (NCAs) and
Member State national courts in the centre of the enforcement of Arts (101 and 102).
Decentralised enforcement has been the usual way for other EC rules; Regulation 1/2003
finally extended this to Competition Law as well (McGowan, 2005; Budzinski and
Christiansen 2005). The Commission still held an important position in the enforcement
system, since the co-ordinating induce in the newly created European Competition Network
(ECN). This Network, made up of the national bodies plus the Commission, manages the
flow of information between NCAs and maintains the coherence and integrity of the system.
During this time, Competition Commissioner Mario Monti hailed this regulation as one that
will modernise the enforcement of Arts 101 and 102. Since May 2004, all NCAs and national

44
courts are empowered to completely employ the Competition terms of the EC Treaty. In its
2005 survey, the OECD lauded the modernisation effort as promising, and mentioned that
decentralisation aids to redirect sources so the DG Competition could focus on complicated
investigations.
Firm sanctions
Within the EU competition law, fines only imposed on firms involved in anti-cartel acts,
though there are some national laws in some states of Europe which impose fines on the
managers of those firms. According to Regulation 1/2003, the fines to be imposed will be up
to 10% of the firm’s total earnings; although the fines are rarely that high, the amount needs
to be related to the timescale and type of act committed (Motta, 2007). During January 1998,
the European Commission put forth a set of regulations according to which the conditions of
imposing fines were made clear and later on, it published new guidelines to reform its fining
policy in September 2006 (European Communities, 1998). Corresponding with the new
regulations, the Commission will employ a two-step system to set the fine.
Individual sanctions
The EC has no powers to impose fines on individual (OFT, 2009). The attempt to enforce
individual sanctions against cartel activities at EU level faced some serious difficulties. The
efforts to inflict individual legislation against cartelist by the commission, even if it presented
Member State support, seemed to be met by systematic resistance, especially following the
Judgment of the German Constitutional Court. It is important to note, however, that the use of
individual criminal penalties for such violation at a national level (Germany, Netherlands,
etc.) was explicitly authorised by the Council of Ministers (Morgan, 2010).
Amnesty Programme
In 1996, a leniency policy was established in Europe in the hope of reducing acts involving
violation of cartel law by firms, but this did not give the European Commission the expected
results. According to this leniency policy, a firm could have a 75% to 100% reduction in fines
by the Commission if the firm reported its acts to the commission before the start of the
investigation and was not found to be leading other firms in committing the same crime. They
were able to get a 50% to 75% reduction if the firm cooperated with the Commission during
the investigation process. In both the cases, the firm needed to be the first one to let the
45
investigation begin and inform the Commission of its acts. If these two conditions could not
be met even then the firm could have a reduction of between 10% and 50% if it cooperated
with the Commission in carrying out the investigation. The flaws which led to the failure of
this policy included the lack of transparency in the imposition of fines over the firms by the
European Commission as the firms did not know the amount which they were to be charged
until the final decision was published. The fine reduction policy was not as clear as that
practised in the US. Another factor was the absence of immunity provided to firms after the
beginning of the investigation process.
However, in February 2002, amendments were made in the structure of the policy making the
level of fine clear to the firms even during the investigation process and the provision of
immunity to the cooperating firms was also made automatic just like in the US (Official
Journal of the European Communities, 2002). In fact, every firm was provided with immunity
from fines if it helped supply evidence to the investigators during the inspection phase
provided that these firms were not the instigators of the cartel. Though the policy was
reviewed again in 2006 no further prominent changes were made (Motta, 2007).
The European Commission proposed a public consultation in October 2007 which provided
individuals involved in acts of cartel space to acknowledge their law violating acts and made
the procedure of investigation faster. This practice allowed the Commission to deal with the
maximum number of cases in a short time. The proposal is consistent with the revised version
of the leniency notice and the revised guidelines of imposing fines. These acts were not in
accordance with US policies which for the past 20 years have dealt with almost 90% of cartel
cases with plea agreements. However, the practices of the Commission were not in favour of
dealing with cartel cases through face to face talks with the firms. Leniency is only provided
in cases of cooperation from the firms going through the investigation phase (GCR, 2013). To
reach the decisions earlier, the Commission spends the same amount of time as the US
Department of Justice Antitrust Division spends on cartel cases before reaching any
conclusion.
46
Settlement
A policy laid out in the Commission notice on the Conduct of Settlement Procedures in 2008
states that firms that acknowledge their liability can be rewarded with lower fines for
reducing the burden on the EC’s resources. The EC retains full discretion about which firms
can benefit from settlement and the terms of the settlement (OFT, 2009).
Private damages
The European Union, private enforcement actions are rare and take smaller part than public
enforcement in the fight against antitrust behaviour. Several complication delay actions for
damages in member state national courts, including a limited access to evidence, the
unavailability of class actions and the potential that the applicant may have to pay the
defendants’ costs if the applicant loses the case. To concentrate on these complications and
the large range of damages actions amongst the member states, the European Commission
lately published a green paper on Damages Actions for Breach of the EC Antitrust Rules. The
green paper looked at those aspects of EU litigation practice that have led to a pronounced
underdevelopment of private damages actions in the EU. Since its publication in December
2005, the green paper has sparked significant debate within the international antitrust
community about the role of private enforcement of EC Treaty competition law and about
damages actions in particular. The general expectation is that private damages actions will
emerge in the European Union (SEC, 2005).
Literature on the penalty regime of European Commission
In early decades, the fines that were given for infringements by the European enforcement
usually concerned cases that resulted from a Commission’s own initiative or a complaint.
However, since 1970 the Commission has produced roughly 5 cartel infringement decisions
per year on average. In recent years, Europe has seen a lot of cartel activity revealed by the
enforcement efforts. The Commission followed the U.S in the mid-1990s in the enforcement
prohibition of concerted practices with the object or effect to prevent, restrict or distort
competition in the common market. During the terms of Commissioners van Miert and
Monti, the EC undertook a major transformation of the competition rules. It stepped up its
cartel enforcement with a special cartel task force in DG Competition (Van Miert, 1998).
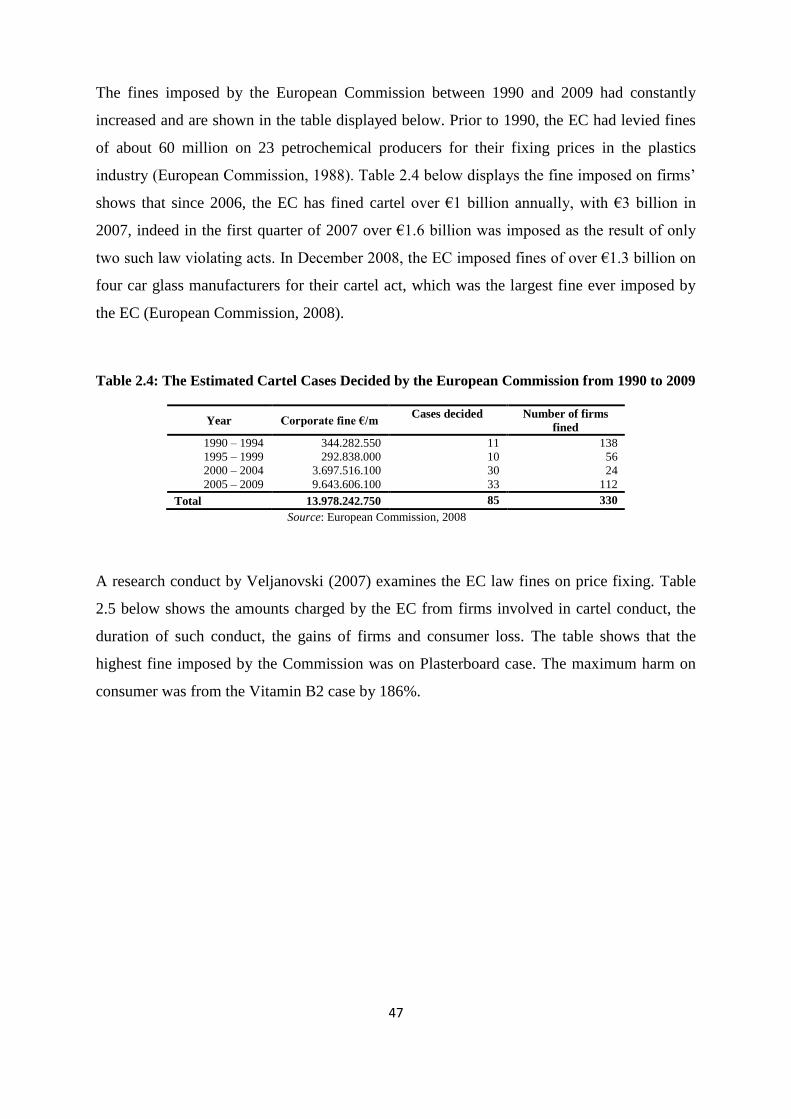
47
The fines imposed by the European Commission between 1990 and 2009 had constantly
increased and are shown in the table displayed below. Prior to 1990, the EC had levied fines
of about 60 million on 23 petrochemical producers for their fixing prices in the plastics
industry (European Commission, 1988). Table 2.4 below displays the fine imposed on firms’
shows that since 2006, the EC has fined cartel over €1 billion annually, with €3 billion in
2007, indeed in the first quarter of 2007 over €1.6 billion was imposed as the result of only
two such law violating acts. In December 2008, the EC imposed fines of over €1.3 billion on
four car glass manufacturers for their cartel act, which was the largest fine ever imposed by
the EC (European Commission, 2008).
Table 2.4: The Estimated Cartel Cases Decided by the European Commission from 1990 to 2009
Year Corporate fine €/m Cases decided Number of firms
fined
1990 – 1994 344.282.550 11 138
1995 – 1999 292.838.000 10 56
2000 – 2004 3.697.516.100 30 24
2005 – 2009 9.643.606.100 33 112
Total 13.978.242.750 85 330
Source: European Commission, 2008
A research conduct by Veljanovski (2007) examines the EC law fines on price fixing. Table
2.5 below shows the amounts charged by the EC from firms involved in cartel conduct, the
duration of such conduct, the gains of firms and consumer loss. The table shows that the
highest fine imposed by the Commission was on Plasterboard case. The maximum harm on
consumer was from the Vitamin B2 case by 186%.
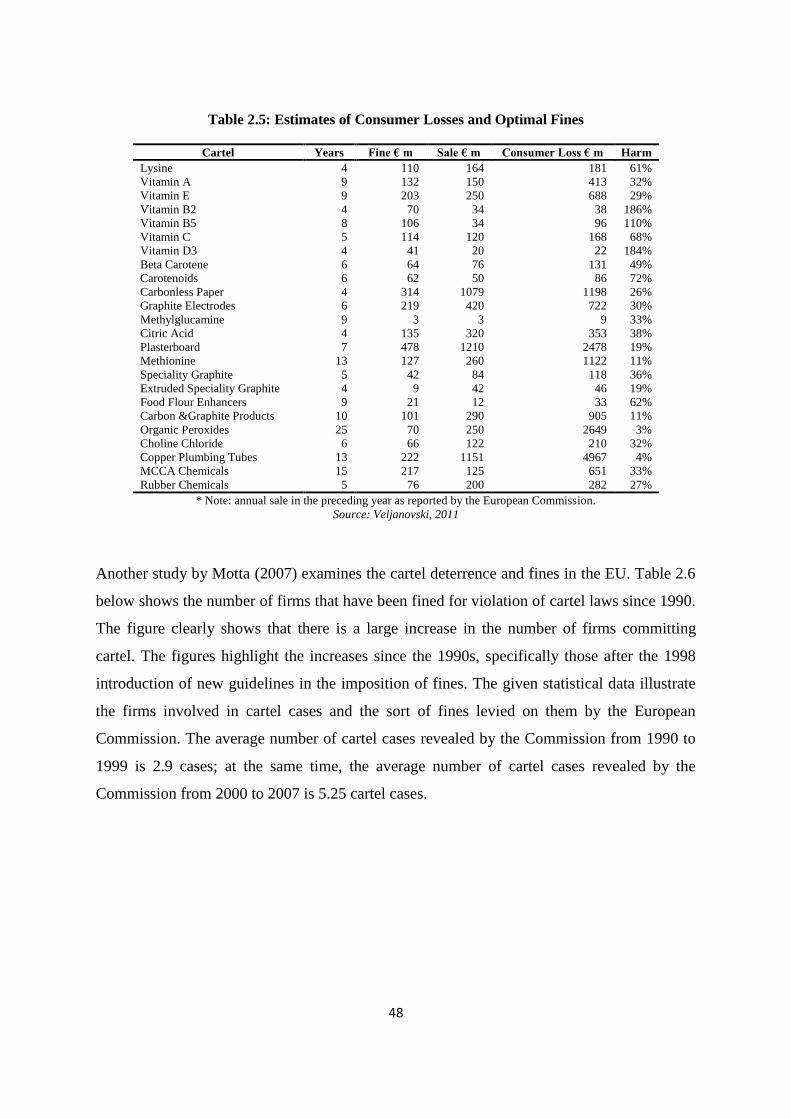
48
Table 2.5: Estimates of Consumer Losses and Optimal Fines
Cartel Years Fine € m Sale € m Consumer Loss € m Harm
Lysine 4 110 164 181 61%
Vitamin A 9 132 150 413 32%
Vitamin E 9 203 250 688 29%
Vitamin B2 4 70 34 38 186%
Vitamin B5 8 106 34 96 110%
Vitamin C 5 114 120 168 68%
Vitamin D3 4 41 20 22 184%
Beta Carotene 6 64 76 131 49%
Carotenoids 6 62 50 86 72%
Carbonless Paper 4 314 1079 1198 26%
Graphite Electrodes 6 219 420 722 30%
Methylglucamine 9 3 3 9 33%
Citric Acid 4 135 320 353 38%
Plasterboard 7 478 1210 2478 19%
Methionine 13 127 260 1122 11%
Speciality Graphite 5 42 84 118 36%
Extruded Speciality Graphite 4 9 42 46 19%
Food Flour Enhancers 9 21 12 33 62%
Carbon &Graphite Products 10 101 290 905 11%
Organic Peroxides 25 70 250 2649 3%
Choline Chloride 6 66 122 210 32%
Copper Plumbing Tubes 13 222 1151 4967 4%
MCCA Chemicals 15 217 125 651 33%
Rubber Chemicals 5 76 200 282 27%
* Note: annual sale in the preceding year as reported by the European Commission.
Source: Veljanovski, 2011
Another study by Motta (2007) examines the cartel deterrence and fines in the EU. Table 2.6
below shows the number of firms that have been fined for violation of cartel laws since 1990.
The figure clearly shows that there is a large increase in the number of firms committing
cartel. The figures highlight the increases since the 1990s, specifically those after the 1998
introduction of new guidelines in the imposition of fines. The given statistical data illustrate
the firms involved in cartel cases and the sort of fines levied on them by the European
Commission. The average number of cartel cases revealed by the Commission from 1990 to
1999 is 2.9 cases; at the same time, the average number of cartel cases revealed by the
Commission from 2000 to 2007 is 5.25 cartel cases.
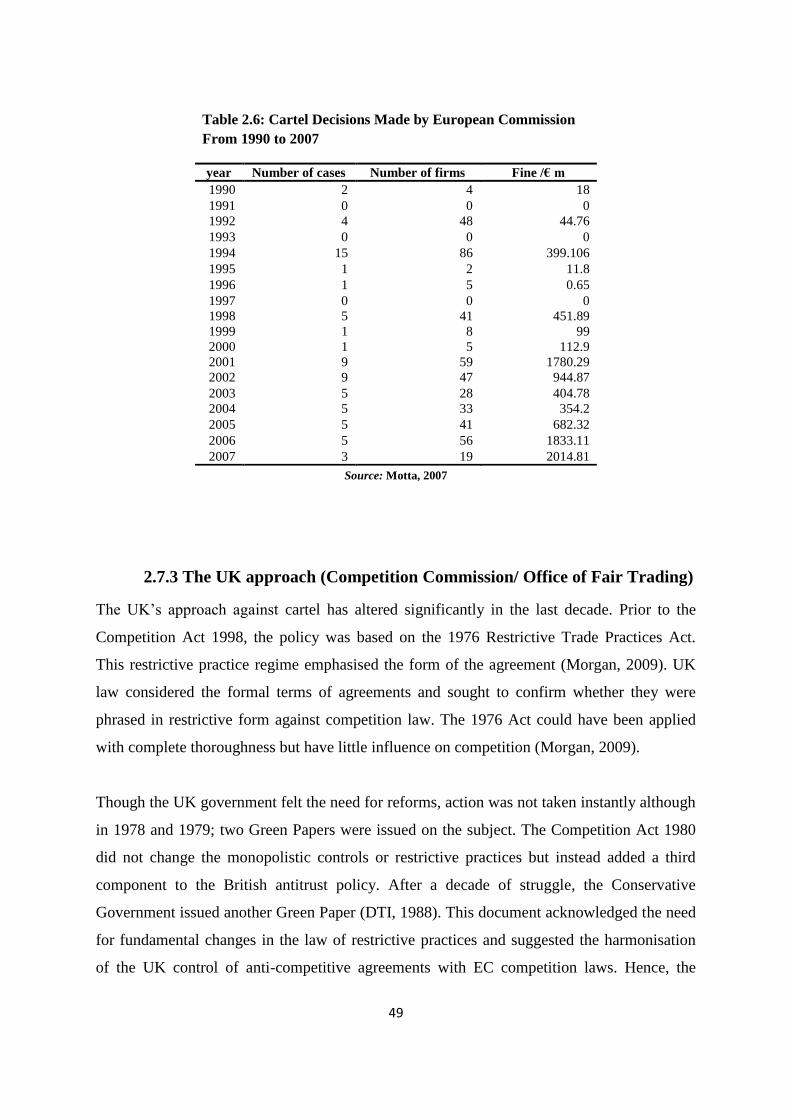
49
Table 2.6: Cartel Decisions Made by European Commission
From 1990 to 2007
year Number of cases Number of firms Fine /€ m
1990 2 4 18
1991 0 0 0
1992 4 48 44.76
1993 0 0 0
1994 15 86 399.106
1995 1 2 11.8
1996 1 5 0.65
1997 0 0 0
1998 5 41 451.89
1999 1 8 99
2000 1 5 112.9
2001 9 59 1780.29
2002 9 47 944.87
2003 5 28 404.78
2004 5 33 354.2
2005 5 41 682.32
2006 5 56 1833.11
2007 3 19 2014.81
Source: Motta, 2007
2.7.3 The UK approach (Competition Commission/ Office of Fair Trading)
The UK’s approach against cartel has altered significantly in the last decade. Prior to the
Competition Act 1998, the policy was based on the 1976 Restrictive Trade Practices Act.
This restrictive practice regime emphasised the form of the agreement (Morgan, 2009). UK
law considered the formal terms of agreements and sought to confirm whether they were
phrased in restrictive form against competition law. The 1976 Act could have been applied
with complete thoroughness but have little influence on competition (Morgan, 2009).
Though the UK government felt the need for reforms, action was not taken instantly although
in 1978 and 1979; two Green Papers were issued on the subject. The Competition Act 1980
did not change the monopolistic controls or restrictive practices but instead added a third
component to the British antitrust policy. After a decade of struggle, the Conservative
Government issued another Green Paper (DTI, 1988). This document acknowledged the need
for fundamental changes in the law of restrictive practices and suggested the harmonisation
of the UK control of anti-competitive agreements with EC competition laws. Hence, the
50
White Paper released the next year agreed to the required changes and also offered an
abstract of the weaknesses of the existing act (DTI, 1989). The UK government accepted the
fact that ‘our existing system is rigid and time-consuming, repeatedly dealing with cases that
are ineffective and not thoroughly associated with anti-competitive agreements’ (DTI, 1989).
Along with other recommendations, it suggested dissolving the registration system under the
1976 Act and replacing it with a clause 81(1) EC pattern general injunction, to establish a
strong competition authority to acquire the power of the Director General (DG) and to apply
a system of individual and block exclusion based on Article 81 (3) EC. All these
recommendations were initially expected to be implemented by 1991 (DTI, 1989).
Later, in 1992, another Green Paper outlined an alternative sequence of possible reforms
(DTI, 1992). In this paper, the central point was to accept the reform on the abuse of
monopoly. Therefore, choices considered were a general ban on abuse of influential position
considering Article 82 EC, following the dual system which maintained the Fair Trading Act
1973; and avoiding differences and inconsistency in interpretation to make the existing
structure stronger. The Green Paper also supported the government intention to establish new
authorities as soon as possible, but little consideration was given to these proposals. Rather,
the Deregulation and Contracting Out Act 1994 limited the authority of the United Kingdom
law regardless of aligning it with the Treaty of Rome (Pratt, 1994).
The Competition Act 1998 became operational in 2000 based on Article 81 (OFT, 1999).
This Act was allied to national competition law and EC law as closely as possible (Articles
81 and 82 EC) for minimising the regulatory liability on firms. To achieve this goal, the
government had to add two chapters - Chapter I, restrictions on anticompetitive agreements
and Chapter II, abuse of a dominant position. Firms that agreed or plotted to fix prices,
limiting production, rigging bids or share markets would be breaching section 2(1) of the
Competition Act 1998 covered in Chapter I and the prohibition affecting the trade through
attitude and behaviour between Member States, Article 81(1) of the EC treaty.
Firm sanctions
For the first time, the Competition Act 1998 introduced fines for firms found acting against
fair competition. Later, the amount of maximum fine was fixed at 10% of a firm’s per annum
worldwide turnover, as at EC level (OFT, 2004a). This corporate penalty alone was not
51
enough to discourage firms from forming a league of their own to control the market.
Moreover, suggestions for individual criminal sanctions were mentioned in the joint
Treasury/Department of Trade and Industry report on productivity issued in June 2001 (DTI,
2001).
Individual sanctions
The Enterprise Act of 2002 introduced the cartel crime as a criminal offence for individuals
dishonestly participating in cartel agreements. This criminal offence operates together with
the Competition Act 1998 regime, which provides civil sanctions for any ‘undertaking’ that
breach the law (OFT, 2003a). Anyone involved in criminal cartel wrongdoing under the
Enterprise Act 2002 - such as price-fixing - might face the prospect of going to prison for a
period of five years, and/or an unspecified level of fines.
Previously, the penalty was only a regulatory slap on the wrist, but after the Competition Act
1998, there was a significant prescription for such unhealthy competition in the UK market.
Extreme cartel violations are directed to the Community level by the European Commission
Directorate General Competition, when Article 81 EC is breached. There is a legislative 10%
limit of an enterprise’s worldwide turnover, which is intended to protect enterprises from the
unfavourable effects of huge fines; this is the only sanction that is available as an
administrative fine for corporations under Regulation 1/2003 (preceded by Regulation
17/1962). At the time the Enterprise Act 2002 was introduced, it made remarkable changes to
UK’s competition law. The act was executed during 2003 with several important clauses
coming into effect from 20 June 2003. The White Paper that was published before the
introduction of the Enterprise Bill argued that the probability of getting detected might avert
the need for agreeing what a satisfactory level of fines to discourage cartel breaches would be
(DTI, 2001). The criminal offence ensuring to compensate for this drawback in anticipation is
aligned with cartel application on both the Community and UK levels (Sealy and Milman,
2012).
The Enterprise Act introduced a new clause that had the power to execute disqualification
orders on directors of enterprises. Under the Competition Disqualification Order, the court
can disqualify an individual from being a director of a firm with violations of Competition
Act (Articles 81, and 82 of the EC Treaty and Chapters I and II prohibitions). This
52
disqualification order can prevent a person from being a director for a period of 15 years. The
first sentences resulting from guilty pleas after a US plea bargain agreement were handed
down five years after the offence came into force in the UK (OFT Press Release, 2008).
Clearly elected consumer bodies will be allowed to apply for rights to address damage claims
on behalf of a named individual consumer. An extra restriction imposed by the UK
government is an individual sanction, which can include an unlimited fine on conviction for
the cartel offence or imprisonment of up to five years. Moreover, the Commission initiated
actions for damages for anti-competitive behaviour, looking after details and proceedings in
the normal courts for damages faced as a result of a violation that may be taken up in the
Competition Appeals Tribunal.
Amnesty programme
The OFT leniency programmes are based on the experience of the US leniency programmes,
and all their clauses are related to the US DOJ corporate amnesty policy. On the contrary to
the EU, the OFT implemented the “leniency policy plus” alike to the one in the US, which
gives the opportunity to corporations that is under investigation in one case to reveal
information and evidence about another case. By doing this, they will obtain an additional
reduction in fines (Morgan, 2010). The US experience proved that in order for the leniency
policies to work well with both individual and corporate levels, there is a need to be
predictable and clear (Barker, 2009)
The leniency programme was considered by UK Office of Fair Trading for the establishment
of suitable punishments under the new Competition Act. A modified version of this
recommended guidance was approved in 2000. Individuals who provide information have
immunity from prosecution and can save themselves from getting disqualified from being a
director. Recently, the information from whistle-blowers became the way in which cartel
behaviour was discovered. Moreover, the evidence collected was used in the investigation by
OFT (Grout and Sonderegger, 2005).
Settlement
Although OFT programmes have not mentioned the conditions of all the settlements that
have been agreed upon till now, the OFT may utilise any settlement discount given for

53
cooperation in its clemency programme. This programme took an important role in detecting
cartel and helped in investigating cases effectively (Aubert et al., 2004).
Private damages
A private action is a fundamental principle of the Community law in Europe (Art 81 and 82).
The White paper introduced a number of provisions that aimed at facilitating private actions.
However, private actions have not played the part being predicted.
Literature on the penalty regime of Competition Commission and Office of Fair
Trading
In 2008, David Brammer, Peter Whittle and Bryan Allison were sent to jail for 30 months and
three years for participating in a worldwide cartel in the supply of flexible Marine Hoses
case. After attending a cartel meeting, the three individuals were arrested by the US antitrust
authorities in 2007. The DoJ caught and imprisoned a BA executive Keith Packer, for an
equivalent crime relating to air cargo fuel surcharges in October 2008 (DoJ Press Release,
2008). However, the first real test of the new anti-cartel laws at a tribunal was brought by the
Serious Fraud Office (Prosecutions of the cartel offence in England and Wales, and in
Northern Ireland are generally undertaken by the SFO. Prosecutions in Scotland are brought
by the Lord Advocate). Those found guilty had accepted the charges levelled against them
and were found guilty in the US under a plea bargain. These individuals will also appear in
court to make sure that they were not deported to the US. The US Department of Justice
Antitrust Division (DoJ) permitted them to return to the UK on the condition that they will
plead guilty to the UK cartel offence and will be sent to the US if their UK punishments were
less than those accepted under the plea agreement. The other conviction of four British
Airways Executives involved in the price-fixing of fuel surcharges cases will appear again in
court to argue against deportation to the US.
Table 2.7 below illustrates the value of fines imposed by the OFT from 2001 to 2006. In
2003, following successful prosecutions regarding price-fixing of ‘Hasbro Toys’ and ‘Replica
Football Kits’, and the ‘Genzyme Limited’ exclusionary practice case, the OFT collected
approximately £48 million (€54.59m) in antitrust fines, which adds up to more than a half of
the total amounts collected as fines from 2001 to 2006. The OFT levied £63.1 million (€71.6
million) in antitrust fines as a result of 19 cases involving 77 firms.
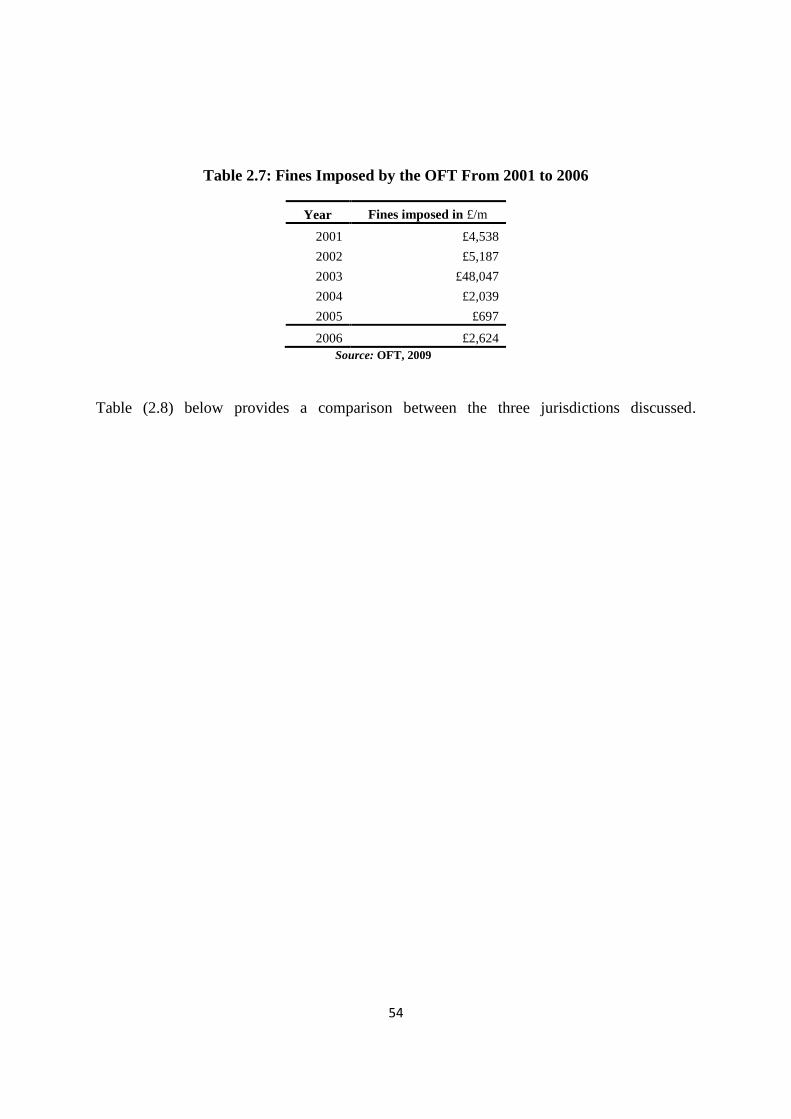
54
Table 2.7: Fines Imposed by the OFT From 2001 to 2006
Year Fines imposed in £/m
2001 £4,538
2002 £5,187
2003 £48,047
2004 £2,039
2005 £697
2006 £2,624
Source: OFT, 2009
Table (2.8) below provides a comparison between the three jurisdictions discussed.
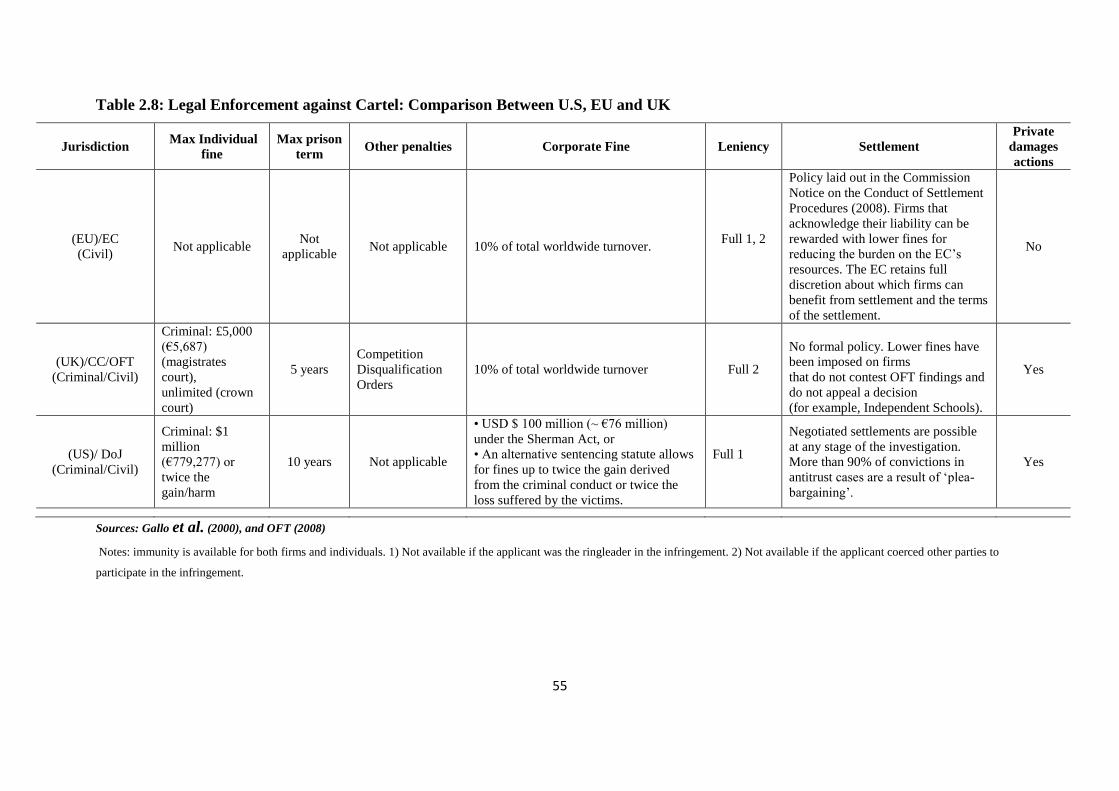
55
Table 2.8: Legal Enforcement against Cartel: Comparison Between U.S, EU and UK
Jurisdiction Max Individual
fine
Max prison
term Other penalties Corporate Fine Leniency Settlement
Private
damages
actions
(EU)/EC
(Civil) Not applicable
Not
applicable Not applicable 10% of total worldwide turnover.
Full 1, 2
Policy laid out in the Commission
Notice on the Conduct of Settlement
Procedures (2008). Firms that
acknowledge their liability can be
rewarded with lower fines for
reducing the burden on the EC’s
resources. The EC retains full
discretion about which firms can
benefit from settlement and the terms
of the settlement.
No
(UK)/CC/OFT
(Criminal/Civil)
Criminal: £5,000
(€5,687)
(magistrates
court),
unlimited (crown
court)
5 years
Competition
Disqualification
Orders
10% of total worldwide turnover Full 2
No formal policy. Lower fines have
been imposed on firms
that do not contest OFT findings and
do not appeal a decision
(for example, Independent Schools).
Yes
(US)/ DoJ
(Criminal/Civil)
Criminal: $1
million
(€779,277) or
twice the
gain/harm
10 years Not applicable
• USD $ 100 million (~ €76 million)
under the Sherman Act, or
• An alternative sentencing statute allows
for fines up to twice the gain derived
from the criminal conduct or twice the
loss suffered by the victims.
Full 1
Negotiated settlements are possible
at any stage of the investigation.
More than 90% of convictions in
antitrust cases are a result of ‘plea-
bargaining’.
Yes
Sources: Gallo et al. (2000), and OFT (2008)
Notes: immunity is available for both firms and individuals. 1) Not available if the applicant was the ringleader in the infringement. 2) Not available if the applicant coerced other parties to
participate in the infringement.
56
2.8 Chapter Summary
This chapter has presented the definition and forms of cartel; the theoretical framework where the
oligopoly theory and the game theory for cartel existence are explained; the direct and indirect effects
of cartel imposition; and the anti-cartel enforcement policies by the United States (DoJ), Europe
(European Commission), and the UK (Competition Commission/Office of Fair Trading).
This chapter tackles the purpose of cartel formation in today’s competitive environment and how
cartel players undertake their roles through anti-trust enforcement. The participation constraint
requirement and the incentive compatibility constraint aid in successful cartel operation. Market
characteristics contributing to cartel stability include the presence of entry barriers, the number of
firms, the quality differences/product differentiation, seller concentration, capacity constraint and
excess capacity, buyer power, demand elasticity, and static or declining demand. The essence of
cartel formation is the establishment of agreements amongst firms on fixing or raising prices to
undermine the competition, carve the market, or allocate market shares. Cartel imposition directly
affects customers, suppliers, non-participating competitors, and the final consumers. These direct
effects are in the forms of actual loss (overcharge), profit loss, and interest (opportunity cost).
Indirect effects, on the other hand, include X-inefficiency and long-term structural effects on the
market. Individual and firm accountability is discussed to show who is accountable for cartel
formation. Whether the firm decides to collude or not is influenced by the presence or absence of
antitrust policy and how such policy is enforced. The US approach, European approach, and UK
approach to jurisdiction provide an elaboration of fine sanctions, individual sanctions, amnesty
programme, settlement, and private damages to deal with cartel commission.
The next chapter shall examine the concept of corporate governance, its link to market competition
and cartel formation. It also discusses theoretical background and literature review, thereby offering
clarity to the subject matter.
57
Chapter Three
Literature Review and Hypothesis Development
3.1 Introduction
This chapter looks first at the concept of corporate governance and the roles of the CEO and board of
directors in corporate governance. In addition, it discusses the influences of corporate governance on
market competition, and cartel formation. This followed by a discussion from the literature on the
relationship between cartel formation and CEOs as well as the impact of cartel formation on
shareholders.
A discussion of agency theory shall be presented in tackling the concept of corporate governance and
cartel formation. It will then identify the independent variables and justifies its utilisation in this
research as proxies for corporate governance attributes. Finally, an overview of literature on
corporate governance will be used to justify the inclusion of each independent variable and provide
an understanding as to why these attributes may be associated with the incidence of cartel formation.
The independent variables reflecting corporate governance attributes are grouped in four different
types which consist of board of directors’ characteristics, ownership structure, CEO characteristics
and CEO compensation packages. Once support for the component of each variable is provided, a
number of individual propositions will be posed. The results of testing the propositions will be
furnished in Chapter Five.
3.2 The Concept of Corporate Governance
The development of the concept of corporate governance started taking place in developed market
economies over the past decades where the manner of managing the firm was said to determine the
economy and the firm’s efficiency and competitiveness. However, corporate governance is
questionably more significant in transition economies taking on marketisation and reforms in
wholesale property rights (Lin, 2001). These economies feature a kind of privatisation with no
associated efforts to tackle issues on corporate governance, which led to ownership patterns and
insider control that are unfavourable to restructuring and output recovery. Today, there is wide
58
recognition in the corporate governance development as an essential trajectory for an efficient market
system to successfully go through transition (Lin, 2001).
Corporate governance has been defined as a framework provided for the management of resources in
an efficient manner and for the application of these resources in society. These activities are to
clearly exhibit the interests of the individuals, corporations, and society as a whole. Cadbury (1992)
provides this concept of corporate governance in his speech at the Global Corporate Governance
Forum. The concept focuses on firms and their shareholders, as well as the firms’ accountability to
several groups of people, or ‘stakeholders’ (Solomon, 2010).
Charreaux and Desbrieres (2001) believe that corporate governance is anything that governs the
actions and activities of the management and the reason why such actions are carried out in the first
place. Corporate governance also provides an assurance to the investors of the organisation that they
would be provided a return on their investments (Shleifer and Vishny, 1997) Persons (2006) states
that if an organisation takes on negative actions, it is possible that it may not be able to generate high
returns after a certain period.
It must be noted that any negative activity carried out by the management has the ability to reduce
shareholder wealth. This is why the concept of corporate governance is introduced to protect the
wealth and well-being of the shareholders in the long run. These shareholders are the ones who
actually provide the capital to run the organisation and it would be an extensive task to individually
monitor all activities. For this reason, a corporate governance structure is presented which has the
ability to analyse that all fiduciary duties have been carried out accordingly.
A study was conducted by Hermanson et al., (2006) in which ten fundamental conclusions is
presented relating to the concept of corporate governance. The basic concept behind all these
conclusions is that in order to gain the confidence of the investors in the financial markets, it is
essential to carry out corporate governance practices. Hence, all the different kinds of literature
present the same aspects of corporate governance. They all believe that corporate governance is a
framework or structure being followed by the management to keep them in control. These activities
are monitored at all times so that they may be stopped before any kind of fraudulent action could
take place, which might ruin the reputations of the organisation (Solomon, 2007).
59
To help align the diverse interests of directors/managers and shareholders, market competition plays
as an external mechanism to discipline management as well as the internal mechanisms of corporate
control can be employed (Walsh and Seward, 1990). Next section briefly discusses corporate
governance in relation to board of director, CEO and ownership structure.
3.2.1The Board of Directors Roles in Corporate Governance
The board of directors is considered the most important element in the internal framework of
corporate governance (Fama, 1980; Fama and Jensen, 1983). The board’s composition serves as the
basis for establishing the board with effective management monitoring. The agency theory views that
an independent board is a vigilant element of agency problem since it involves a considerable number
of non-executive directors tasked to monitor the performance and behaviour of management
(Johnson et al., 1996; Bainbridge, 1993).
The principal-agent theory of financial economics leads to the dominant views on the role and
significance of corporate boards of directors (Jensen and Meckling, 1976; Daily et al., 2003; Lynall
et al., 2003). The seminal work of Berle and Mean (1932) was the basis of the principle-agent theory
and underlined the newly formed distinctions between the firm ownership and operational control
and the benefits that were achieved through having specialized managerial staff that had relevant
expertise and knowledge (Fama and Jensen, 1983).
However, the dispersed share ownership and the development of qualified management that was
specialized would lead to a possibility of conflicting interests, as Berle and Means (1932) pointed
out. According to the principal-agent theory, the ‘principals’ who are the owners of the firm i.e. the
shareholders are usually distinct from the ‘agents’ who are the managers of the firm, and this
distinction leads to the agents having an advantage over the principals with respect to availability of
information (Jensen and Meckling, 1976).
The agency theory assumes that the managers keep their own interests in mind when making
decisions and these interests may not necessarily be the same as that of the principals. The
shareholders benefits are of secondary importance to self-serving managers looking to maximize
their personal utility (Jensen and Meckling, 1976). In this regard, the ‘model of man’ that the
principal agent model represents believes that the management acts in “a homo
economicus…individualistic, self-serving and opportunistic manner” (Davis et al., 1997). Managerial
60
decisions that are not satisfactory for the principals come about when the utility of the manager is
derived from rewards that are financial or status based instead of inner satisfaction regarding the
firm’s success. Management may get involved in activities that seek to build an empire, reduce risk
by diversifying the firm and corporate philanthropy activities that look for prestige, activities that do
not necessarily increase the shareholder value (Ong and Lee, 2001; Denis and McConnell, 2003).
Various functions are intended to be carried out by the board of directors, when considered from the
perspective of agency theory, to ensure that the costs pertinent to separation of ownership and control
are minimized (Daily et al., 2003; Denis and McConnell, 2003). This model specifically implies the
key role of board of directors to employ an effective method of supervising and reporting so that the
degree of unequal distribution of information between the principals and agents is reduced. To make
sure that this supervision function is carried out effectively, it is vital that the board of directors is
independent of operational management to some degree at the least (Davis et al., 1997). It is due to
this viewpoint that many discussions are taking place with respect to the significance of having non-
executive directors who may be from outside the organization.
The chairman of the board also needs to be separated from the operational activities so that a board
that is independent enough to be able to meet its supervisory responsibilities effectively is formed
(Davis et al., 1997; Boyd, 1995; Green, 2004). Board of directors that are from outside the
organization put forward opinions that are independent of executive management. They consider the
maximum benefits for the shareholder when evaluating the strategy of the firm and are expected to
study the proposals of the executive management with objective reasoning. This creates a pressure on
the executive management to avoid taking actions based on personal motives seeking to maximize
their utility.
The issue of agency problem can also be resolved through the employment of external board of
directors who also help to integrate the interests of the shareholders and managers which eventually
leads to a better financial performance (Daily et al.., 2003; Peng, 2004). The independence of the
board is also improved when the roles of the CEO and Chairman of the board are separated which
leads to an independent evaluation of the executive manager’s suggestions and also lessens the power
held by the CEO. According to the agency view, this would lead to an improved financial
performance through more firm decision making at the board level (Boyd, 1995; Beatty and Zajac,
1994; Finkelstein and D’Aveni, 1994).
61
The incentives of the agents need to be parallel to those of the principals so that the former are
inclined to proceed according to the interests of the latter. This is the second vital responsibility of
the board directors. The right remuneration policies need to be formed and executed so that the
incentives of the managers and owners become parallel (Daily et al., 2003; Conyon, 2006). Schemes
like rewarding senior managers with shares or giving them the option to buy shares at subsidized
prices (Jensen and Meckling, 1976), or compensating the executives and awarding bonuses by
ascertaining the levels of returns that the shareholders receive (Buck et al., 2003) need to be
implemented as part of systems that are formed to bring the interests of principals and managers in
line with each other.
Resource dependence theory is the third important perspective on the function of board of directors
and it presents the view that the corporate board of directors is an important aspect of the firms’
attempts to exercise control over their external environment (Muth and Donaldson, 1998).
The impacts of economics, science, politics and sociology are conceptualized into a multifaceted
approach called the institutional theory, which is the fourth theory that needs to be implemented in
corporate boards. Studies on corporate boards manifest a particular aspect of institutional theory the
most which is the idea of isomorphism and legitimacy (Parker et al., 2007; Peng, 2004; Li and
Harrison, 2008; Young et al., 2000; Myllys, 1999; Chizema, 2008).
The conflicting interests of the ones who make the decisions and the ones who bear the risks is
brought into alignment through the board of directors influence to appoint, dismiss and give benefits
to senior management teams. Thus, large business organizations consider them to be an integral part
of their governance structure as the recent developments in economic theory implies (Williamson,
1983, 1984; Fama and Jensen, 1983a).
The responsibility of managing decisions is handed over to the CEO while the board assumes control
of the decisions, which makes it easier for the corporations to take care of the possibility of agency
problems. This means that the strategic decisions are initiated and executed through the CEO while
the board endorses and monitors those decisions. The primary task of the board is to align the
conflicting interests of the shareholder and top management by serving as a system of internal control
(Mizruchi, 1983; Walsh and Seward, 1990).
62
3.2.2 The CEO Roles in Corporate Governance
Because CEOs are the key decision makers in firms; there is interest in the role that CEO play in
explaining the difference in corporate decision across firms.
According to Hazarika et al. (2012), the imposition of costs on shareholders can be undertaken by
CEOs who manage earnings, but an important issue is whether boards take a proactive or reactive
action to discipline these managers, and whether they do act only when external consequences have
taken place out of manipulation. The authors use a sample of forced and voluntary turnovers within
the period of 1992 to 2004 and find a positive relationship between earnings management and the
likelihood of forced turnover. A negative relationship is found between a CEO’s job tenure and the
extent to which earnings are actively managed during his term of office. These results are consistent
in tests that take account of the potential changes in CEO turnover and earnings management, as well
as external consequences. Firms performing either good or bad can involve the occurrence of the
relation between forced turnover and earnings management, as well as the inflating or deflating of
reported earnings through accrual work. These results suggest that proactive action is undertaken by
at least some boards in disciplining managers with aggressive earnings management prior to costly
external consequences caused by such manipulations. This idea is congruent with the notion that
internal governance addresses managerial agency problems (Hazarika et al., 2012).
Hazarika and colleagues’ study finds usefulness in this research as it contributes to explain the
behaviour of the firm in chastising managers that practise earnings management aggressively as well
as the CEO’s job tenure and their corresponding degree of active management of earnings. This in
turn contributes to addressing the hypotheses as it provides enlightenment on these areas, which are
essentially tackled in this research.
Only when executives have gained influence on crucial decisions can they impact firm outcomes. It
is through the basis of this idea that Adams, and Ferreira (2003) design and test a hypothesis stating
that firms with CEOs that have more decision-making power should have performance variability.
The focus of the study is directed to the CEO’s power over the board and other top executives. The
authors find out that more variable stock returns are indicated for firms managed by powerful CEOs
and that firm performance generates important consequences as a result of the interaction between
organisational variables and the characteristics of executives (Adams et al., 2005). This article is
63
useful to the topic being investigated as it focuses on the influential role of CEOs on firm
performance, and the relationship between powerful CEOs and firm outcomes, which is indicative of
corporate governance.
Corporate governance saw its greater importance in the Enron failure and the collapse of high-profile
corporations. Debates relating to corporate governance efficiency have emerged along with this,
including controversies on director and CEO remunerations, greater stakeholder approach to
governance, and the like. This led to debates in current corporate governance, which consider the role
and structure of boards from a number of theoretical perspectives. It is worth noting that these
theoretical perspectives commonly aim to posit a link between corporate governance and board
characteristics. Agency theory involves the alignment of the interests of managers and owners and
assumes that an inherent conflict exists between the management and the owners of the firm
(Nicholson and Kiel, 2003).
Whilst there are studies support the assertions of both agency theory and stewardship theory, it is
found out through a recent meta-analysis that substantive relationships do not exist between firm
performance and board composition. In another meta-analysis study, it is concluded that a slight
positive relationship exists between the two. Overall, consistent evidence of any significant
relationship between them is generally lacking (Nicholson and Kiel, 2003). The study infers that
larger firms are characterised by larger and more interlocked boards, increased proportion of external
directors, and increased likelihood to separate the chairman and CEO roles. These firms view greater
number of directors as necessary in the outsiders’ increased proportion and the separated roles of the
CEO and the chairman so that the firm may be efficiently monitored and controlled (Nicholson and
Kiel, 2003).
Since these firms need to seek greater links with other firms, the corresponding impact would be
appointment of more directors and search for more interlocks, which are linked to firm size and board
size. It must be noted, however, that no relationship exists between the amount of interlocks and CEO
concentration power. Whilst there is evidence in the notion that boards will aim to connect with the
external environment, there is no presence of any link between this pursuit and firm performance
(Nicholson and Kiel, 2003). This study by Nicholson and Kiel is useful to this research report as it
tackles the interplays between several variables of corporate governance, i.e., firm performance, firm
64
size, CEO concentration power, number of interlocks, etc., which provide evidence to the role of
CEOs in corporate governance.
Ferris et al. (2003) found in their study that directors nearing retirement age might consider multiple
directorships. Age is said to serve as a proxy for the director’s experience and the energy needed for
the demands of board service. The study found that the regression for the number of directorships
vis-à-vis age involves a significant positive co-efficiency. It also suggests that older directors with
greater experience of directorships are no longer interested in additional directorships or might pose
as less attractive candidates. The average age of directors is also older in boards with multiple
directors. In a particular corporation, arbitrary terms are not held by the board as a limitation that may
be imposed on directors’ service. The board does not also maintain a position that directors must be
remunerated annually until upon reaching the mandatory retirement age (Clayman et al., 2012).
3.2.3 Ownership Structure and Corporate Governance
A theoretical model is developed by Desender (2009) purporting to better understand of how
ownership structure influences the priorities of the board of directors, and how firm performance is
affected by this. Despite the discussions of several researches on the universal link between corporate
governance practices and performance outcomes, there is neglect in the firm’s specific context,
however. Moreover, diverse environments result in disparities in the effectiveness of various
government practices.
Desender (2009) posits that the board’s priorities are influenced by ownership structure, and that
these priorities ascertain the board’s optimal composition. In the case of a board that sets priorities on
monitoring, such board views the importance of directors with concentration power and financial
experience. In the case of a board that sets its priorities on the provision of resources, such board
benefits from directors of diverse characteristics, the CEO’s presence on the board, and a larger board
size. Greater sensitivity is required in understanding how the board influences firm performance, and
such sensitivity must be focused on the impact of corporate governance on the various areas of
effectiveness for a range of stakeholders.
The insights that may be derived on the link between board composition and ownership structure can
bring about new realisations on the conflicting empirical results of past research that attempted to
provide direct association between board composition and ownership structure. In view of perceived
benefits from reengineering governance systems, discussions have emerged in terms of the suitability
65
of executing recommendations for corporate governance characterised by dispersed ownership
(Desender, 2009).
Desender (2009) points out that ownership structure is a key dimension to corporate governance and
is also largely seen as having been determined by corporate governance characteristics of other
countries, such as the nature of state regulation and stock market development. It is found that
shareholder structures are fairly varied across countries, where frequency of dispersed ownership is
seen in listed firms of US and UK. Moreover, rich economies often have typically concentrated
ownership of large firms, whose control is often carried out through pyramidal groups. Albeit large
shareholders dominate the control of some large firms in the U.S (e.g. Microsoft and Ford), these
firms are however few and have not drawn much attention to the corporate governance debate.
Accordingly, there are two apparent consequences in the differences in ownership structure for
corporate governance: (1) dominant shareholders are empowered and incentivised to discipline
management, and (2) a new problem can be created by concentrated ownership because of the lack
alignment between the interests of controlling shareholders and those of minority shareholders.
Whilst maximisation of returns at reasonable risk is the primary concern of shareholders, preferring
growth to profits may be the concern of managers. Considering the fact that ownership and control
can be potentially separated, the interests of principals and agents must be aligned through various
mechanisms. Due to the problems faced by shareholders in their monitoring of the management, a
corresponding increase in agency costs had taken place. These problems include the existence of
imperfect information experienced by these shareholders in relation to making qualified decisions.
Reducing these costs requires designing a range of contractual mechanisms, such as corporate boards,
which in turn lead to aligned interest between the management and those of the stockholders.
Therefore, taking an agency perspective, the board’s main focus is to monitor the actions of
management (Desender, 2009).
The board of directors is said to perform two functions: To monitor and provide resources. Agency
theory provides the theoretical underpinning of this monitoring function, describing the likely
conflicts of interest caused by the separation of control and ownership in organisations. The board’s
primary function is to monitor the actions of managers (agents) so that the interests of owners
(principals) may be protected (Eisenhardt, 1989; Jensen and Meckling, 1976 cited in Desender,
2009). The board’s monitoring task is important since potential costs are earned as management
carries out its own interests to the detriment of shareholders’ interests. Agency costs, which are
66
intrinsic in the separation of control and ownership, are reduced through the monitoring stance of
board of directors (Fama, 1980; Zahra and Pearce, 1989 cited in Desender, 2009).
Researchers argue that boards comprising mainly insiders or even outsiders who do not enjoy
independence from the firm or the current management are less incentivised to monitor management
due to their dependence on the CEO or the organisation. Boards subject to outside, non-affiliated
directors are perceived to monitor better because of lack of this deterrent to monitor.
According to Jensen and Meckling (1976, cited in Laiho, 2011), the ownership structure is important
not only in terms of how much the firm insiders own, but also in terms of the extent of concentration
held by the holdings of the outside shareholders. It is argued that large shareholders are better able to
monitor the management compared to small shareholders. This is because large shareholders
internalise larger aspects of the monitoring costs and possess sufficient voting power in corporate
decisions. Small shareholders, on the other hand, are only able to influence corporate decision
making at a minimum basis. Because small shareholders have little influence on decision making, the
managers then hold the control of the firm, who possess both the opportunities and incentive of
misusing their position. It is therefore concluded that corporate performance would be adversely
affected by the ownership-control separation (Laiho, 2011; Hamdani and Yafeh, 2010; Leech, 2001).
Laiho (2011) states that a more effective monitoring takes place through a more concentrated
ownership in the form of large shareholders. Effective monitoring has two significant obstacles that
may be solved by large shareholders: staying informed to enable reaping sufficient benefits towards
exceeding the costs of obtaining the needed information; and possessing an adequately large share of
the votes in order to influence corporate outcomes (even in circumstances of minority holding). Small
shareholders, on the other hand, have difficulty carrying this out collectively as they are only able to
internalise a small aspect of the potential gains and endure free-rider problems. An agency problem
identified here is therefore the incentive of large shareholders to gain private benefits at the detriment
of the small shareholders (Laiho, 2011; Kaisanlahti, 2002; Bebchuck, 1999).
Moreover, control by a large minority shareholder takes place if wide distribution of the remaining
shares is carried out amongst a mass of small shareholders where the outcome of a vote is likely
determined. Generally, it is likely that the small shareholders’ votes are cancelled out, to which the
power of decision is given to the large blockholder (Leech, 2002; Means, 2008).
67
It must be noted that the idea concerning the impact of ownership structure on firm performance is a
question that relates to managerial incentives as well as to those of the owners’ and the ability of both
of them to control the decision-making stances of the firm. Control in the form of voting rights,
which is linked to ownership; naturally take place as a factor because it ascertains whether the firm
can be coerced by shareholders to do their bidding (Laiho, 2011).
A position of fundamental authority is enjoyed by shareholders as owners of the firm, paving the way
to certain rights in relation to their assets. These rights include decision-making through voting at
firm meetings and the right to income from firm assets, amongst others; giving rise to maintaining
relationships with the firm. According to Leech (2001), the costs relating to an individual shareholder
will be outweighed by the private benefit that accrues to this shareholder, which in fact is caused by
correcting management failure subsequent to shareholder action. This assumption can be made of
large shareholders but may be considered questionable when applied to small shareholders whose
role is very small; however, such assumption may be made as a formality covering both small and
large shareholders (Leech, 2001).
Nevertheless, shareholders are collectively composed of a voting body that undertakes collective
decision making where each member holds a different number of votes based on his/her holding.
This comprises the analysis of formal voting power accrued to shareholders, alongside firm control.
Shareholder power in this occasion may be defined according to the result of a hypothetical division
as the member’s ability to sway any alliance of players. Shareholder power may therefore be
considered important to corporate governance even in the absence of large concentrations of share
ownership since dispersed power is not necessarily the implied outcome of dispersed ownership
(Leech, 2001).
The study of Hamdani and Yafeh (2010) looks into the role of corporate governance in the market
with prevalent concentrated ownership. When controlling shareholders exist in a firm, only a limited
role can be played by minority shareholders in corporate governance. It is suggested that the absence
of conflict of interest rather than minority shareholders’ legal power for institutions to be able to
undertake their corporate governance role. The idea whether firm performance makes a difference to
ownership structure is put forward by Laiho (2011). The agency theory serves as the starting point of
the analysis where it is predicted that firm performance improves with higher levels of managerial
ownership structure, and this is caused by incentive effect. It is also suggested that dominant owners
68
might extract the firm’s resources at the expense of other shareholders due to high ownership
concentration. Laiho (2011) also infers that the role of ownership structure may also be analysed
besides agency costs that managers generate. It is assumed that there is a propensity for high-
ownership owners to use their position to obtain private benefits. These benefits include takeover
defence for insiders and consumption of the firm’s goods. If adverse effects are generated by these
benefits on firm performance, there is a possibility for ownership concentration to hurt performance.
It boils down to the idea that not only does agency problem exist between owners and managers
because the same terms can govern the relationship between large and small shareholders. It must be
noted that the idea concerning the impact of ownership structure on firm performance is a question
that relates to managerial incentives as well as to those of the owners’ and the ability of both of them
to control the decision-making stances of the firm. Control in the form of voting rights, which is
linked to ownership; naturally take place as a factor because it ascertains whether the firm can be
coerced by shareholders to do their bidding (Laiho, 2011).
In the work of Bebchuck (1999, cited in Laiho, 2011), a theory of ownership concentration is
designed based on the controlling owner’s potential private benefit extraction, demonstrating that this
decision is dependent to the size of the private benefits of control. In cases of large potential private
benefits, the initial owner holds an incentive to capture the benefits and bar potential outsider
takeovers. Bebchuck’s model suggests that ownership concentration tends to be higher in countries
with large private control benefits and likewise explains the reason why low ownership concentration
occurs in some countries. Moreover, Laiho notes that small shareholders are less likely to monitor the
management than do large shareholders as the latter is able to internalise a larger part of the
monitoring costs and also possesses adequate voting power in influencing corporate decisions.
It is also significant to consider that the rights of minority shareholders, according to recent research
on law and finance, are broadly impacted by the legal tradition, creating an economic impact on the
ability of the firm to increase outsiders’ equity capital (Kaisanlahti, 2002).
The vulnerability of minority shareholders is emphasised in some research, whereby little regard for
incorporation’s ex-ante motivations is looked into. It is said that majority of shareholders are placed
on enhanced fiduciary tasks expected of partners, acting towards the close corporation as a
partnership garbed in corporate shape. This approach omits the differences between partnerships and
corporations, whereby uncertainty is created in terms of whether the corporate shape will be
69
honoured or whether the corporation is to be served by the majority so that the interest of the
minority may be addressed (Means, 2008).
3.3 Corporate Governance and Market Competition
There is scarce evidence on the interaction between corporate governance and product market
competition (Keasey et al., 2005; Allen and Gale, 2000). The evidence states that firm performance is
enhanced by the level of corporate governance and product market competition. In a particular study,
the degree of market competition is said to be linked to high productivity growth. In addition, it is
concluded that competition may be seen as a substitute mechanism to internal control (Keasey et al.,
2005).
The study of Nickell (1996) illustrates the improvements in productivity development through
product market competition, whereas Robinson and Hou (2006) give evidence for the higher returns
of competitive industries as compared to concentrated industries. The shareholder rights are
distributed in a different proportion in each industry with some industries having greater rights than
others, as Johnson et al. (2009) has stated. Once the industry effects are controlled, those firms that
have stronger rights of shareholders gain no abnormal benefits than those that have weaker rights.
The measurement of quality of corporate governance through the entrenchment index of Bebchuk et
al. (2009) gives consistent results. Hence, quality of governance is affected by the characteristics of
the industry. Those corporations that belong to competitive industries possess better structures of
corporate governance according to Karuna (2007) who measures industry level competition. He
states that managers in competitive industries need to be monitored closely as they have the
discretionary power to come up with competitive strategies for their firm.
Nevertheless, it has been found by Cremers et al. (2008) that shareholder rights are weak in
competitive industries, and that it is the long-term relationship with customers that creates the
industry effect on corporate governance. Customers face problems when they have to change their
service providers in case service providers are taken over by some other organization. This is
especially true for the firms of competitive industries as they have long-term associations with their
customers. Hence, the customers concern of survival is lessened by the firms through shareholder
provisions that limit the rights of shareholders.

70
Guadalupe and Pérez González (2010) have carried out a fairly similar study which shows indirect
support for the impact of industry features on the quality of corporate governance. Their study used
publicly traded data of 19 countries and revealed that low private benefits of control come about
through high competition. The executives and owners in a domestic industry attain fewer benefits for
themselves being in charge of their corporations when the global market poses strong competition.
The evidence from literature indicates that corporate governance is improved through competition
and hence decreased benefits are considered to be a sign of efficient governance structures.
Better transparency of information for firms in the same industry and the top management’s fear of
bankruptcy create the impact of competition on corporate governance as Guadalupe and Pérez-
González have concluded. Past literature offers these two major theories with respect to the influence
of product market competition on corporate governance. However, there has been no study so far
which gives concrete evidence that explains the effect of competition on management in the most
accurate manner.
Hopt et al., (1998) state that one may see that market competition can be substituted by tight
corporate governance. A well-functioning corporate governance system would be expected in an
economy with little market competition since overcoming the lack of market competition necessitates
tighter discipline. In contrast, it is also reasonable to assume a complementary status between
corporate governance and market competition, which has been described also by Keasey et al.,
(2005).
Van Frederikslust et al., (2008), alternatively, point out that intensive competition in product markets
leads to a possibility of the mode of corporate governance becoming less important. Competition
compels firms to adopt efficient governance structures apart from cost minimising methods of
production. Slack firms will be driven away from the market by more efficient firms who will steal
business from them. In the long run at least, upon entry facilitation, inefficient structures are
eliminated by this selection effect of competition, where effective governance is eliminated.
Eventually, the forces of competitive markets may simultaneously determine the mode of corporate
governance (Van Frederikslust et al., 2008). It must be noted that the proper functioning of a market
economy may require the presence of an effective corporate governance system within each
individual firm and the economy as a whole (du Plessis et al., 2011).
71
Moreover, it is important that a framework be adopted in order to understand how economic
performance and firm behaviour are affected by corporate governance. A principal-agent relationship
in corporate governance takes place when a person owning a firm is different from the one who
controls or manages it; hence, a separation between ownership and control exists. However, firms
must be provided with incentives by product market competition in order to employ the most
efficient mechanisms of corporate governance. Market participants are needed to address the
continuous occurrence of slack firms being replaced by more efficient firms rather than justifying
public intervention. Hence, market responses to institutional inadequacies are through recent
managerial labour market developments, such as corporate control market (McCahery, 2002).
Alternatively, the market failures taking place from asymmetric information within the realm of
corporate governance cannot be solved by competition alone. It is important to note that several
factors may influence the effectiveness and form of various systems of corporate governance, and
product market competition is one of these (McCahery, 2002).
In a study of Januszweski, et al., (2002), they find out that firms tend to experience higher
productivity growth when they operate in markets with intense competition. Moreover, higher
productivity growth is indicated for firms controlled by a strong ultimate owner, but this is not the
case however if the ultimate owner is a financial institution. The authors also suggest that tight
control and competition are complementary, which has been mentioned also earlier by Keasey et al.,
(2005) and Hopt et al., (1998), which means that a strong ultimate owner enhances the positive effect
of competition.
According to Kole and Lehn (1997), firms surviving in the competition are assumed to have optimal
governance structures. Those who are not able to adapt their governance structures to changes in the
business environment are likely to lead to demise, resulting in a “natural selection of efficient
organisational forms” (p. 421). There is little research about how governance structures evolve –
whether they are stable or change over time; whether they adapt to sudden changes in the business
environment and how quickly if so. There is limited understanding of these issues at present (Kole
and Lehn, 1997).
In their study, Giroud and Mueller (2011) indicate that firms with weak governance in non-
competitive industries tend to have lower firm value and equity returns. The causes of the efficiency
72
are examined, and the authors find lower labour productivity and higher input costs taking place
amongst firms with weak governance, but this occurs in non-competitive industries only. It is also
found out that activist hedge funds are more likely to target firms with weak governance in non-
competitive industries, indicating that investors work on mitigating the inefficiency. Next section
will shed some lights from the literature on the possible relationship between corporate governance
and cartel formation.
3.4 Corporate Governance and Cartel Formation
There are different types of illegal activities such as collusion between agents and supervisors (e.g.
between auditors and management or regulators and regulated firms), large scale frauds (including
financial ones), illegal trade such as of arms, people trafficking and drugs, where at least a buyer and
a seller frequently interact, and long term corruption (where at least two parties are continually
involved, a bribery and a bribe). All these illegal activities lead to tremendously high social costs to
the society (Spagnolo, 2004). Cartel would also be considered an illegal activity involving many
agents thereby describing it as a type of organised crime, but not the most detrimental. The incentive
structure of all these activities that is made for all the agents who are part of it is similar to that of
cartel (Gonzalez and Schmid, 2012).
It is the main aim of managers to make profits and they are accountable to shareholders for their
performance. There would be increased profits if cartel participation is successful. This is because the
firm would be able to raise the price at more than competitive levels of pricing. The profit is
increased because the margin between price and marginal cost is increased. Since there is low
visibility in the actions of managers from shareholders, the managers have the most advantage in this
classic cartel formation. Both shareholders and managers get the advantage of being part of a cartel
as share value of the firm rises through increase in earnings of the firm. As per the remuneration
system of the firm, the managers also receive part of the increase in earnings. Moral hazards could be
a reason for formation of cartel; this is because incentives might not be aligned since between the
agent and the principal, the costs and benefits are not allocated equally. (Spagnolo, 2005 and 2007)
According to Gonzalez and Schmid (2012), the board of directors and the CEO have direct
involvement in their firms’ potential collusive price fixing agreements. Hence, it is pondered whether
a significant relationship exists between corporate governance and the probability for a firm to
73
participate in a cartel. In particular, collusive agreements and hard-core cartel membership may be
facilitated or prevented by certain corporate governance structures, which is seen in such examples as
weak board of directors, strong performance-based incentives received by top managers, and top-
level high concentration of power.
Gonzalez and Schmid (2012), infer based on theoretical research that a firm’s decision to participate
in a cartel is influenced by potential profits from price fixing as well as problems on management
incentives. Using samples of U.S cartelist firms within a period of 1986 to 2010, the study made an
empirical investigation of the relation between the probability of cartel participation on one hand, and
a range of corporate governance and other firm and market characteristics, on the other. The results
indicate that it is likely for large and mature firms in concentrated industries to engage in cartel
participation. There are however no findings between cartelistic behaviour and corporate governance
despite the significant relationship between a few corporate governance mechanisms. Moreover, top
executives tend to carry out a significantly higher portion of their exercisable options during
collusive behaviour than what CEO and executives of benchmark firms exercise (Gonzalez and
Schmid, 2012). Gonzalez and Schmid offer a discussion that provides an important insight on firm’s
participation in a cartel, which is contributory to this research.
In the study of Buccirossi and Spagnolo (2007), it is pointed out that factors of corporate governance
play a critical role in ascertaining a firm’s behaviour towards competition as well as in identifying the
key players in its judgement to take on an anti-competitive behaviour. The focus of their study is to
investigate the relationship between corporate governance and how cartel are formed, as well as the
manner in which factors of corporate governance impinge on the optimal implementation of antitrust
law against cartel (Abreu et al., 1985).
Buccirossi and Spagnolo (2007) define corporate governance as institutional arrangements intended
to keep under control the agency problems of a firm and to lead managers to prioritise the pursuit of
shareholders’ interests rather than their own. They infer that competition acts as the main force
disciplining firms by maintaining their responsiveness to the markets, encouraging them to employ
competent practices and to maximise efficiency. Amongst the means through which corporate
governance and performance may be improved by product market competition are firm selection,
efficient firm management, relative performance evaluation, and rents reduction. The authors suggest
that managers are forced by effective competition to take on efficient firm management to ensure that
74
the firm survives in the competition and hence avoid the possible loss of their jobs. This point
provides an insight that there is a direct relationship between management performance and firm
survival (Buccirossi and Spagnolo, 2007).
Further Buccirossi and Spagnolo (2007) state, that important strategic impacts are placed by contracts
with third parties. These contracts refer to corporate governance variables, such as financial
arrangements and incentive systems for managers. Accordingly, research indicates that decisions for
cartel formation typically begin at the highest level of the firm hierarchy, which are then
implemented through issuance of instructions to lower level management hiding the collusive
arrangement.
According to Lin (2001), corporate governance is said to comprise market competitiveness as an
external mechanism. Full nationwide competition might be obstructed by several administrative
barriers which in turn constrain product market competition. The dominance of state-owned firms
taking over a particular market mirrors an oligarchic structure. Massive market power is enjoyed by
these large conglomerates, which can possibly lead to cartel operation (Lin, 2001).
In contrast, Larcker et al., (2007) deal with the fact that no consistent set of results had been
produced for the empirical research studying the link between measures of corporate governance and
a range of economic and accounting outcomes. They believe that this is in part attributed to the
difficulty in generating reliable measures for corporate governance. The authors find out through an
exploratory principal component analysis that corporate governance has 14 dimensions and that these
indices are associated with abnormal accruals. Moreover, the findings indicate slight relation to
accounting restatements but can explain future operating performance (Larcker et al., 2007). This
research is useful to the topic under study since it provides insights on the internal organisation of the
firm, specifically economic and accounting areas, which are attributes of corporate governance. The
importance of these outcomes is seen in the firm’s ultimate decision to enter into a cartel.
Moreover, there is evidence showing the influence of corporate governance and firm-level
competitive behaviour. First of this is the fact that a substantive role is often assumed by the board of
directors in the strategic decision-making process of the firm, as shown by management research
literature (Judge and Zeithaml, 1992). Second is the fact that a firm’s competitive behaviour is
influenced by two ultimate drivers (Chen, 2008; Chen et al., 2005): The motivation of the firm to

75
involve itself in competitive pursuits, and its capacity to do so. Subsequent to this logic, corporate
governance mechanisms have a range of elements affecting a firm’s motivation and capability to
pursue competitive actions.
Agency theory states that managers possess a certain degree of economic self-interest that may not be
consistent with those of the owners (Fama and Jensen, 1983). This would lead the firm to take sub-
optimal strategic actions since the managers’ personal motivations are misaligned with the
shareholders’ economic interests (Eisenhardt, 1989).
On one hand, it is a reasonable stance to anticipate that effective corporate governance, which in
significant aspects serves as an agency remedy, should offer assistance to the firm to undertake
optimal strategic actions to achieve sustainable competitive advantage. On the other hand, the board
of directors serves as a corporate governance mechanism that plays a unique role. The board’s
advisory and service functions indicate that the board of directors can function as an important
organisational resource, which can affect directly the firm’s capability to carry out competitive
actions (Chatterjee and Harrison, 2001; Mace, 1986).
If board of directors and other mechanisms of corporate governance have the ability to influence the
way in which firms compete, there are certainly various aspects of corporate governance influencing
the competitive behaviour of the firm. Consequently, if agency remedies perform effectively, optimal
competitive actions undertaken by effective managers must be expected, considering the presence of
favourable strategic opportunities (Hutchinson and Gul, 2004). In addition, the board of directors can
function as supplementary means to enhance the firm’s capability since directors have valuable social
and human capital that is deployable by the firm in its quest to engage in competitive actions
(Hutchinson and Gul, 2004).
The insufficiency of explaining the occurrence of collusion cannot be addressed by limiting
competition since collusion is more difficult than what can be assumed. Cartel is by nature
changeable because they constructed the incentive to cheat. In terms of increased market power,
cartel might be surpassed by long-range contracts with tacit oligopolistic collusion if these cartels
involve important external competitors or are besieged by internal competition (Fear, 2007).
76
Fear (2007) has presented a discussion on cartel and its nature, and the corresponding corporate
governance embodying it, making the study relevant to this research. Fear’s stated that the cartel
issue had always involved certain assumptions about business behaviour, trust, and reputation,
amongst others. These assumptions finally led to economists wrestling with industries’ implications
that are beset by fixed costs and competitive behaviour. The way economists wrestle with these
implications is by debating trust and cartel formation as they raised issues about corporate
governance; such as the issue on the social impact of big businesses and the issue of ownership-
control separation.
3.4.1 The CEO and Cartel Formation
The management of the organisation is required to enforce cartel agreements (Spagnolo, 2005) and
the decision to actually form the cartel is taken by the top management (Harrington, 2006c). The
CEO, Board of directors and top management are all involved in the collusive price fixing
agreements, which are formed by their firms as part of the corporate governance discussions. Hence,
it is necessary to understand whether the corporate governance within a firm helps determine if a
cartel should be formed. Many organisations may not want to carry out this hard-core activity and
establish collusive agreements. Cartel participation increases if the board of directors is weak; if most
power is exercised by the top management level; and if the incentives provided to the management
depend on their performance levels (Spagnolo, 2005).
When cartel is formed, senior managers benefit from it through bonuses and stock options. These are
both kinds of financial benefits which in turn assist in collusive activities and its maintenance
(Buccirossi and Spagnolo, 2007). Thus, according to studies conducted recently, it is through senior
management that the decision of being part of a cartel is made (Harrington, 2008).
Thépot (2011) stated that when there is more effort required from an agent, there is more motivation
to find an alternative in its place and that would be forming cartel. So if shareholders want to reduce
the motivation of managers to be part of cartel, they would have to decrease those benefits that lead
to the alternation of efforts through collusion. This method affects those issues that are related to
certain remuneration packages such as allocation of stock options. Also it affects the welfare that is
not considered when the whole system does not consider agency relations and the factors causing

77
collusion. Thus opportunism occurs due to the fact that a manager has natural incentives to alternate
illegal market conduct for effort (Ibid, p 5).
According to Gonzalez and Schmid (2012), the board of directors and the CEO have direct
involvement in their firms’ potential collusive price fixing agreements. Hence, it is pondered whether
a significant relationship exists between corporate governance and the probability for a firm to
participate in a cartel. In particular, collusive agreements and hard-core cartel membership may be
facilitated or prevented by certain corporate governance structures, which is seen in such examples as
weak board of directors, strong performance-based incentives received by top managers, and top-
level high concentration of power.
It is worthy to note that a more competitive attitude is induced amongst managers by stock-based
incentives because these incentives link the present compensation of managers to the expectations of
stock markets on the future profitability of the firm. When there is breaking of a tacit collusive
agreement and competitors happen to detect it, the negative effect of the breach is anticipated by the
stock market, specifically the effect on the future profitability of the firm, which is linked to the
impending price-war period. The result is that the negative effect is right away discounted on the
stock price, leading to managers’ reduced short-run gains from deviation. It is important to note that
cartel may be strongly destabilised by stock-related compensation, leading managers to provide
extensive emphasis on short-range results. It may be expected that this would result in destabilising
cartel through increased valuation of short-term gains by managers from their unilateral defection.
Such defection is from collusive strategies associated with prospective long-term losses. Note that
these losses are caused by the price wars set off by defections once found out by members of the
partner cartel (Buccirossi and Spagnolo, 2007).
Buccirossi and Spagnolo surmise that considering a firm’s financial performance, a period of five
years may be viewed as short-term, but for cartel having five years average estimated duration, a
five-year period is considered long. Hence, the stock-based compensation tends not to be deterred by
short-termism, which means that the firm managers’ short-term objectives are adequately long-term
when cartel’ average life span is considered. A high discount rate on future costs are even taken by
managers as these costs are indicative of defecting from the cartel scheme and may be too large to
become significant in present value. This would mean discouraging defections despite the short term.
Ironically, large stock-related incentives cannot guarantee competitive behaviour and may in truth
78
likely to smooth the progress of collusive behaviour by enabling stability amongst cartel (Buccirossi
and Spagnolo, 2007). This assertion only supports the common knowledge that the manner in which
firms must organise their relationships with each other is not at all based on pure competition but by
cartel formation and promotion (Hopner and Krempel, 2004). Buccirossi and Spagnolo have
provided a useful and insightful discussion on the relationship between corporate governance and
cartel formation, which is relevant to the topic being studied.
The study of Aubert (2007) harmonises with that of Buccirossi and Spagnolo as both have focused on
managerial effort incentives as well as their relation with cartel formation. Aubert examines how
managers’ incentives to collude interact with their incentives. The firm’s competitive strategy is
privately chosen by a manager along with exerting efforts to enhance productivity; and his pursuit to
increase profits may lead him to replace effort with collusion. The idea is that it would be more
attractive to participate in a cartel through high profit targets such as in the form of strong effort
incentives. The study point out that to neglect the issues on internal incentives is to underestimate
welfare losses due to cartelisation. Even in the absence of collusion, the new cost of potential
collision (internal inefficiencies in firms that collude and compete) involves fostering internal
efficiency by benefiting from antitrust intervention (Aubert, 2007).
Aubert’s findings indicate that managers can be prevented from colluding by providing them with
weak incentives so that they may exert effort, when antitrust sanctions cannot be expected to deter
sufficiently. This suggests that collusion enables saving on effort, which is considered more preferred
for high-effort levels, considering the marginal cost of effort in its increasing stance. Owners
decrease the gain obtainable by managers through collusion by decreasing the target profits or the
demanded level of effort. In an attempt to avoid cartelisation, sacrificing internal efficiency can thus
be resorted to by owners. It means that social losses may be generated from the potential of collusion
by managers, which is caused by inefficient levels of effort despite the firms’ non-collusion in reality.
In contrast, firms in favour of cartel formation needs to also request low effort levels that are
considered inefficient so that deviations from cartel agreement may be deterred. It is worthy of
mention here that when it becomes attractive to collude, so is it to deviate, since deviating would
allow the firm to have more savings especially on the cost of effort, i.e. during high profit targets.
Hence, albeit colluding to save on effort is the natural incentive of managers, it would be difficult for
colluding firms to induce effort once they have considered all incentive issues. Inefficiently low or
high levels of effort are in fact always requested by colluding firms; whilst this is not the case for

79
competing firms who may take on efficiently full operations as long as there are high enough
individual sanctions. Apart from effort distortions, an information rent must be paid by colluding
firms to managers, which may also be done by competing firms in the presence of very low expected
individual sanctions (Aubert, 2007). Aubert’s study is related to this research report as it tackles
collusion, managerial effort incentives, and cartelisation and can thus contribute to addressing the
identified set of hypotheses.
Burhop and Lubbers (2008) conduct an analysis on how productive efficiency is impacted by
cartelisation and managerial incentive schemes, with particular focus on coal mining corporations in
Ruhr district, Germany. It is found out that product efficiency is not affected at all by cartelisation.
The authors claim that only when corporate governance variables (e.g. the quality of corporate
governance; proxies for product market competition) are taken into account can the impacts of cartel
formation of productivity be fully justified. This is seen in the idea that managers must be motivated
if there is asymmetric information between managers and shareholders. Product market competition
is influential to how these managerial incentives must be optimally designed; the underlying idea is
that designing incentives optimally becomes difficult if managers view monopoly profits as those that
result from their own efforts, which would lead to a more diffused signal received by the principal
(owner of the firm). Further, firms’ bankruptcy risks are reduced by low market competition, which
hence leads to the likewise reduction of managers’ lay-off risk, and which might lead to reduced
managerial effort and firm efficiency. However, managers still exert effort on the firm if they receive
a share of the profit. Since low market competition involves higher marginal return of managerial
effort, managers would resultantly increase their effort, which would essentially lead to a
corresponding increase in the efficiency of the firm. Similarly, the principals can enable
counteracting the negative correlation between market power and bankruptcy risk through the
selection of the firm’s financial structure. Moreover, the debt-equity ratio increases vis-a-vis
bankruptcy risk; hence, increasing debt in relation to equity can be carried out to counteract the
effects of market power on the managerial effort. Therefore, it is when variables of corporate
governance are considered can the impacts of cartel formation on productive efficiency be fully
explained (Burhop and Lubbers, 2008).
Burhop and Lubbers state that if managers prefer a quiet life than the difficult profit-maximising life
offered to them, lower productive efficiency would be demonstrated by cartelised firms in which they
are connected. This hypothesis is tested by the authors by using data from coal mining corporations
80
covering a period of 32 years through a stochastic frontier model. The findings suggest that cartel
membership does not have a significant effect on the productive efficiency of these corporations.
Productive efficiency is not also affected by a high-debt equity ratio; instead, it demonstrates higher
rates in firms’ offering of large bonuses to their board members. This only suggests that it is more
important to uphold compensation schemes than consider competitive pressures from product
markets when productive efficiency is taken into account; neither is the higher bankruptcy risk of
high-leverage firms more important than compensation schemes when considering such efficiency.
When corporate governance variables are controlled, it is found out that significant correlation exists
between stronger managerial incentives and product efficiency (Burhop and Lubbers, 2008). Burhop
and Lubbers’ study provides substantial insights relevant to this research and likewise enlightens the
reader on several relationships governing corporate governance.
A study by Han (2010) examines short-term and long-term employment contracts and their effects on
cartel stability. The study shows that firms are more likely to be involved in cartel agreement when
CEO tenure (short-term employment contract) is low or when CEO turnover is high. Han shows that
a short-term contract provides stability to a cartel formation more than a long-term contract. If a
certain profit margin is achieved, only then is the short-term contract renewed. With the help of this
activity, firm performance is enhanced and defection from the collusion has taken place, which
diminishes the chances of being laid off. Firm performance may be hindered due to any kind of
future punishment potentials which is why the chance of being laid off increases. The stability of
cartel is influenced by these re-employment trade-offs which are tangled with the monetary trade-
offs. A long-term contract does not affect stability when the fixed salary components are applied. The
fixed components affect the short-term contract to an extent. Cyclical collusive pricing also takes
place due to the short-term renewable contracts that may be extended after a certain period of time. It
is also observed that equity-financed firms are not able to provide as much stability to cartels as much
as debt financed firms.
3.4.2 The Shareholders and Cartel Formation
As discussed earlier in this chapter, when cartel is formed the senior manager benefit from it through
bonuses and stock options (Spagnolo, 2005). The agency theory perspective holds that corporate
governance has a clear implication of establishing adequate control or monitoring in order to protect
shareholders from the conflict of interest occurring in the management. Eisenhardt (1989) clearly
81
states that the conflict occurs when the goals of principal (owners) and the agents (managers) are
different and it becomes costly for the principal to actually verify the activities of the agent.
However, being part of cartel is sometimes an advantage to the whole firm which includes
shareholder regardless to the consequences of forming cartel and discovering it by the legal authority,
this lead us to the question “what are the conditions under which cartel formation might be in the
interests of shareholders ” ?
According to Thépot (2011) there are two reasons for the interest of the owner in being part of
collusive activity. One reason is that shareholders might be encouraged to give an agent benefits to be
part of such activity due to certain corporate governance issues. Another reason is that collusive
activity is an advantage to the whole firm as it increases earnings. It has been mentioned earlier as
well that being part of cartel is an advantage to the whole firm and is therefore of interest to the
owners. However, at times, managers might not benefit from cartel formation, which is why such
illegal activity could be due to the owners’ own motivations (Mullin and Snyder, 2005).
Through these illegal activities, the aim of increasing expected return can increase the shareholders’
wealth. This is through the way that due to decrease in firms’ risk and/or rise in expected return, the
value of the firm’s shares increases. Thus, there are two ways through which shareholders receive
advantage from such unfair activities, expected-return increases and reduction of risk (Cloninger,
1985).
In a study of McAfee, Vincent, Williams, et al. (1993), it is found out that the collusive agreements
of hostile takeover bidders had no significant effect on the target’s price. A welfare analysis suggests
that social benefits can be accrued to a positive probability of cartel formation; however, the same
may or may not be beneficial to the target’s shareholders. This provides useful insights on the
prevailing policy debate relating to collusive agreement regulations. However, Davis and Thompson
(1994) identify the conditions where shareholders’ interest is considered in cartel formation:
engagement in shareholder rights, CEO selection, determination of executive remuneration, and
decision-making processes. According to them, activist shareholders expand their demand from
merely engaging in shareholder rights, to such concerns as choosing CEOs as well as determining
how much executives are paid.
82
Geradin (2004) offers another set of conditions where shareholder interest might be considered in
cartel formation. He points out that these conditions are: the position to claim for compensation in
such event that a cartel is successful in excluding a firm, and to oversee a proceeding to correct the
wrong, which is an exclusive interest of shareholders. He states that in cases that a cartel aims at a
new market entrant and has been successful in excluding a firm, claiming for compensations will not
be a position of anyone in the absence of shareholders. Bringing proceedings to correct the wrong
may only be an interest exclusive to shareholders. This is aligned to the idea that shareholders are in
effect active owners of the firm whereby they take part in its top decision making (Leech, 2001).
3.5 Theoretical Background
The empirical investigation in this research builds explicitly upon agency theory in order to
understand the empirical relationship between corporate governance structure and cartel formation.
3.5.1 Agency Theory
The Agency Theory is based on the modern corporations and how the principles or owners of the
corporations are separated from the agents who are the managers. In the modern organisation,
management is not carried out by the shareholders but is diversified to other agents. These agents are
responsible for the daily operations of the organisation. It is due to this separation of ownership and
control that several issues may arise within the organisation. Resolving these issues may prove to be
costly for the shareholders (Jensen and Meckling, 1976 Eisenhardt, 1988). The basic problem
associated with agency theory is that the management who is responsible for control is involved in
pursuing self-interest. The manager is only motivated to provide extra ordinary efficiency levels
when he is provided with some kind of personal gain. They pursue their personal interests and not the
interests of the organisation or the shareholders. For instance, they may be attracted towards the
purchase of comfortable and expensive office equipment only because the cost is borne by the
owners and they would reap the benefits (Eisenhardt, 1988).
The agency theory perspective holds that corporate governance has a clear implication of establishing
adequate control or monitoring in order to protect shareholders from the conflict of interest occurring
in the management. Normative recommendations are directed to the concept that different persons
should occupy the positions of independent directors and of the chairman and CEO. The agency
theory is in contrast with the stewardship theory, which views that managers are essentially
83
trustworthy and manage efficiently the resources that the firm has entrusted to them (Nicholson and
Kiel, 2003).
Hence, it is the basic concern of the shareholders that the management is motivated enough to not
only pursue their own interests but also increase shareholder wealth. Eisenhardt (1989) clearly states
that the conflict occurs when the goals of principal (owners) and the agents (managers) are different
and it becomes costly for the principal to actually verify the activities of the agent These principals
do not have the ability to efficiently monitor the activities of the agents (Jensen and Meckling 1976).
When the management is engaged in pursuing self-interest, the costs of the organisation increase
since the decisions are not efficient and the formation of contracts is not relevant to shareholder
wealth. Hence, the earnings of the organisation are highly affected by this problem (Leuz et al.,
2003).
A proposal has been brought forward by Fama and Jensen (1983) to resolve the issue of agency costs
due to the separation of ownership and control. They believe that by introducing two separate
programmes of decision management and decision control, it would be possible to resolve the
problems. The opportunistic behaviour that is carried out by the management can be contained by
introducing the corporate governance mechanism (Fama, (1980), Fama and Jensen (1983),
Williamson (1988) and Shilefer and Vishny (1997).
This mechanism should be based on internal and external controls to have a reduced effect on agency
costs (McKnight and Weir, 2009). With the help of these internal and external mechanisms the
principal and agent goals can be aligned along with reducing the costs and increasing shareholder
wealth (Weir et al., 2002; Roberts, 1985; Davis et al., 1997). Many authors, including Demsetz and
Lehn (1985), believe that corporate governance not only aims to improve the performance of the
organisation but also monitors the management behaviour and enhances the efficiency of the
financial reporting process. This concept has the ability to mitigate the costs associated with
management self-interest and align the managers’ interests with the shareholders’.
Thepot (2011) examined the relationship between leniency policy and individual liability - two
instruments on competition policy enforcement. Such examination is done by analysing the interplays
amongst the cartel members and the interplays within each firm. A two-dimensional system serves as
84
the transformation of these instruments; namely, the horizontal dimension, which the cartel members
themselves have formed; and the vertical dimension, which the interaction of cartel members has
constructed. The basis of analysis is the theory of the firm, where their ownership-control separation
is upheld, as well as the agency theory, which is based on the assumption of the inevitable problem of
moral hazard between the owner and the manager. The argument is pursued along the literature on
collusive agreements, individual liability, and leniency policy. Insights on corporate governance vis-
a-vis cartel are also carried out by the economic literature using game theoretical approaches.
Theoretical insights will aid in understanding the link between cartel activity on one hand, and
agency and governance issues on the other (Thepot, 2011). Thepot has provided a useful discussion
for this study as he links the interaction between cartel and corporate governance, making it relevant
to the topic being investigated.
Many authors have also suggested that corporate governance is not as effective and that alternate
strategies of control such as performance evaluations, audits, etc., should be introduced. This would
not only monitor the activities of the organisation but will also reduce agency costs associated with it
(e.g., Davis et al., 1997). However, to implement efficient governance practices, it is essential that
the board members are independent in making their decisions and have no personal contact with the
management. The board should consist of non-executive directors (NEDs) to handle all management
issues. A separate officer should be assigned for this purpose of aligning the interests of the
management and the shareholders’ (Donaldson, 1990; Dalton et al., 1998; Coles and Hesterly, 2000;
Daily and Dalton, 1997).
Many of the researches that have been found highlighted the importance of agency theory in the
study of corporate governance. The earnings management practices of the firm and the role of the
board of directors are very much related to governance mechanisms (Xie et al., 2003; Kao and Chen,
2004; Davidson et al., 2005; Benkel et al., 2006 and Goodwin et al., 2009).
To carry out an effective decision control system, establishing an audit committee is important. This
would help in the internal monitoring system of the organisation (Fama, 1980 Fama and Jensen,
1983). It is not only the internal monitoring that is important but also the external auditing process
that requires a committee (Bradbury et al., 2006) and integration of NEDs (Fama, 1980; Anderson et
al., 1992). The governance mechanisms have been found to be much more efficient and cost effective
than the process of takeovers (Fama, 1980). The management interests should be pursued along with

85
the interests of the shareholders to make sure that the organisation prospers (Davis et al., 1997; Tosi,
et al., 2003).
The external audit members are to be independent from the firm so that he may reduce the problem
of information asymmetry in financial reporting. This would then reduce the agency costs associated
with the monitoring process (Poit, 2001). Hence, with the help of monitoring and good governance
practices it is possible to reduce any kind of fraudulent behaviour that may take place in the
organisation. Agency theory and external auditing are two of the most important mechanisms of
corporate governance practices. Both have the ability to reduce the agency costs and any kind of
opportunistic behaviour that may arise from within the management (Watts and Zimmerman, 1986).
The monitoring activities are in behalf of the shareholders and the independent auditors ensure that
neither the management nor the owners pursue only their self-interests.
Taking agency theory into consideration, the cartel may be indicative of an agency problem. As a
consequence, enhancing corporate governance should result reduced practice of the cartel formation.
Given these agency assumptions, independent variables will be identified with the aim of detecting
associations between corporate governance attributes and cartel formation.
3.6 Hypothesis Development
The above literature review shows that there is a potential relationship between cartel formation and
corporate governance attributes (Spagnolo, (2005); Han (2010); Aubert, (2007); Gonzalez and
Schmid (2012); Harrington, (2008)).Therefore, a broad range of literature that has been conducted
over the past decades on a variety of corporate governance topics is reviewed in order to draw a clear
picture of what board and CEO characteristics could be associated with cartel formation. However,
there is certainly no clear negative or positive relationship between what is regarded as good
corporate governance in the literature and the likelihood of firm engaging in cartel agreement.
This section reviews the empirical literature related to board characteristics, ownership structure of
the board, CEOs characteristics, and CEO compensation scheme. The focus will be on the following
characteristics: Board size, directors’ age, directors’ gender, board duration, independent directors
(non-executive directors) and board compensation. The ownership structure: common stock owned
by an outside director and family ownership. The CEO characteristics are; CEO age, CEO gender,
86
CEO tenure, multiple directorships, and CEO concentration power. This section also reviews the
literature on CEO compensation schemes (share, bounces, etc.) Although this list is comprehensive
enough to capture the most important board and CEOs characteristics identified by the literature; it is
by no means exhaustive (for recent studies of other board characteristics see for example Bebchuk
and Cohen (2005)).
3.6.1 Does Board of Director Characteristics Matter?
Board Size
The importance of limiting the board size is a global consideration and this is due to the workloads
being required; however, only slight empirical evidence is available to support this view. Rather, a
strong tradition persists in terms of supporting many directorships as a firm’s tool to appoint external
resources (Kiel and Nicholson, 2006). The findings undertaken by Kiel and Nicholson in their study
suggest a low incidence of several directorships. They indicate that the reasons of many examples of
several directorships relate to entities, the nature of these entities, and lower workload requirements
as outcome of such nature. In addition, the findings suggest a lack of apparent relationship between
the financial performance of the firm and implementation of several directorships. Finally, the
authors tackle the implications for boards and the importance of ensuring governance
recommendations and guidelines.
Moreover, managing a large board of directors in an organisation can prove to be costly (Lipton and
Lorsch, 1992; Jensen, 1993). Due to the fact that the members are in large number, it is possible to
have disagreements and difficulty in performing efficient roles. As the number of board members
increases, the internal conflict problem increases along with the agency issues, and the
communication and coordination activities amongst the board members become weak (Eisenberg et
al., 1998). Eisenberg and colleagues indicate that such number must be as small as not to allow
conflicts to thrive as well as not to weaken communication and coordination activities amongst board
members.
The Evangelical Council for Financial Accountability (ECFA) provides a mandate that the number of
directors must be at least five and that the board must determine the optimal board size based on the
needs of the organisation. The Standards for Excellence Institute also mandates a minimum of five
directors, but they consider it preferable to have seven or eight directors. At least five directors are
also proposed by the Committee for Purchase and the Panel of the Independent Sector. The Internal
87
Revenue System (IRS) holds that very small or very large boards may be problematic since small
boards might fail to represent public interest whilst large boards might fail to do their duties and
responsibilities (Hopkins and Gross, 2009).
According to the OFT 2011, directors in small firms might have more hands on involvement with
day-to-day business practises of their firm, and therefore they might be more knowledgeable of any
actual or potential breach of competition law. In contrast, directors in large firms might not be as
involved as the directors in smaller firms.
In a similar manner to this study Gonzalez and Schmid (2012), using a sample of 1,148 firms on 182
different U.S cartels from 1987 to 2009, empirically tested the relationship between the probability of
firm involving in cartel and several corporate governance attributes. The results show that mature and
large low growth firms are most likely to participate in cartel. Also, large-sized board significantly
related to the probability of firm participating in cartel. Gonzalez and Schmid indicate that large
boards are capable of such formation.
A research carried out on a large number of U.S. publicly traded firms from Forbes 500 states that
there exists an inverse relationship between the number of directors and Tobin’s Q. In this research
all other attributes like firm size, ownership structure, etc., have all been controlled (Yermack, 1996).
Another research carried out on 879 middle-sized and small Finnish firms states the same results. It is
also believed that a smaller number of board of directors leads to lower expenses in the funding
organisations (Yermack, 1996; Tufano and Sevick, 1997; Dann, et al., 2003).
If the board is very large, problems like low levels of motivation or coalitions may occur. The issue
of responsibility diffusion also arises when there are large numbers of people to handle similar
activities. Hence, it is found that a large board size may negatively affect the coordination activities
and group dynamics which are to be extracted for the purpose of organisation development. This has
been pointed out earlier by Eisenberg et al. (1998). Any decision-making activity may also be
hindered due to the fact that a consensus from all members of the board may not be easily met (Judge
and Zeithaml, 1992; Goodstein et al., 1994; Eisenberg et al., 1998; Forbes and Milliken, 1999;
Golden and Zajac, 2001). Hence, large boards may prove to be much less efficient and hinder the
development and performance of the organisation as a whole.
88
A continued debate goes on in terms of the role of board size according to various perspectives
(Dalton et al., 1998; Hemalin and Weisbach, 2003). Board size has been examined by a range of
literature from the strategic perspective. Large boards encounter coordination and communication
difficulties which hence serve as a hindrance for the board’s capacity to advise and be involved in
strategic planning (Lipton and Lorsh, 1992; Jensen, 1993). Also, larger boards tend to be less
productive and less powerful in monitoring (e.g., Jensen, 1993; Lipton and Lorsch, 1992; Yermack,
1996)
On the contrary, an agency perspective holds that there is a likelihood for larger boards to become
aware of any agency problems since a significant number of experienced directors can be deployed to
review the actions of the management. Moreover, the agency theory views that effective monitoring
is supported by larger boards through the reduced dominance of CEO within the board, which in turn
protects the interest of shareholders (Singh et al., 2001).
The bargaining position of the board is enhanced through larger boards, especially in relation to the
CEO, which leads to the conclusion that it is more effective to monitor management when larger
boards are utilised to do so. Therefore, board size proves to be an essential aspect of boards’ ability
towards effective management monitoring (Persons, 2006).
Board size indicates its advisory and monitoring responsibilities, which can contribute to
management behaviour. Increased expertise and diversity are likely to be exhibited by larger boards
alongside increased monitoring capacity of the board (John and Senbet, 1998). In addition, more
independent directors tend to be included in larger boards, which results in the capacity of these
directors to delegate more responsibilities to delegate more tasks to board committees than smaller
boards, which can result in limiting managerial opportunistic behaviour (Xie et al., 2003).
However, the fact that a large size of board members may hinder the growth of the organisation has
been proved in literature but it is also essential to understand that a minimum number of board
members are required to make sure there is diversity and countervailing power in the organisation. It
is necessary to have board members who can deliver balanced representations along with expertise at
different levels (Van den Berghe and Levrau, 2002).
89
In addition, it is found out that the audit committee independence is in fact drawn from the board’s
size because of increased pronouncement of the probability of having a totally independent audit
committee in firms with larger boards (Ebrahim, 2007). It is argued that small board size tends to
limit the available independent directors serving the audit committee, alongside the evidence that
board size increases, vis-à-vis the independence of the audit committee (Klein, 2002).
There are some who argue that reporting quality is enhanced by larger boards (Chtourou et al., 2001;
Xie et al., 2003) whilst there are also those who claim that such is enhanced by smaller boards
(Yermack, 1996; Alonso et al., 2000). Some of the shortcomings that may be encountered with large
and small-sized boards are increased likelihood for management or outsider dominance. Bureaucracy
might also serve as a hindrance for larger boards to discharge their monitoring duties.
The study of Sanchez (2009) aims to determine the extent of effectiveness of corporate governance
by analysing how board structure impacts on the technical efficiency of the firm. The study evaluates
firm performance by using Data Envelopment Analysis using resembling methods and bootstrapping
strategy. It utilises truncated regressions to find out the effects of board characteristics on efficiency.
These characteristics are the board’s size, reputation, independence, diversity, and activity. The result
suggests that the technical efficiency of business tends to increase with a heterogeneous board that
involves a limited number of directorships as well as a limited activity stipulated in annual board
meetings in decreased number alongside increased number of specialised committees (Sanchez,
2009). This study is relevant to the research as it provides clarification on the impact of board
structure on the firm’s technical efficiency.
Hermalin and Weisbach (2003) suggest that there is no relation between board composition and
corporate performance. However, negative relationship exists between board size and corporate
performance. The board’s decision to replace CEO has a corresponding correlation with board size
and composition. The same correlation exists between board size and composition on one hand, and
acquisitions and executive compensation on the other.
Following Gonzalez and Schmid (2012) study that large-sized board significantly related to the
probability of firm participating in cartel, also Jensen, 1993; Lipton and Lorsch, 1992; Yermack,
1996, who have argued that the larger the size of the board the weaker corporate control over firm
and CEO, therefore, this study examines the relationship between board size and the probability of
cartel formation. If cartel agreement can be considered a failure of corporate control, i.e. a failure of
90
the board to control individuals (e.g., CEO, individual directors), then it should be the case that the
propensity to get in the cartel agreement is positively related with the size of the board. To examine
this effect, several studies measure board size as the total number of the firm’s directors (e.g.,
Beasley, 1996; Yermach, 1996; Vafeas, 2003; and Coles et al., 2008). This study uses the total
number of members on the board as a measure of board size (SIZEBA). Controlling for poor firm
financial performance, firm ownership status, current ratio, firm sale, and Herfindahl index, this
study tests for the proposition below; a positive and significant coefficient is expected
P1: The size of board of directors is larger for firms committing cartel than for a matched
sample of non-cartel firms
Board Independence (Non-Executive Directors)
There are two kinds of independent board members thus identified. The first kind is the one who is
actually affiliated with the firm and is an employee and the second kind is the one who is not
affiliated with the organisation at all and only provides services like consultation etc. (NACD, 1996).
These independent directors do not have any kind of financial ties which could hinder their
performance in the firm. Much confusion exists about how many independent board of directors
should exists since there are many costs involved with it.
In the literature there are two kinds of views present about independent directors. In one hand, some
state that the market perceives these directors as more efficient in making corporate decisions which
is why they are promoted (Byrd and Hickman 1992; Brickley, et al., 1994; Cotter, et al.,(1997);
Dann, Del Guercio and Partch (2003); Anderson, et al.,, 2004).
On the other hand some state that they may not be able to provide such high value (Bahgat and
Black, 1999). It also presented by Gillette, Noe, and Rebello (2003) that there needs to be a mix of
outside and inside directors and that the inside directors should be provided with incentives. With the
help of these incentives it would be possible to bring about truthfulness and integrity within the
decision making processes without having to use the concept of veto power. A study has also been
conducted which states that the large number of independent directors are able to manage the
decision making process efficiently.
91
The literature also has not been able to clearly state if the inside or outside directors have the ability
to influence the kind of conflicts that take place in an organisation (Mace, 1986; Patton and Baker,
1987; Hermalin and Weisbach, 1988, 1991; Lee, et al., 1992; Shivdasani, 1993; Vicknair, et al.,
1993). Within the category of outside directors there are two kinds, the grey (non-independent
directors/ non-executive directors) and the independent directors. In this case, an independent
director is one who is only affiliated with the firm as being a board of director lest he has no kind of
affiliation. For the purpose of this research as well the outside non-executive directors would be
taken into account.
Many researchers have observed the effect of outside directors on the board and found that it is not
only the compensation that can be held responsible for the monitoring constraints of the organisation
(Fizel et al., 1990). A labour contract is established with the CEO when he is hired and within this
contract exist all constraints for the CEO activities. Some of the findings suggest that the time period
of the CEO has no link with the fraction of outsiders on the board. It is found that a monotonic
decrease takes place in the time period when the outsiders’ percentage of the board is increased.
Moreover, board of directors is considered the most important element in the internal framework of
corporate governance (Fama, 1980; Fama and Jensen, 1983). The board’s composition serves as the
basis for establishing the board with effective management monitoring. The agency theory views that
an independent board is a vigilant element of agency problem since it involves a considerable number
of non-executive directors tasked to monitor the performance and behaviour of management
(Johnson et al., 1996; Bainbridge, 1993).
It is posited that boards with dominance of insider directors tend to have self-monitoring problems as
well as weak monitoring stances by executive directors (Fama, 1980). Lawler et al. (2002), through
their empirical study on the subject, support the view that board independence leads to capacity to
improve the board’s monitoring function. Moreover, Haniffa and Cooke (2002) posit that aside from
the direct impact of board independence on the performance of the firm, it also impacts on financial
disclosure since management can be forced by outside directors to enhance firm disclosure quality.
In the UK, the Cadbury Report (Cadbury, 2002) emphasises the significance of independent boards,
alongside its recommendation of a minimum of three independent directors on the board to ensure a
substantial contribution of independent directors in executing the board’s duties. The Higgs Report
92
on the Corporate Governance Combined Code 2003 which consists of the regulation to include in the
annual report the independent non-executive directors. The board has a duty to ascertain board
independence in terms of judgment and character, including the circumstances or relationships that
tend to create an impact on the director’s judgment. Nonetheless, the issue of independence here does
not rest on relying totally on the items that firms disclose in their annual reports but that of the
directors’ independence. The work identifies the application of independence criteria to each non-
executive director. Each non-executive director is therefore examined whether each independence
criterion is applied to them to find out their independence. Moreover, the director is disqualified from
divergence from any of the independence criteria of the UK Corporate Governance Combined Code
2003.
In the appointment of new directors it is more likely for cartel to choose busy outsider directors, and
this is congruent with a conjecture that management tends to nominate new board members who are
not likely to do aggressive monitoring. This results in models that have controls for board size
(Gonzalez, Schmid, and Yermack, 2013).
In a study of Kang, et al., (2007), it is revealed that director independence is demonstrated in 83
firms from the total ones involved in the study. This is consistent with the finding of another study
showing 73 firms with independent chairpersons. These findings are congruent with the
recommendations made by ASX Corporate Governance Council in 2003. The level of board
independence is found to have been significantly influenced by shareholder concentration and
industry type as implied by the findings (Kang et al., 2007).
Another research study states that there may be a relationship between the CEO turnover levels and
outsider representation (Weisbach, 1988). There is a strong relationship between firm performance
and the presence of inside or outside board of directors. Borokhovich et al. (1996) found out that
outsider board members are supportive of other outsider board members in the activities carried out
within the firm and that they are most likely to become the CEO of the organisation depending on
their percentage. The market also has confidence in these outsider boards of directors that they would
provide benefits as a whole. These outside boards of directors may quit from their position if the firm
is not performing well in the organisation which is why the CEO close to his retirement is inclined to
hire inside board of directors so that they may be permanent and available to become the next CEO
(Hermalin and Weisbach, 2003).
93
To form an effective and competent board it is necessary to have a number of independent directors
(Fama1980; Fama and Jensen, 1983). Fama (1980) and Fama and Jensen (1983) use the
terminologies “outside directors” rather than “independent directors”. However, their general notion
of outside directors is similar to independent directors. According to them, the management of the
firm should be comfortable enough to bring their issues to the board without worrying of being
questioned or punished (Fama, 1980). Hence, independent directors are helpful in increasing the
performance of the firm since the management feels comfortable in applying their expertise.
Some of the research studies also state that internal mechanisms are not required and that the market
is able to provide a solution to the agency problem and the board of directors are unnecessary (e.g.,
Hart, 1983). The market is very much interested in the appointment of outside directors as they
believe that these directors would act in the interest of the market (Rosenstein and Wyatt, 1990).
Prior studies indicate that there is a positive impact that independent board members can pose on the
governance of a firm, specifically in terms of fraud (Beasley, 1996; Xie et al., 2003; Peasnell et al.,
2000a; Peasnell et al., 2005; Jaggi et al., 2009; Klein, 2002b; Chtourou et al., 2001; Bradbury, 2006;
and Dimitropoulos and Asteriou 2010).
As mentioned above, board independence is regarded as a very important element in an organisation
due to the fact that non-executive directors (outside directors) are considered as the control and
monitor mechanism in the firm, who can also enhance firm performance (Duchin et al., 2010; Fama
and Jensen, 1983; Weishbach, 1988). Being financially independent from the management, and from
possibly conflicting situations, non-executive directors (outside directors) have the ability to
minimise agency problems and control managerial self-interests (Rhodes et al., 2000). They are able
to protect the shareholder interest, as well as supervise and manage performance in a much better
way to align firm strategies for greater performance. Therefore, if cartel agreement can be considered
as a failure of corporate control and monitor, i.e. a failure of the board to control and monitor
individuals (e.g., CEO, individual directors). Hence, it should be the case that the propensity to get
into the cartel agreement is negatively related to the percentage of independent board members on the
board. Consistent with most prior studies, board independence (NED) is calculated in this study as
the percentage of independent NEDs to the total number of board members. Consequently, this study
empirically tests the proposition below by controlling for poor firm financial performance, firm
94
ownership status, current ratio, firm sale, and Herfindahl index. Negative and significant coefficient
is expected:
P2: The percentage of independent (non-executive) members on the board of director is lower
for firms committed cartel crime than for non-cartel firms.
Age of the Board of Directors
Several views have been stated by researchers regarding the age of the board of directors. On one
hand, some of them state that as the board members grow older, their productivity levels decline. On
the other hand, the older board members are found to have much more experience and a well-
integrated social network to enhance the performance of the organisation. According to the National
Association of Corporate Directors the age of 70 these board members should be removed so that the
productivity levels may be maintained. The compensation paid to these managers is higher than their
levels of productivity which is why it is essential to retire them (Core, Holthausen and Larcker,
1999).
Even though this criticism is considered valid, older board members may also prove to be productive.
For instance, those directors who have retired can now provide more time and efficiency towards the
corporation. If there are younger directors present it is possible that the risk taking may increase and
a strategic change may take place (Child, 1974; Wiersema and Bantel, 1992). On the other hand a
researcher states that when older directors are present, the processes become more conservative.
These managers are more independent than the younger managers who actually carry out risks based
on the expense of the shareholders (Stevens et al., 1978). Hence, it is believed that directors who are
older in age are able to provide better performance than the ones who are younger.
In a study of Vell (2010) involving the age distribution of board members, they find out that 56 is the
average age whilst 58 is the median age of these board members. Age diversity is present as shown
by three board members who are aged 71 and some others who are aged 33. In a board index by
Silicon Valley in 2008, it was found out that boards tend to trend a little older. Outside directors had
an average age 59, compared with 57 in 2007. Alternatively, Lacker and Tayan (2011) stated that
firms establishing an age limit to serve on a board have about 72 years as the average mandatory
retirement age. Loos (2010) claims that there are typically no age restrictions imposed on directors of
95
boards of US corporations. Age requirements can however be set by charter documents as a matter of
corporate governance policy.
According to Kang and Shivdasani (1995), the generalisability of findings related to age of directors
is bounded by different regulatory environments, cultural diversity, size of capital markets, and
governance mechanism effectiveness. Hence, the value of governance structures including the age of
directors, as well as the influential factors, must be investigated separately in each country.
Ferris, Jagannathan, and Pritchard (2002) found in their study that directors nearing retirement age
might consider multiple directorships. Age is said to serve as a proxy for the director’s experience
and the energy needed for the demands of board service. The study finds that the regression for the
number of directorships vis-à-vis age involves a significant positive co-efficiency. It also suggests
that older directors with greater experience of directorships are no longer interested in additional
directorships or might pose as less attractive candidates. The average age of directors is also older in
boards with multiple directors. In a particular corporation, arbitrary terms are not held by the board as
a limitation that may be imposed on directors’ service. The board does not also maintain a position
that directors must be remunerated annually until upon reaching the mandatory retirement age
(Clayman, Fridson, and Troughton, 2012).
In a study by Kang et al. (2007), it is found out that the age of directors tend to become a sensitive
area as shown by 70 firms in the sample disclosing this information. There is evidence showing
preference by firms for directors in the older age groups, whereby those within the age range of 50
and above comprise 80% of the total sample. There is also a significant and positive link between age
diversity and board size, as there is generally a positive link between age diversity and the type of
industry in which these directors belong. Moreover, it is found out that a more diverse age range is
demonstrated by directors in consumer sectors and product industry sector.
There has not been much a focus on individual differences in risk taking, which also includes its
association with age. According to Wiersema and Bantel (1992), when firms bring about various
changes in their corporate strategy, it is usually seen that the top management of the firm has a lower
average age, which could mean that as age increases risk aversion increases. A negative association
between age and risk taking and the importance of risk has been seen through a short version of
Kogan and Wallach’s choice-dilemma test. This test was conducted by Vroom and Pahl (1971) to
96
observe 1,484 managers from over 200 firms. When individual marks are correlated with age, the
association is small in size, but it increases significantly when mean marks are used. Moreover, the
associations across items and across firms are relatively balanced. The developmental and socio
cultural mechanisms that could cause these outcomes are discussed.
Campbell (2001) in terms of investment behaviour, reports a negative age impact on engaging in
equity investments. Analyzing risk perceptions of households, Bucciol and Miniaci (forthcoming)
found that risk tolerance is reduced in age and a review study by Sahm (2007) and Grable, McGill,
and Britt (2009) suggests that older individuals are less risk tolerant. Grable, et al., (2009) attribute
this result to improve in attained knowledge of risk and risky situations comparable to younger
people.
Agarwal, Driscoll, Gabaix, and Laibson (2009) harmonize with this literature by examining lifecycle
patterns in financial decisions connected to credit behaviour. They document that younger individuals
make more mistakes than older people, e.g., they are less capable to value properties and they spend
too much high fees. Overconfidence additionally performs a part. Gervais and Odean (2001) suggest
inexperience in younger individuals leads to misattribution of success causing in upward revisions of
the capability to manage risk. Eventually, individuals better assess their knowledge and risk tolerance
reduces.
The investors’ portfolio choices have been utilised in various researches to assess willingness of
investors to take risk. Personal risk taking in general and more particularly corporate risk taking has
been seen to be effected due to age. According to Samanez-Larkin et al. (2010), exceptional effects
of age on risk taking in financial decision making have been observed. As per the work of Ackert et
al. (2002), it has been found that investors of an older age keep a smaller percentage of their risky
assets in equities as compared to bonds, showing risk aversion increases with age. Even according to
Bodie and Crane (1997) and Morin and Suarez (1983), there is a significantly negatively relation
between age and percentage of risky assets held in equity.
According to Mason and Hambrick (1984), younger executives take on riskier strategies referring to
the ‘follies of youth’. This was supported by Markóczy (1997) whose study revealed the greater
inclination of young directors to take risks, while it was asserted by Brouthers et al. (2000) that
97
managers in their young age are more ‘strategically aggressive’ than those who are in their old age
and this is especially true during times of instability.
Younger directors are however more likely to face pressures from the society and corporation, as was
revealed in a study of white collar crime by Price and Norris (2009). In contrast older directors are
protected from these pressures due to their age (Price and Norris, 2009), and they also have a less
tendency to give in to these industrial and organization forces (Daboub et al., 1995). Older executives
are considered to be more conventional which is probably due to their ability of being able to judge
risks and negative outcomes. They also have a lesser tendency to challenge the corporation’s policies
(Child, 1974). Higher degree of moral development creates maturity, and older directors are more
capable of adequately comprehending the ethical standards of conduct of the firm (Serwinek, 1992).
The effect of board age on risk-taking is not attributable to changes in risk-taking to board age, but to
ownership structure (Berger, et al., 2012). A research contacted by Elsaid (2012), where he studied
679 CEO successions in 650 small, medium and large-cap North American firms, between 1992 and
2005. Elsaid found that corporate risk-taking is influenced by board age, in which a link is indicated
between older boards and less firm risk-taking.
In summary, it can be argued that if the board consists of younger directors, it is possible that risk
taking may increase and more risky strategies may take place (Wiersema and Bantel (1992), Ackert
et al. (2002), Bodie and Crane (1997), Morin and Suarez (1983) and Elsaid (2012)). Following
Anderson et al. (2004) this study measures board age as the sum of all the ages of directors divided
by the number of directors. The proposition below is tested by controlling for poor firm financial
performance, firm ownership status, current ratio, firm sale, and Herfindahl index. Negative and
significant coefficient (AGEBA):
P3: The average age of board directors for cartel firms is lower than non-cartel firms.
Gender Diversity of the Board
The corporate board of directors also requires paying attention to gender diversity amongst members.
Depending on the kind of society the organisation is associated with, there is usually a homogenous
board of directors. This aspect is considered poor implementation of the corporate governance
structure since both genders should be provided with equal opportunities (Bilimoria and Piderit,

98
1994; Burke and Mattis, 2000; Carter et al., 2003; Conyon and Mallin, 1997; Daily and Dalton, 1992;
Singh and Vinnicombe, 2004; Singh et al., 2001; Thomas, 2001).
According to Hampel (1998), agency theory supports board gender diversity with the theory’s
emphasis on board balance. Hence, a more balanced board takes place through representation from
diverse groups especially those boards tending to prevent small groups from imposing dominance on
decision-making processes.
According to Weber and Zulehner (2010), there are more chances of survival of new start-ups that
employ female first. As per Adams and Ferreira (2009), when the board of directors is more gender-
diverse, it can be seen that CEO turnover is associated increasingly with poor performance. There
was increased acquisitions and decline in performance in Norwegian publicly-traded firms when
board member gender quotas were made obligatory (Ahern and Dittmar 2012). All these studies
show that gender diversity affects corporate decisions or outcomes.
Shrader et al. (1997) suggest that there was no significant link between percentage of women in top
management and firm performance, whilst a negative effect on performance of the firm was seen
with the inclusion of women as board members. These outcomes were found through a study of
Shrader et al. (1997), using a sample of 200 large US firms. However, there was a quite a significant
relation found between women friendliness and profitability of the firm, by the study of Alder (2001).
Firm performance is positively affected when it has women employees, as has been ascertained
through many studies (Hillman et al., 1998; Adler, 2001; Erhardt et al., 2003; Carter et al., 2003;
Catalyst, 2007). Firms achieve greater shareholder returns when their boards consist of a greater
number of women and minorities as Hillman et al. (1998) stated that an increased diversity in the
board greatly benefits the shareholders. A similar study by Adler (2001) found that the firm
profitability had a strong relationship with the extent of employment of women at senior executive
level in the firms of Fortune 500.
Managerial risk-taking may be explained by agency theory, which considers risk preferences in
stable mode. It is also supported by behavioural approaches which assume that risk perceptions, and
thus risk-taking, are importantly linked and dependent to context. It must be noted however that
despite research prevalence of agency theory, there remains an unclear domain on the exact link
99
between government structure and choice for agent risk (Finkelstein, et al., 2009). The study of
Berger, Kick, and Shaeck (2012) suggest that higher proportion of female executives leads to board
changes. This in turn is related to increased risk taking by younger executives, which also results in
board changes. On the contrary, increased executive representation holding PhD degrees as an
outcome of board changes leads to decline in risk taking. Berger and colleagues further that an
executive board’s socio-economic composition has high relevance to socio-economic policy, which
is seen in gender quotas that are often used to support career outcomes for females.
However, it is noted that there is little evidence found in the impact of having more females in the
board on firm outcomes and whether female board members indeed put forward a less risky posture
to conduct business. It is indicated that whilst quotas on an executive’s gender have direct impact on
the representation of various groups on executive boards, a knock-on effect takes place on corporate
outcomes. In the study of Barsky and colleagues (1997 cited in Berger et al., 2012) and Jianakoplos
and Bernasek (1998 cited in Berger et al., 2012), it is inferred that female executives tend to be more
risk averse in decision making relating to financial concerns.
In a separate study within the context of corporate governance arrangements, it is found out that there
is an inverse relationship between female board members and firm risk, whereby it is revealed that it
is more likely for female board members to take risks than men (Berger et al., 2012). The analysis
points out to the notion that excessive monitoring is taken by female directors, which thereby leads to
decreased shareholder value, and that they undertake such poorer investment decisions because of the
bigger obstacles they face than men who are able to acquire information on investment projects
(Bharat et al., 2009 cited in Berger et al., 2012).
However, Hillman, et al. (2002) documented otherwise in the propensity for women to occupy board
seats. The authors undertake a study to determine any difference between female directors of racial
minority and white males where they use a sample from Fortune 1000 boards. The findings indicate
differences in education, occupational backgrounds, and board affiliation patterns, whereby female
directors and those with African-American descent tend to come from non-business backgrounds and
likewise tend to become more involved in multiple boards faster than their male benchmarks. The
issue is the ability of these females to take risk in occupying multiple boards at a faster rate.
Two-hundred large organisations were researched upon and the conclusion showed that women in the
higher levels of management hierarchy were irrelevant for firm performance (Shrader et al., 1997).
100
There were many instances indicating a negative impact of women being on the board. These
conclusions were drawn using the measurements of return on equity (ROE), return on sales (ROS),
and return on assets (ROA).
Moreover, Nguyen, et al. (2007) examines the relationship between the firm’s market value and
gender diversity of board of directors. The results indicate that shareholders’ value tend to be
promoted by gender diversity, as there is a significant economic relationship between woman director
variables and the firm’s higher market value. Similarly, there are significant relationships evidenced
from board diversity studies between women proportion on the board and the firm’s average value. It
must be noted that there tends to be an association between participative boards with equal power
distribution between the CEO and the board, and increased proportion of female board members
(Pearce and Zahra, 1992).
Research made by Singh and Vinnicombe (2004) nevertheless indicates fewer women compared to
men occupying board directorship in UK firms. This is demonstrated by only 64% female directors
for the top 100 firms in 1999, which went down to 61% in 2002. It is said that social exclusion may
prove as a dominant factor to this occurrence.
In their study of women on corporate board of directors, Dang and Vo (2012) indicate that a glacially
slow progress in gaining seats on boards of directors is experienced by female candidates. This is
explained by the barriers hindering women’s progress and issues relating to the influence of women
directors on firm performance.
Another study also shows a positive relationship between firm value and gender or minority diversity
amongst the board of directors (Carter et al. 2003). Using Tobin’s Q proxies, it is possible to believe
that women and minorities on the board can help increase the value of the firm. This aspect was
suggested after conducting an experiment on a sample of 638 Fortune 1000 organisations. The same
research study indicated that the proportion of women on the board is higher than that of the
minorities present. However, it was not able to define the effect of women participation on firm
performance.
Jamali et al. (2007) claim that female board member’s gain from the firms’ governance by means of
a range of skills and perspectives and by bringing new dynamics to board deliberations. Background
and qualification diversity may enable women to take on unique and rare perspectives during board
101
meetings and thus contribute to the dynamics of board deliberations. This complements the skills
held by male directors who tend to specialise in operations, and other functional areas (Zelechowski
and Bilimoria, 2004). Women, on the other hand, are said to possess a range of experiences that are
good for governance (Huse and Solberg, 2006). They also tend to query conventional wisdom and
lead open discussions, which hence improve boardroom effectiveness and financial reporting quality
(Mattis, 2000).
Several previous researches report a positive effect of the role of women on boards and find that
women improve the quality of decision making (Smith et al., 2006; Huse & Solberg, 2006), that
gender is a factor in ethical decision making (Ford and Richardson, 1994); and that women are
generally more risk averse than men (Watson and McNaughton, 2007).
Thus, a number of studies related to gender diversity led to the fact that gender does greatly impact
the risk-taking behaviour of people. Many other studies conducted using different factors like
experience, attitude etc. prove that women are less corrupt than men (e.g. Cheung and Hernandez-
Julian, 2006; Swamy, Azfar, Knack et al., 1999). They are likely to be much less selfish and are
worried about the risks associated with corruption. Barsky and colleagues (1997 cited in Berger et
al., 2012) and Jianakoplos and Bernasek (1998 cited in Berger et al., 2012), documented that female
executives tend to be more risk averse in decision making relating to financial concerns. Therefore, in
this study we expected to see less female directors serving on the board of cartel firms than non-cartel
firms. Following Tacheva and Huse (2006) this study measures gender diversity (GENBA %) by the
percentage of female directors on the board of directors. Controlling for firm ownership status,
current ratio, firm sale, and Herfindahl index, a negative and significant coefficient is expected
(GENBA %).
P4: There are less female directors on the board of cartel firms than the non-cartel firms.
Duration of the Board of Directors
The behaviour of a director based on his tenure in the organisation is confusing to define. Many
directors have been found to have high levels of commitment, skills, knowledge, and expertise due to
their experience in the business environment for many years. The organisation is highly influenced
by executive and outside directors depending on their time duration within the organisation. These
managers are highly associated with the firm’s resources and have the ability to decide which

102
decision would help enhance the performance of the organisation. Familiarity with the organisation
can itself provide many benefits (French and Raven, 1959; Zald, 1969).
Hence, it is believed that the tenure of these members would highly influence the organisation as a
whole. Many other researchers also indicate that when the length of service of the participant
increases, a cohort group is established with the rest of the members, where mutual decision-making
processes are carried out in the organisation. They may also carry out activities like competition or
rivalry to grow faster (Pfeffer, 1982). These cohorts have the ability to reflect power distribution and
influence within the firm. Socialisation levels are very high for members who are of long duration
within the firm.
Alderfer (2004) conducted a study that thoroughly analysed the decision making processes of the
board members in an organisation. He stated that when these members are of long tenure, they form a
special group with comfortable understanding of each other and operate the organisation efficiently.
When new board members are introduced, these new members are required to study the practices of
the organisation in order to carry out effective decisions and this may take a few years.
In shared firms, the duration of the board of directors may not exceed four years and may be re-
elected according to the constitutive documents (Sitaru, 2011). Usually, the general meeting of
shareholders appoint the directors of the board for a four-year term, which is also subject to
renewability.
The board’s duration of office must be defined in order for all directors not to rotate off the board at
the same period. This is done by appointing one-third of the new board members for a term of two
years; another one-third for a term of three years and yet another for a term of four years. This must
take place until the natural rotation of the board is established, and hence preserve its stability (Tagg,
2013).
Garoyan and Mohn (1985), state that the long duration of the board is beneficial. Proprietary
corporations usually elect directors to a one-year unrestricted succession of terms. Directors must be
permitted to have duration of enough consecutive terms so that they may acquire a thorough
understanding of operations; thus, the authors suggest three three-year terms for the board’s duration.
103
A study by Buchanan (1974) suggests that the commitment and motivation of a firm to strive harder
to achieve its goals increases when the tenure of directors is extended. This is supported by Salancik
(1977) who asserts that experienced employees have gained sufficient confidence and expertise in
carrying out their tasks and also have an additional stake in the organization (like the ownership of
firm stock) which is why tenure directly affects organizational commitment.
Vance (1983) suggests that the talent and expertise of directors is wasted when they are forced to
retire. Hence, when there is an efficient market for directors, shareholder interests are best secured
through the long term survival of directors.
Katz (1982) obtains contrasting results which state that intra-group communication decreases when
tenure is increased and also leads to the isolation of groups from important sources of information.
There is a non-linear relationship between group performance and tenure as ascertained in his study,
with performance increasing initially due to learning effect, and falling subsequently. The lengthy
presence of the directors on the corporate boards has led to the business community’s apprehensions
regarding its unfavourable effect on shareholders.
Replacing directors is considered to be a key challenge, however alterations to the composition of the
board is necessary due to changing business climate, as has been underlined by NACD (1996). The
board directors are allowed to provide their service for a maximum of 10 to 15 years according to the
Commission so that the creative ideas and analytical thinking of new directors can be utilized by the
board. There might be an attempt by the influential directors to take over some of the responsibilities
of the CEO with time, which is why Lipton and Lorsch (1992) have proposed having limits on the
director’s term.
The quality of longer board duration has been discussed in the previous literature (Buchanan (1974);
Garoyan and Mohn (1985); Alderfer (2004); and Pfeffer (1982)). Vance’s (1983) claim that boards of
longer duration are generally interested in achieving the goals of the organisation. However, none of
the previous research has examined the relationship between board duration and infringement
behaviours particularly in relation to cartel formation. Therefore, this study assumes that the quality
of the longer board duration exist in non-cartel firms, thus will empirically examine the relationship
between board duration and cartel formation (DURBA) by controlling for firm poor financial
104
performance, firm ownership status, current ratio, firm sale, and Herfindahl index. A negative and
significant coefficient is expected.
P5: The average duration of the cartel board is less than non-cartel firms
Remuneration
Many researches are found on organisational performance and board composition but there is only
limited research available on corporate fraud and board compensation. The Agency Problem has been
defined as a modern issue which is associated with managerial power and discretion since these
managers may use the discretion for personal gain (Shleifer and Vishny, 1997; Jensen and Meckling,
1976). These managers may not consider that the organisation is not performing well and still
distribute the excess cash that is available (Jensen, 1974; Williamson, 1964; Jensen, 1986). They may
also stabilise themselves in such positions that it becomes difficult for the organisation to remove
them when the time comes (Shleifer and Vishny; 1989).
By adjusting the pay of these directors it is believed that the agency problem may be avoided
temporarily. The compensation scheme needs to be strong so that the board is motivated to achieve
the goals of the organisation as well as pursue their own interests. To understand which kind of
compensation package is best suited in an organisation many financial economists have conducted
thorough research. To achieve an optimal contracting model, Murphy (1986) as well as Core, et al.,
(2001) has made several efforts. The only limitation that lies in the study in the package deals with
political aspects which are associated with deciding on the most suitable compensation package for
the directors (Jensen and Murphy, 1990).
A study has been conducted to find out whether the compensation provided to the board of directors
in the form of cash is able to enhance the performance of the organisation and is negatively
associated with the performance of the peer groups present in the same industry (Gibbons and
Murphy, 1990). Using the data from 1974 to 1986 on 1,049 US firms, it was found that cash
compensation is able to decrease the market average stock return but is able to increase the firm’s
stock returns. When peer groups were considered, there was a significant and positive relationship
with the return on assets.
105
Firms have acknowledged the idea of managerial discretion as an important determinant of CEO
compensation; however, there is no existing test thus conducted to formally examine the discretion
hypothesis despite considerable work that indirectly invoked certain ideas relating to the sources of
possible managerial contribution (Finkelstein and Boyd, 1998). The performance consequences of
CEO remuneration had been tested only by little attention. Finkelstein and Boyd make use of samples
from Fortune 1,000 firms where they find evidence for a principal impact of managerial discretion on
CEO remuneration as well as a contingency effect that shows higher firm performance with aligned
discretion and remuneration than when such alignment is absent.
The shareholders are unable to monitor the activities of the executives entirely which is why they
develop compensation contracts to motivate them to perform well. In some cases it is found that these
executives may resort to corruption practices in the financial statements to help receive their
compensations. They are only interested in achieving the goals set for the organisation for personal
gain. Researchers like Bar-Gill and Bebchuk (2003a, 2003b), Goldman and Slezak (2003), Robison
and Santore (2006), and Chesney and Gibson-Asner (2004) have worked towards the development of
models for efficient incentives which do not create corruption practices since financial incentives
have the best ability to develop corruption in the organisation (Becker, 1968).
Consequently, this study empirically tests the proposition below by controlling for poor firm
financial performance, firm ownership status, current ratio, firm sale, and Herfindahl index. Similar
to findings by Bar-Gill and Bebchuk (2003a, 2003b), Goldman and Slezak (2003), Robison and
Santore (2004), and Chesney and Gibson-Asner (2004), this study expects to see a positive and
significant coefficient between board remuneration and cartel formation.
P6: The board remuneration for cartel firms is higher than non-cartel firms.
3.6.2 Does Ownership Structure Matter?
Outside Directors’ Stock Ownership
The ownership structure of the board of directors has the ability to influence the corruption practices
taking place in the organisation. This effect has been thoroughly analysed by authors - Hermalin and
Weisbach (1988), Morck, Shleifer, and Vishny (1988) - who believe that there is a strong relationship
106
between the ownership structure and corruption practices. Several researchers have also examined the
institutional and insider ownership within an organisation by taking into account long term returns
and applying regression analysis. This research states that as ownership increases the stock levels
also increase (Han and Suk, 1998). It is also found out that insider ownership may negatively affect
the performance of the organisation since there is a possibility of management entrenchment.
Core, Holthausen, and Larcker (1999) indicate in their study that a considerable amount of CEO
compensation’s cross-sectional discrepancy may be explained by board measures and ownership
structures. In addition, the study suggests that CEOs receive bigger compensation when they are
within less effective governance structures. Overall, the authors’ results indicate that greater agency
problems are encountered by firms that have weaker governance structures and that these firms
perform worse. They also find out that CEOs of these firms receive greater compensation.
Peng (2004), points out whether outside corporate board directors have an effect on firm performance
during institutional change. The authors use resource dependence and institutional theories in
addressing this concern. Their findings demonstrate that there is indeed a difference made by outside
directors on firm performance, specifically when sales growth is used as a measure for such
performance. A bandwagon effect is also exhibited by the results and such effect relates to the
practice of outside director appointment to corporate boards. The study highlights the policy
implications of the trend towards appointing more outside directors in corporate boards. According to
Hermalin and Weisbach (2003), changes in ownership structure, along with CEO turnover, is an
important factor affecting changes in boards.
The US public corporations data which bear Federal crimes taking place in 1984-1990 are also
analysed by Alexander and Cohen (1999). With the help of these data, it is possible to provide fresh
Federal guidelines for the sentencing of the organisation. The analysis of the data shows that when
there is a large ownership stake, corruption practices are at low levels in the organisation.
There are circumstances that it is not possible to change the board size by changing the ownership
structure (Chen and Yao, 2006). Moreover, it is very rare that a firm separates ownership and control
in its structure since it is a frequent occurrence that controllers possess some degree of ownership of
the firms’ equity. Corporate governance holds that ownership structure is a potentially important
element. Keasey, Thompson, and Wright (2005) hold that reduced conflicts of interest and higher
firm value must be the result of great overlap between ownership and control. They further that
107
alignment of managers’ interests with those of the firm’s shareholders is the result of ownership by
management.
In a study involving CEOs, ownership structure and the relationship between CEO and the board are
explored in relation to their impact on pay and performance. For ownership structure, the result is
that institutional investors have limits on paying CEO with unearned compensation. Evidence shows
that more benefits can be obtained by boards by acquiring impartial outside directors than by
increasing the number of outside directors (Mangel and Singh, 1993).
It is predicted that the greater the stock ownership of outside directors, the smaller the incentive to
indulge in managing fraud and hence, the smaller the possibility of cartel formation. Thus, the
proposition below is empirically tested (OUTOWN %), representing the percentage of common stock
owned by outside directors. Controlling for poor firm financial performance, firm ownership status,
current ratio, firm sale, and Herfindahl index, a negative and significant coefficient is expected.
P7: The percentage of outside directors’ stock ownership is lower for cartel firms than for
non- cartel firms
Family-Owned and Controlled Firms
The notion behind family-controlled firms will be discussed under this segment. As Astrachan and
Shanker (2003) define, family-controlled firms are organizations which are formed either under close
associations or within the related members of the family each contributing as an investor which
grants them the voting right to make key decisions for the firm. Such family firms provide benefit in
terms of alleviating the Type I agency problem, phenomena commonly experienced under the
conventional owner-manager setup which occur due to conflicting interests (Demsetz and Lehn,
1985; Anderson and Reeb, 2003, 2004; Villalonga and Amit, 2006). Hence, we can simply say that
firms which are founded and run by family members come under the domain of family firms.
There are several reasons as to how such family-controlled firms actually decrease the probability of
agency conflict. Ali et al., (2007) ascertain that firstly, because the individual capital share of each
family member is involved in the business, it is ensured that the business activities of the manager are
thoroughly scrutinised. In contrast, individual shareholders in a firm find it difficult to monitor
managerial activities because of their diversified portfolios. Secondly, family members have a good
108
background of their business and are genuinely concerned about it giving them a better chance to
keep a check on managers. Thirdly, all family firms are ready to provide for investment even in the
long run as compared to shareholders. This automatically makes them wary of any prejudiced
decisions made by managers.
The above mentioned characteristics can, on one hand, prove to be advantageous for managers as
they allow them with considerable authority to engage in either managerial entrenchment (Shleifer
and Vishny, 1997) or other related- party transactions (Anderson and Reeb, 2003) by diverting
private benefits at the cost of shareholders. However, on the other hand, such characteristics make it
very difficult for them to perform earnings management to hide any opportunistic behaviour which
can harm other shareholders.
The structure of family firms comprises of a larger shareholder who can either be an individual or an
institution like for example, financial intermediaries, investment fund or a corporation. This structure
will define the type of agency problem which might originate. The inducement for expropriation and
monitoring increases, if the larger shareholder is either a family or an individual, thus leading to
agency problem II. In such a case, the family will utilize its power to gain private benefits at the cost
of other minority shareholders. However, if the larger shareholder is an institution, then the authority
to control is spread amongst various shareholders where each of them has lesser advantage to
expropriate smaller shareholder. But at the same time, it commands greater check on the manager
leading to agency problem I.
Prior researches state that at times, decisions favouring the majority shareholders are made in family
firms which might actually differ from the interest of the smaller shareholder (Morck and Yeung,
(2003); and Bertrand and Schoar, (2006)). As Perez-Gonzalez (2006) state that in case the larger
shareholder is the family, members attach significance to control and will try to be part of the
management even though it may cause weak firm operations.
Making a distinct comparison between family and non family firms, it is observed that non family
firms typically face Type I agency problems. To tackle with them, managers in non family firms are
compensated on observable performance measures. Conversely, managers in family firms are not
often compensated under observable performance measures. This is because the founders have a
direct control and will keep a check on the management; hence compensate the manager on the basis
109
of his actual efforts which are visible under the controlling process. Chen (2005) provides reasoning
on compensation of CEO which is related to the fact that the issues arising from separation of
management and ownership are quite narrow in family firms. He states that a CEO’s earning based
pay for family firm is quite less in terms of total and also as a percentage of total compensation.
Healy and Palepu (2001) and Fields, Lys and Vincent (2001) report less probability of earnings to be
manoeuvred in family firms as management compensation is not linked with earnings.
Members of family have a clear understanding on the operations of the business which is why the
manager will have a minimalistic chance to engage in any behaviour which can impact the firm’s
profitability. Ali et al., (2007) quote an instance whereby direct control by the family over the
manager and their long term association with suppliers and customers will allow them to identify if
sales revenue is overstated due to early procurement of goods or unfounded reduction has been made
to allow for flexible payments.
It is hence established that due to Type I agency problems, quality of reported income for family
firms is much greater than those of non family ones. Nevertheless, aspects of reputation concern in
the labour market and legal liabilities can assist in alleviating if not completely eradicating these
discrepancies between non family and family firms. Ali et al., (2007) hence imply that in comparison
to non family firms, family firms will deliver better quality of reported earnings.
Type II agency problems have their share of differences and can cause a differential effect on the
quality of reported earnings amongst both family and non family firms. Such problems may direct
family firms towards manoeuvring of accounting earnings for various reasons such as to conceal the
unfavourable impact of a related party transaction or to assist family members in gaining
management positions. Because the owners in family firms have the adequate authority and control,
they are definitely capable of manoeuvring the earnings. Such private seeking behaviour on the cost
of minority shareholders can cause legal liabilities and a decrease in stock price of the firm, which
help to lessen the difference in Type II agency problems amongst non- family and family firms. As
the case with Type I, these aspects will only alleviate the difference in Type II agency Problems
between family and no-family firms but not eradicate then completely. The quality of earnings in
family firms is therefore expected to deteriorate as Ali et al., (2007) state keeping in view their
exposure to greater Type II agency problems as compared to non-family firms.

110
The influence of family control and institutional investors on the remuneration received by CEO has
been studied by Ettore, et al., (2012). To analyse the effect, 754 listed firms with 3731 firm-year
observations across 14 different countries from Continental Europe were studied from year 2001 to
2008. It was found that in family business, adequate control will help to curtail the amount of both
total cash and part of equity based remuneration for the CEOs. However, any influential impact of
family control on surplus total and cash compensation was found to be missing. Also, the relationship
between family control firms and cartels resulting in collusive behaviours has not been established
under empirical evidence.
Researchers have argued on the best possible structure for organizations. While McConnaughy, et al.,
(1998); Palia and Ravid (2002); Anderson and Reeb (2003); Adams et al., (2004); Fahlenbrach
(2005); Villalonga and Amit (2006) suggest founder CEOs to produce constructive results on firm’s
performance, Anderson and Reeb (2003) state that in the USA, the most successful organizational
structure work under family ownership. Specifically if the decision making at the top is under
ancestors, control under family firms will be prone to particular limitations (Villalonga and Amit,
2004).
To establish a link between the ownership structure and firm’s performance, 675 listed firms across
11 countries of Continental Europe were studied by Barontini and Caprio (2006). The result of the
study actually went against the hypothesis of family control hindering the performance of the firm. It
reported that family firms will depict better operational performance and valuation if the descendants
serve as non-executive directors in the Board. Furthermore, with respect to valuation and
performance, such family firms are statistically not discernible from non family firms, if the
successor becomes the CEO. In fact family firms are capable to display greater separation between
control and rights to cash flow.
Geographically, family firms are expected to perform efficiently in markets which are well regulated
and transparent as quoted by Anderson and Reeb (2003) which is why such structure will for
example not work in Asian markets and is best suited for large family firms in the US. Their result is
based on a study which considers a sample of big US family owned firms whereby it was established
that family ownership leads to efficient performance.
111
To summarize, in family-owned and controlled firms, agency problems I become less relevant, while
Type II agency problems appear. Given the fact that the two effects move in opposite directions, the
relationship, in terms of cartel formation, is not certain (i.e., it may increase or decrease). However,
the focal interest of this part of the study is on the Type II agency problems which demonstrate the
conflict between family-controlled firms (large shareholders) and minority shareholder. The
definition used in this study of a family firm is very close to the one used by Amit and Villalonga
(2006). A firm is reported as a family firm when the founder or a member of the founder’s family is a
blockholder of the firm. Following Ali, et al., (2007); Morck and Yeung, (2003); and Bertrand and
Schoar, (2006), who documented that large shareholders (family firms), might use their controlling
position in the firm to obtain private gain which might actually differ from the interest of the smaller
shareholder. Therefore, the proposition below is tested by controlling for poor firm financial
performance, firm ownership status, current ratio, firm sale, and Herfindahl index, to test if cartel is
more likely to be formed by family firms (large shareholders). Positive coefficient is expected:
P8: Cartel likely to be formed by family-owned and controlled firms (large shareholders).
3.6.3 Does CEO Characteristics Matter?
Anti-cartel enforcement has always been the main concern of the Antitrust Division. The Antitrust
Division has always supported the idea of rigorous imprisonment to avoid price fixing, bid rigging,
and allocation agreements, which are considered extreme cartel activities. Imprisonment is very
necessary in anti-cartel enforcement. Cartel offences are commonly carried out through single
employees. Large amount of fines are preferred to be paid by executives to reduce their time in jail
rather than being in jail to reduce their fines (U.S Department of Justice, 1993).
As discussed earlier in Chapter Two, the new movement toward punishing individuals (CEOs) who
participate in cartel formation means that they are a very important part of the cartel agreement.
Therefore, this study examines the link between cartel formation and individuals who are selected as
CEOs or executive. Given that a CEO’s background experiences will likely impact organisational
outcomes, pre-succession experience should be an important differentiating factor in CEO selection.
We define ‘experience’ to include life experience (age) and firm experience (tenure). These
managerial characteristics represent individual background factors proposed by Hambrick and Mason
(1984) as having important implications for leadership decision making and behaviour.
112
CEO age
Numerous researches suggest that risk taking reduces with an individual’s age. Prendergast and Stole
(1996) and Graham (1999) propose theories focused on career considerations. These theories
recommend that reputational considerations increase in age.
The managerial signalling model was formed by Prendergast and Stole (1996), the likelihood that
younger CEOs make increased and more risky investments than their older CEOs is developed
through this model. Younger CEOs go for a more aggressive investment style as compared to older
CEOs. According to Prendergast and Stole (1996), younger CEOs try to give implications to the
market that they have greater capabilities and so they go for more aggressive investment style.
Another point is that to avoid any such indication that their investments made earlier on were not
right, older CEOs avoid making any new investment changes. There is a horizon problem in which
older CEOs will avoid any new long-term investment projects that could be beneficial to the firm for
short-term projects, which may give temporary increase in firm performance. Older CEOs take this
step when they are close to their retirement. This horizon problem is linked to the likelihood made by
managerial signalling models (e.g. Smith and Watts (1982); Dechow and Sloan (1991); Cheng
(2004); Antia, Pantzalis, and Park (2010). However, horizon problem does not explain if this
difference in level of riskiness of investments is between older and younger CEOs; it only relates to
the issue that older CEOs reduce their investment when they are close to retirement.
Moreover, younger directors and CEOs tend to be less averse and may lack adequate experience,
which might impact negatively on the monitoring and control of the firm. Age diversity can build a
well-balanced functioning of the board, although more focus must be given to their qualifications,
experience, knowledge, and effectiveness (Rezaee, 2007).
In addition, there are entrenched CEOs who invest less and even make less aggressive investment
decisions, as found in previous studies. They prefer a quiet life (e.g. Amihud and Lev, 1981; Shleifer
and Vishny, 1989; Gompers, Ishii, and Metrick, 2003; Bertrand and Mullainathan, 2003). Older
CEOs could go for lesser investment levels in comparison to younger CEOS if they have more
influence in the firm. Another study is that younger managers have more confidence about the
decisions they make and are thus more willing to take risks. Roberts et al (2005) as well as Taylor
(1975) voice their concerns on reduced energy levels in the elderly. There was also a study showing
the causes of how the age of CEO could influence investment behaviour, such as that of Levi, Li, and
113
Zhang (2010). Levi and colleagues’ study shows that in terms of mergers and acquisitions, younger
CEOs tend to be more aggressive than older CEOs. Thus, these current studies show that besides
risk-aversion, there are other characteristics of CEOs that cause reduced investment in relation to
their age.
In the research of Li, Low, and Makhija (2011), the variations in the investment behaviour amongst
younger and older CEOs have been investigated. When compared to younger CEOs, older CEOs
have a lesser aggressive style of investment. This result was found through the assessment of plant-
level investment decisions. A study conducted by Yim (2010) indicates that it is more possible that
younger CEOS would go for acquisitions quite early in their careers since there increased
remunerations for CEOs take place after an acquisition. Both Li et al. and Yim have apparently
focused on investigating the link between firm level investment and CEO age.
In contrast, Holmstrom (1999) and Scharfstein and Stein (1990) formed market learning models
which provide the likelihood that younger CEOs invest less aggressively than older CEOs since they
are more risk averse. According to these researches, younger CEOs are able to face increased
inspection from the labour market because they do not have any previous records of investment
achievements. This is why younger CEOs are not too keen to go for an aggressive investment
strategy because they could face increased inspection from the market if they make any bad
investment and that could decrease their future career opportunities. Both these researches have
opposing views about the effect on investment decision through the age of executives.
In addition, it has been suggested that the age of the CEO plays a vital role in generating income, but
not much has been shown for the link between CEO age and corporate fraud. Studies by Barro and
Barro (1990) show how CEO age may result in generation of income by keeping the retirement age at
52 years. The retirement practices are higher when the age is above 52 years and lower when less
than 52. Hence, after the retirement age, an individual has little prospects of continuing his position
as CEO. However, in cases where CEOs execute extraordinary work, they are less likely to retire
during their age of retirement.
Kensinger stated that to consider the merits of the CEOs’ stock ownership against option-like
compensation needs to take into account their age and decision-making since they respond in a
different way based on their life stages (Kensinger, 2012). In the work of Sharma (2011), it was
114
found that younger CEOs tend to undertake riskier strategies than their older counterparts. Kensinger
stated that age plays an important function in the optimal level of employee ownership. Since the
time horizon of older CEOs is shorter than that of younger CEOs and since the former cannot rely on
legislation to iron their investment performance over time, they are more risk averse compared to
younger CEOs. Hence, older CEOs can be described as less fearful and less acquisitive than younger
CEOs, which then allow them to respond differently to incentives. This might explain the reason why
it is often that boards of directors tend to appoint a younger CEO to lead the functional areas of the
firms. This way, the firm benefits from age and experience as well as from enhanced effectiveness of
incentives of younger CEOs (Kensinger, 2012).
In a study of MacCrimmon and Wehrung (1990), it was emphasised that the more successful a CEO
is, the more likely it is for him to take risks, and the more mature he is, the more he intends to avoid
risks. Relating this to the assertion of Kensinger (2012) where the author found that younger CEOs
are given the tasks to lead the functional areas of the firm, such position would likely allow CEOs to
become successful, or is in fact the basis for their being foreseen to succeed, which is the reason for
their appointment in the first place, and which hence relates to MacCrimmon and Wehrung’s findings
towards being successful. Moreover, as it is a general knowledge that maturity comes with age, this
therefore suggests risk aversion amongst older CEOs.
This propensity of younger CEOs towards risk-taking than older ones is supported by the work of
Jones (2009). Younger CEOs are more willing to undertake greater strategic change and are more
prone to risk-taking. Apart from this, their skill set is more updated due to their acquisition of recent
technical knowledge than their older counterparts.
The risk-taking propensity of CEOs based on age is also highlighted in the work of Berger, Kick, and
Shaeck (2012) where the authors claimed that the risk-taking stances of financial institutions are
influenced by age, education, and gender composition of executive teams. They found out that
younger CEO teams tend to have increased risk-taking, as do board changes, leading to a higher
proportion of female executives. The authors’ initial enquiry was how risk-taking affects the age
composition of the CEO board. Empirical evidence demonstrates that risk-taking tends to decrease
with CEO’s age. It was also found out that risk tolerance is likely to decline with age; hence, older
executives are less risk- tolerant than their younger counterparts. Grable et al. (2009, cited in Berger
et al., 2012) attributed this finding to older CEO’s growth in attained knowledge of risk and risky

115
situations associated with young people. It was also pointed out that younger individual inexperience
leads to misattribution of success that hence results in upward revisions of one’s ability to control
risk. Over time, however, people are more able to assess their abilities, leading to reduction in their
risk tolerance. In addition, research suggests that mature CEOs take lesser risk than non-mature ones
(Berger et al., 2012).
Consistent with the findings of earlier authors cited in this review, Serfling (2012) found that risk-
taking behaviours tends to decrease as the CEO becomes older, and such reduction of firm risk is
usually demonstrated by carrying out less risky investment policies. In particular, older CEOs are less
likely to invest in research and development compared to their young counterparts. They also found
out that when the CEO and the next dominant executive are older, the riskiness of corporate policies
tends to be at their lowest. This is contrary to the situation with younger CEO and the next dominant
executive, where the riskiness of corporate policies tends to be at their highest. Lastly, the authors
determined that less risky firms tend to purposely employ older CEOs, and more risky ones employ
younger CEOs to bring into line CEOs’ propensity for risk and the risk preferences of the firm
(Serfling, 2012).
However, younger CEOs have more to lose in case of dismissal due to poor performance, and they
are also more likely to be dismissed by the board than their older counterparts (Kensinger, 2012).
Rezaee (2007) also pointed out that younger CEOs may not possess the adequate experience and
reputation enjoyed by older CEOs, which might impact negatively on the firm’s monitoring and
control mechanisms. In the departing directors of S&P 500 firms in 2005, 90 percent of the firms
cited retirement as the reason for CEO departures, suggesting that these CEOs have reached their
retirement ages when they left their positions. It was pointed out that the general consensus amongst
firms in terms of age of the CEO and directors is that firms must establish mandatory retirement ages
and term limits for their position.
It was also emphasised in one study that 91 percent of audit committee members, who were
independent directors, were 50 years old and older (Baker and Anderson, 2010). This majority
composition suggests that firms tend to employ older directors than younger ones.
116
Moreover, experience is correlated with age, and firms tend to look at young executives as having not
established adequate experience and equipped decision-making capability as do older ones (Hart,
1995).
The prevalence of older CEOs in firms is exemplified by the findings of Young and Buchholtz
(2002). The authors indicated that the average CEO age in their sample was 58, with the youngest
CEO aged only 28. This reveals that since 58 years old is the average age of the CEOs in these firms,
it therefore implies that firms generally employ more CEOs who are older than younger ones. Having
established this, the risk-taking factor of younger CEOs, although significant, cannot therefore be
taken as sole determinant for firms to altogether discount the experience and knowledge of older
CEOs.
The age of the CEO has not been linked to the probability of impaired judgement in any of the
studies found. However, there exists a strong correlation between wisdom and age with that of
making decisions in personal or professional life. This fact has been highlighted by cognitive and
development psychologists who studied the relationship of age and competency levels.
Older CEOs are likely to be more conservative and this has a positive impact on firm performance,
but also less likelihood of fraud (and increased CEO tenure means less fraud) (Stevens et al., 1978).
However, fraud happens amongst single firms – it is a singular activity by one firm, where cartel
formation on the other hand has different and more social dynamics. Older CEOs may have strong
established social networks that enable the communication necessary to cartel formation compare to
younger CEOs. Older CEOs may have worked for many organisations and established a number of
strong networks. As a result, engaging in collusion with other firms will be less difficult (Beasley,
1996). Older CEOs established in certain industries can also understand how those market structures
perhaps make the formation of a cartel agreement a ‘rational decision’. Therefore, the proposition
below is tested by controlling for poor firm financial performance, firm ownership status, current
ratio, firm sale, and Herfindahl index. Positive coefficient is expected:
P9: The age of CEO for cartel firms is higher than non-cartel firms
CEO Tenure
Using the tenure of a manager to monitor the activities of the firm can prove to be efficient as stated
in the literature (Weisbach, 1988). This literature states that organisational performance and
117
managerial turnover have a negative relationship and that the resignation of a CEO also affected the
accounting performance and stock returns negatively (Weisbach, 1988). A study states that there is a
negative and significant effect of abnormal returns on the change of CEO. This result has been
provided by Coughlan and Schmidt (1985) who analysed the fluctuation effect in abnormal stock
returns on the probability of the change of CEO.
In a particular study by Barro and Barro (1990), top management levels such as the CEO and the
head or chairman of the board were linked to the stock returns of the organisation (Warner, Watts,
and Wruck, 1998). The results demonstrate a positive relationship between two aspects; however this
is only significant when there is a really good or a really bad performance. CEO pay and turnover
have also been analysed by Barro and Barro (1990) by taking into account CEOs in commercial
banks from 1982 to 1987. The relationship between firm performance and CEO departure has been
analysed using logit regressions. Results show a negative relationship, alongside a significant and
improved performance that can reduce turnover levels.
One single individual has been held responsible for the operating and financial decisions being
carried out in corruption practices. This is found by analysing fraud cases, where 75% of the cases
provide similar results (Loebbecke et al., 1989). With this condition, the management conducts
corruption activities but with the help of two variables CEOTENURE and BOSS it would be possible
to carry out the monitoring processes. The established CEO has the highest power to monitor the
corruption practices being carried out by any of the board of directors (Mace, 1986; Patton and
Baker, 1987; Vancil, 1987; Hermalin and Weisbach, 1988).
Rajagopalan and Datta (1996) examine the link between the characteristics of CEO and
comprehensive industry conditions using data from manufacturing firms in the United States. The
results indicate that a limited role is played by industry conditions in tackling differences in CEO
tenure, educational background, and functional heterogeneity. Regression analysis results suggest
that there are generally small differences between the two groups’ industry coefficients albeit
alignment is shown between high performers and CEO characteristics.
Besides, in contrast to the conventional wisdom, short-term contracts with fixed salary mechanisms
weakly enhance the cartel stability. Gillian, et al., (2009) found that the median and mean duration in
a sample of 184 S&P 500 CEO contracts is 3.4 and 3.0 years, respectively. Likewise, as a result of
118
375 CEO employment contracts of large public corporations, Schwab and Thomas (2006) found that
81% specify duration of 5 years or less, with a mean of 3.6 years.
Furthermore, a study by Jenter and Lewellen (2010) shows that CEO turnover decisions are
extremely sensitive to stock price performance. Using a sample of 2,569 publicly traded U.S. firms
from 1992 to 2005, the authors found that 44% of CEOs left the firm within 4 years as a consequence
of bad firm performance. These empirical results illustrate that executives usually have a short-term
renewable employment contract, that is, a contract for a fixed period of time which is renewed if and
only if the firm performs adequately well.
Moreover, a study by Han (2010) examines short-term and long-term employment contracts and their
effects on cartel stability. The study shows that firms are more likely to be involved in cartel
agreement when CEO tenure (short-term employment contract) is low or when CEO turnover is high.
Han shows that a short-term contract provides stability to a cartel formation more than a long-term
contract. If a certain profit margin is achieved, only then is the short-term contract renewed. With the
help of this activity, firm performance is enhanced and defection from the collusion has taken place,
which diminishes the chances of being laid off. Firm performance may be hindered due to any kind
of future punishment potentials which is why the chance of being laid off increases. The stability of
cartel is influenced by these re-employment trade-offs which are tangled with the monetary trade-
offs. A long-term contract does not affect stability when the fixed salary components are applied. The
fixed components affect the short-term contract to an extent. Cyclical collusive pricing also takes
place due to the short-term renewable contracts that may be extended after a certain period of time. It
is also observed that equity-financed firms are not able to provide as much stability to cartels as much
as debt financed firms.
CEO turnover was the emphasis of the study of Kaplan and Minton (2008) for large U.S firms,
serving as samples from 1992 to 2005. Their initial finding was that CEO tenure declined, indicating
the precariousness of the job compared to the past years. When the authors included the external
takeovers, a decline in the average CEO tenure was found, that was less than six years for the period
of 1998 to 2005. Compared to those reported in previous research, substantially shorter tenures have
been reported recently. For individual CEOs, some of the benefits of increased pay over this period
were likely offset by the shorter expected tenure. It was also found out that it is possible for CEOs
with shorter tenure to pursue manipulation in the form of earnings management with the situation that
provides greater stock performance sensitivity and higher compensation. Sharma (2011) noted that
119
long CEO tenure is linked to performance conformity whilst short tenure is associated with the
propensity to make strategic change. He also found out that CEO age is positively related to the
CEO’s tenure with the firm.
Compensation is said to be affected by CEO tenure since there is a tendency for CEOs with longer
tenure to earn more than those with shorter tenure. Additionally, older CEOs tend to earn more than
their young counterparts. It is also more likely for those with stock ownership to make more than
those without. Beasley (2012) found out that the more increased connection the CEO has with the
firm’s directors; the weaker the governance structure tends to become (Beasley, 2012). Executive
compensation can therefore be described as a complex system because of its link to risk-taking and
corporate governance (Beasley, 2012).
Beasley, (1996) conducted another logit analysis between fraud and non-fraud firms, using CEO
tenure as an independent variable (Beasley, 1996). The basis of Beasley’s study is much closer to the
study conducted here, and in fact Beasley’s study used similar variables CEO tenure and overlap of
the CEO and board chair roles (BOSS) in the logit analysis. The variable BOSS was also found to be
positively correlated with the likelihood of financial fraud misstatements. The finding also agrees
with how long-tenured CEOs are less likely to have appropriate strategies (Wiersema and Bantel,
1992). This is of interest if cartel activity is accepted as a measure of a lack of strategic change
ability, i.e. opting for the status quo amongst cartel firms.
According to Miller (1991), long-tenured CEOs are less likely to achieve the match between an
organisation’s strategy and structure on one hand, and the challenges set by its environment, on the
other, than their short-tenured counterparts. In a more particular manner, an inverse relationship
exists between CEO tenure and the prescribed match between organisation and environment,
especially in indeterminate settings and with ownership concentration. A positive relationship
prevails in the match between environment and strategy on one hand, and financial performance, on
the other.
In the study of Lausten (2002), it was emphasised that inverse relationship prevails between CEO
tenure and firm performance, with evidence showing a range of measures for corporate governance
and corporate performance. The threat of turnover serves as an ensuring factor that CEOs act
120
according to the interest of shareholders. Additionally, the ownership of the firm reinforces the
relationship between CEO turnover and firm performance.
Therefore, it can be argued following to Han (2010), Beasley, (1996) and Kaplan and Minton (2008)
that CEOs in cartel firms have a shorter tenure than CEOs in non-cartel firms. Therefore, the
empirical proposition below is examined to test for the relationship between the length of the CEO’s
service on the board and cartel formation, the CEO tenure (CEOTEN) was included in the model.
Similar to Chaganti et al., (1985) and Shivdasani (1993) the CEO tenure was calculated as
uninterrupted years on the board. Controlling for poor firm financial performance, firm ownership
status, current ratio, firm sale, and Herfindahl index, a negative coefficient is expected:
P10: The number of years a CEO had served as a director for a cartel firm is less than that
for non-cartel firms.
CEO Gender
Oppression of women has always been present in the workplace, especially amongst the higher
management. In today’s world of corporate finance the CEO is responsible for the operations of the
firm hence his/her decisions are given priority accordingly. Several scholars discussed gender issues
with regards to different areas for instance, firms’ performance, market reaction, and risk taking
behaviours, etc.
According to Brennan and McCafferty (1997), there have been recommendations that there are two
benefits of keeping women on board. One benefit is that women may know more about needs of
customers, have more knowledge of consumer behaviour and chances for firms of meeting needs of
customers. Another benefit is that women are more independent since they are not part of the “old
boys” network. These are some evidences that state that a firm’s value can increase when there are
women on the board. There could be competitive advantage attained by a firm by keeping women on
the board as it would first lead to improved corporate governance (Bernardi et al., 2002).
Evidence from the U.S market about the effects of gender on the reaction of the stock market
subsequent to a CEO appointment is indicated in the study of Triki, Sami, and Ureche-Rangan
(2012). The study likewise makes an assessment of the impact of the characteristics of female
candidates on observed returns. The findings suggest that a significant difference does not exist in the
121
stock market reaction subsequent to a CEO appointment. However, a negative effect on observed
returns is indicated by nomination of insider female candidates. Moreover, the sector of activity
where the firm operates affects the market reaction.
Another study conducted by Burke and Mattis (2000) shows that response towards women CEOs of a
firm by the overall markets is unappreciative. According to Hallock (2002), the inequality of salary
between male and female CEOs is due to the characteristics of the job and the workers. Mohan and
Chen’s (2004) study shows that the IPO pricing is irrelevant towards male or female CEOs. Recent
studies show that women in higher management levels tend to produce better financial results
(Welbourne, 1999; Catalyst, 2004). According to Wolfers (2006), firms with women leaders are
capable of making mistakes on a large scale. This kind of bias is mostly found amongst male
analysts.
A study carried out by the US non-profit organisation for women’s advancement. This study showed
that in Fortune 500 firms characterised by higher proportion of women in top level management,
there was 34% increased total return to shareholders and 35% higher return on equity. Hence, firms
with most proportion of women in top level management performed considerably better than those
with the lowest proportion of women (Catalyst, 2004).
Cheung and Hernandez-Julian (2006) as well as Swamy et al. (1999) exhibit in their studies that men
have more ability to be corrupt than women. Factors such as experience and work attitude between
men and women have shown that women have less chances of being corrupt as compared to men.
According to Sundén and Surette (1998) and Bernasek and Shwiff (2001), when it comes to the
provision of wealth in pensions, women are considerably more risk averse. In a study on betting
behaviour of men and women by Bruce and Johnson (1994) and Johnson and Powell (1994), it was
observed that women show a lesser inclination towards risk-taking than men. Variations in risk-
taking in both genders are also present in a military framework (Hudgens and Fatkin, 1985).
The following different works depict that female fund managers are generally more risk averse than
men or at the least, both are equally risk-averse. Thus, differences in both genders are mainly in
terms of risk-aversion. Through the research of Niessen and Ruenzi (2007), it can be stated that
female fund managers are more risk-averse that male fund managers; they follow less risky

122
investment patterns that are also temporally steady than those of male fund managers, and do not
diverge too much from benchmarks. When Atkinson, Baird and Frye (2003) compared the
investment behaviour and performance of both genders fixed-income mutual fund managers, it was
found that funds managed by each gender are not very different from each other. This could be said
in relation to risk, performance, and other related features. Moreover, male fund managers trade more
than female fund managers. Thus, when the various risk-adjusted performance measures were used,
there was no considerable difference in the average performance of male and female managed funds.
Additionally, the Meta-analysis is an example of a study on the presence of gender differences in the
tendency to take risks. Its results stated that it is quite apparent that “male participants are more likely
to take risks than female participants” (p. 377). This study was conducted by Byrnes, Miller, and
Schafer (1999) who studied more than 150 papers on gender differences in risk perception.
Considering the existing research, there had been other important researches that include five various
content domains to evaluate the risk that can be observed in the behaviour of men and women. These
domains are health/safety, ethical, social financial and recreational decisions. It was observed that
men are less risk averse and have greater tendency to work with risky behaviours. Four out of five
domains depicted gender differences, social decision making being the exclusion. This study was
conducted by Weber, Blais, and Betz (2002). Even in a big German sample conducted by Johnson,
Wilke, and Weber, 2004, using these domains, similar gender differences were observed. These
above mentioned researches were carried out to evaluate in depth the generality and cognitive
foundations of these differences (Slovic, 1997).
In relation to gender differences in risk attitudes, a research was conducted, which showed that
context is quite important (Schubert et al., 1999). Women and men’s risk attitudes were checked in
this test in terms of their similarities or differences in relation to whether they have to decide on
certain investment or insurance problems (no differences exist) or an abstract gamble (differences
exist). The outcome of the study was that there were no noticeable gender differences when it comes
to real-life contexts such as financial decisions. This could lead to the thought that noticeable gender
differences may be present in terms of differences in opportunity sets. There are even more
researches showing that women might be more risk-averse (Hershey and Schoemaker, (1980)).
Lately, newer surveys observed that whilst having equal economic status, portfolios of single men are
more risky than single women (Jianakoplos and Bernasek, (1998); Sundén and Surette, (1998)).
123
Compared to men, women are more in favour of using financial advisers; they have lesser risk
preferences and a greater amount of anxiety when it comes to financial decision-making (Stinerock et
al., 1991).The effect of gender on asset allocation in retirement pension accounts was evaluated by
Powell and Ansi c (1997). According to the authors, the allocation of investments in retirement plans
is affected by gender differences. The final outcome of the study was that when it comes to selection
of allocation of funds in their retirement savings account, women tend to show increased risk
aversion. Another study examined the association between gender and the investment plan of a
person who has the opportunity to select his own retirement plan. This was conducted by Sundén and
Surrette in (1998). According to the study, asset allocation decisions were not affected by age and
education; however, marital status and gender do influence the decision of individuals in the
allocation selection of assets in the pension account.
Research usually examines the results of decisions made by men and women instead of the whole
decision-making process, which makes it hard to understand the element of gender differences.
Gender differences could also be due to gender discrimination and different choices made by
individuals (Bajtelsmit and Bernasek, 1996). There have been studies stating that in a number of
activities comprising financial decision-making, women show increased risk aversion than men
(Hintz, et al., (1997); Jianakoplos and Bernasek, (1998); Bajtelsmit and Bernasek, (1996)). However,
there are also those showing completely different results, which state that in relation to premium
pension portfolios, married women are willing to take more risk than unmarried women (Sundén,
2004). Another contrasting study is that women, under controlled economic conditions, generally do
not make less risky financial decisions. This study is in contrast with the studies mentioned earlier in
terms of variations in how male and female opportunity sets are framed (Schubert, et al., (1999)).
Byrnes et al., (1999), in a Meta study of 150 previous studies, compared the risk-taking inclinations
of male and female participants in different risky activities. They stated that men are willing to take
more risk than women and as age increases, this gender difference in risk taking tends to decrease.
Gender difference existed differently amongst many activities and decision contexts. In another
study, it was observed that women are more risk averse than men. It was stated that female fund
managers “take less risk and follow a less extreme investment style” (Niessen and Ruenzi, 2006).
However, the authors also stated that there has been no indication of difference in fund performance
even with the presence of risk-related behavioural differences between female and male fund
124
managers. Thus, with the risk-averse investment approach of women, similar results were drawn.
According to Barber and Odean (2001), men trade 45% more than women. This was found through
an analysis of the common stock investment behaviour of men and women from February 1991 to
January 1997 in the USA. According to the authors, since men are more confident, they tend to trade
more frequently than women. There was an observation, after seeing outcomes from controlled
experiments, that women seem to be more risk averse than men and that they invest less (Charness
and Gneezy, 2004).
It is stated that when seen in the context of corporate decision making, gender differences may not
exist. This is because either the women would try to outdo men when it comes to taking risk or since
the decision would be made together by men and women, there could not really be gender differences
in the decision made. Women could also be following the pattern of men in relation to risk taking
behaviour, thereby removing any gender differences. When the stock-selling behaviour of male and
female executives is observed in relation to stock option rewards, it can be indicated that since male
executives are more into diversification-related stock sales than female executives, male executives
are more risk-averse (Zahid, et al., 2006). Hence, when discussions on whether female executives or
male executives are more risk averse, the outcomes are quite varied. Women are inclined to take less
risk and follow a less extreme investment strategy when they play the role of an individual or
institutional investors (Barber and Odean, 2001; Charness and Gneezy, 2004; Niessen and Ruenzi,
2006). However, men are more risk averse than women executives when they are corporate
executives (Zahid et al., 2006).
Moreover, an analysis of 150 studies ranging from 1967 to 1997 was made by Byrnes, et al., (1999).
In their study, a comparison was made on male and female risk-taking inclinations in a number of
different settings. It was observed that in 14 out of 16 different activities, men were more willing to
take risk than women. In a survey of economic literature conducted by Eeckle and Grossman (2003),
drawing outcomes from field studies, abstract gambles and contextual experiments were analysed and
compared. The results from laboratory experiments were less certain but field studies led to the
decision that women are more risk-averse than men.
Consistent with the previous studies this study expects to find a similar result to Cheung and
Hernandez Julian (2006); Swamy, et al. (1999); Zahid et al., (2006); Eeckle and Grossman (2003);
and Byrnes, et al., (1999) that women (CEOs/executive) are less likely to participate in risky
125
activities of corruption and they are risk-averse. The proposition below is empirically tested by
controlling for firm ownership status, current ratio, firm sale, and Herfindahl index. Negative and
significant coefficient is expected.
P11: Female CEOs are less represented in cartel firms than in non-cartel firms.
Multi-directorship (Busy Directors)
Busy directors, as defined by the National Association of Corporate Directors (1996) are those who
have more than three directorships and six for directors who are retired. A CEO is said to be busy
according to the number of directorships he/she holds. Shivdasani (1993), in his research, shows that
the efficiency of a director holding a number of directorships has no harmful connection with the
problems faced by the agency.
Ferris et al (2003) found in their study that directors nearing retirement age might consider multiple
directorships. Age is said to serve as a proxy for the director’s experience and the energy needed for
the demands of board service. The study found that the regression for the number of directorships
vis-à-vis age involves a significant positive co-efficiency. It also suggests that older directors with
greater experience of directorships are no longer interested in additional directorships or might pose
as less attractive candidates. The average age of directors is also older in boards with multiple
directors. In a particular corporation, arbitrary terms are not held by the board as a limitation that may
be imposed on directors’ service. The board does not also maintain a position that directors must be
remunerated annually until upon reaching the mandatory retirement age (Clayman, Fridson, and
Troughton, 2012). It must be noted that Ferris et al. (2003) have not seen any association between
multiple directorships and increased likelihood of fraud litigation. The evidence they gathered
demonstrated that calls to limit directorships were not supported.
Studies by Fama and Jensen (1983) show that those directors with numerous of directorships, are
more likely to be hired by firms. Good governance practices are found in those directors who are part
of more than one board and carry out multi-directorship. According to Gilson (1990), Kaplan (1994),
Brickley, Linck and Coles (1999), Shivdasani (1993) and Ferris et al. (2003), efficient work is related
to the number of directorships a director holds. The results of these authors show that boards of
directors of firms committing fraud are less likely to have directors who work on other boards,
compared with boards of directors amongst non-fraud firms.
126
In the contrary, Roe (1994) and Jensen (1993), argues that directors holding multiple directorships
may not be able to make effective decisions. Shivdasani and Yermack (1999) study shows that busy
directors have a high likelihood to be chosen as directors by the firm managers. Some believe that
numerous number of directorships do not affect the goals of a firm. An Act passed in the United
States known as the Clayton Act considers it as illegal if a director holds directorships of rival firms
in the U.S and if joint as a sole firm there would be a serious violation of the antitrust laws. However,
two out of eight rival firms is combined together as a single corporation in the U.S. (Roe, 1994)
Firms have been generally criticised by shareholder activists and institutional investors for having
appointed directors with multiple directorships in different firms, maintaining that these directors are
not capable of effectively monitoring the management of several firms. Mainstream critics such as
Chancellor William Allen (1992) argued that time and resources must be committed to effective
monitoring. It has been claimed by the Council of Institutional Investors (1998) that if there are no
atypical and highly specific circumstances prevailing in the firm, full-time directors must not occupy
more than two other boards. By contrast, the Business Roundtable (1997) advised that firms must be
required to limit the number of directorships.
Directors themselves were not in favour of the exercise of multiple directorships due to insufficiency
of time for discharging their professional responsibilities, which is the most common reason for such
refusal (Lipton and Lorsch, 1992). Moreover, it was revealed in a survey of directors of Fortune 500
firms that a director experienced too much burden with too many board appointments. About 56
percent of outside directors have also reported having refused an invitation for additional board
assignments due to lack of time. It is apparent that these directors perceived that excessive board
assignments might dispel their time and attention and might also cause them to undermine their
ability to monitor management. The same study also discovered that majority of directors held that
limitation must be placed on the number of boards in which CEOs and other inside directors were
appointed. However, directors were evenly divided in terms of whether outside directors must indeed
be given limitation in their management of the firm. Therefore, it has been a controversial topic to
whether an individual director’s capacity to monitor management is impaired by his exercise of
multiple directorships. Despite such controversy, only little research was carried out involving the
impact of multiple directorships on corporate performance (Lipton and Lorsch, 1992).

127
It was also reported that positive relationship exists between one’s potential to commit accounting
fraud and an outside director’s average number of directorships (Beasley, 1996). Similarly, busy
directors tend to set CEO compensation at excessively high levels, which in turn results in poor firm
financial performance.
However, other evidence indicates that multiple directorship is positively related to firm success, as
shown by the results involving Japan’s cotton spinning industry during the 20th
century, where
directors held multiple directorships (Miwa and Ramseyer, 2000). It was also reported that larger
premiums in tender offers were received by shareholders when multiple directors were included by
the board (Cotter, Shivdasani, and Zenner, 1997). In addition, superior acquisition-related returns
were enjoyed by firms when their directors held multiple directorships. These studies indicate that
multiple directorships are parallel with shareholder interest. The specialised settings and
circumstances of these results however place the generalisability of these results to becoming open to
question.
Moreover, Pfeffer and Salansik (1978) posit that firms can benefit from the boards through these
boards’ stance to act as channels to communicate information between the firm and external
organisations. This way, organisations are able to reduce uncertainty related to strategic decision
making. Other firms are also able to observe other firms by means of their board interlocks and hence
facilitate inter-firm learning and dispersion of ideas, strategies, practices, and behaviours (Strang and
Soule, 1998).
Therefore, this study follows Gilson (1990), Kaplan (1994), Brickley, Linck and Coles (1999),
Shivdasani (1993) and Ferris, Jagannathan and Pritchard (2003), who have argued that boards of
directors of firms committing fraud are less likely to have directors who work on other boards,
compared with boards of directors amongst non-fraud firms. In similar vein to the previous studies by
controlling for poor firm financial performance, firm ownership status, current ratio, firm sale, and
Herfindahl index, this study empirically tests the proposition below; negative coefficient expected:
P12: Boards of directors of a firm committing cartel crime are less likely to have directors
who work on other boards, compared with boards of directors of non-cartel firms
128
CEO/Chairman Concentration Power
According to the Cadbury Committee Report (1992) CEO concentration power should be
disapproved. This came about through the belief that when an individual holds two titles, corporate
governance may suffer due to the ensuing conflicting interests.
Mixed results are once again achieved when the CEO’s role is differentiated from that of the
chairman of the board (Zahra and Pearce 1989; Dalton et al., 1998). The impact of this disintegration
on board performance is likely to be favourable, as the principle-agent view suggests, because the
power of the CEO is distinguished from that of the Board Chairman (ibid).
The dual nature of the leadership of the board was examined by Berg and Smith (1978) using four
performance measures. Only one measure, total return to investors, showed that when the roles of
CEO and Chairman were combined, the performance was negatively affected. Mixed results were
attained by Boyd (1995), showing the positive impact of concentration power of leadership in some
cases and the opposite in others. However, he stressed that the corporate governance movement of
separating the role of CEO and chairman was not supported in his studies.
Firm bankruptcy did not come about through the integration of the Chairman’s and CEO’s role,
according to Changanti, et al., (1985). Alternatively, Rechner and Dalton (1989) ascertained that
financial performance was not enhanced when these roles were dissociated. Evidence was found in a
following study by Rechner and Dalton (1991) regarding the better performance of those firms that
had an independent board rather than those who had a combined role of CEO and Chairman of the
Board. The meta-analysis of Dalton, et al., (1998) conversely determined the lack of relationship
between financial performance and board leadership.
Core, Holthausen, and Larcker (1999) report that CEO/Chairman concentration power is linked to
higher CEO compensation, and Goyal and Park (2002) show that CEO concentration power reduces
the sensitivity of CEO turnover to firm performance
Combining the positions of the CEO and the chairperson is often done by firms, thereby allowing the
CEO to carry out managerial and oversight functions – two important functions of corporate
governance. The CEO therefore oversees the direction of the firm and at the same time, manages its
129
operations. The CEO in a concentration power must have vision, strategy, problem-solving skills, and
motivation (Rezaee, 2009).
It is said that 75% of fraudulent cases of financial statements studied by Loebbecke et al. (1989)
show that only one individual is responsible for operating finances and making financial decisions,
thus giving a chance to defraud easily. As Jensen (1993) argues, besides his/her own interest, a CEO
is not authorised to take charge over the chairperson’s monitoring job of financial statements.
The CEO is the most authoritative and dominant person of the firm. The Chairperson of the board has
the responsibility to employ, evaluate, compensate and dismiss the CEO of the firm. Meetings of the
board of directors are conducted by the chairperson as well. To create an efficient monitoring system
by the board it is necessary to make the chairperson and the CEO of the firm into separate entities
(Mintzberg, 1983).
There are many different views on the CEO concentration power and firm performance levels;
however, Dalton (1992) states that there exists no relationship whatsoever. Coles et al. (1997) also
find that there is no negative relationship between the two. A sample of fortune 500 firms is taken
into account by Rechner and Dalton (1991) which shows that the concentration power of the CEO
provides a positive effect on the performance of the firms. If there is no concept of CEO
concentration power in the firm, it is therefore very much sensitive to the CEO turnover and firm
performance levels (Goyal and Park, 2002). Many of the agencies present in the U.S. have
established regulations against CEO concentration power due to the insider activities taking place; for
instance, the recent division of the roles of Chairman and the CEO of the NYSE.
There is an impediment to the ability of the board to supervise managerial activities due to CEO
concentration power, as Fama and Jensen (1983) and Jensen (1993) put forward, leading to a rise in
the cost of agency. Firm performance is consequently going to be enhanced when the roles of
Chairman and CEO are separated.
CEO concentration power, however leads to an improved performance of the firm by providing a
definite leadership that takes care of strategy development and implementation, as the arguments of
Stoeberl and Sherony (1985) and Anderson and Anthony (1986) suggest.
130
When there are separate roles of the CEO and chairman, the issues of cost of sharing information,
disputes between the two parties and inefficiency may arise. Communicating information pertinent to
the organization in a timely manner may be costly; it would be difficult to find out who is responsible
for the poor performance of the firm and the process of making and implementing decisions may not
be as efficient when there are two leaders instead of one.
Accounting performance measures of the banking industry and CEO concentration power are
negatively related as has been determined by Pi and Timme (1993). When there was a change in the
status of concentration power, there was no subsequent change in performance according to Baliga,
Moyer, and R. Rao (1996). No substantial difference is found by Daily and Dalton (1997) with
respect to performances with dual CEO or non-dual CEO organizations.
A positive relationship has been provided by Dahya and Travlos (2000) with respect to CEO
concentration power and firm’s success. The separation of the roles CEO and Chairman of the Board
in the UK firms does not show an improvement in the performance of these firms (Dahya, 2005).
According to Faleye (2007), organizational intricacy, managerial ownership and CEO reputation
have a positive relationship with CEO concentration power, suggesting that the costs and benefits of
having an alternate leadership are not considered by the firm.
The CEO attains a huge base of power and locus of control when he also holds the title of the
Chairman (Hambrick and Finkelstein, 1987; Patton and Baker, 1987; Harrison et al., 1988), which
weakens the control of the board on decisions (Morck et al., 1989). Achieving the CEO’s agenda,
which might be significantly different from the goals of the shareholder, becomes easier when there
is a weakening of board control (Mallette and Fowler, 1992). Thus, when the titles of CEO and
Chairman are combined, there would be a deteriorating control on the board, resulting in poor
performance of the firm as the agency theory suggests.
Following Fama and Jensen (1983) and Morck et al., (1989) who have documented that CEO
concentration power could hinder board’s capability to monitor management and thus raise the
agency cost. Therefore, to test for the CEO’s ability to affect the board monitoring, this study
includes (BOSS) variable for situations where the CEO and chairperson positions are combined using
a measure consistent with that used in Shivdasani (1993), and Beasley (1996). Controlling for poor
131
firm financial performance, firm ownership status, current ratio, firm sale, and Herfindahl index, a
positive and significant coefficient is expected;
P13: Firms that commit cartel are more likely to have CEOs serving as board chairs
compared to non-cartel firms.
3.6.4 Does CEO Compensation Scheme Matter?
Top management levels are responsible for deciding on forming cartel and imposing this decision
upon the management who strives to hide any kind of collusive agreement (Harrington, 2006a).
Many compensation schemes are provided to top managers and it is necessary to understand if these
schemes may help in stopping the managers from forming collusive agreements.
In the 1990s, managerial compensation and empirical literature relating to this was much more
popular than the 1980s (Jensen and Murphy, 1990). Along with dynamic competition in the market,
several incentive schemes have been developed, including bonus contracts by contractors to
thoroughly understand the competitive behaviour. Collusive agreements are managed efficiently by
those managers who have limited incentives and bonus plans (Spagnolo, 2005).
The incentives provided to a manager decline as the period increases. He also receives less marginal
utility from higher profitability. They start to believe that a price war would help them reap more
benefits in the form of profits rather than carrying out the collusively agreed strategies. To avoid this
issue it has been recommended that bonuses and compensation caps must be provided to the
managers in the form of schemes (Healy 1985; Gaver et al., 1995). These bonuses would be provided
if firm profitability is up to a certain level. As profits increase, bonuses also increase. However, it is
always found in firms that an upper bound is set on the bonus above which the profits are not
provided (Murphy, 1999).
Moreover, stock-based compensation plans have been introduced in the business world to build a
positive attitude within the managers and reduce the tacit collusion and social welfare activities. A
period of four years is usually observed where the liquid plans awarding stock based bonuses are
provided, after which, a new plan is formed after the period expires (Kole, 1997). A classical model
of repeated oligopoly can also incorporate this plan to manage the collusive behaviour. In a perfect
potential stock market, the dividends are justly distributed and the incentives may be deferred,
132
causing compensation packages to enhance the collusion (Spagnolo, 2000). With the help of the
stock-related incentives, the management of the organisation is linked strongly to the profitability of
the organisation.
The collusion stability may be improved with the help of stock related compensation since the stock
market foresight may be perfectly informed about the collusive agreements. The punishments that
have been decided may be discounted in the current stock prices which would reduce the levels of
gain from defection (Spagnolo, 2000). Managers prefer a smoother stream of profits where they
carry out collusion activities, which can create stability (Spagnolo, 1998). If they do not have this
stream then they become highly dissatisfied with the incentive, which leads to low punishment profits
for the future. If the selected bonus is efficient then the defection gain will be limited and the
collusion would show stability (Spagnolo, 1998).
Executive compensation is used by shareholders as a way of lining up managerial interest with their
own since CEOs/executives are the agents of shareholders, irrespective of the gender. Although since
women executives have been found to be risk averse or have a risk seeking behaviour, as mentioned
previously in the thesis, their reaction to risk incentives as part of the executive compensation might
be different. To be protected from a downside risk is the mostly thought of reason for stock option
compensation. This is because a stock option, also being a call option on the firm’s shares is only
linearly linked to the stock price when the stock price goes beyond the exercise price of the option
(Feltham and Wu, 2001). Another reason is that as the firm’s stock return is volatile, the value of the
stock option rises. This is because of the convexity of payoff i.e. tremendously high stock option
value at high stock values. Therefore, through stock option compensation, risk-averse managers are
encouraged to be involved in risky investment projects including risky acquisitions and managerial
risk aversion is also offset (Guay, 1999; Datta et al., 2001 Coles et al., 2005).
There is another way through which an incentive is given to managers to increase the performance of
the firm. This is restricted stock, which is a type of equity based compensation, and is linearly linked
to the stock price. However, this method, leads to too much risk of the managers’ wealth and even
increases managers’ risk aversion since the linear payoff does not reduce the down-side risk (Bryan
et al., 2000; Ryan and Wiggins, 2002). Male and female CEOs and executives may react in different
ways to the pay-for-performance incentives which however do not restrict downside risk. This is
because there are gender differences in risk taking. There has been experimental study which
133
compared both compensations, showing that option-based compensation leads to increase in risk-
averse managers to go for risky but value-increasing investment projects, than is done by stock-based
compensation (Bryan et al., 2000).
Therefore, following Spagnolo (1998, 2000 and 2005), this study empirically tests the following
propositions; positive and significant coefficient is expected from all.
P14: The average CEO bonus for cartel firms is higher than non-cartel firms.
P15: The average CEO share for cartel firms is higher than non-cartel firms.
P16: Total CEO compensation for cartel firms is higher than non-cartel firm.
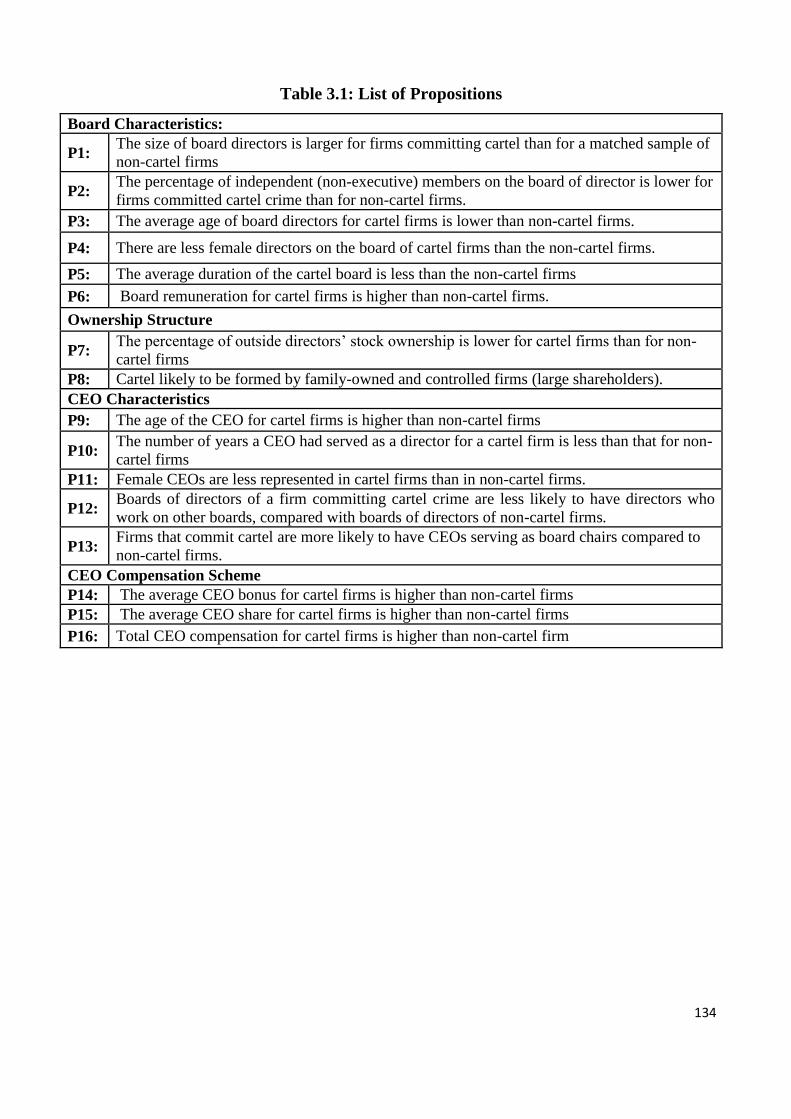
134
Table 3.1: List of Propositions
Board Characteristics:
P1: The size of board directors is larger for firms committing cartel than for a matched sample of
non-cartel firms
P2: The percentage of independent (non-executive) members on the board of director is lower for
firms committed cartel crime than for non-cartel firms.
P3: The average age of board directors for cartel firms is lower than non-cartel firms.
P4: There are less female directors on the board of cartel firms than the non-cartel firms.
P5: The average duration of the cartel board is less than the non-cartel firms
P6: Board remuneration for cartel firms is higher than non-cartel firms.
Ownership Structure
P7: The percentage of outside directors’ stock ownership is lower for cartel firms than for non-
cartel firms
P8: Cartel likely to be formed by family-owned and controlled firms (large shareholders).
CEO Characteristics
P9: The age of the CEO for cartel firms is higher than non-cartel firms
P10: The number of years a CEO had served as a director for a cartel firm is less than that for non-
cartel firms
P11: Female CEOs are less represented in cartel firms than in non-cartel firms.
P12: Boards of directors of a firm committing cartel crime are less likely to have directors who
work on other boards, compared with boards of directors of non-cartel firms.
P13: Firms that commit cartel are more likely to have CEOs serving as board chairs compared to
non-cartel firms.
CEO Compensation Scheme
P14: The average CEO bonus for cartel firms is higher than non-cartel firms
P15: The average CEO share for cartel firms is higher than non-cartel firms
P16: Total CEO compensation for cartel firms is higher than non-cartel firm
135
3.7 Chapter Summary
This chapter provides a discussion of the literature review and hypothesis development for the study.
It begins with clarifying the concept of corporate governance and the theoretical background
underlying the formation of cartel. The literature review elucidates the CEO role in corporate
governance and in forming cartels. It also tackles how shareholders act in cartel formation. The
hypothesis development, on the other hand, is focused on the characteristics of the board and whether
the CEO characteristics and compensation scheme matter. The empirical investigation embodying the
theoretical background is built upon agency theory, aiming to clarify the empirical relationship
between corporate governance structure and cartel formation. Analysing the corporate governance
structure necessitates investigating the structure of the board of directors and the manner in which
their activities impact the performance of the organisation. The list of propositions provides a
summary of the hypotheses relating to board characteristics, CEO characteristics, and CEO
compensation scheme to determine how corporate governance structure impacts the propensity of
cartel formation.
The next chapter provides a discussion of data description and data collection, thereby clarifying how
cartel data are gathered and offering basis for the furtherance of this research.
136
Chapter Four
Data Description
This chapter describes the sources of data and method of data collection. It discusses how the sample
of cartel was obtained, including the two screening stages used to examine the initial set of cartel
identified into a usable sample. The resulting cartel data are then compared with the initial sample
and their characteristics are described in more detail. Besides these, this chapter discusses how the
benchmark set of firms that have no known cartel participation is obtained, and their characteristics.
4.1 Cartel Data
4.1.1. Sources
The initial aim is to create a data set of firms that have been found to be involved in cartel formation.
The starting point is to identify all cartel firms that participated in cartel and are sentenced by the
U.S. Department of Justice (DoJ), and/ or by the European Commission (EC), and/ or by the
Competition Commission (CC) / Office of Fair Trading (OFT) for the whole period over which
information on cartel cases is available.
Several databases are used in the cartel sample selection and cartel data collection phases of this
study. The first set of sources are the DoJ, the EC and CC/OFT. The second is the LexisNexis
database. The third set includes the academic working papers by Levenstein and Suslow (2006 and
2002), Levenstein, Suslow, and Oswald (2003) and Connor and Helmers (2006). The forth source
includes data obtained from Prof. John Connor of Purdue University.
4.1.2. Data Collection Methods
Finding relevant information on cartel and firms involved is a considerable task. It is not easy to
obtain the needed data from the EU, UK, and US authorities. This is because the DoJ, for example,
does not provide detailed information about all cartel cases being sentenced and the detailed
information about firms involved. The DoJ is also less transparent about its cases than EC and
CC/OFT where cases are discussed in more detailed. In fact, the DoJ’s website does not contain
comprehensive information about cases and their outcomes; and in multiple cases, there is no
137
information about firms that have been sentenced. For example, it is quite common for the DoJ to
report that there was a cartel case involving several firms but does not however provide any
information about which firms are involved, and the resulting outcomes, as well as the penalties
imposed. It means that after several months spent on building a suitable cartel database (24 cases
from DoJ, 76 cases from EC and 52 cases from CC/OFT), a total of 152 cases were collected.
Several attempts were made to contact the DoJ to ask for an access to the information about their
cartel cases that were not publicly available, but they have refused to provide any information.
However, it was helpful to have acquired the data from a professor of Purdue University, who has
written extensively on international cartel from an economic perspective. His sample of 314 cases
was used in his ‘Statistics on Modern Private International Cartel’ (Connor and Helmers, 2006). The
data gathered by Connor and Helmers were collected from several sources, such as antitrust
authorities (e.g., DoJ, Canadian Competition Bureau (2002), and EC); newspapers and magazines
(e.g. Chemical Market Reporter, Oil and Gas Journal, etc. - Factiva, LexisNexis); academic working
papers (e.g. Levenstein and Suslow (2003 and 2006); Evenett et al., 2001); Organisation for
Economic Cooperation and Development (OECD 2002) and its annual competition-law reports by
members.
Even though obtaining John sample was useful, there were some problems with his data, such as
incomplete information on some cartel cases and several missing data. Furthermore, as the purpose of
this research is to find out which characteristics of the participating firms’ boards of directors are
associated with cartel formation; this research only intends to study those firms that have been found
to be operating cartel. Therefore, having assembled the initial sample, it was necessary to screen the
cases to ensure that all were suitable for the study. Cases were excluded on three grounds:
1. If the case was still under investigation. Eight cartel cases were excluded, as a decision
was not yet reached at the time of the sample collection.
2. If no sentence date/year had been reported. There were 75 cases in this category.
3. Some cases do not identify the firms participating in the cartel, which makes it
impossible to get information about them. A further 58 cases were excluded on this
basis.
Altogether, 141 out of the 314 cases from Connor’s database were excluded as a result of the
screening process. Additionally, combining the set of data that was collected from DoJ, EC archive,
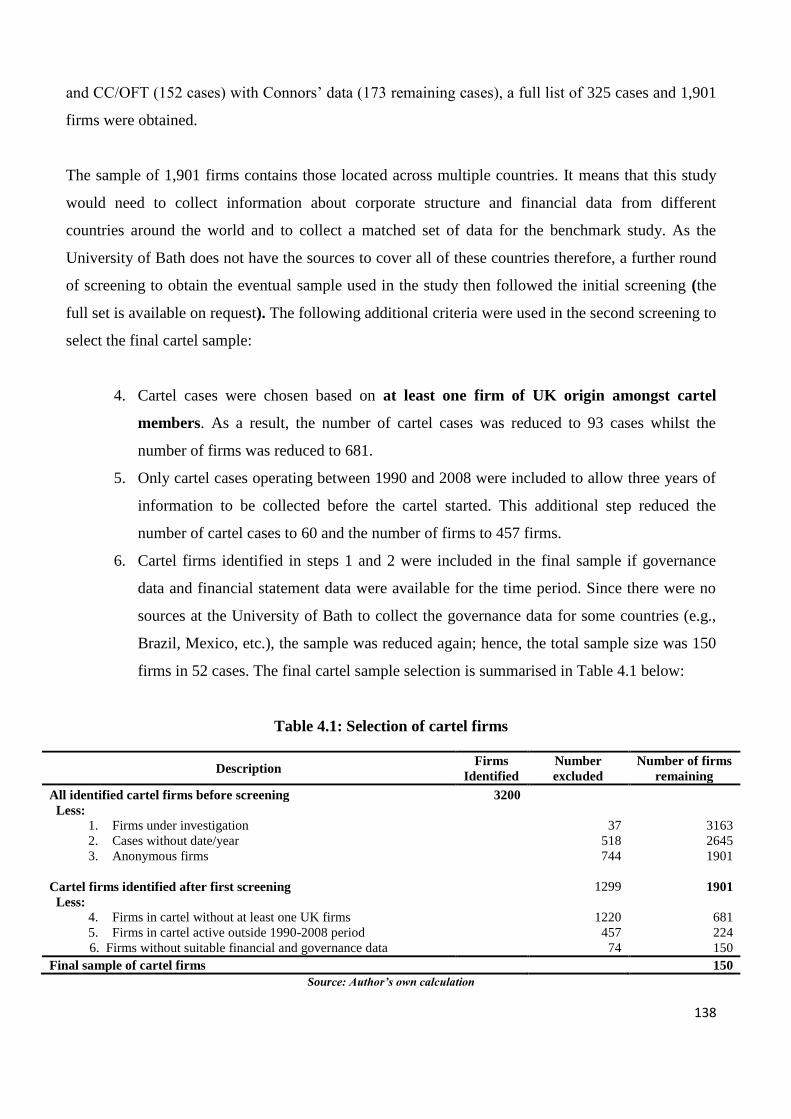
138
and CC/OFT (152 cases) with Connors’ data (173 remaining cases), a full list of 325 cases and 1,901
firms were obtained.
The sample of 1,901 firms contains those located across multiple countries. It means that this study
would need to collect information about corporate structure and financial data from different
countries around the world and to collect a matched set of data for the benchmark study. As the
University of Bath does not have the sources to cover all of these countries therefore, a further round
of screening to obtain the eventual sample used in the study then followed the initial screening (the
full set is available on request). The following additional criteria were used in the second screening to
select the final cartel sample:
4. Cartel cases were chosen based on at least one firm of UK origin amongst cartel
members. As a result, the number of cartel cases was reduced to 93 cases whilst the
number of firms was reduced to 681.
5. Only cartel cases operating between 1990 and 2008 were included to allow three years of
information to be collected before the cartel started. This additional step reduced the
number of cartel cases to 60 and the number of firms to 457 firms.
6. Cartel firms identified in steps 1 and 2 were included in the final sample if governance
data and financial statement data were available for the time period. Since there were no
sources at the University of Bath to collect the governance data for some countries (e.g.,
Brazil, Mexico, etc.), the sample was reduced again; hence, the total sample size was 150
firms in 52 cases. The final cartel sample selection is summarised in Table 4.1 below:
Table 4.1: Selection of cartel firms
Description Firms
Identified
Number
excluded
Number of firms
remaining
All identified cartel firms before screening 3200
Less:
1. Firms under investigation 37 3163
2. Cases without date/year 518 2645
3. Anonymous firms 744 1901
Cartel firms identified after first screening 1299 1901
Less:
4. Firms in cartel without at least one UK firms 1220 681
5. Firms in cartel active outside 1990-2008 period 457 224
6. Firms without suitable financial and governance data 74 150
Final sample of cartel firms 150
Source: Author’s own calculation
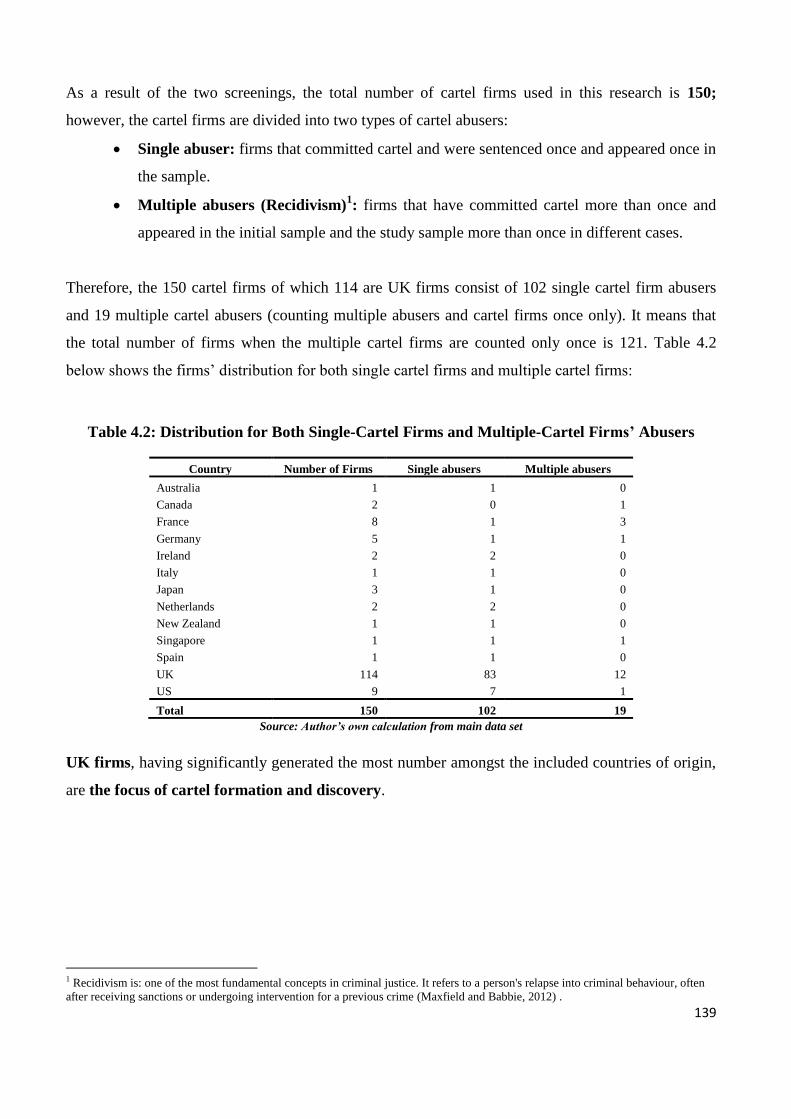
139
As a result of the two screenings, the total number of cartel firms used in this research is 150;
however, the cartel firms are divided into two types of cartel abusers:
Single abuser: firms that committed cartel and were sentenced once and appeared once in
the sample.
Multiple abusers (Recidivism)1: firms that have committed cartel more than once and
appeared in the initial sample and the study sample more than once in different cases.
Therefore, the 150 cartel firms of which 114 are UK firms consist of 102 single cartel firm abusers
and 19 multiple cartel abusers (counting multiple abusers and cartel firms once only). It means that
the total number of firms when the multiple cartel firms are counted only once is 121. Table 4.2
below shows the firms’ distribution for both single cartel firms and multiple cartel firms:
Table 4.2: Distribution for Both Single-Cartel Firms and Multiple-Cartel Firms’ Abusers
Country Number of Firms Single abusers Multiple abusers
Australia 1 1 0
Canada 2 0 1
France 8 1 3
Germany 5 1 1
Ireland 2 2 0
Italy 1 1 0
Japan 3 1 0
Netherlands 2 2 0
New Zealand 1 1 0
Singapore 1 1 1
Spain 1 1 0
UK 114 83 12
US 9 7 1
Total 150 102 19
Source: Author’s own calculation from main data set
UK firms, having significantly generated the most number amongst the included countries of origin,
are the focus of cartel formation and discovery.
1 Recidivism is: one of the most fundamental concepts in criminal justice. It refers to a person's relapse into criminal behaviour, often
after receiving sanctions or undergoing intervention for a previous crime (Maxfield and Babbie, 2012) .
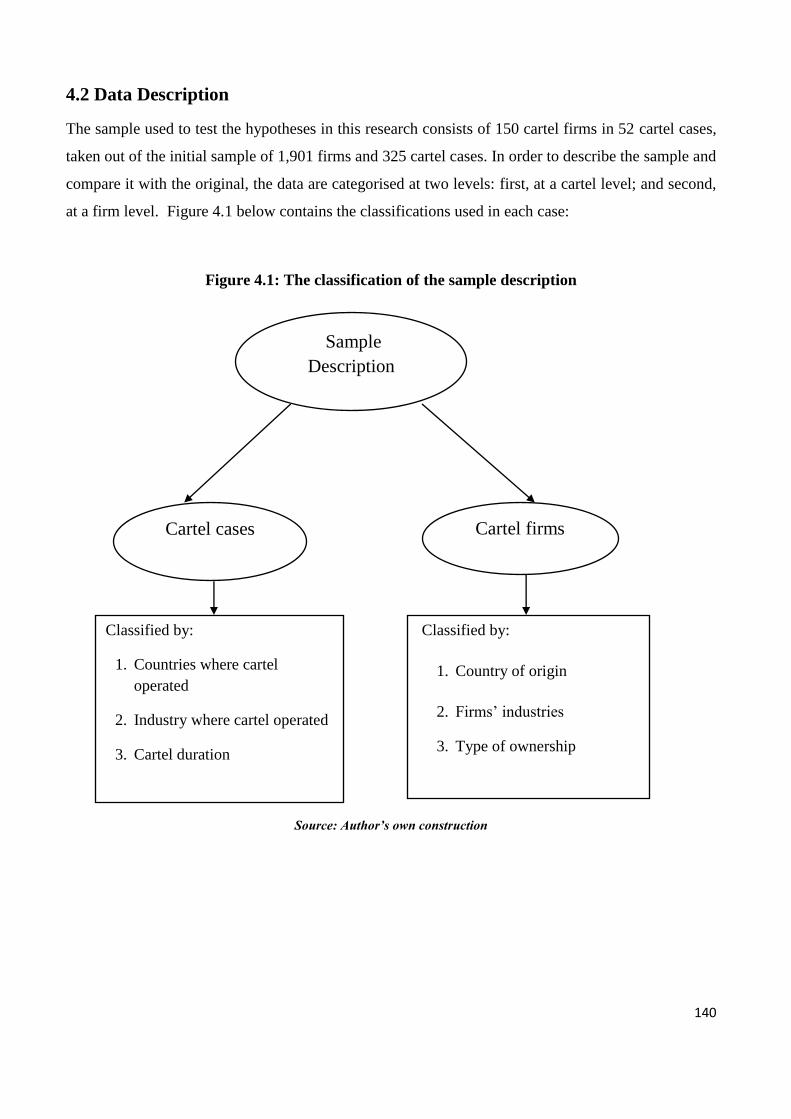
140
Cartel cases
Cartel firms
Sample
Description
4.2 Data Description
The sample used to test the hypotheses in this research consists of 150 cartel firms in 52 cartel cases,
taken out of the initial sample of 1,901 firms and 325 cartel cases. In order to describe the sample and
compare it with the original, the data are categorised at two levels: first, at a cartel level; and second,
at a firm level. Figure 4.1 below contains the classifications used in each case:
Figure 4.1: The classification of the sample description
Source: Author’s own construction
Classified by:
1. Countries where cartel
operated
2. Industry where cartel operated
3. Cartel duration
Classified by:
1. Country of origin
2. Firms’ industries
3. Type of ownership
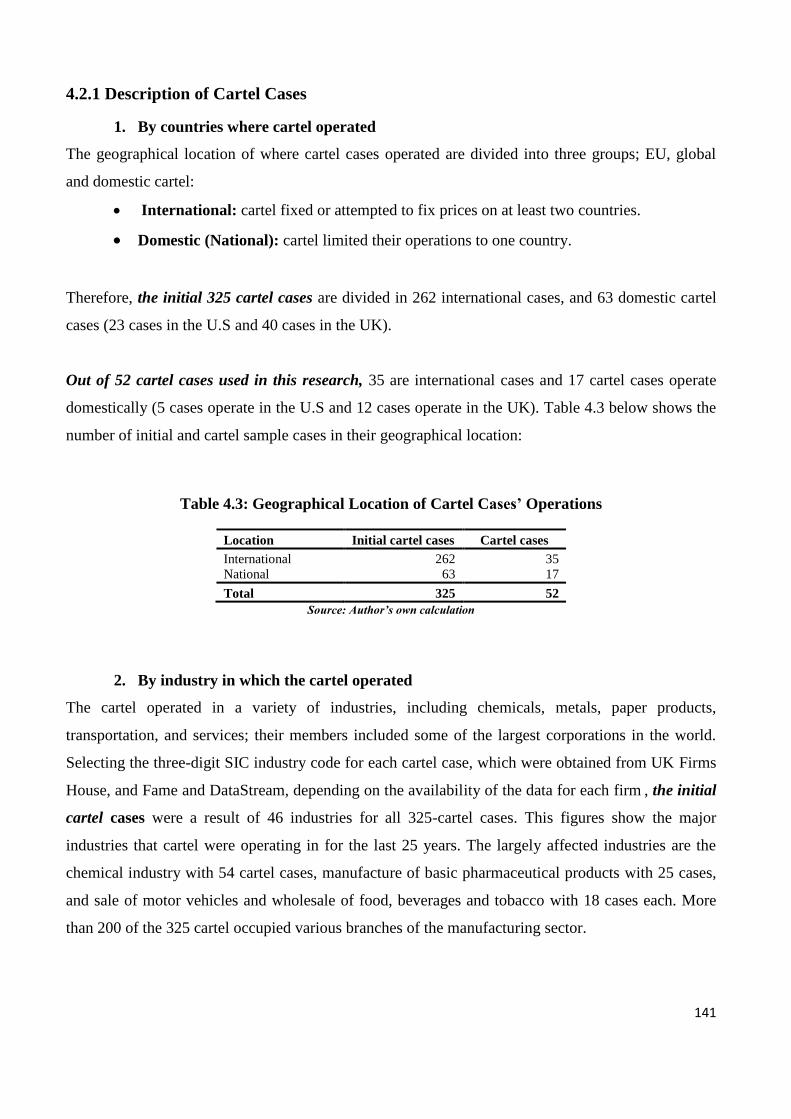
141
4.2.1 Description of Cartel Cases
1. By countries where cartel operated
The geographical location of where cartel cases operated are divided into three groups; EU, global
and domestic cartel:
International: cartel fixed or attempted to fix prices on at least two countries.
Domestic (National): cartel limited their operations to one country.
Therefore, the initial 325 cartel cases are divided in 262 international cases, and 63 domestic cartel
cases (23 cases in the U.S and 40 cases in the UK).
Out of 52 cartel cases used in this research, 35 are international cases and 17 cartel cases operate
domestically (5 cases operate in the U.S and 12 cases operate in the UK). Table 4.3 below shows the
number of initial and cartel sample cases in their geographical location:
Table 4.3: Geographical Location of Cartel Cases’ Operations
Location Initial cartel cases Cartel cases
International 262 35
National 63 17
Total 325 52
Source: Author’s own calculation
2. By industry in which the cartel operated
The cartel operated in a variety of industries, including chemicals, metals, paper products,
transportation, and services; their members included some of the largest corporations in the world.
Selecting the three-digit SIC industry code for each cartel case, which were obtained from UK Firms
House, and Fame and DataStream, depending on the availability of the data for each firm , the initial
cartel cases were a result of 46 industries for all 325-cartel cases. This figures show the major
industries that cartel were operating in for the last 25 years. The largely affected industries are the
chemical industry with 54 cartel cases, manufacture of basic pharmaceutical products with 25 cases,
and sale of motor vehicles and wholesale of food, beverages and tobacco with 18 cases each. More
than 200 of the 325 cartel occupied various branches of the manufacturing sector.

142
Similarly, the cartel cases examined in this study have 23 industries. The largely affected industries
in this sample are the chemical industry (10 cases) followed by finishing of textiles industry with 6
cases. Table 4.4 below illustrates the cartel cases classification by industry for both the initial sample
and the cartel cases used in this research.
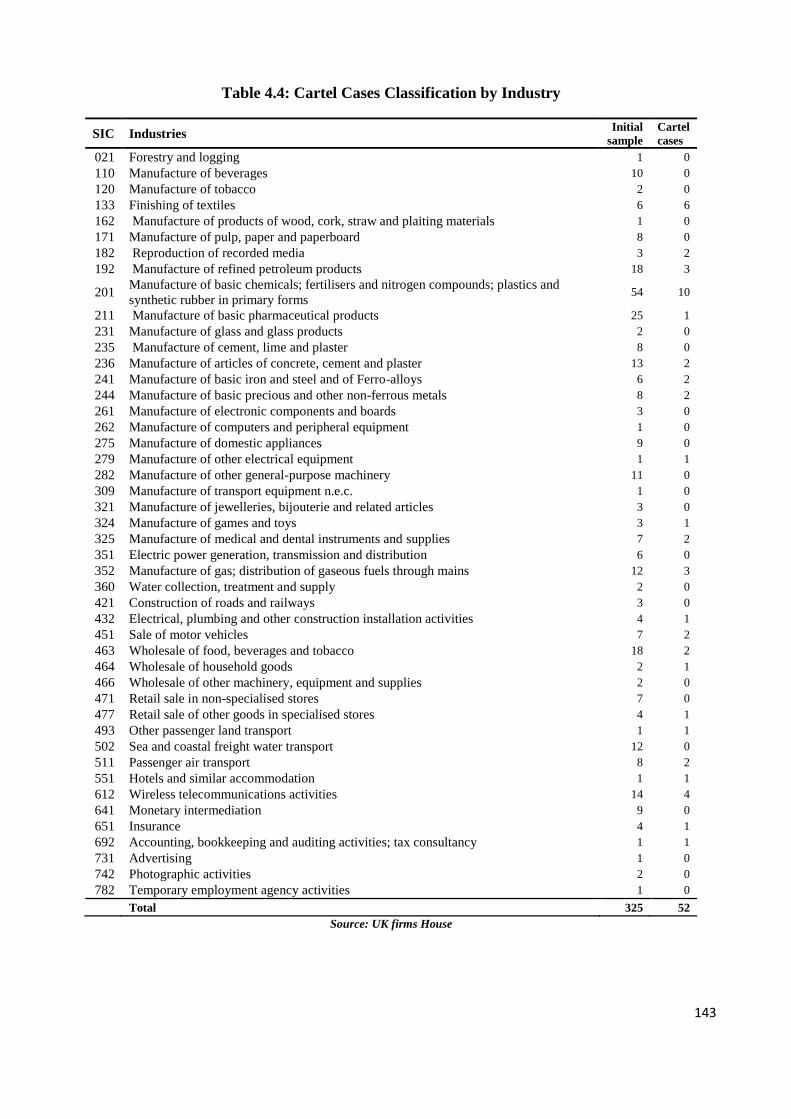
143
Table 4.4: Cartel Cases Classification by Industry
SIC Industries Initial
sample
Cartel
cases
021 Forestry and logging 1 0
110 Manufacture of beverages 10 0
120 Manufacture of tobacco 2 0
133 Finishing of textiles 6 6
162 Manufacture of products of wood, cork, straw and plaiting materials 1 0
171 Manufacture of pulp, paper and paperboard 8 0
182 Reproduction of recorded media 3 2
192 Manufacture of refined petroleum products 18 3
201 Manufacture of basic chemicals; fertilisers and nitrogen compounds; plastics and
synthetic rubber in primary forms 54 10
211 Manufacture of basic pharmaceutical products 25 1
231 Manufacture of glass and glass products 2 0
235 Manufacture of cement, lime and plaster 8 0
236 Manufacture of articles of concrete, cement and plaster 13 2
241 Manufacture of basic iron and steel and of Ferro-alloys 6 2
244 Manufacture of basic precious and other non-ferrous metals 8 2
261 Manufacture of electronic components and boards 3 0
262 Manufacture of computers and peripheral equipment 1 0
275 Manufacture of domestic appliances 9 0
279 Manufacture of other electrical equipment 1 1
282 Manufacture of other general-purpose machinery 11 0
309 Manufacture of transport equipment n.e.c. 1 0
321 Manufacture of jewelleries, bijouterie and related articles 3 0
324 Manufacture of games and toys 3 1
325 Manufacture of medical and dental instruments and supplies 7 2
351 Electric power generation, transmission and distribution 6 0
352 Manufacture of gas; distribution of gaseous fuels through mains 12 3
360 Water collection, treatment and supply 2 0
421 Construction of roads and railways 3 0
432 Electrical, plumbing and other construction installation activities 4 1
451 Sale of motor vehicles 7 2
463 Wholesale of food, beverages and tobacco 18 2
464 Wholesale of household goods 2 1
466 Wholesale of other machinery, equipment and supplies 2 0
471 Retail sale in non-specialised stores 7 0
477 Retail sale of other goods in specialised stores 4 1
493 Other passenger land transport 1 1
502 Sea and coastal freight water transport 12 0
511 Passenger air transport 8 2
551 Hotels and similar accommodation 1 1
612 Wireless telecommunications activities 14 4
641 Monetary intermediation 9 0
651 Insurance 4 1
692 Accounting, bookkeeping and auditing activities; tax consultancy 1 1
731 Advertising 1 0
742 Photographic activities 2 0
782 Temporary employment agency activities 1 0
Total 325 52
Source: UK firms House
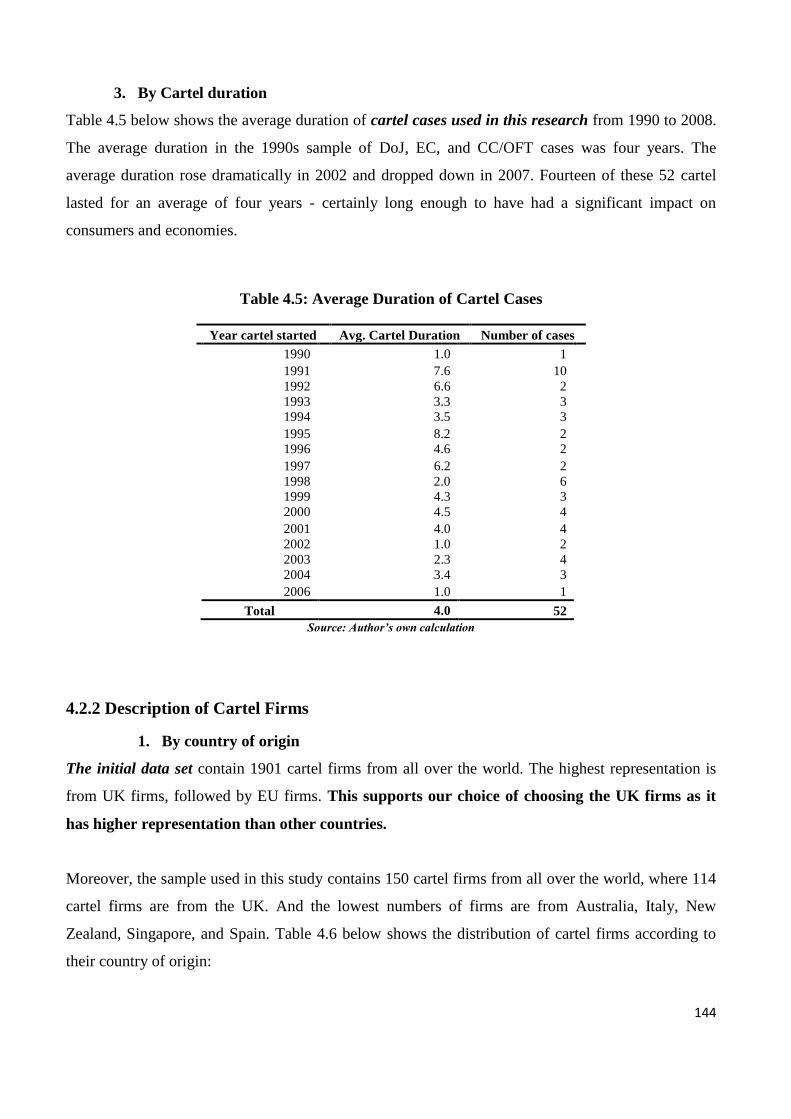
144
3. By Cartel duration
Table 4.5 below shows the average duration of cartel cases used in this research from 1990 to 2008.
The average duration in the 1990s sample of DoJ, EC, and CC/OFT cases was four years. The
average duration rose dramatically in 2002 and dropped down in 2007. Fourteen of these 52 cartel
lasted for an average of four years - certainly long enough to have had a significant impact on
consumers and economies.
Table 4.5: Average Duration of Cartel Cases
Year cartel started Avg. Cartel Duration Number of cases
1990 1.0 1
1991 7.6 10
1992 6.6 2
1993 3.3 3
1994 3.5 3
1995 8.2 2
1996 4.6 2
1997 6.2 2
1998 2.0 6
1999 4.3 3
2000 4.5 4
2001 4.0 4
2002 1.0 2
2003 2.3 4
2004 3.4 3
2006 1.0 1
Total 4.0 52
Source: Author’s own calculation
4.2.2 Description of Cartel Firms
1. By country of origin
The initial data set contain 1901 cartel firms from all over the world. The highest representation is
from UK firms, followed by EU firms. This supports our choice of choosing the UK firms as it
has higher representation than other countries.
Moreover, the sample used in this study contains 150 cartel firms from all over the world, where 114
cartel firms are from the UK. And the lowest numbers of firms are from Australia, Italy, New
Zealand, Singapore, and Spain. Table 4.6 below shows the distribution of cartel firms according to
their country of origin:
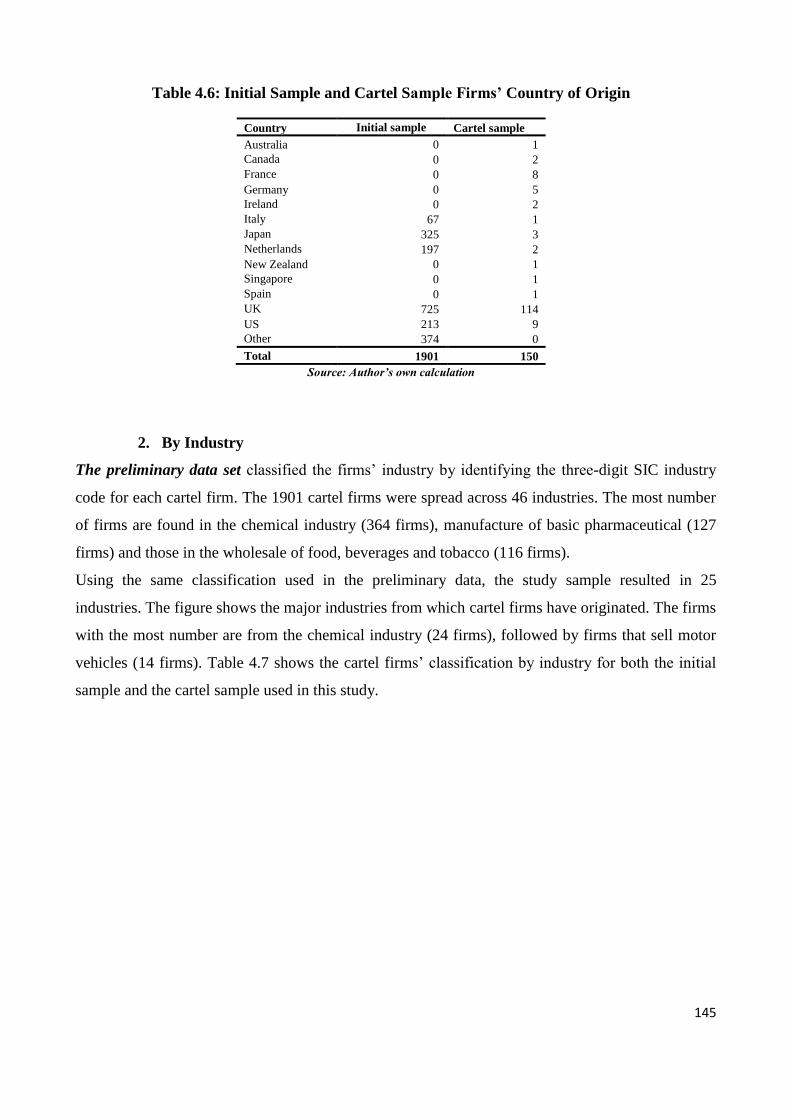
145
Table 4.6: Initial Sample and Cartel Sample Firms’ Country of Origin
Country Initial sample Cartel sample
Australia 0 1
Canada 0 2
France 0 8
Germany 0 5
Ireland 0 2
Italy 67 1
Japan 325 3
Netherlands 197 2
New Zealand 0 1
Singapore 0 1
Spain 0 1
UK 725 114
US 213 9
Other 374 0
Total 1901 150
Source: Author’s own calculation
2. By Industry
The preliminary data set classified the firms’ industry by identifying the three-digit SIC industry
code for each cartel firm. The 1901 cartel firms were spread across 46 industries. The most number
of firms are found in the chemical industry (364 firms), manufacture of basic pharmaceutical (127
firms) and those in the wholesale of food, beverages and tobacco (116 firms).
Using the same classification used in the preliminary data, the study sample resulted in 25
industries. The figure shows the major industries from which cartel firms have originated. The firms
with the most number are from the chemical industry (24 firms), followed by firms that sell motor
vehicles (14 firms). Table 4.7 shows the cartel firms’ classification by industry for both the initial
sample and the cartel sample used in this study.
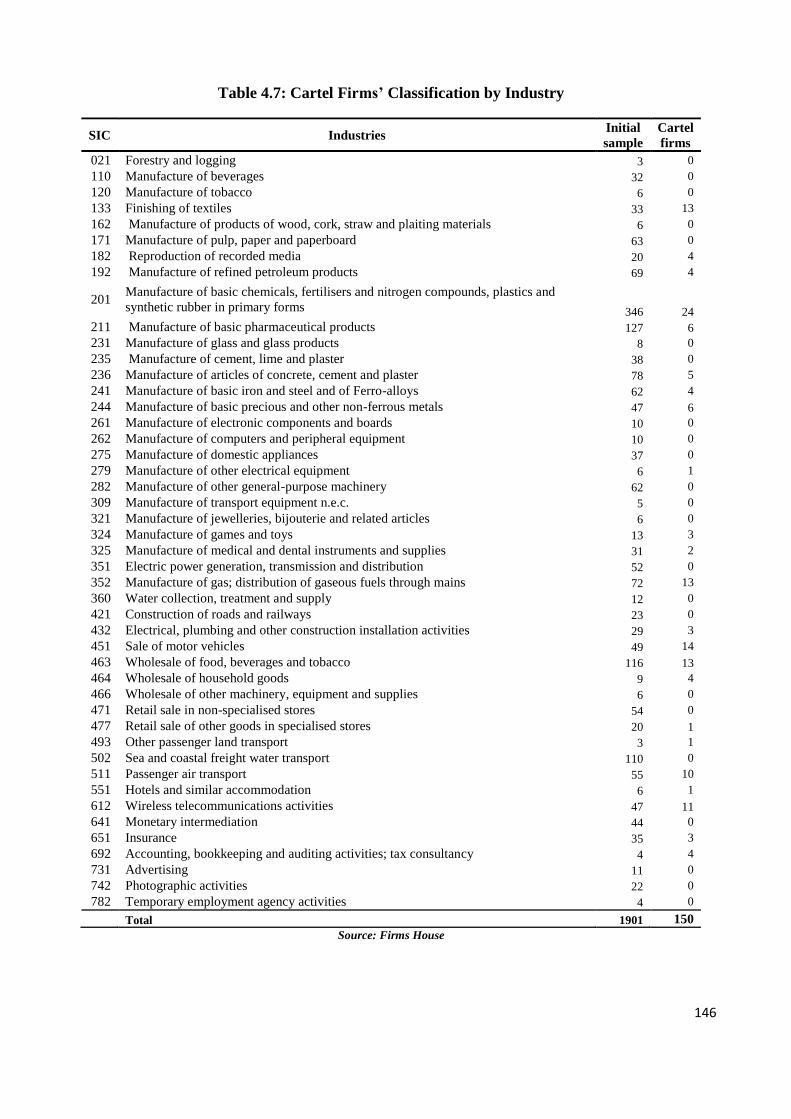
146
Table 4.7: Cartel Firms’ Classification by Industry
SIC Industries Initial
sample
Cartel
firms
021 Forestry and logging 3 0
110 Manufacture of beverages 32 0
120 Manufacture of tobacco 6 0
133 Finishing of textiles 33 13
162 Manufacture of products of wood, cork, straw and plaiting materials 6 0
171 Manufacture of pulp, paper and paperboard 63 0
182 Reproduction of recorded media 20 4
192 Manufacture of refined petroleum products 69 4
201 Manufacture of basic chemicals, fertilisers and nitrogen compounds, plastics and
synthetic rubber in primary forms 346 24
211 Manufacture of basic pharmaceutical products 127 6
231 Manufacture of glass and glass products 8 0
235 Manufacture of cement, lime and plaster 38 0
236 Manufacture of articles of concrete, cement and plaster 78 5
241 Manufacture of basic iron and steel and of Ferro-alloys 62 4
244 Manufacture of basic precious and other non-ferrous metals 47 6
261 Manufacture of electronic components and boards 10 0
262 Manufacture of computers and peripheral equipment 10 0
275 Manufacture of domestic appliances 37 0
279 Manufacture of other electrical equipment 6 1
282 Manufacture of other general-purpose machinery 62 0
309 Manufacture of transport equipment n.e.c. 5 0
321 Manufacture of jewelleries, bijouterie and related articles 6 0
324 Manufacture of games and toys 13 3
325 Manufacture of medical and dental instruments and supplies 31 2
351 Electric power generation, transmission and distribution 52 0
352 Manufacture of gas; distribution of gaseous fuels through mains 72 13
360 Water collection, treatment and supply 12 0
421 Construction of roads and railways 23 0
432 Electrical, plumbing and other construction installation activities 29 3
451 Sale of motor vehicles 49 14
463 Wholesale of food, beverages and tobacco 116 13
464 Wholesale of household goods 9 4
466 Wholesale of other machinery, equipment and supplies 6 0
471 Retail sale in non-specialised stores 54 0
477 Retail sale of other goods in specialised stores 20 1
493 Other passenger land transport 3 1
502 Sea and coastal freight water transport 110 0
511 Passenger air transport 55 10
551 Hotels and similar accommodation 6 1
612 Wireless telecommunications activities 47 11
641 Monetary intermediation 44 0
651 Insurance 35 3
692 Accounting, bookkeeping and auditing activities; tax consultancy 4 4
731 Advertising 11 0
742 Photographic activities 22 0
782 Temporary employment agency activities 4 0
Total 1901 150
Source: Firms House
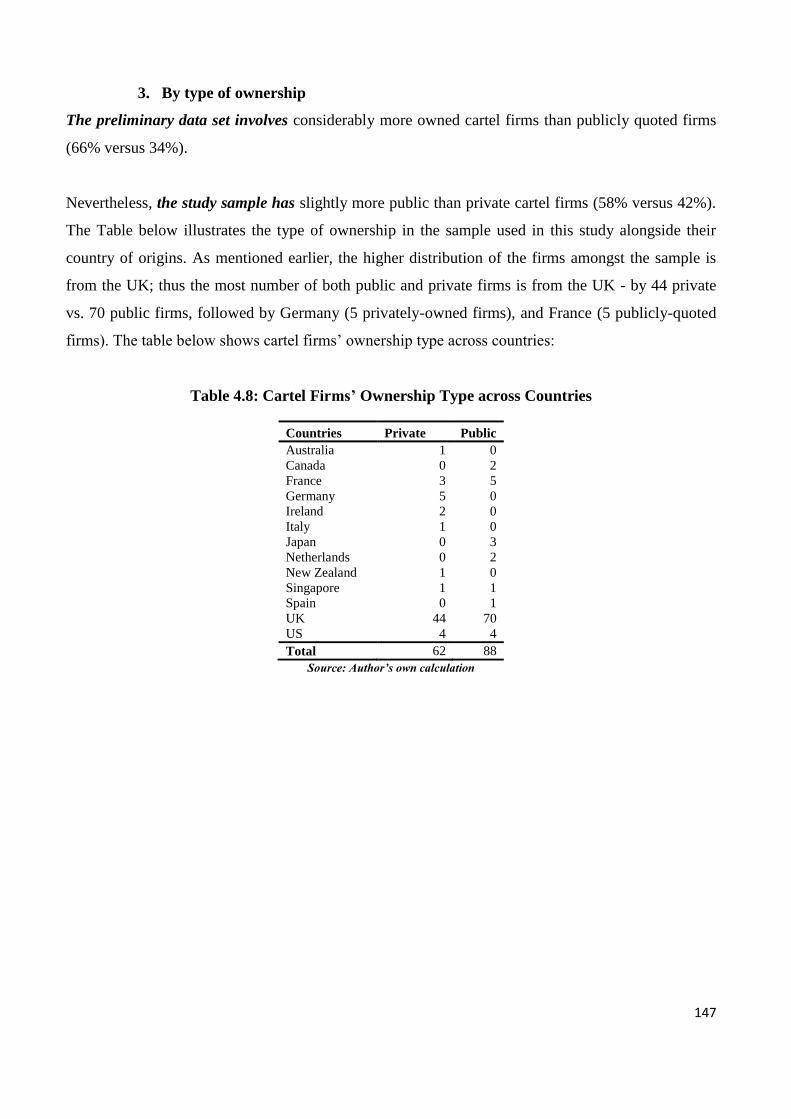
147
3. By type of ownership
The preliminary data set involves considerably more owned cartel firms than publicly quoted firms
(66% versus 34%).
Nevertheless, the study sample has slightly more public than private cartel firms (58% versus 42%).
The Table below illustrates the type of ownership in the sample used in this study alongside their
country of origins. As mentioned earlier, the higher distribution of the firms amongst the sample is
from the UK; thus the most number of both public and private firms is from the UK - by 44 private
vs. 70 public firms, followed by Germany (5 privately-owned firms), and France (5 publicly-quoted
firms). The table below shows cartel firms’ ownership type across countries:
Table 4.8: Cartel Firms’ Ownership Type across Countries
Countries Private Public
Australia 1 0
Canada 0 2
France 3 5
Germany 5 0
Ireland 2 0
Italy 1 0
Japan 0 3
Netherlands 0 2
New Zealand 1 0
Singapore 1 1
Spain 0 1
UK 44 70
US 4 4
Total 62 88
Source: Author’s own calculation
148
4.3 Benchmark (Non-Cartel Firms)
This study utilises a matched sample approach to create a comparison group. This non-probability
approach limits variations that might cause bias to the study (Macnee and McCabe, 2008). The use of
matched sampling implies that the samples are in some way related (or correlated). A significant
relationship exists between the matching variable and the dependent variable (Leong and Austin,
2006). The purpose of a matched sample design is therefore to ascertain that some characteristics are
identical (Wood and Ross-Kerr, 2011).
To create a comparison group, matching firms are selected which have not been discovered/detected
as operating cartel and referred to here as "non-cartel firms", this means the firm has not formed any
cartel, nor had been discovered for any cartel activity. However, it must be noted that some non-
cartel firms might also be in cartel but have not been discovered/detected, which cannot qualify them
to be called "cartel firms" in this study.
Cartel firms are matched to non-cartel firms via a specific matching process. This process includes
matching a cartel firm with a non-cartel firm’s benchmark within the same industry, based on a
three-digit SIC code, and takes into account the timing of the starting year of the cartel cases to
ensure that the data for each pair came from the same period. This is an example of twinning or
ensuring the identical characteristics of the samples being matched (Leong and Austin, 2006; Wood
and Ross-Kerr, 2011). Firm size based on net sales is also taken into consideration along with their
position in the stock exchange. The firms with similar size and position in the stock exchange are
matched together. It is proposed that matching via this comprehensive set of criteria would improve
the quality of matched pairs and hence the quality and precision of test results.
For the purposes of this matching process, the industry selection is based on a three-digit Standard
Industry Code (SIC) assigned to each firm based on the industry they operate in. This code could be
sourced from FAME database, DataStream, and firms’ databases depending on the availability of
data for each firm. The matching process has utilised these databases to search for appropriate
matches based on the criterion data (i.e. SIC code, time and size) of each cartel firm. This variable is
also used as a control variable in the regression model to control for firm’s the industry.
Moreover, one year prior to the year when the cartel case started to be used for matching purposes
ensures the financial data and governance data for both the cartel firms and benchmark groups from
149
the same time period. This additionally enables the actual performance of cartel firms - prior to cartel
formation - to be used to match the pairs. Exact matches of the time criterion are sought, while
acceptable limits established within which the SIC coding and size criterions are permitted to deviate.
These limits are set to emulate earlier studies, such as that of Beasley (1996), which permitted
industry matches to two digits SIC code and a ±25 % margin of fraud firms for matching by size.
The size criterion is determined by the net sales specified in the annual financial report issued on the
fiscal year preceding the cartel incident. Matching the pair on a size criterion is deemed important to
ensure that both cartel firms and non-cartel firms share relatively similar availability of resources and
are therefore capable of implementing comparable corporate governance structures. Therefore, non-
cartel firms are considered similar in size to cartel firms if the net sales are within ±25% of the cartel
firms’ sales for the year before the cartel cases started. Possible matches for cartel firms are identified
through customised search. Excel spreadsheets are used to collate the data furnished from each
search, which are then sorted and assessed to identify the closest possible matches. This variable is
also used as a control variable in the regression model to control for firm profitability.
However, the classification of non-cartel firms will result in some misclassifications if a firm
classified as non-cartel had an incidence of collusion or financial fraud. To reduce this possibility, the
annual reports for the selected firms are reviewed, as well as data from Department of Justice,
European Commission and Competition Commission (three years pre-cartel detection); to verify that
there are no documented reports of cartel for any non-cartel firms. The financial statements filed with
the U.S Securities and Exchange Commission (SEC) are also reviewed to identify whether the firms
committed any financial fraud during the same window period for each cartel case. In the case that
fraud was committed; the matched firm is excluded from the sample. From this step most excluded
firms were identified in the 1901 initial cartel firms sample; in other words, they have been in a cartel
before.
Finally, after firms had been identified and checked; each cartel firm is matched with one or more
non-cartel firms depending on the availability of data. There are three scenarios:
One cartel firm is matched with one non-cartel firm. This is the case if only one firm
matched the requirements. In this case, there are 130 non-cartel firms. For example, the cartel
firm Alliance Boots LTD is matched with non-cartel firm AAH Pharmaceuticals LTD.
150
One cartel firm is matched with more than one (two or more) non-cartel firms. This is
the case if the cartel firm has more than one match: In this case, all possible matches are
included. There are a total of 30 non-cartel firms in this category. For example, the cartel firm
Prosper de Mulder LTD is matched with non-cartel firms Butcher’s Pet Care Limited and
Crown Pets’ Foods LTD.
More than one cartel firms are matched with the same non-cartel firm. In this case, there
are 18 non-cartel firms that are matched with 50 cartel firms. For example, Morrison Foods
and Waitrose are matched with non-cartel firm Marks and Spencer.
The total benchmark after the matching process completed is 178 non-cartel firms, taking into
account all possible matches for each cartel firm (The table for matching cartel firms with non-cartel
firms can be found in Appendix A3).
4.4 Benchmark Descriptive Analysis
As discussed earlier, the total number of non-cartel firms identified is 178. The sample contains data
collected for firms located across multiple countries. The descriptive analysis for non-cartel firms is
categorised as follows:
4.4.1 Country of Origin
Table 4.9 below represents the number of non-cartel firms according to their country of origin. The
firms with the most number are from the UK (138 firms), followed by Ireland (13 firms) and the U.S.
(8 firms).
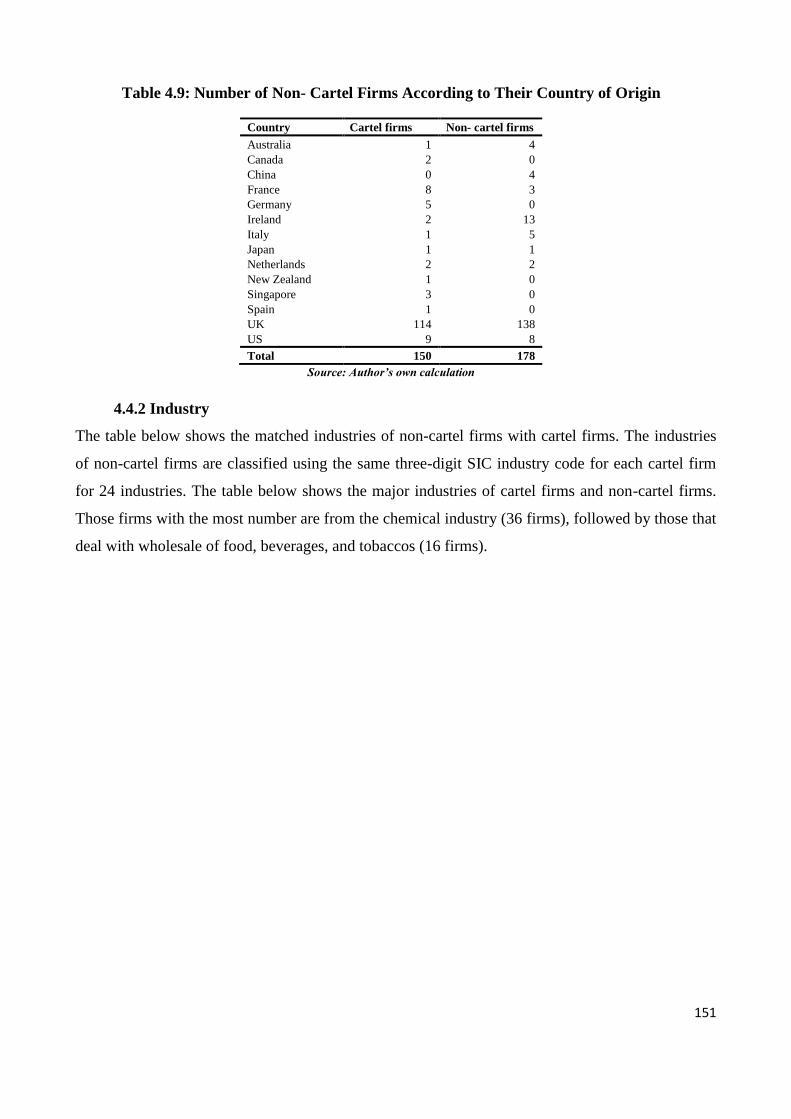
151
Table 4.9: Number of Non- Cartel Firms According to Their Country of Origin
Country Cartel firms Non- cartel firms
Australia 1 4
Canada 2 0
China 0 4
France 8 3
Germany 5 0
Ireland 2 13
Italy 1 5
Japan 1 1
Netherlands 2 2
New Zealand 1 0
Singapore 3 0
Spain 1 0
UK 114 138
US 9 8
Total 150 178
Source: Author’s own calculation
4.4.2 Industry
The table below shows the matched industries of non-cartel firms with cartel firms. The industries
of non-cartel firms are classified using the same three-digit SIC industry code for each cartel firm
for 24 industries. The table below shows the major industries of cartel firms and non-cartel firms.
Those firms with the most number are from the chemical industry (36 firms), followed by those that
deal with wholesale of food, beverages, and tobaccos (16 firms).

152
Table 4.10: Industry Cartel Firms vs. Non-Cartel Firms
SIC Industries
Non-cartel
firms
Cartel
firms
133 Finishing of textiles 12 13
182 Reproduction of recorded media 4 4
192 Manufacture of refined petroleum products 7 4
201
Manufacture of basic chemicals, fertilisers and nitrogen compounds, plastics
and synthetic rubber in primary forms 36 24
211 Manufacture of basic pharmaceutical products 6 6
236 Manufacture of articles of concrete, cement and plaster 5 5
241 Manufacture of basic iron and steel and of Ferro-alloys 4 4
244 Manufacture of basic precious and other non-ferrous metals 6 6
279 Manufacture of other electrical equipment 2 1
324 Manufacture of games and toys 3 3
325 Manufacture of medical and dental instruments and supplies 4 2
352 Manufacture of gas; distribution of gaseous fuels through mains 13 13
432 Electrical, plumbing and other construction installation activities 3 3
451 Sale of motor vehicles 15 14
463 Wholesale of food, beverages and tobacco 16 13
464 Wholesale of household goods 4 4
477 Retail sale of other goods in specialised stores 1 1
493 Other passenger land transport 5 1
511 Passenger air transport 13 10
551 Hotels and similar accommodation 1 1
612 Wireless telecommunications activities 11 11
651 Insurance 3 3
692 Accounting, bookkeeping and auditing activities; tax consultancy 4 4
Total 178 150
Source: Firms House
4.4.3 Ownership Type
There are more private firms than public firms in the sample (66% private vs. 34% public non-cartel
firms). Table 4.11 below shows the type of ownership across cartel firms and non-cartel firms
alongside their country of origin. The highest distributed firms (both public and private) in the
sample are from the UK (103 private firms vs. 35 public firms) followed by Ireland (11 privately-
owned firms), and Italy (7 publicly-quoted firms).
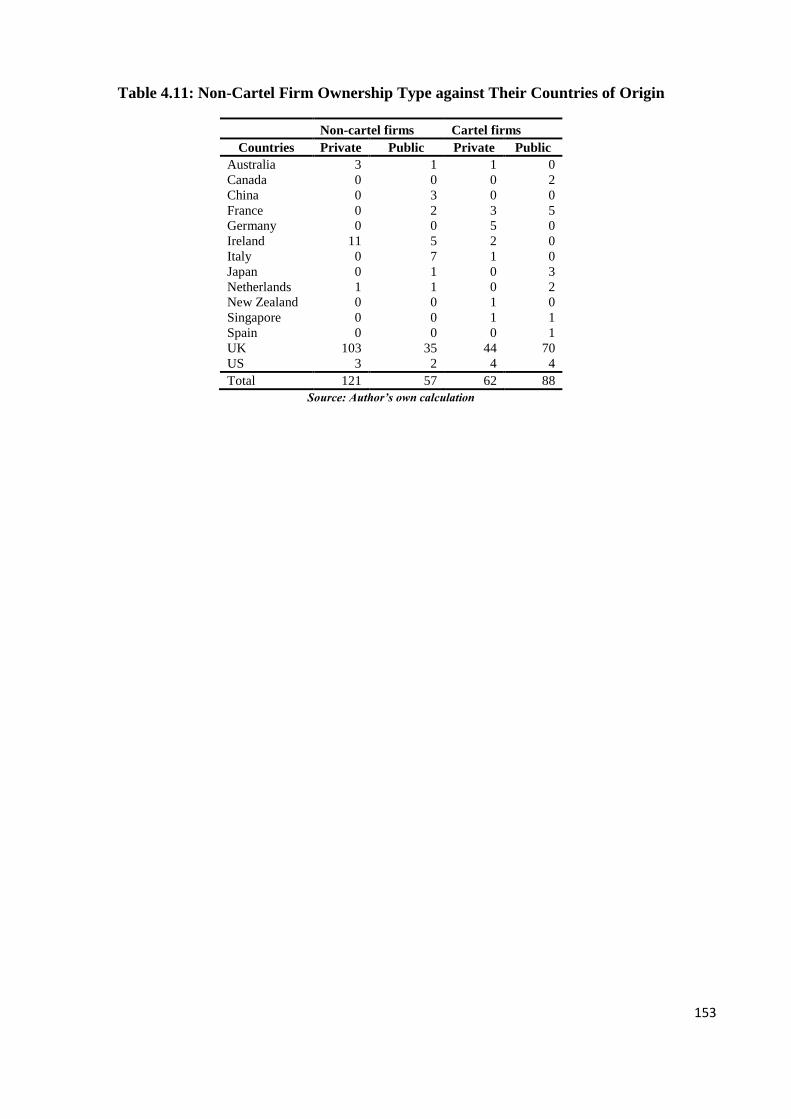
153
Table 4.11: Non-Cartel Firm Ownership Type against Their Countries of Origin
Non-cartel firms Cartel firms
Countries Private Public Private Public
Australia 3 1 1 0
Canada 0 0 0 2
China 0 3 0 0
France 0 2 3 5
Germany 0 0 5 0
Ireland 11 5 2 0
Italy 0 7 1 0
Japan 0 1 0 3
Netherlands 1 1 0 2
New Zealand 0 0 1 0
Singapore 0 0 1 1
Spain 0 0 0 1
UK 103 35 44 70
US 3 2 4 4
Total 121 57 62 88
Source: Author’s own calculation
154
4.5 Chapter Summary
This chapter provides a description of data sources and data collection method for this study. The
data sources involve a set of firms that have been detected for cartel activities, including those found
to have participated in cartels and sentenced by the U.S. Department of Justice, the EC, and CC/OFT.
Certain difficulties pertaining to lack of availability of data due to lack of transparency of cases were
encountered for data collection. A screening process was conducted, which eventually led to the
acquisition of a full list of 150 cartel firms, which are divided into single abusers and multiple
abusers (Recidivism). When counting the multiple cartel firms, this number became 121 only. The
total number of non-cartel firms, on the other hand, is 178.
The UK cartel firms are the focus of this study since these firms have the most significant number of
cartel firms amongst the included countries of origin.
Cartel cases are described according to the country of origin, industry, and cartel duration. Cartel
firms, on the other hand, are described according to the country of origin, industry, and type of
ownership. A matched sample (non-probability) approach is utilised to create a comparison group,
aiming to limit variations that might potentially cause bias and determine that some characteristics
are identical. A three-digit Standard Industry Code (SIC) is used for the industry selection for the
matching process. The size criterion is utilised to ensure that both cartel firms and non-cartel firms
are similarly related in terms of availability of resources and are thus capable of enforcing
comparable corporate governance structures. Financial statements filed with the U.S. SEC are
reviewed to ascertain any financial fraud committed by the firms during the same window period for
each cartel case. This chapter describes specific scenarios in its pursuit to match each cartel firm with
one or more non-cartel firms based on data availability.
The next chapter ushers the reader to the methodology and empirical results, which is a continuance
from this chapter, whereby outlined propositions are described, alongside measurement of the
dependent variable, independent variables, and control variables.
155
Chapter Five
Methodology and Empirical Results
This chapter aims to provide an empirical answer to the primary research question:
Is there any relationship between corporate governance attributes and the incidence of cartel
formation?
The chapter presents and discusses the results from the research using the assembled data. It opens
with the methodology for selecting and measuring the independent variables, which are described in
more detail. These independent variables are constructed from board characteristics, ownership
structure and CEO characteristics (outlined in Chapter three) most likely relevant to cartel formation
and discovery. Six board, two ownership and eight CEO variables are described. Since collusion
depends on three environmental factors, the market environment, legal and regulatory environment,
and then the internal control environment, these must also be modelled (Bolotova et al., 2005).
In this study, the internal control environment is focussed on board characteristics and not board
decisions or activities. The model is a static model of board and CEO characteristics. Therefore,
market and legal indices are used as control factors shared between cartel and non-cartel firms. Since
the firms in the cartel and non-cartel sets have been matched, then cross-comparison between them
controlling for other environmental factors shall concentrate the focus of the analysis on board and
CEO characteristics.
Descriptive statistics and correlation analysis are followed by the presentation of the results of the
tested models and the inferences drawn from tests of the propositions. Findings are compared with
prior research and differences are explained.
156
5.1 Outline of Propositions
5.1.1 Measurement of the Dependent Variable
Using data records from the period 1990 to 2008 of cartel activity and sanctions on firms from
European Commission (EC), the UK Competition Commission (CC) / Office of Fair Trading (OFT)
and U.S Department of Justice (DoJ) two variables were created to measure cartel formation and
discovery:
1. The discrete variable Convictions (CONV) are created to imply the formation and discovery
of cartel. Hence, the dependent variable separates those firms that formed cartels that were
detected from all other firms some of which were not in cartels and other which were in cartel
but were not discovered. The dependent variable Conviction (CONV) counts the number
of episodes of sanctions in connection with proven cartel activity. CONV takes a value of 1 if
the firm has been sanctioned in connection with cartel formation and discovery on a single
occasion, 2 if the firm was involved in cartel activity on two occasions (multiple abusers), etc.
The value of 0 is assigned to CONV for the benchmark comparison with firms without any
involvement in cartel activity, referred to here as "non-cartel firms", which means that the
firm has not formed any cartel, nor had been discovered for any cartel activity. However, it
must be noted that some non-cartel firms might also be in cartel but have not been discovered,
which cannot qualify them to be called "cartel firms" in this study.
The definition of CONV in the ordinal logistic model is that of an event with a certain
probability, and this will be described in more detail further on in this chapter.
2. The dependent variable Cartel is a dummy variable of whether a firm participates in cartel
agreement or not, which took a value of 1 if the firm participated and discovered in cartel
agreement and 0 otherwise.
5.1.2 Measurement of the Independent Variables
The governance data and the financial data originated from proxy statements with filing dates three
years prior to the start of the cartel agreements. The sources used to collect the data also include
Fame, DataStream, UK Firms House, Annual Reports by respective firms, BoardsEx, and
ExecuComp. In order to test whether certain characteristics of the boards and CEOs are associated
157
with cartel formation, the following variables are constructed to test the propositions made in chapter
three:
Board Characteristics
1. Sizeba, the size of the board pre-cartel formation. This variable is calculated as the average
total number of executive and non-executive directors for three years before the cartel started
for cartel firms. In the case of non-cartel firms, the average size is taken over the three-year
period corresponding in time to the window on the cartel firm with which the non-cartel firm
is matched.
2. NED (%), the percentage non-executive directors on the board pre-cartel formation. This
variable is computed for cartel firms as the percentage of the total number of board members
who are considered to be an independent director for the three-year period before the cartel
started. In the case of non-cartel firms, the average is taken over the three-year period
corresponding in time to the window on the cartel firm with which the non-cartel firm is
matched.
3. Ageba, the age of the board pre- cartel formation. This variable is calculated as the average
age of the board for three years before the cartel started for cartel firms. In the case of non-
cartel firms, the average age is taken over the three-year period corresponding in time to the
window on the cartel firm with which the non-cartel firm is matched.
4. GENBA (%), the average gender ratio of the board pre-cartel formation. This variable is
computed for cartel firms as the ratio of the number of female directors on the board to the
total number of male directors for the three-year period before the cartel started. In the case
of non-cartel firms, the average gender is taken over the three-year period corresponding in
time to the window on the cartel firm with which the non-cartel firm is matched.
5. Durba, the duration of the board pre-cartel formation. This variable is computed for cartel
firms as the average duration of the board for three years before the cartel started. In the case
of non-cartel firms, the average duration is taken over the three-year period corresponding in
time to the window on the cartel firm with which the non-cartel firm is matched.
158
6. Remun, the board remuneration pre- cartel formation. This variable is computed for cartel
firms as the average board compensation for the three-year period before the cartel started. In
the case of non-cartel firms, the average is taken over the three-year period corresponding in
time to the window on the cartel firm with which the non-cartel firm is matched.
Ownership Structure
1. OUTOWN (%), the common stock owned by outside directors on the board pre-cartel
formation. This variable is calculated for cartel firms as the percentage of the common stock
owned by outside directors for the three years before the cartel started. In the case of non-
cartel firms, the average is taken over the three-year period corresponding in time to the
window on the cartel firm with which the non-cartel firm is matched.
2. FAMCON, following Lin and Liu (2009) FAMCON is a dummy variable, which equals 1 if
the firm is family-owned and controlled, 0 otherwise.
CEO characteristics
1. CEOAGE, CEO age. This variable is computed as the age of the CEO at the starting year of
the cartel formation. In the case of non-cartel firms, the CEO age is taken over the period
corresponding in time to the window on the cartel firm with which the non-cartel firm is
matched.
2. CEOTEN, CEO tenure. This variable is computed as uninterrupted years on the board of
directors up to the year when the cartel started. In the case of non-cartel firms, the CEO
tenure is taken over the three-year period corresponding in time to the window on the cartel
firm with which the non-cartel firm is matched.
3. CEOGEN, CEO gender. This variable is a dummy variable for both cartel firms and non-
cartel firms with value of 1 if CEO was female and 0 if otherwise. In the case of non-cartel
firms, the CEO gender dummy is taken over the three-year period corresponding in time to
the window on the cartel firm with which the non-cartel firm is matched.
159
4. BOSS, power concentration. This variable is a dummy variable for cartel firms created with a
value of 1 if the chair of the board held concentration power of CEO or president and 0 if
otherwise. In the case of non-cartel firms we take the BOSS dummy is taken over the three
year period corresponding in time to the window on the cartel firm with which the non-cartel
firm is matched.
5. Multidir, multiple-directorships. This variable is calculated as the total number of
directorship assigned to the CEO on other boards. In the case of non-cartel firms, the total
number of multiple directorships is taken over the three-year period corresponding in time to
the window on the cartel firm with which the non-cartel firm is matched.
CEO Compensation
1. Bonus. This variable is calculated as the average three-year CEO bonus. In the case of non-
cartel firms, we take the average CEO bonus over the same time window which corresponds
in time with the window of the cartel firm with which the non-cartel firm is matched.
2. Shares. This variable is calculated as the average three-year CEO shares in the firm. In the
case of non-cartel firms, we take the average CEO shares over the three-year period
corresponding in time to the window on the cartel firm with which the non-cartel firm is
matched.
3. Tcomp. Is the total compensation. This variable is calculated as the total average three years
CEO compensation in the firm. In the case of non-cartel firms, the average CEO total
compensation is taken over the three-year period corresponding in time to the window on the
cartel firm with which the non-cartel firm is matched.
5.1.3 Measurement of Control Variables
In the empirical analysis of price fluctuations, Connor et al., (2008) suggest that the success of
collusion depends on three key factors: market environment, legal environment, and internal
enforcement. Since this study examines the governance structure of firms involved in cartel, this
study will examine independent governance variables (CEO and board characteristics) in respect to
cartel formation and discovery (CONV scores), and therefore, following Connor et al. (2008) will
160
establish some measures for control factors that describe the market and legal environments of cartel
and non-cartel firms, as well as the firm control variables.
The Market Environment
HHI, i.e., the Herfindahl-Hirschman Index, commonly accepted measure of the market
concentration is used in this study. It is calculated by squaring the market share of each firm
competing in the market and then summing up the resulting numbers.
Where si is the market share of the firm; i is the market, and N is the number of firms. In a market
with two firms each with 50 percent market share, the HHI equals 0.50^2 + 0.50^2 = 1/2. Markets
in which the HHI is between 0.15 and 0.25 point are considered moderately concentrated by the U.S
DoJ, whilst those in which the HHI is in excess of 0.25 are considered to be concentrated.
Transactions that increase the HHI by more than 0.1 in already concentrated markets will
automatically attract antitrust concerns under the Horizontal Merger Guidelines, issued by the U.S
DoJ and the Federal Trade Commission (FTC) (See Merger Guidelines (1.5)). In the case of non-
cartel firms, we take the HHI over the same time window, which corresponds in time with the
window of the cartel firm with which the non-cartel firm is matched.
The Legal Environment
This variable describes the jurisdictional zone where the conviction case was set. The variable is
broken out into an array of four jurisdictions, covering the U.S Department of Justice (DoJ), the
Competition Commission/ Office of Fair Trading (OFT), the European Commission (EC), and all
other territories. A value of 1 is assigned when the firm is found to have committed a cartel criminal
infringement in the jurisdiction, and 0 if otherwise. However, as these variables are highly
correlated with one another only the DoJ variable is used in the regression since it is the oldest
jurisdiction between all and it is not highly correlated with the other variables.
Firm Control Variables
1. Saleb, i.e., the average sales pre-cartel formation; this variable is calculated for cartel firms as
the average size of the board for three years before the cartel agreement started. In the case of
161
non-cartel firms, we take the average sales over the three -year period corresponding in time
to the window on the cartel firm with which the non-cartel firm is matched. It must be noted
that the firms, having the most number of firms amongst the sample firms, are highlighted in
the sample.
2. CurrRatioB, i.e., the average of current ratio pre-cartel formation. This variable is calculated
as the average of current asset divided by current liabilities for three years before the cartel
started. In the case of non-cartel firms, the average current ratio is taken over the three-year
period corresponding in time to the window on the cartel firm with which the non-cartel firm
is matched.
3. PPER, i.e., the average poor financial performance pre-cartel formation. Bell, Szykowny, and
Willingham (1993) noted that poor financial performance increases the likelihood of general
financial fraud. Therefore, the variable PPER (poor performance) is included as a metric to
control for differences in financial performance between cartel and non-cartel firms. The
metric is measured in a manner similar to that of DeAngelo and DeAngelo (1990),
DeAngelo, DeAngelo, and Skinner (1994), and Beasley (1996). However, the studies above
have used a poor performance measure as a dummy variable, whereas here, the actual value
of ‘poor performance’ is used to indicate the firms’ actual financial performance. The
variable is calculated for cartel firms as the average profit and loss for three years before the
cartel started. In the case of non-cartel firms, the average is taken over the three-year period
corresponding in time to the window on the cartel firm with which the non-cartel firm is
matched.
4. COSTA, i.e., the firm’s ownership status to control for private firms and public firms. This
variable takes the value of 1 if the firm is public and 0 if the firm is private.
5. Industry, i.e. the industry in which each firm operates (three-digit SIC code);
6. Year, i.e. the starting year of the cartel formation agreement.
7. Country (UK), a dummy variable took value of 1 if the firm based in the UK, 0 otherwise.

162
Table: 5.1 Variables and their Measurements
Dependent variable Symbol Description of the Variables
Cartel formation and
discovery (conviction)
CONV
Ordered variable equal to the prior incidence of cartel formation and
discovery. Thus, the value is 0 if the firm had never been convicted of a
cartel crime, 1 if it was a first-time conviction, 2 if it represented the
second conviction, and so on.
Cartel formation Cartel Dummy variable which equal 1 if the firm participated and discovered in
cartel agreement and 0 otherwise.
Independent Variables
Board Characteristics
Size of the Board SizeBA Average size of the board of directors for the period pre-cartel, for both
cartel and non-cartel firms.
Age of the Board AgeBA Average age of the board of directors for the period pre-cartel, for both
cartel and non-cartel firms.
Gender of the Board GENBA % The average gender ratio of the board of directors for the period pre-
cartel, for both cartel and non-cartel firms.
Duration of the Board DurBA Average duration (years) of board members’ tenure for the period pre-
cartel, for both cartel and non-cartel firms.
Non-Executive Directors NED % Percentage of outsider (non executive) directors on the board for the
period pre-cartel.
Board compensation Remun Average of three years board compensation
Ownership Structure
Common stock own by
outside directors
OUTOWN % Proportion of common stock owned by outside directors.
Family-owned and
controlled
FAMCON Dummy variable, which equals 1 if the firm is family -owned and
controlled, 0 otherwise.
CEO Characteristics
CEO Gender CEOGen Dummy variable with a value of 1 if the CEO was female, 0 otherwise.
CEO Age CEOAge Age of the CEO at the starting year of the cartel.
CEO Tenure CEOTen Years of tenure for the CEO on the board.
Concentration Power BOSS Dummy variable with a value of 1 if the chair of the board also held the
concentration power of CEO or president for the period pre-cartel.
Multi-directorship Multidir The total numbers of directorship the CEO serving on.
CEO Compensation
Bonus Bonus Average 3 year CEO bonus for the period pre-cartel
Share Shares Average 3 year CEO share for the period pre-cartel
Total Compensation Tcomp Average 3 years total CEO compensation for the period pre-cartel
Control Variables
Sale Pre-cartel Saleb Average 3 years sales for the period pre-cartel.
Current Ratio Pre-cartel Currratio Average 3 years current ratio (current assets/current liabilities) for the
period pre-cartel.
Herfindahl Index HHI The size and distribution of the firms in a market pre-cartel
Poor Financial Performance PPER Average of three annual net losses in period preceding the cartel.
Firm ownership Costa Dummy variable with a value of 1 if the firm is a public firm and 0 if the
firm is private.
Members Joined Join Number of members appointed during the CEO regime.
Department of Justice DoJ A dummy variable with value of 1 is assigned when the firm is found to
have committed a cartel criminal infringement in the US, otherwise 0.
CEO Case CEOCASE Dummy variable shows the total number of cartel cases the CEO was
involved in before a-particular cartel case.
CEO number CEONUM Total number of cartel cases the CEO is involved in.
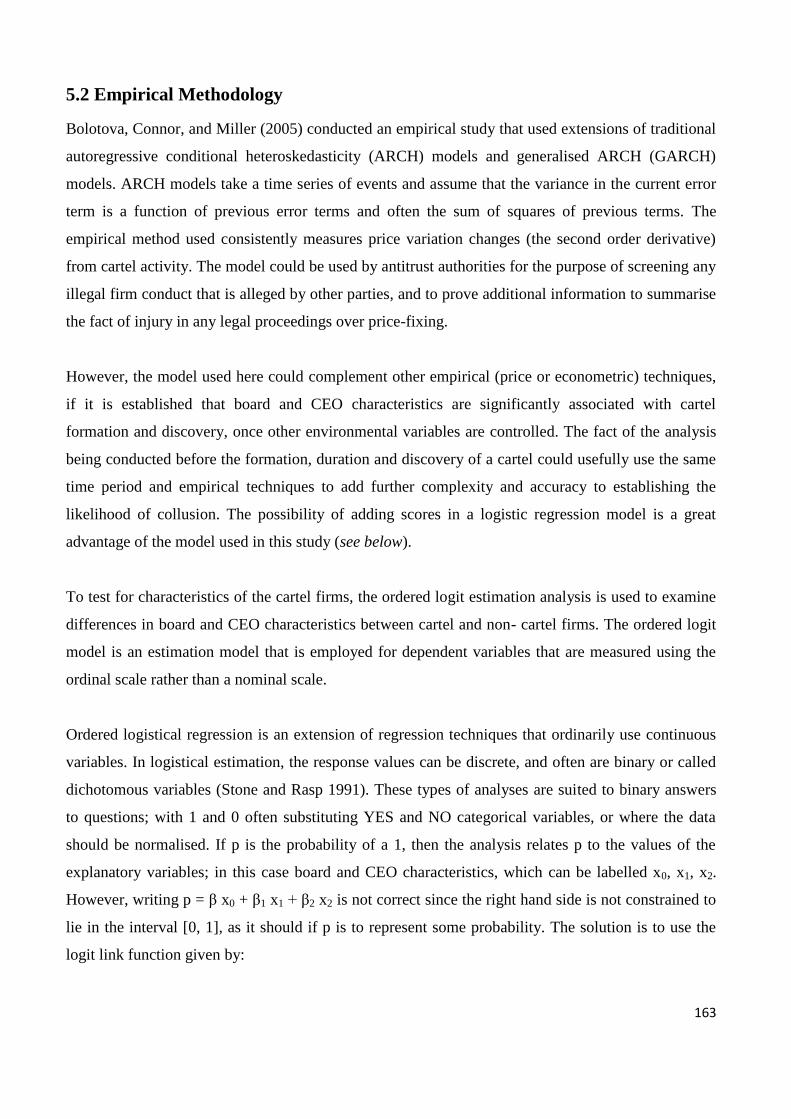
163
5.2 Empirical Methodology
Bolotova, Connor, and Miller (2005) conducted an empirical study that used extensions of traditional
autoregressive conditional heteroskedasticity (ARCH) models and generalised ARCH (GARCH)
models. ARCH models take a time series of events and assume that the variance in the current error
term is a function of previous error terms and often the sum of squares of previous terms. The
empirical method used consistently measures price variation changes (the second order derivative)
from cartel activity. The model could be used by antitrust authorities for the purpose of screening any
illegal firm conduct that is alleged by other parties, and to prove additional information to summarise
the fact of injury in any legal proceedings over price-fixing.
However, the model used here could complement other empirical (price or econometric) techniques,
if it is established that board and CEO characteristics are significantly associated with cartel
formation and discovery, once other environmental variables are controlled. The fact of the analysis
being conducted before the formation, duration and discovery of a cartel could usefully use the same
time period and empirical techniques to add further complexity and accuracy to establishing the
likelihood of collusion. The possibility of adding scores in a logistic regression model is a great
advantage of the model used in this study (see below).
To test for characteristics of the cartel firms, the ordered logit estimation analysis is used to examine
differences in board and CEO characteristics between cartel and non- cartel firms. The ordered logit
model is an estimation model that is employed for dependent variables that are measured using the
ordinal scale rather than a nominal scale.
Ordered logistical regression is an extension of regression techniques that ordinarily use continuous
variables. In logistical estimation, the response values can be discrete, and often are binary or called
dichotomous variables (Stone and Rasp 1991). These types of analyses are suited to binary answers
to questions; with 1 and 0 often substituting YES and NO categorical variables, or where the data
should be normalised. If p is the probability of a 1, then the analysis relates p to the values of the
explanatory variables; in this case board and CEO characteristics, which can be labelled x0, x1, x2.
However, writing p = β x0 + β1 x1 + β2 x2 is not correct since the right hand side is not constrained to
lie in the interval [0, 1], as it should if p is to represent some probability. The solution is to use the
logit link function given by:
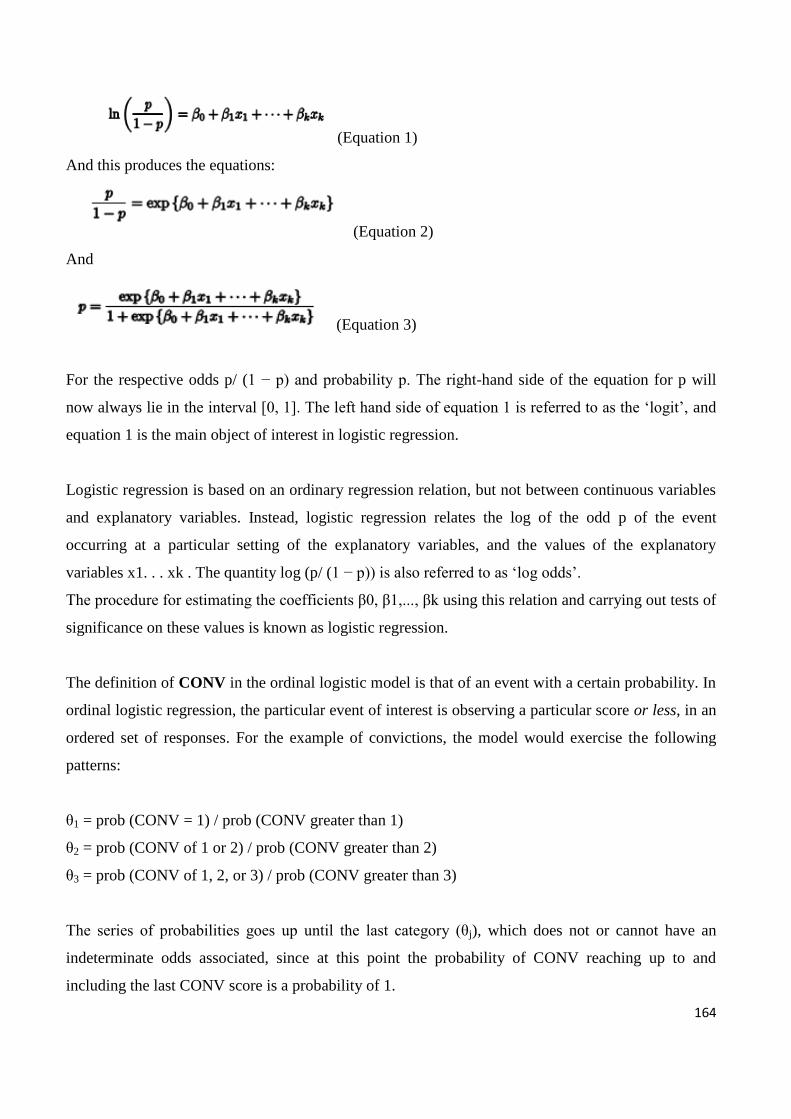
164
(Equation 1)
And this produces the equations:
(Equation 2)
And
(Equation 3)
For the respective odds p/ (1 − p) and probability p. The right-hand side of the equation for p will
now always lie in the interval [0, 1]. The left hand side of equation 1 is referred to as the ‘logit’, and
equation 1 is the main object of interest in logistic regression.
Logistic regression is based on an ordinary regression relation, but not between continuous variables
and explanatory variables. Instead, logistic regression relates the log of the odd p of the event
occurring at a particular setting of the explanatory variables, and the values of the explanatory
variables x1. . . xk . The quantity log (p/ (1 − p)) is also referred to as ‘log odds’.
The procedure for estimating the coefficients β0, β1,..., βk using this relation and carrying out tests of
significance on these values is known as logistic regression.
The definition of CONV in the ordinal logistic model is that of an event with a certain probability. In
ordinal logistic regression, the particular event of interest is observing a particular score or less, in an
ordered set of responses. For the example of convictions, the model would exercise the following
patterns:
θ1 = prob (CONV = 1) / prob (CONV greater than 1)
θ2 = prob (CONV of 1 or 2) / prob (CONV greater than 2)
θ3 = prob (CONV of 1, 2, or 3) / prob (CONV greater than 3)
The series of probabilities goes up until the last category (θj), which does not or cannot have an
indeterminate odds associated, since at this point the probability of CONV reaching up to and
including the last CONV score is a probability of 1.
165
All of the probabilities or log odds are of the form:
θj = prob ( CONV ≤ j ) / prob (CONV > j)
Or else, the equation can be re-written as
θj =prob (CONV ≤j) / (1–prob (CONV ≤j)).
Compare this to the left-hand side of equation 1. The probability of a firm with a CONV greater than
j, is 1 – probability of a firm with CONV less than or equal to j.
The odds that an event occurs (in our case it will be the number of convictions – cartel formation
and discovery – denoted by CONV) is the ratio of the number of firms who are found participating
in a cartel, and are convicted, on a precise number of occasions, compared to the number of firms
who do participate in a lesser number of cartel and are convicted. Hence CONV=2 is the logit
divides the probability p that cartel participation occurs by the probability that cartel participation
occurs at a lesser frequency. As both probabilities possess the same denominator and this cancels, the
logit produces the number of cartel firms (with a certain number of discovery specified by CONV),
divided by the number of non-cartel or cartel firms of lesser convictions (those firms with less than
that number of convictions). Therefore, each CONV is a monotonic (probability) function rising in
the interval [0, 1].
The coefficients in the logistic regression model used in this study yield how much the logit will
change given certain values of the predictor variables. Therefore, the coefficients in the logistic
regression model yield how much the ratio of cartel participation to non-cartel participation change,
dependent on the characteristics of the CEO and board.
In ordinary logistic regression, the values of CONV would be dichotomous, or either 0 or 1. In
ordered logistic regression, an order set of discrete variable can be assembled and the same
regression procedure extended.
The fitted model includes a logit function for the number of response categories minus one (the
reference event is number of cartel formation and discovery). For example, if the response has 4
levels, the model calculates 3 logit equations.
The ordinal logistic model in the simplest case, of a single independent variable, is then:
166
Log (θj) = αj –βX
Where j spans 1 to the number of categories, minus 1.
It is crucial to note that there may be a negative sign in front of coefficients for the predictor variables
(board and CEO characteristics) instead of the usual positive signs in ordinary regression analyses.
That is correct because in this model (versus ordinary regression models where the coefficient is
reciprocal to the score or influence of a characteristic, and the right hand side of the regression model
is not constrained to [0,1]), larger coefficients then indicate an association with larger scores or large
influence.
This is easy to see since in the case that the numerator (probability p in the left hand side of equation
1) is less of a value than the denominator (probability of not-p, or 1-p in the left hand side of equation
1), the value of the log function will be negative since the log of a number less than 1 is always
negative. The less likely p is compared to non-p or 1-p, the greater the negative value of the log and
the more a larger negative co-efficient of a certain characteristic is required, or else many negative
characteristics are required.
A large positive coefficient for a dichotomous variable model (for instance if cartel formation and
discovery (CONV), are either zero or one), would suggest that higher scores are more likely for the
first category, i.e. the event that there are many more zero convictions, CONV=0, and thus a higher
score for no conviction, meaning in our case that the non-cartel firms dominate the population of
firms for that particular combination of CEO and board characteristics.
A negative coefficient indicates that lower scores are more likely. For a continuous variable, a
positive coefficient tells you that as the values of the variable increase, the likelihood of larger scores
increases. An association with higher scores (such as CONV=4) means smaller cumulative
probabilities for lower scores, since they are less likely to occur.
Each logit has its own αj term, but possesses the same coefficient β. This means that the effect of the
independent variable (CEO or board characteristic) is the same for different logit functions (which
are calculating the relative probabilities of a certain number of convictions, and less than that number
of convictions). Hence ordered logit regression models can be called the proportional odds model.
167
The αj terms are labelled threshold values and do not concern us here – they resemble the intercept of
ordinary linear regression models – except that in ordered logistic regression, each logit has its own
αj term. Therefore, αj is important for calculating the overall ordered regression solution, but each αj
has no dependence on each of the independent variables, meaning board and CEO characteristics.
The values of αj would be important for calculating predicted values, and if the model for instance
was used in a machine learning environment, with the data such as here used as a training set, and
then the model used on new data entirely (the test set) to predict the CONV rate that might be
expected from amongst the mixed set of firms in the test set. The test set would thus be divided into
cartel and non-cartel firms, and a value of CONV attached to each.
Each equation will possess a unique constant and a unique parameter for each predictor, meaning for
each of the board and CEO characteristics. While nominal logistic regression assumes that the effect
of the predictor characteristic differs for each response value in CONV, in ordinal logistic regression
the effect is assumed to be constant (to repeat, a constant coefficient β in each logit function). Each
logit function evaluates how the covariates affect the likelihood of observing the reference level of
the response, versus observing another level of the response. The slope for each covariate describes
how the likelihood is affected. This means that all of the values of the coefficients of characteristics
in Table 5.2 (below) are correct for all of the values of CONV. If a multinomial logit regression were
used, there would be many more tables of coefficients, up to the value of j-1, in the description
above.
Three other attractive features of ordered logistic modelling are noticeable. First, there is how
combining scores into a single category does not affect results in other groups not involved in the
merge. The linear quality of the model is thus quite intuitive even to non-experts. This is very
desirable for allowing a business people and other non-mathematicians to appreciate the results.
At the same time, and secondly, the ordinary logistic regression model does not assume any
particular probability distribution around the distribution of the independent variables. This also is
crucial for describing the ‘real’ distribution of characteristics in a human population i.e. board
members and CEOs, whose age, gender, and other features is not easy to ascribe an analytic
probability distribution. For instance, most board members are male and between the ages of 40-70,
with highly skewed populations of men and older men. The probability distribution does not have to
be normal, linear or of equal variance amongst the sets of independent variables. All of this

168
permissible variation makes the model capable of being applied to the particular population and other
characteristics of corporate firms.
Third, a Maddala (1991) show that the logit model analysis is the appropriate procedure where
disproportionate sampling from two populations (i.e., the cartel and non-cartel firm populations)
occurs. Maddala notes that, the “coefficients of the explanatory variables are not affected by the
unequal sampling rates from the two groups. It is only the constant term that is affected.” Therefore
only the values of αj are affected. Two comments can be made here. In the sample in this study,
because of the very careful matching process done between cartel and non-cartel firms, and the
selection of roughly equal numbers of cartel versus non-cartel firms, the distribution of convictions
(cartel formation and discovery) and non-convictions in terms of sample records would already be
approximately 1 (given a dichotomous CONV = 0 or 1). However, the allowable range of CONV is
much higher in the ordered logistic regression, and so this still does not affect the model.
Moreover, if the sample of firms had been highly biased towards non-cartel firms (as in real life,
when cartel firms are in a minority), and then this is of little consequence. It might appear that a
sample of 1500 non-cartel firms versus 150 cartel firms would bias the model towards non-cartel
firms, or negative values in the logit function, since the population of the event in the denominator is
much larger than the population in the numerator. The latter possibility seems easy to appreciate,
since in the case that the numerator (probability p in the left hand side of equation 1) is less of a value
than the denominator (probability of non-p, or 1-p in the left hand side of equation 1), the value of the
log function will be negative since the log of a number less than 1 is always negative. The less likely
p is compared to non-p or 1-p, the greater the negative value of the log and the more a larger negative
co-efficient of a certain characteristic is required, or else many negative characteristics are required.
However, logit function works by probabilities and is not dependent on the sample size of either p or
non-p, meaning cartel or non-cartel firms.
This is another benefit of the model, its extensibility to unequal populations of cartel and non-cartel
firms. Therefore, the logistic regression model described here, if used elsewhere on a ‘real’
population, is still valid and should have predictive power. The single matter then in empirical terms
would be to adjust the values of αj, as Maddala (1991) makes note. Correcting for any bias appearing
in the constant term αj, is only important if the logit analysis is being used to obtain parameter
estimates for purposes of developing a predictive model (Palepu 1986). It is not the purpose of this
169
research to develop a predictive model of cartel formation related to CEO and board characteristics.
The model could be only be used accurately to predict cartel and non-cartel firms amongst a
population that was already known to contain, like this sample, an overall roughly equal sampling of
cartel and non-cartel firms. Therefore, the model has limited predictive capacity in a real world
scenario where the population of non-cartel firms is likely to be much higher, and then values of αj
will be much different from the matched data used here. The values of αj are not necessary for this
study, and so are not discussed.
5.3 Descriptive Statistics and Univariate Analysis
This section is divided in to three parts; the first part analyses the descriptive statistics for the entire
150 cartel firms and 178 non-cartel firms which are represented in table (5.2). The second part
analyses the descriptive statistics for only the 114 UK- based cartel firms and 138 UK non-cartel
firms which are represented in table (5.3). The last part in this section will analyses the descriptive
statistics for the 56 UK cartel firms at home and 58 UK cartel firms abroad which are represented in
table (5.4).
5.3.1 Descriptive Statistics Analysis for all Cartel and Non-Cartel Firms
It is essential to perform the univariate tests since many of the variables of interest were not normally
distributed. Table 5.2 provides a summary of the descriptive statistics of cartel and non-cartel firms in
respect of the board characteristics, ownership structure, CEO characteristics and CEO compensation
package. The table shows the number of observations (Obs), the means, the standard deviation
(STDV), and finally the p-value from paired t-tests between the means. All univariate test results are
reported as two-tailed. The results presented in Table 5.2 below are ordered by the three categories of
corporate governance used in this study and reported as significant at the 1%, 5% or 10% p-levels
(denoted as ***,**, and * respectively)
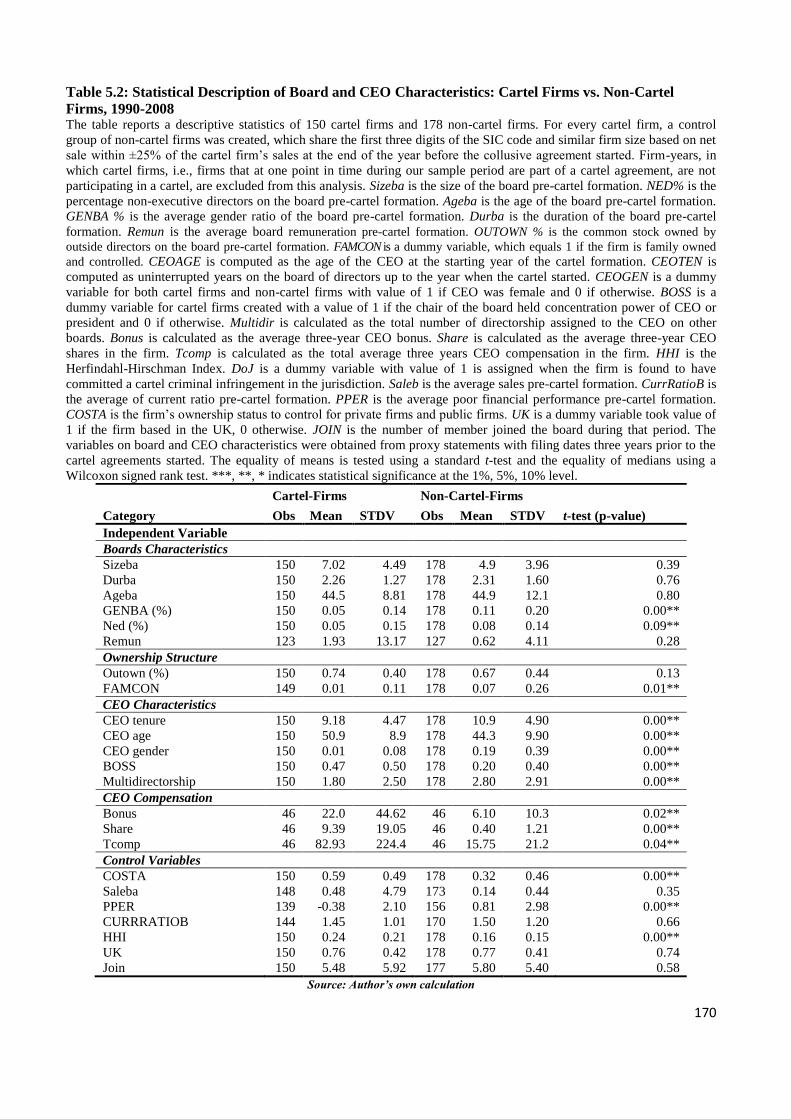
170
Table 5.2: Statistical Description of Board and CEO Characteristics: Cartel Firms vs. Non-Cartel
Firms, 1990-2008 The table reports a descriptive statistics of 150 cartel firms and 178 non-cartel firms. For every cartel firm, a control
group of non-cartel firms was created, which share the first three digits of the SIC code and similar firm size based on net
sale within ±25% of the cartel firm’s sales at the end of the year before the collusive agreement started. Firm-years, in
which cartel firms, i.e., firms that at one point in time during our sample period are part of a cartel agreement, are not
participating in a cartel, are excluded from this analysis. Sizeba is the size of the board pre-cartel formation. NED% is the
percentage non-executive directors on the board pre-cartel formation. Ageba is the age of the board pre-cartel formation.
GENBA % is the average gender ratio of the board pre-cartel formation. Durba is the duration of the board pre-cartel
formation. Remun is the average board remuneration pre-cartel formation. OUTOWN % is the common stock owned by
outside directors on the board pre-cartel formation. FAMCON is a dummy variable, which equals 1 if the firm is family owned
and controlled. CEOAGE is computed as the age of the CEO at the starting year of the cartel formation. CEOTEN is
computed as uninterrupted years on the board of directors up to the year when the cartel started. CEOGEN is a dummy
variable for both cartel firms and non-cartel firms with value of 1 if CEO was female and 0 if otherwise. BOSS is a
dummy variable for cartel firms created with a value of 1 if the chair of the board held concentration power of CEO or
president and 0 if otherwise. Multidir is calculated as the total number of directorship assigned to the CEO on other
boards. Bonus is calculated as the average three-year CEO bonus. Share is calculated as the average three-year CEO
shares in the firm. Tcomp is calculated as the total average three years CEO compensation in the firm. HHI is the
Herfindahl-Hirschman Index. DoJ is a dummy variable with value of 1 is assigned when the firm is found to have
committed a cartel criminal infringement in the jurisdiction. Saleb is the average sales pre-cartel formation. CurrRatioB is
the average of current ratio pre-cartel formation. PPER is the average poor financial performance pre-cartel formation.
COSTA is the firm’s ownership status to control for private firms and public firms. UK is a dummy variable took value of
1 if the firm based in the UK, 0 otherwise. JOIN is the number of member joined the board during that period. The
variables on board and CEO characteristics were obtained from proxy statements with filing dates three years prior to the
cartel agreements started. The equality of means is tested using a standard t-test and the equality of medians using a
Wilcoxon signed rank test. ***, **, * indicates statistical significance at the 1%, 5%, 10% level.
Category
Cartel-Firms Non-Cartel-Firms
Obs Mean STDV Obs Mean STDV t-test (p-value)
Independent Variable
Boards Characteristics
Sizeba 150 7.02 4.49 178 4.9 3.96 0.39
Durba 150 2.26 1.27 178 2.31 1.60 0.76
Ageba 150 44.5 8.81 178 44.9 12.1 0.80
GENBA (%) 150 0.05 0.14 178 0.11 0.20 0.00**
Ned (%) 150 0.05 0.15 178 0.08 0.14 0.09**
Remun 123 1.93 13.17 127 0.62 4.11 0.28
Ownership Structure
Outown (%) 150 0.74 0.40 178 0.67 0.44 0.13
FAMCON 149 0.01 0.11 178 0.07 0.26 0.01**
CEO Characteristics
CEO tenure 150 9.18 4.47 178 10.9 4.90 0.00**
CEO age 150 50.9 8.9 178 44.3 9.90 0.00**
CEO gender 150 0.01 0.08 178 0.19 0.39 0.00**
BOSS 150 0.47 0.50 178 0.20 0.40 0.00**
Multidirectorship 150 1.80 2.50 178 2.80 2.91 0.00**
CEO Compensation
Bonus 46 22.0 44.62 46 6.10 10.3 0.02**
Share 46 9.39 19.05 46 0.40 1.21 0.00**
Tcomp 46 82.93 224.4 46 15.75 21.2 0.04**
Control Variables
COSTA 150 0.59 0.49 178 0.32 0.46 0.00**
Saleba 148 0.48 4.79 173 0.14 0.44 0.35
PPER 139 -0.38 2.10 156 0.81 2.98 0.00**
CURRRATIOB 144 1.45 1.01 170 1.50 1.20 0.66
HHI 150 0.24 0.21 178 0.16 0.15 0.00**
UK 150 0.76 0.42 178 0.77 0.41 0.74
Join 150 5.48 5.92 177 5.80 5.40 0.58
Source: Author’s own calculation
171
Mean and pairwise comparisons (cartel vs. non-cartel firms) for various characteristics of the board
of directors and CEOs are in the table above. The matched pairs of the pairwise comparison varied
from 46 to 178 depending on the availability of data.
The table 5.2 provides a statistical description of board and CEO characteristics: cartel firms vs. non-
cartel firms, from the period 1990 to 2008. The average board size of cartel firms had 7 directors of
whom 5% are non-executive directors and 5% were female directors. In comparison the average
board size of non-cartel firms had 5 directors of whom 8% were non-executive and 11% female
directors.
In one hand, the pairwise differences in board characteristics show that difference in average board
size (Sizeba), average board duration (Durba), average board age, and average board remuneration
(Remun) are not statistically different from zero. On the other hand, the percentage of female
directors on the board (GENBA %) is statistically significantly higher for non-cartel firms than
cartel firms. Hence, this result supports the proposition P4; the number of women directors on the
board is negatively related to cartel formation and discovery. This has been emphasised in the study
of Cheung et al. (2006) and Swamy et al. (1999) on the propensity of female directors to be less
corrupt than men, which therefore led to an expectation to see less female serving on the board of
cartel firms compare to non-cartel firms. This result also consistent with the study of Ford and
Richardson, 1994; Watson and McNaughton, 2007 and Smith et al., 2006; Huse and Solberg, 2006
who reports a positive effect of the role of women on boards and find that women improve the
quality of decision making, and that women are generally more risk averse than men.
On average, cartel firms have lower percentage of non-executive (NED%) than non-cartel firms and
the result support proposition P2; the percentage of independent (non-executive) members on the
board of director is lower for firms committed cartel crime than for non-cartel firms. This is
consistent with the findings of Fama (1980), Fama and Jensen (1983) and Duchin et al., 2010, that a
higher percentage of independent directors (non-executive) increase the board effectiveness as a
monitor management.
The pairwise differences in ownership structure shows that there are more family-owned and
controlled firms between non-cartel firms than cartel firms (FAMCON). This result is contradictory
to our proposition P8, that cartel likely to be formed by family-owned and controlled firms.
172
However, the result is consistent with Laiho (2011) who argued that a more effective monitoring
takes place through a more concentrated ownership in the form of large shareholders.
The pairwise differences in CEO characteristics shows that cartel firms had significantly lower CEO
tenure (CEOten)which support proposition P10, that the number of years a CEO had served as a
director for a UK cartel firm is less than that for non-cartel firms. This result consistent with Han,
(2010) results which shows that firms are more likely to be involved in cartel agreement when CEO
tenure (short-term employment contract) is low or when CEO turnover (compensation) is high. Also
this results support the finding by Kaplan and Minton (2008) who have argued that it is possible for
CEOs with shorter tenure to pursue manipulation in the form of earnings management with the
situation that provides greater stock performance sensitivity and higher compensation.
Moreover, the statistical comparison shows that CEO age (CEOage) for cartel firms is higher
compared to non-cartel firms, and this finding supports our proposition P9: That the age of the CEO
for cartel firms is higher than non-cartel firms (p=0.00 <0.05). This results consistent with Kensinger,
(2012); Rezaee, (2007); Young and Buchholtz, (2002) and Hart, (1995) that experience is correlated
with age and some firms tend to employ older CEOs for their experience, social network and
knowledge in an industry. These qualities of older CEOs could facilitate the formation of cartel. In
addition, CEO closer to retirement age might feel he has less to lose in reputation damage if caught
committing cartel, and hence be more likely to perform cartel.
The t-test validity depends on the distributions of the means in the cartel and non-cartel firms being
approximately normal. The approximate normal distribution condition was generally true, as noted in
the first set of descriptive statistics above, except for the characteristic CEO gender (CEOgen)
amongst cartel firms, which had a skewness of 12.25 and kurtosis of 150. However, given the fact
that only one of 150 cartel firms and 35 of 178 non-cartel firms had a female CEO, the test for the
difference in means would still be expected to yield a significant, statistical difference. The female
CEO on cartel firms’ boards is lower than for non-cartel firms; this also supports our proposition of
P11: Less female CEOs represented in cartel firms compared to non-cartel firms (p=0.00 <0.05).
This findings also support that of Bharat et al. (2009 cited in Berger et al., 2012), where the author
posited that due to being more risk averse, female CEOs tend to make poorer investment decisions
and financial risks than male CEOs; hence, are likely to be less represented in cartel firms than in
non-cartel firms.
173
In addition, lower number of multiple-directorships (MULTIDIR) appears in cartel boards compared
to non-cartel boards. This result supports our proposition P12 that boards of directors of a firm
committing cartel are less likely to have directors who work on other boards than boards of directors
of non-cartel firms (p=0.01 <0.05), with similar result in 1% and 10%. This is consistent with the
work of Fama and Jensen (1983) that good governance practices are found in those directors who
carry out multiple directorships and are part of more than one board; hence, better governance is
associated with having directors who serve in more than one board, and this is contrary to cartel
firms.
The statistics result also shows that there are more CEOs’ role as president (BOSS) in cartel firms’
boards than non-cartel firms, which supports our proposition P13 that firms committing cartel crimes
are more likely to have CEOs serving as board chairs compared to non-cartel firms (p=0.00 <0.05).
This is consistent with the findings made by Goyal and Park (2002) that CEO concentration power is
not encouraged and is even prohibited due to the likelihood of insider activities, e.g. cartel formation.
Table 5.2 present compensation incentive measures for the CEOs at each firm. Due to the availability
of the data, the observation number shrunk to 92 firms (cartel and non-cartel). The results show that
CEOs in cartel firms have higher average bonuses, higher percentage of shares and higher total
compensation than non-cartel firms. In addition, the statistics also shows a significant p-value for the
CEOs bonuses, share, and total compensations in cartel firms. This result supports our propositions
P14 (The average CEO bonus for cartel firms is higher than non-cartel firms), P15 (The average
CEO share for cartel firms is higher than non-cartel firms), and P16 (Total CEO Compensation for
cartel firms is higher than non-cartel firms). The results consistent with Spagnolo, (2000) that
compensation packages enhance collusion.
A number of control variables were subject to univariate t-tests to determine whether additional firm
and market characteristics not related to variations in corporate governance attributes were present
between the sample of matched cartel and non-cartel firms. In one hand, the two-tailed comparison
tests for three of the control variables - SALE, CURRRATIOB, and JOIN did not identify any
statistically significant difference between the matched pairs.
174
On the other hand, the firm ownership variable (COSTA) shows a significant difference between
cartel firms and non-cartel firms at a 5% p-value. This result confirms that public firms are more
likely to engage in cartel agreement than private firms. Additionally, the poor performance (PPER)
variable and the Herfindahl index (HHI) variable both demonstrate a significant difference between
cartel firms and non-cartel firms at 5% p-value. Interestingly, the average poor financial performance
for cartel firms is (-38.4) and the average for the non-cartel firm is (81.1).
Overall, the pairwise comparisons suggest that systematic differences between cartel firms and non-
cartel matching firms are apparent in certain characteristics of the boards of directors and CEO
characteristics. However, these univariate comparisons should be viewed with caution when making
inferences about the connection between governance attributes and cartel formation. The pairwise
tests implicitly assume that other potentially relevant firm characteristics are fixed, which may not be
the case. Therefore, the ordered logit model was used to test the propositions in multivariate
framework.
5.3.2 Descriptive Statistics of UK Cartel Firms and UK Non-Cartel firms
As discussed earlier in Chapter Four, the sample used in this study involved 150 cartel firms and 178
non-cartel firms from all around the world, of which 114 cartel firms and 138 non-cartel firms are
from the UK. Therefore, since this study dominated by UK firms it is important to compare the
behaviour of UK cartel firms and UK non-cartel firms. This comparison will provide a more broad
inference on the characteristics of UK cartel and non-cartel firms within UK and outside.
Table 5.3 provides a summary of the descriptive statistics of UK cartel firms and UK non-cartel firms
in respect of the board characteristics, CEO characteristics and CEO compensation package. The
table shows the number of observations (Obs), the means, the standard deviation (STDV), and finally
the p-value from paired t-tests between the means. All univariate test results are reported as two-
tailed. The results presented in Table 5.3 below are ordered by the three categories of corporate
governance used in this study and reported as significant at the 1%, 5% or 10% p-levels (denoted as
***,**, and * respectively).
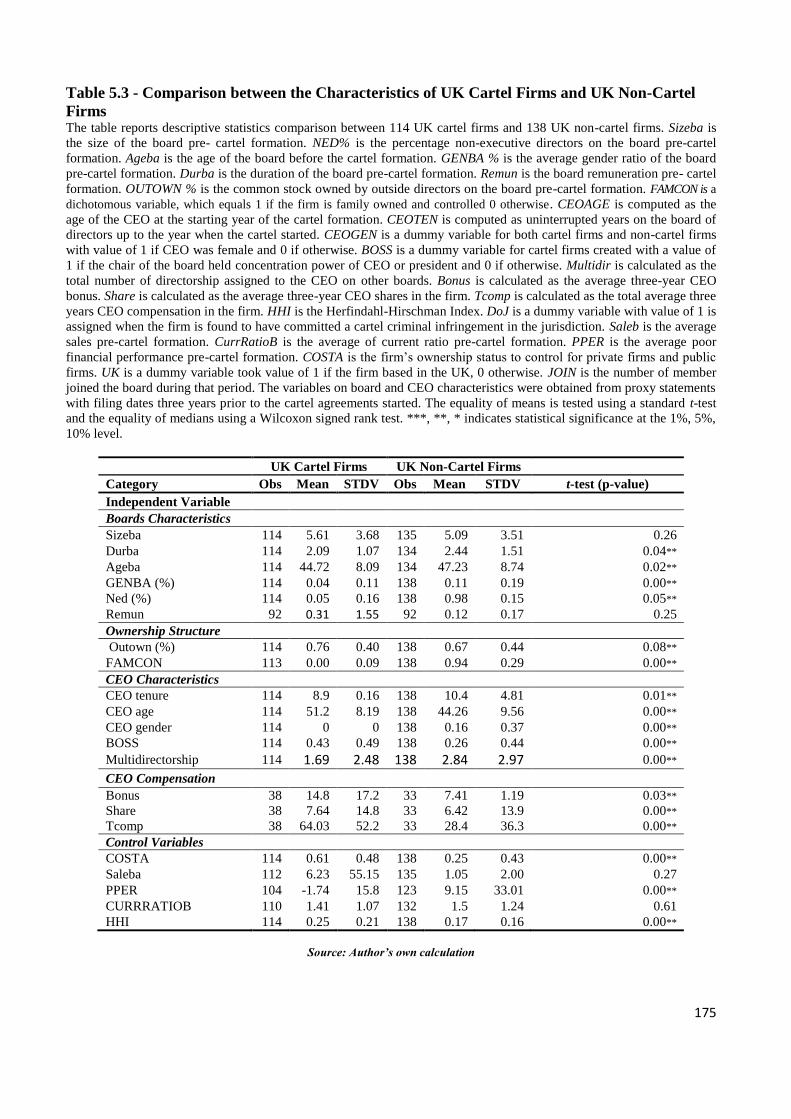
175
Table 5.3 - Comparison between the Characteristics of UK Cartel Firms and UK Non-Cartel
Firms The table reports descriptive statistics comparison between 114 UK cartel firms and 138 UK non-cartel firms. Sizeba is
the size of the board pre- cartel formation. NED% is the percentage non-executive directors on the board pre-cartel
formation. Ageba is the age of the board before the cartel formation. GENBA % is the average gender ratio of the board
pre-cartel formation. Durba is the duration of the board pre-cartel formation. Remun is the board remuneration pre- cartel
formation. OUTOWN % is the common stock owned by outside directors on the board pre-cartel formation. FAMCON is a
dichotomous variable, which equals 1 if the firm is family owned and controlled 0 otherwise. CEOAGE is computed as the
age of the CEO at the starting year of the cartel formation. CEOTEN is computed as uninterrupted years on the board of
directors up to the year when the cartel started. CEOGEN is a dummy variable for both cartel firms and non-cartel firms
with value of 1 if CEO was female and 0 if otherwise. BOSS is a dummy variable for cartel firms created with a value of
1 if the chair of the board held concentration power of CEO or president and 0 if otherwise. Multidir is calculated as the
total number of directorship assigned to the CEO on other boards. Bonus is calculated as the average three-year CEO
bonus. Share is calculated as the average three-year CEO shares in the firm. Tcomp is calculated as the total average three
years CEO compensation in the firm. HHI is the Herfindahl-Hirschman Index. DoJ is a dummy variable with value of 1 is
assigned when the firm is found to have committed a cartel criminal infringement in the jurisdiction. Saleb is the average
sales pre-cartel formation. CurrRatioB is the average of current ratio pre-cartel formation. PPER is the average poor
financial performance pre-cartel formation. COSTA is the firm’s ownership status to control for private firms and public
firms. UK is a dummy variable took value of 1 if the firm based in the UK, 0 otherwise. JOIN is the number of member
joined the board during that period. The variables on board and CEO characteristics were obtained from proxy statements
with filing dates three years prior to the cartel agreements started. The equality of means is tested using a standard t-test
and the equality of medians using a Wilcoxon signed rank test. ***, **, * indicates statistical significance at the 1%, 5%,
10% level.
UK Cartel Firms UK Non-Cartel Firms
Category Obs Mean STDV Obs Mean STDV t-test (p-value)
Independent Variable
Boards Characteristics
Sizeba 114 5.61 3.68 135 5.09 3.51 0.26
Durba 114 2.09 1.07 134 2.44 1.51 0.04**
Ageba 114 44.72 8.09 134 47.23 8.74 0.02**
GENBA (%) 114 0.04 0.11 138 0.11 0.19 0.00**
Ned (%) 114 0.05 0.16 138 0.98 0.15 0.05**
Remun 92 0.31 1.55 92 0.12 0.17 0.25
Ownership Structure
Outown (%) 114 0.76 0.40 138 0.67 0.44 0.08**
FAMCON 113 0.00 0.09 138 0.94 0.29 0.00**
CEO Characteristics
CEO tenure 114 8.9 0.16 138 10.4 4.81 0.01**
CEO age 114 51.2 8.19 138 44.26 9.56 0.00**
CEO gender 114 0 0 138 0.16 0.37 0.00**
BOSS 114 0.43 0.49 138 0.26 0.44 0.00**
Multidirectorship 114 1.69 2.48 138 2.84 2.97 0.00**
CEO Compensation Bonus 38 14.8 17.2 33 7.41 1.19 0.03**
Share 38 7.64 14.8 33 6.42 13.9 0.00**
Tcomp 38 64.03 52.2 33 28.4 36.3 0.00**
Control Variables
COSTA 114 0.61 0.48 138 0.25 0.43 0.00**
Saleba 112 6.23 55.15 135 1.05 2.00 0.27
PPER 104 -1.74 15.8 123 9.15 33.01 0.00**
CURRRATIOB 110 1.41 1.07 132 1.5 1.24 0.61
HHI 114 0.25 0.21 138 0.17 0.16 0.00**
Source: Author’s own calculation
176
Mean and pairwise comparisons (UK cartel vs. UK non-cartel firms) for various characteristics of the
board of directors and CEOs are in the table above. The matched pairs of the pairwise comparison
varied from 38 to 138 depending on the availability of data.
In one hand, the pairwise differences in board characteristics show that difference in average board
size, average board remuneration are not statistically different from zero. On the other hand, the
average board duration (Durba) is statistically significantly longer for UK non-cartel firms than for
UK cartel firms. This result suggest that the longer the duration of the board, the lower is the number
of cartel formation, and thus the lower are the incentives to engage in cartel crime.
Besides, the average board age (AGEBA) is statistically significantly lower for UK cartel firms than
for UK non-cartel firms. This result suggests that the lower the average age of the board the more
likely that the firm will form a cartel.
Similar to the previous result gender diversity of the board (GENBA (%)), Family-owned and
controlled firm (FAMCON) and non-executive directors (NED (%)) is statistically significantly
higher for UK non-cartel firms than UK cartel firms. In addition, the percentage of common stock
own by outside directors (Outown (%)) is statistically significantly higher for UK cartel firms than
UK non-cartel firms.
Moreover, CEO characteristics; CEO tenure (CEOten) and CEO age (CEOage) demonstrate a
significant difference, whilst the mean and standard deviation of 0 for CEO gender (CEOgen) for
UK cartel firms indicates that there are no CEO female on UK cartel firms’ boards. The pairwise
difference shows that UK cartel firms had a significantly lower CEO tenure than non-cartel UK
firms.
The CEO compensation package results show that CEOs in UK cartel firms have higher average
bonuses, higher percentage of shares and higher total compensation than UK non-cartel firms. In
addition, the statistics also shows a significant p-value for the CEOs bonuses, share, and total
compensations in UK cartel firms.
The firm ownership (COSTA) variable shows a significant difference between UK cartel firms and
UK non-cartel firms at a 5% p-value. This result confirms that UK public firms are more likely to
177
engage in cartel agreement than UK private firms. Additionally, the poor performance (PPER)
variable and the Herfindahl index (HHI) variable both demonstrate a significant difference between
UK cartel firms and UK non-cartel firms at 5% p-value. Interestingly, the average poor financial
performance for UK cartel firms is (-1.74) and the average for the UK non-cartel firm is (9.15).
Overall, the pairwise comparison between UK cartel firms and UK non-cartel firms shows very
similar results to the comparison between cartel firms and non-cartel firms from the previous section.
5.3.3 Descriptive Statistics of UK Cartel Firms at Home and Abroad
As discussed earlier, the sample involved 114 UK cartel firms, of which 56 UK cartel firms found
operating cartel in the UK (Home/Domestic) and 58 UK cartel firms found operating cartel abroad.
Therefore, since this study dominated by UK firms it is important to compare the behaviour of UK
cartel firms at home and abroad. This comparison will provide a more broad inference on the
characteristics of UK cartel firms within UK and outside.
Table 5.4 provides a summary of the descriptive statistics of UK cartel firms at home and UK cartel
firms abroad in respect of the board characteristics, CEO characteristics and CEO compensation
package. The table shows the number of observations (Obs), the means, the standard deviation
(STDV), and finally the p-value from paired t-tests between the means. All univariate test results are
reported as two-tailed. The results presented in Table 5.4 below are ordered by the three categories of
corporate governance used in this study and reported as significant at the 1%, 5% or 10% p-levels
(denoted as ***,**, and * respectively)
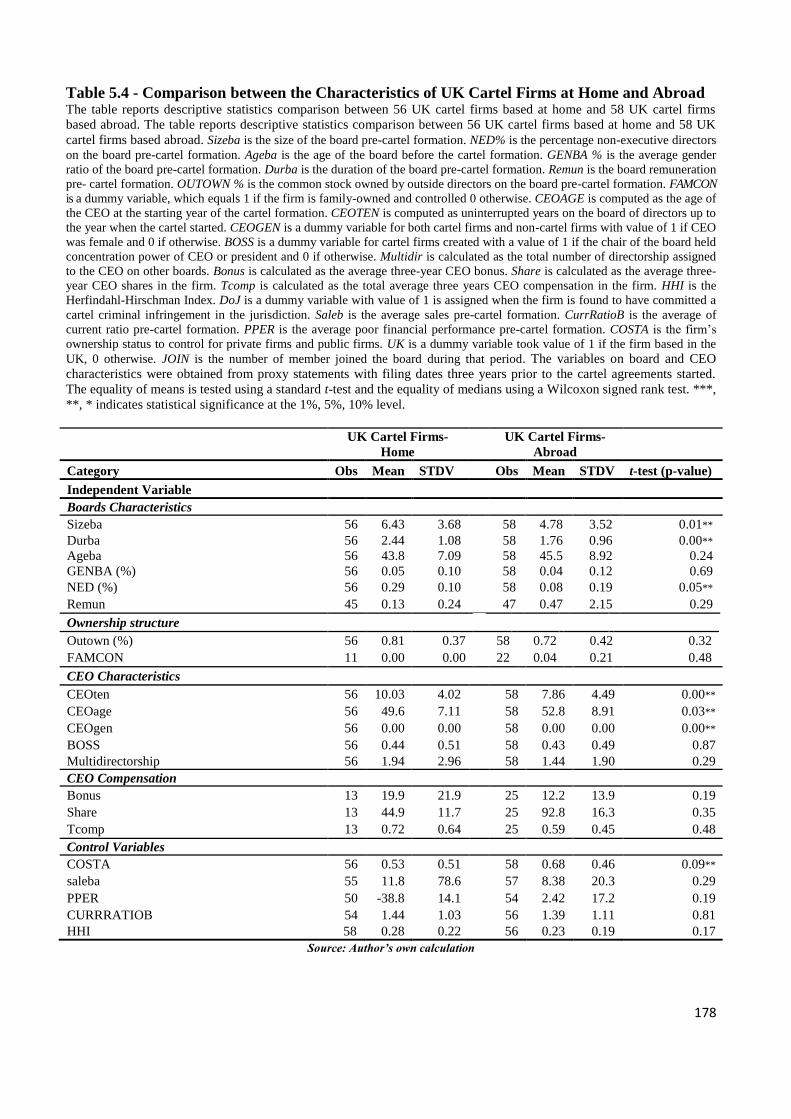
178
Table 5.4 - Comparison between the Characteristics of UK Cartel Firms at Home and Abroad The table reports descriptive statistics comparison between 56 UK cartel firms based at home and 58 UK cartel firms
based abroad. The table reports descriptive statistics comparison between 56 UK cartel firms based at home and 58 UK
cartel firms based abroad. Sizeba is the size of the board pre-cartel formation. NED% is the percentage non-executive directors
on the board pre-cartel formation. Ageba is the age of the board before the cartel formation. GENBA % is the average gender
ratio of the board pre-cartel formation. Durba is the duration of the board pre-cartel formation. Remun is the board remuneration
pre- cartel formation. OUTOWN % is the common stock owned by outside directors on the board pre-cartel formation. FAMCON
is a dummy variable, which equals 1 if the firm is family-owned and controlled 0 otherwise. CEOAGE is computed as the age of
the CEO at the starting year of the cartel formation. CEOTEN is computed as uninterrupted years on the board of directors up to
the year when the cartel started. CEOGEN is a dummy variable for both cartel firms and non-cartel firms with value of 1 if CEO
was female and 0 if otherwise. BOSS is a dummy variable for cartel firms created with a value of 1 if the chair of the board held
concentration power of CEO or president and 0 if otherwise. Multidir is calculated as the total number of directorship assigned
to the CEO on other boards. Bonus is calculated as the average three-year CEO bonus. Share is calculated as the average three-
year CEO shares in the firm. Tcomp is calculated as the total average three years CEO compensation in the firm. HHI is the
Herfindahl-Hirschman Index. DoJ is a dummy variable with value of 1 is assigned when the firm is found to have committed a
cartel criminal infringement in the jurisdiction. Saleb is the average sales pre-cartel formation. CurrRatioB is the average of
current ratio pre-cartel formation. PPER is the average poor financial performance pre-cartel formation. COSTA is the firm’s
ownership status to control for private firms and public firms. UK is a dummy variable took value of 1 if the firm based in the
UK, 0 otherwise. JOIN is the number of member joined the board during that period. The variables on board and CEO
characteristics were obtained from proxy statements with filing dates three years prior to the cartel agreements started.
The equality of means is tested using a standard t-test and the equality of medians using a Wilcoxon signed rank test. ***,
**, * indicates statistical significance at the 1%, 5%, 10% level.
UK Cartel Firms-
Home
UK Cartel Firms-
Abroad
Category Obs Mean STDV Obs Mean STDV t-test (p-value)
Independent Variable
Boards Characteristics
Sizeba 56 6.43 3.68 58 4.78 3.52 0.01**
Durba 56 2.44 1.08 58 1.76 0.96 0.00**
Ageba 56 43.8 7.09 58 45.5 8.92 0.24
GENBA (%) 56 0.05 0.10 58 0.04 0.12 0.69
NED (%) 56 0.29 0.10 58 0.08 0.19 0.05**
Remun 45 0.13 0.24 47 0.47 2.15 0.29
Ownership structure
Outown (%) 56 0.81 0.37 58 0.72 0.42 0.32
FAMCON 11 0.00 0.00 22 0.04 0.21 0.48
CEO Characteristics
CEOten 56 10.03 4.02 58 7.86 4.49 0.00**
CEOage 56 49.6 7.11 58 52.8 8.91 0.03**
CEOgen 56 0.00 0.00 58 0.00 0.00 0.00**
BOSS 56 0.44 0.51 58 0.43 0.49 0.87
Multidirectorship 56 1.94 2.96 58 1.44 1.90 0.29
CEO Compensation
Bonus 13 19.9 21.9 25 12.2 13.9 0.19
Share 13 44.9 11.7 25 92.8 16.3 0.35
Tcomp 13 0.72 0.64 25 0.59 0.45 0.48
Control Variables
COSTA 56 0.53 0.51 58 0.68 0.46 0.09**
saleba 55 11.8 78.6 57 8.38 20.3 0.29
PPER 50 -38.8 14.1 54 2.42 17.2 0.19
CURRRATIOB 54 1.44 1.03 56 1.39 1.11 0.81
HHI 58 0.28 0.22 56 0.23 0.19 0.17
Source: Author’s own calculation
179
The table above shows the mean and pairwise comparisons between UK cartel firms at home vs. UK
cartel firms abroad for various board and CEOs characteristics. The matched pairs of the pairwise
comparison varied from 13 to 58 depending on the availability of data.
In one hand, the pairwise differences in board characteristics shows that difference in average board
age, gender diversity on the board, the percentage of outside directors’ stock ownership, and average
board remuneration are not statistically different from zero. On the other hand, the average board size
(Sizeba) is statistically significantly larger for UK cartel firms at home than for UK cartel firms
abroad. In addition, UK cartel firms at home have longer board duration (Durba) than the UK cartel
firms abroad.
Furthermore, non-executive directors (NED (%)) have a significant difference between UK cartel
firms at home and UK cartel firms abroad in terms of board characteristics. Hence, this suggests that
those UK firms at home have higher percentage of non-executive director than UK firms abroad.
Moreover, board age (AGEBA), gender of the board (GENBA (%)), outside director ownership
(OUTOWN (%)) and family-owned and controlled (FAMCON) have no significant difference
based on p-value of 0.05. These results indicate that these variables do not suggest corresponding
impact with one another in terms of cartel formation and discovery.
Additionally, CEO characteristics; CEO tenure (CEOten) and CEO age (CEOage) demonstrate a
significant difference, whilst the mean and standard deviation of 0 for CEO gender (CEOgen)
indicates that the two groups consider the same distribution or characteristics. Moreover, the CEO
compensation package did not identify any statistically significant difference between the UK cartel
firms at home and abroad.
The firm ownership (COSTA) variable shows a significant difference between UK cartel firms at
home and UK cartel firms abroad at a 5% p-value. This result indicates that more UK cartel firms
abroad are public firms. For the other control variables, the difference is not significant.
In summary the comparison between UK cartels firms at home and abroad doesn’t show a significant
difference in between them.
180
5.4 Correlation Analysis
As a number of explanatory variables are to be used in the regression equation, it becomes important
to make sure unique coefficients can be obtained for every independent variable without a
relationship (correlation) between them invalidating the results of the regression. “Multicollinearity
exists when there is a strong correlation between two or more predictors in a regression model”
(Field, 2005: 174). The correlation test performance determines if multicollinearity is likely to be a
matter of concern and if so, verifies the steps that need to be taken to resolve problems before the
regression analysis stage.
Since the data set examined by this study does not conform to parametric assumptions, given that the
data is not all normally distributed (although much of the data were approximately normally
distributed), it is recommended to use Spearman’s Rank-Order Correlation to determine if
multicollinearity exists amongst variables. The Spearman’s Rank-Order Correlation Coefficient
measures the strength of association between two ranked variables.
Table 5.5 below illustrates the results of the Spearman’s correlation coefficient matrixes. Only few
variables in the matrix exhibit evidence of multicollinearity. The most severe cases of correlation
arose between Total compensation and Bonus, with a correlation of 0.92. Another significant and
rather high correlation (80%) is between the CEO dummy variable, CEOCase which shows that if
the CEO is involved in another cartel, this is highly correlated with the number of cartel cases
attached to the CEO’s history (CEONUM), with a correlation of 0.84.
Similarly, (CEONUM) and (CEOCase) are correlated with CEO tenure (CEOTEN), poor
performance pre-cartel (PPER) and Total compensation. We believe that these correlations are
harmless, especially between the CEOTEN, CEOCase and CEOnum. Anderson, Tatham and Black
(1995) and Gujarati (2003) have suggested 0.80 as the threshold at which multicollinearity concern
may threaten the regression analysis.
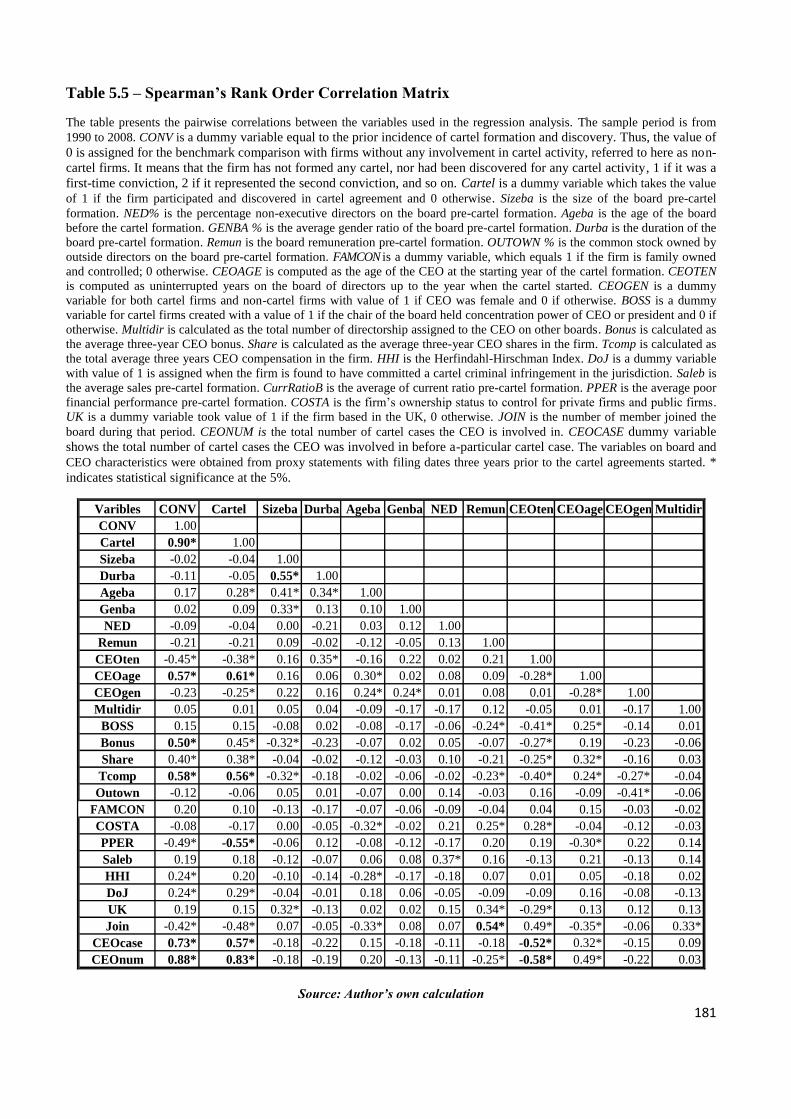
181
Table 5.5 – Spearman’s Rank Order Correlation Matrix
The table presents the pairwise correlations between the variables used in the regression analysis. The sample period is from
1990 to 2008. CONV is a dummy variable equal to the prior incidence of cartel formation and discovery. Thus, the value of
0 is assigned for the benchmark comparison with firms without any involvement in cartel activity, referred to here as non-
cartel firms. It means that the firm has not formed any cartel, nor had been discovered for any cartel activity, 1 if it was a
first-time conviction, 2 if it represented the second conviction, and so on. Cartel is a dummy variable which takes the value
of 1 if the firm participated and discovered in cartel agreement and 0 otherwise. Sizeba is the size of the board pre-cartel
formation. NED% is the percentage non-executive directors on the board pre-cartel formation. Ageba is the age of the board
before the cartel formation. GENBA % is the average gender ratio of the board pre-cartel formation. Durba is the duration of the
board pre-cartel formation. Remun is the board remuneration pre-cartel formation. OUTOWN % is the common stock owned by
outside directors on the board pre-cartel formation. FAMCON is a dummy variable, which equals 1 if the firm is family owned
and controlled; 0 otherwise. CEOAGE is computed as the age of the CEO at the starting year of the cartel formation. CEOTEN
is computed as uninterrupted years on the board of directors up to the year when the cartel started. CEOGEN is a dummy
variable for both cartel firms and non-cartel firms with value of 1 if CEO was female and 0 if otherwise. BOSS is a dummy
variable for cartel firms created with a value of 1 if the chair of the board held concentration power of CEO or president and 0 if
otherwise. Multidir is calculated as the total number of directorship assigned to the CEO on other boards. Bonus is calculated as
the average three-year CEO bonus. Share is calculated as the average three-year CEO shares in the firm. Tcomp is calculated as
the total average three years CEO compensation in the firm. HHI is the Herfindahl-Hirschman Index. DoJ is a dummy variable
with value of 1 is assigned when the firm is found to have committed a cartel criminal infringement in the jurisdiction. Saleb is
the average sales pre-cartel formation. CurrRatioB is the average of current ratio pre-cartel formation. PPER is the average poor
financial performance pre-cartel formation. COSTA is the firm’s ownership status to control for private firms and public firms.
UK is a dummy variable took value of 1 if the firm based in the UK, 0 otherwise. JOIN is the number of member joined the
board during that period. CEONUM is the total number of cartel cases the CEO is involved in. CEOCASE dummy variable
shows the total number of cartel cases the CEO was involved in before a-particular cartel case. The variables on board and
CEO characteristics were obtained from proxy statements with filing dates three years prior to the cartel agreements started. *
indicates statistical significance at the 5%.
Varibles CONV Cartel Sizeba Durba Ageba Genba NED Remun CEOten CEOage CEOgen Multidir
CONV 1.00
Cartel 0.90* 1.00
Sizeba -0.02 -0.04 1.00
Durba -0.11 -0.05 0.55* 1.00
Ageba 0.17 0.28* 0.41* 0.34* 1.00
Genba 0.02 0.09 0.33* 0.13 0.10 1.00
NED -0.09 -0.04 0.00 -0.21 0.03 0.12 1.00
Remun -0.21 -0.21 0.09 -0.02 -0.12 -0.05 0.13 1.00
CEOten -0.45* -0.38* 0.16 0.35* -0.16 0.22 0.02 0.21 1.00
CEOage 0.57* 0.61* 0.16 0.06 0.30* 0.02 0.08 0.09 -0.28* 1.00
CEOgen -0.23 -0.25* 0.22 0.16 0.24* 0.24* 0.01 0.08 0.01 -0.28* 1.00
Multidir 0.05 0.01 0.05 0.04 -0.09 -0.17 -0.17 0.12 -0.05 0.01 -0.17 1.00
BOSS 0.15 0.15 -0.08 0.02 -0.08 -0.17 -0.06 -0.24* -0.41* 0.25* -0.14 0.01
Bonus 0.50* 0.45* -0.32* -0.23 -0.07 0.02 0.05 -0.07 -0.27* 0.19 -0.23 -0.06
Share 0.40* 0.38* -0.04 -0.02 -0.12 -0.03 0.10 -0.21 -0.25* 0.32* -0.16 0.03
Tcomp 0.58* 0.56* -0.32* -0.18 -0.02 -0.06 -0.02 -0.23* -0.40* 0.24* -0.27* -0.04
Outown -0.12 -0.06 0.05 0.01 -0.07 0.00 0.14 -0.03 0.16 -0.09 -0.41* -0.06
FAMCON 0.20 0.10 -0.13 -0.17 -0.07 -0.06 -0.09 -0.04 0.04 0.15 -0.03 -0.02
COSTA -0.08 -0.17 0.00 -0.05 -0.32* -0.02 0.21 0.25* 0.28* -0.04 -0.12 -0.03
PPER -0.49* -0.55* -0.06 0.12 -0.08 -0.12 -0.17 0.20 0.19 -0.30* 0.22 0.14
Saleb 0.19 0.18 -0.12 -0.07 0.06 0.08 0.37* 0.16 -0.13 0.21 -0.13 0.14
HHI 0.24* 0.20 -0.10 -0.14 -0.28* -0.17 -0.18 0.07 0.01 0.05 -0.18 0.02
DoJ 0.24* 0.29* -0.04 -0.01 0.18 0.06 -0.05 -0.09 -0.09 0.16 -0.08 -0.13
UK 0.19 0.15 0.32* -0.13 0.02 0.02 0.15 0.34* -0.29* 0.13 0.12 0.13
Join -0.42* -0.48* 0.07 -0.05 -0.33* 0.08 0.07 0.54* 0.49* -0.35* -0.06 0.33*
CEOcase 0.73* 0.57* -0.18 -0.22 0.15 -0.18 -0.11 -0.18 -0.52* 0.32* -0.15 0.09
CEOnum 0.88* 0.83* -0.18 -0.19 0.20 -0.13 -0.11 -0.25* -0.58* 0.49* -0.22 0.03
Source: Author’s own calculation
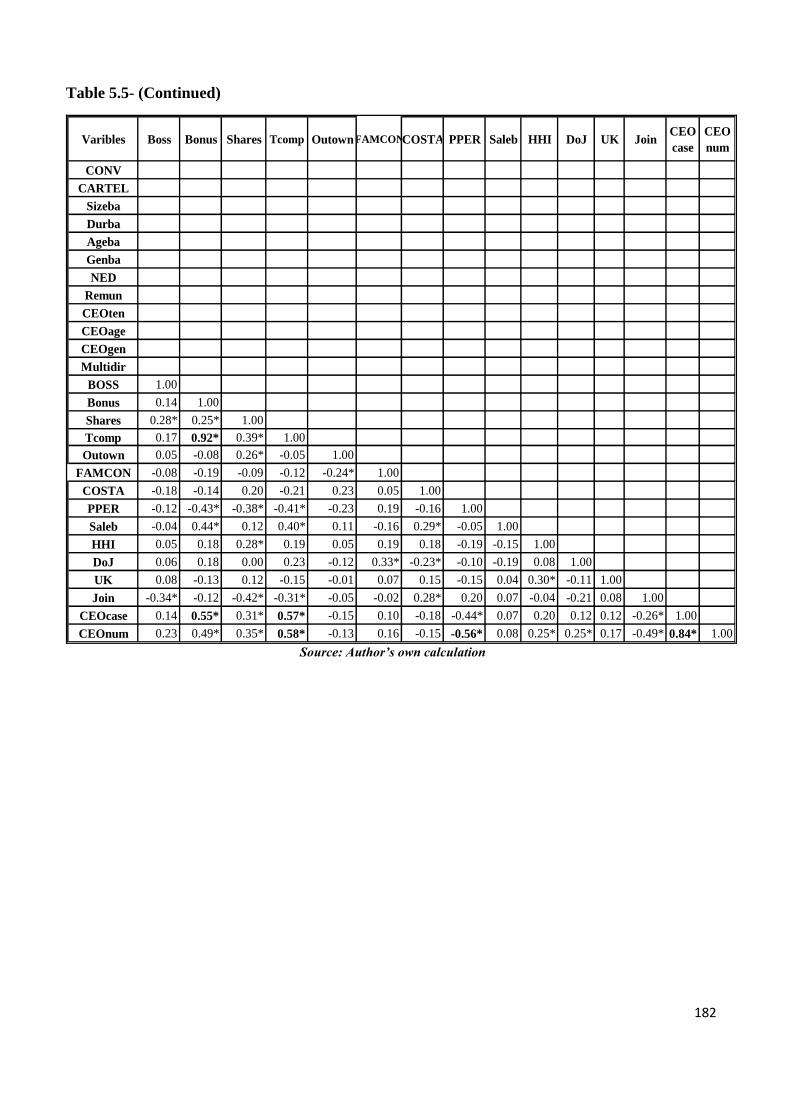
182
Table 5.5- (Continued)
Varibles Boss Bonus Shares Tcomp OutownFAMCONCOSTA PPER Saleb HHI DoJ UK JoinCEO
case
CEO
num
CONV
CARTEL
Sizeba
Durba
Ageba
Genba
NED
Remun
CEOten
CEOage
CEOgen
Multidir
BOSS 1.00
Bonus 0.14 1.00
Shares 0.28* 0.25* 1.00
Tcomp 0.17 0.92* 0.39* 1.00
Outown 0.05 -0.08 0.26* -0.05 1.00
FAMCON -0.08 -0.19 -0.09 -0.12 -0.24* 1.00
COSTA -0.18 -0.14 0.20 -0.21 0.23 0.05 1.00
PPER -0.12 -0.43* -0.38* -0.41* -0.23 0.19 -0.16 1.00
Saleb -0.04 0.44* 0.12 0.40* 0.11 -0.16 0.29* -0.05 1.00
HHI 0.05 0.18 0.28* 0.19 0.05 0.19 0.18 -0.19 -0.15 1.00
DoJ 0.06 0.18 0.00 0.23 -0.12 0.33* -0.23* -0.10 -0.19 0.08 1.00
UK 0.08 -0.13 0.12 -0.15 -0.01 0.07 0.15 -0.15 0.04 0.30* -0.11 1.00
Join -0.34* -0.12 -0.42* -0.31* -0.05 -0.02 0.28* 0.20 0.07 -0.04 -0.21 0.08 1.00
CEOcase 0.14 0.55* 0.31* 0.57* -0.15 0.10 -0.18 -0.44* 0.07 0.20 0.12 0.12 -0.26* 1.00
CEOnum 0.23 0.49* 0.35* 0.58* -0.13 0.16 -0.15 -0.56* 0.08 0.25* 0.25* 0.17 -0.49* 0.84* 1.00
Source: Author’s own calculation
183
5.5 Test of Hypotheses (Multivariate Analyses)
The propositions made earlier from a discussion of the literature predicted that prior to the
formation of a cartel, various board and CEO characteristics (size, duration, age, gender, and
non-executive, outside ownership, family-controlled, remuneration, CEO age, CEO gender,
CEO tenure multiple directorships, and concentration power), as well as CEO compensation,
may significantly differ between UK-based cartel firms and non-cartel firms.
The regression analysis shows the likely incidence of cartel convictions (CONV), which in this
report refers to cartel formation and discovery, as the dependent variable, and CEO and board
characteristics serving as predictors. The dependent variable is ordinal in nature with multiple
categories between 0 and 22. As noted, logistic regression is an iterative procedure that uses the
maximum likelihood methodology to accumulate the likelihood of an event below an ordinal
threshold. The first iteration (iteration 0) is the log likelihood of the “null” or “empty” model, or
a model with no predictors. With the next iteration, predictor(s) are included until the log
likelihood increases. The goal is to maximise the log likelihood.
This research utilises ten models to test the research propositions. There are several reasons that
support the division of the models. First, the correlation coefficient associated with the
independent variables, which indicates that multicollinearity can be a problem if all variables are
included in the same model. This multicollinearity problem is common in this type of research
and several studies control it using the means. For instance, the studies that find a high
correlation between the corporate governance variables are Ramsay et al. (2006), Benkel et al.
(2006) and Klein (1998). As suggested by Baum (2006), one way to resolve this issue is to omit
the collinear variables from the regression. Therefore, several models are formulated to ensure
increased accuracy of the results and to avoid any multicollinearity. Second, by separating this
study into several models, it is possible to investigate the effects of the board characteristics on
cartel formation and discovery separately from the effects of ownership structure, CEO
characteristics and CEO compensation package. Therefore, the empirical models with the main
variables of this study’s tests are formed and explained in the next section. Finally, some
variables such as the CEO gender (CEOgen) involved (32 female in 328 Obs). This variable
suffers from Sparse-data propensity. This type of data can cause misleading and unreliable
inferences about confounding, effect modification, dose response, and induction periods, and
may also have an interaction along with some other biases. Therefore, great care must be
exercised when adding them to the regression.
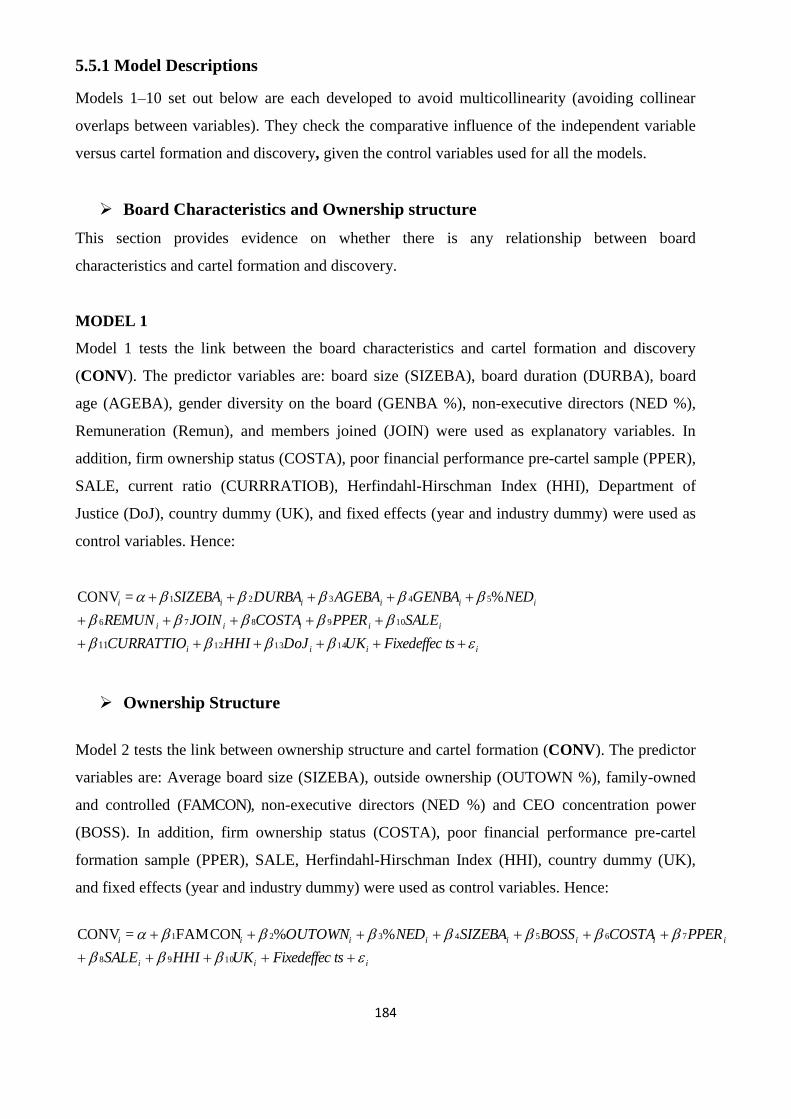
184
5.5.1 Model Descriptions
Models 1–10 set out below are each developed to avoid multicollinearity (avoiding collinear
overlaps between variables). They check the comparative influence of the independent variable
versus cartel formation and discovery, given the control variables used for all the models.
Board Characteristics and Ownership structure
This section provides evidence on whether there is any relationship between board
characteristics and cartel formation and discovery.
MODEL 1
Model 1 tests the link between the board characteristics and cartel formation and discovery
(CONV). The predictor variables are: board size (SIZEBA), board duration (DURBA), board
age (AGEBA), gender diversity on the board (GENBA %), non-executive directors (NED %),
Remuneration (Remun), and members joined (JOIN) were used as explanatory variables. In
addition, firm ownership status (COSTA), poor financial performance pre-cartel sample (PPER),
SALE, current ratio (CURRRATIOB), Herfindahl-Hirschman Index (HHI), Department of
Justice (DoJ), country dummy (UK), and fixed effects (year and industry dummy) were used as
control variables. Hence:
iiii
iiiii
iiiiii
tsFixedeffecUKDoJHHICURRATTIO
SALEPPERCOSTAJOINREMUN
NEDGENBAAGEBADURBASIZEBA
141312
109876
54321
11
%= CONV
Ownership Structure
Model 2 tests the link between ownership structure and cartel formation (CONV). The predictor
variables are: Average board size (SIZEBA), outside ownership (OUTOWN %), family-owned
and controlled (FAMCON), non-executive directors (NED %) and CEO concentration power
(BOSS). In addition, firm ownership status (COSTA), poor financial performance pre-cartel
formation sample (PPER), SALE, Herfindahl-Hirschman Index (HHI), country dummy (UK),
and fixed effects (year and industry dummy) were used as control variables. Hence:
iii
iiiiiiii
tsFixedeffecUKHHISALE
PPERCOSTABOSSSIZEBANEDOUTOWN
1098
7654321 %% FAMCON= CONV

185
CEO Characteristics
This partition presents evidence on whether or not there is any relation between CEO attributes
and cartel formation and discovery (CONV).
MODEL 3
CEO tenure (CEOTEN), CEO age (CEOAGE), multiple directorship (MULTIDIR) and
concentration power BOSS were used as explanatory variables. Also firm ownership (COSTA),
poor financial performance (PPER), sale, current ratio (CURRRATIOB), Herfindahl-Hirschman
Index (HHI), Department of Justice (DoJ), and fixed effects (year and industry dummy) were
used as control variables. Hence:
iiiiii
iiiiii
tsFixedeffecDoJHHICURRATTIOSALEPPER
COSTABOSSMULTIDIRCEOAGECEOTEN
109876
5431 2= CONV
MODEL 4
All variables included in the second model are retained, except PPER (poor financial
performance). A new variable CEOGEN (CEO gender) is also included. Hence:
iiiii
iiiiiii
tsFixedeffecDoJHHICURRATTIOSALE
COSTABOSSMULTIDIRCEOGENCEOAGECEOTEN
10987
65431 2= CONV
MODEL 5
As the data has revealed that some of the CEOs were convicted more than once, it is relevant to
control for the number of cartel cases the CEO was involved in before-the cartel sample. Model
5, all variables included in the third model are retained and a new variable CEOCASE (Dummy
variable shows the total number of cartel cases the CEO was involved in before a-particular
cartel case) is included. Hence:
iiiii
iiiiiii
tsFixedeffecDoJHHICURRATTIOSALE
COSTACEOCASEBOSSMULTIDIRCEOGENCEOAGECEOTEN
111098
765431 2= CONV
MODEL 6
In this model, we control for the total number of cartel cases the CEO was involved in. Model 6,
all variables included in the previous model were retained, except CEOCASE (The number of
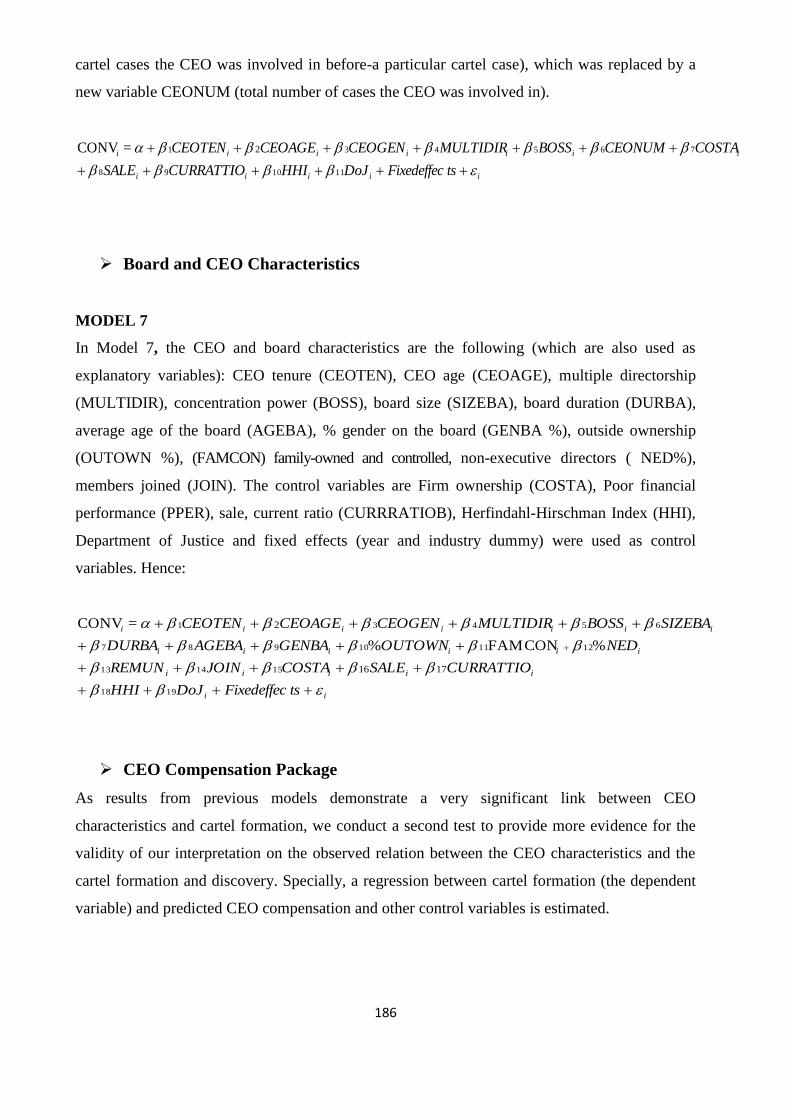
186
cartel cases the CEO was involved in before-a particular cartel case), which was replaced by a
new variable CEONUM (total number of cases the CEO was involved in).
iiiii
iiiiiii
tsFixedeffecDoJHHICURRATTIOSALE
COSTACEONUMBOSSMULTIDIRCEOGENCEOAGECEOTEN
111098
765431 2= CONV
Board and CEO Characteristics
MODEL 7
In Model 7, the CEO and board characteristics are the following (which are also used as
explanatory variables): CEO tenure (CEOTEN), CEO age (CEOAGE), multiple directorship
(MULTIDIR), concentration power (BOSS), board size (SIZEBA), board duration (DURBA),
average age of the board (AGEBA), % gender on the board (GENBA %), outside ownership
(OUTOWN %), (FAMCON) family-owned and controlled, non-executive directors ( NED%),
members joined (JOIN). The control variables are Firm ownership (COSTA), Poor financial
performance (PPER), sale, current ratio (CURRRATIOB), Herfindahl-Hirschman Index (HHI),
Department of Justice and fixed effects (year and industry dummy) were used as control
variables. Hence:
ii
iiiii
iiiiii
iiiiiii
tsFixedeffecDoJHHI
CURRATTIOSALECOSTAJOINREMUN
NEDOUTOWNGENBAAGEBADURBA
SIZEBABOSSMULTIDIRCEOGENCEOAGECEOTEN
1918
151413
121110987
65431
1716
2
%FAMCON%
= CONV
CEO Compensation Package
As results from previous models demonstrate a very significant link between CEO
characteristics and cartel formation, we conduct a second test to provide more evidence for the
validity of our interpretation on the observed relation between the CEO characteristics and the
cartel formation and discovery. Specially, a regression between cartel formation (the dependent
variable) and predicted CEO compensation and other control variables is estimated.
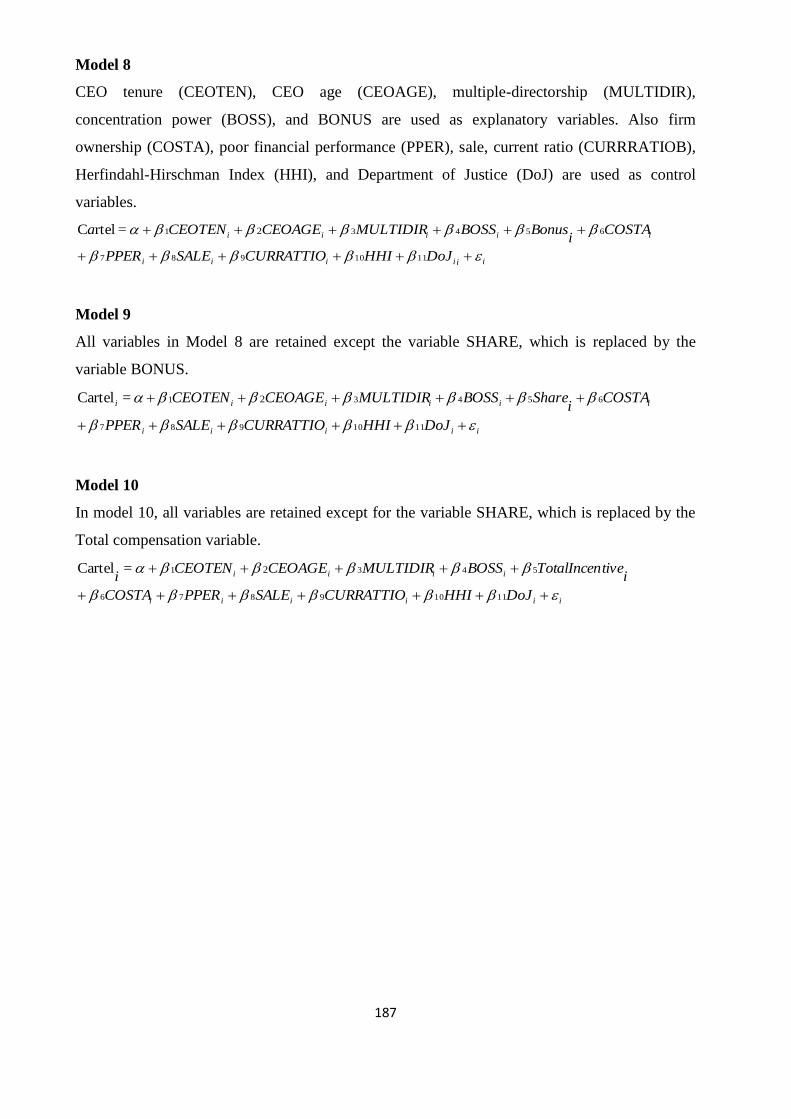
187
Model 8
CEO tenure (CEOTEN), CEO age (CEOAGE), multiple-directorship (MULTIDIR),
concentration power (BOSS), and BONUS are used as explanatory variables. Also firm
ownership (COSTA), poor financial performance (PPER), sale, current ratio (CURRRATIOB),
Herfindahl-Hirschman Index (HHI), and Department of Justice (DoJ) are used as control
variables.
iiiiii
iiiii
DoJHHICURRATTIOSALEPPER
COSTAi
BonusBOSSMULTIDIRCEOAGECEOTENa
1110987
65431 2= rtelC
Model 9
All variables in Model 8 are retained except the variable SHARE, which is replaced by the
variable BONUS.
iiiii
iiiiii
DoJHHICURRATTIOSALEPPER
COSTAi
ShareBOSSMULTIDIRCEOAGECEOTEN
1110987
65431 2= Cartel
Model 10
In model 10, all variables are retained except for the variable SHARE, which is replaced by the
Total compensation variable.
iiiiii
iiii
DoJHHICURRATTIOSALEPPERCOSTA
itiveTotalIncenBOSSMULTIDIRCEOAGECEOTEN
i
11109876
5431 2= Cartel
188
5.6 Empirical results
The results are obtained by estimating the relationship between the number of cartel formation
and discovery and corporate governance characteristics once a cartel crime has been committed.
The pairwise comparisons in Table 5.2 have already shown systematic and statistically
significant differences between UK-based cartel firms and non-cartel firms (CEO age, CEO
gender, multiple directorships, and the concentration power of the CEO). The ordered logit
models also found strong associations between cartel formation and discovery (CONV) and
board characteristics, as well as CEO characteristics, with the likelihood of cartel formation
raised or decreased by certain predictors.
5.6.1 Board Characteristics Estimation Results
The main objective of this model is to determine whether or not board characteristics affect
cartel formation. Table 5.6 below shows the results for model 1:
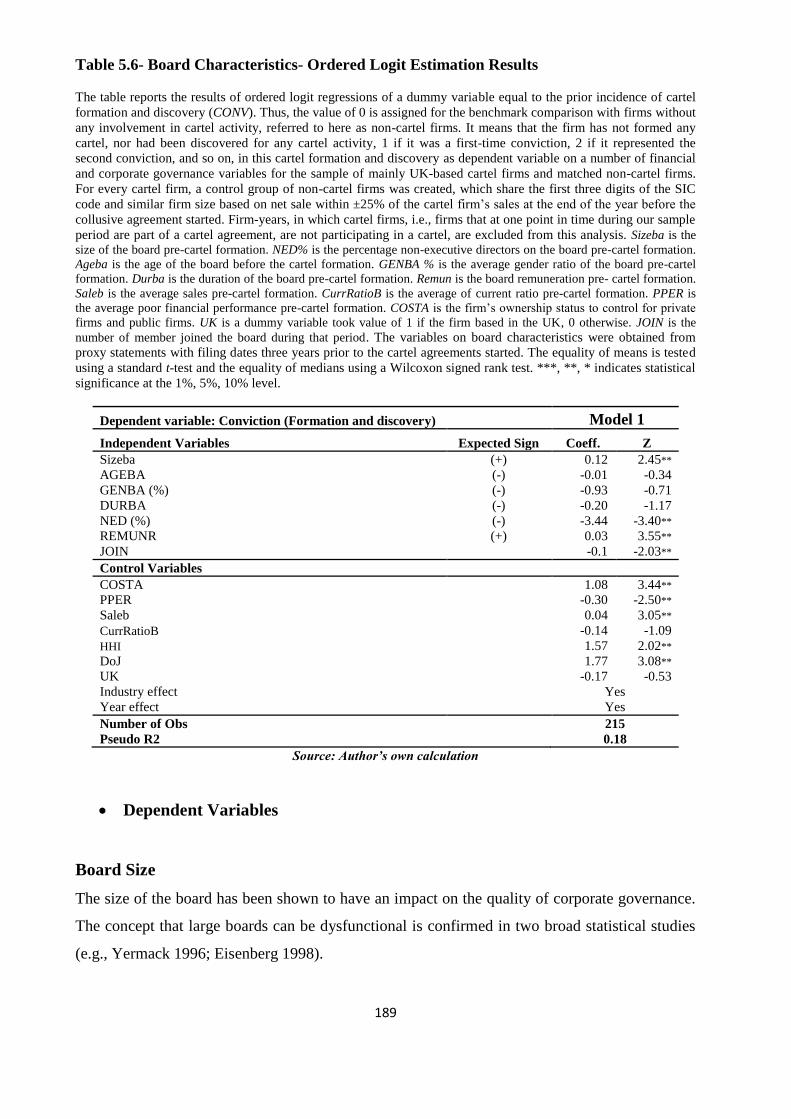
189
Table 5.6- Board Characteristics- Ordered Logit Estimation Results
The table reports the results of ordered logit regressions of a dummy variable equal to the prior incidence of cartel
formation and discovery (CONV). Thus, the value of 0 is assigned for the benchmark comparison with firms without
any involvement in cartel activity, referred to here as non-cartel firms. It means that the firm has not formed any
cartel, nor had been discovered for any cartel activity, 1 if it was a first-time conviction, 2 if it represented the
second conviction, and so on, in this cartel formation and discovery as dependent variable on a number of financial
and corporate governance variables for the sample of mainly UK-based cartel firms and matched non-cartel firms.
For every cartel firm, a control group of non-cartel firms was created, which share the first three digits of the SIC
code and similar firm size based on net sale within ±25% of the cartel firm’s sales at the end of the year before the
collusive agreement started. Firm-years, in which cartel firms, i.e., firms that at one point in time during our sample
period are part of a cartel agreement, are not participating in a cartel, are excluded from this analysis. Sizeba is the
size of the board pre-cartel formation. NED% is the percentage non-executive directors on the board pre-cartel formation.
Ageba is the age of the board before the cartel formation. GENBA % is the average gender ratio of the board pre-cartel
formation. Durba is the duration of the board pre-cartel formation. Remun is the board remuneration pre- cartel formation.
Saleb is the average sales pre-cartel formation. CurrRatioB is the average of current ratio pre-cartel formation. PPER is
the average poor financial performance pre-cartel formation. COSTA is the firm’s ownership status to control for private
firms and public firms. UK is a dummy variable took value of 1 if the firm based in the UK, 0 otherwise. JOIN is the
number of member joined the board during that period. The variables on board characteristics were obtained from
proxy statements with filing dates three years prior to the cartel agreements started. The equality of means is tested
using a standard t-test and the equality of medians using a Wilcoxon signed rank test. ***, **, * indicates statistical
significance at the 1%, 5%, 10% level.
Dependent variable: Conviction (Formation and discovery) Model 1
Independent Variables Expected Sign Coeff. Z
Sizeba (+) 0.12 2.45**
AGEBA (-) -0.01 -0.34
GENBA (%) (-) -0.93 -0.71
DURBA (-) -0.20 -1.17
NED (%) (-) -3.44 -3.40**
REMUNR (+) 0.03 3.55**
JOIN
-0.1 -2.03**
Control Variables
COSTA 1.08 3.44**
PPER -0.30 -2.50**
Saleb 0.04 3.05**
CurrRatioB -0.14 -1.09
HHI 1.57 2.02**
DoJ 1.77 3.08**
UK -0.17 -0.53
Industry effect Yes
Year effect Yes
Number of Obs 215
Pseudo R2 0.18
Source: Author’s own calculation
Dependent Variables
Board Size
The size of the board has been shown to have an impact on the quality of corporate governance.
The concept that large boards can be dysfunctional is confirmed in two broad statistical studies
(e.g., Yermack 1996; Eisenberg 1998).
190
Assessing cartel formation as evidence of a ‘dysfunctional’ board, the results are consistent with
Yermack (1996) and Eisenberg (1998). The result shows that the propensity to get in cartel
agreement is positively related to the size of the board, and this effect is examined by measuring
board size as the total number of the firm’s directors (e.g., Beasley, 1996; Yermach, 1996; Abbot
et al., 2004; Vafeas, 2000; and Coles et al., 2008).
It is also costly to manage a large board of directors in an organisation (Lipton and Lorsch, 1992;
Jensen, 1993). Large boards also tend to have disagreements and difficulty in performing
efficient roles. Gonzales and Schmid (2012) have documented that mature and large low-growth
firms tend to participate in cartel. The coefficient for SizeBA was been found to be positive and
statistically significant (β=0.12, z=2.45, p<0.05), with differences in the average size of the
board (SizeBA) between UK –based cartel firms and non-cartel firms. Therefore, P1 is accepted,
that the average size of boards is larger for cartel firms than amongst a matched sample of non-
cartel firms.
Board Independency (Non-executive directors)
Board independence is regarded as a very important element in an organisation due to the fact
that outside directors are considered the control and monitor mechanism in the firm, who can
also enhance firm performance (Duchin, et al., 2010; Fama and Jensen, 1983; Weishbach, 1988).
Being financially independent from the management, and from possibly conflicting situations,
outside directors have the ability to minimise agency problems and control managerial self-
interests (Rhodes, et al., 2000). They are able to protect the shareholder interest, as well as
supervise and manage performance in a much better way to align firm strategies for greater
performance. A large board is likely to be made up of executive directors who are not
independent (NED %). These directors are more concerned with maximising their personal
wealth rather than working for the best interest of the firm. Consequently, they become more
inclined to engaging in cartel activity that would facilitate growth in earnings and thus maximise
their personal wealth.
In addition, engaging in cartel activity can enable these NEDs to conceal some information from
shareholders, thereby increasing the probability of increasing their personal gains. For example,
cartel activity can enable directors to hide some related party transactions which may not be at
arm’s length. Consistent with the proposition that the percentage of outside (non-executive)
members on the board of directors is lower for cartel firms than for non-cartel firms P2, the
191
table shows that the coefficient for NED% is negative and statistically significant (β=-3.44, z=-
3.40, p<0.05). These results indicate that the boards of non-cartel firms have higher percentage
of non-executive directors than do the boards of UK-based cartel firms. This finding is
consistent with Fama (1980) and with Fama and Jensen (1983), who argued that higher
percentage of outsider increases the effectiveness of board oversight and monitor.
Age of the Board
Several views have been stated by researchers regarding the age of the board of directors. On
one hand, some of them state that as the board members grow older, their productivity levels
decline. On the other hand, the older board members are found to have much more experience
and a well-integrated social network to enhance the performance of the organisation.
Corporate risk-taking is influenced by board age, in which a link is indicated between older
boards and less firm risk-taking (Elsaid (2012)). The result shows that the average age of the
director on the board (AGEBA) in relation to cartel formation and discovery is negative, but
statistically not significant. Therefore, we cannot proposition P3 that the average age of board
directors for cartel firms is lower than non-cartel firms.
However, this result consistent with Wiersema and Bantel (1992), who argued that when firms
bring about various changes in their corporate strategy, it is usually seen that the top
management of the firm has a lower average age, which could mean that as age increases risk
aversion increases. Also Campbell (2001) reports a negative age impact on engaging in equity
investments. Analyzing risk perceptions of households, Bucciol and Miniaci (forthcoming)
found that risk tolerance is reduced in age and a review study by Sahm (2007) and Grable,
McGill, and Britt (2009) suggests that older individuals are less risk tolerant.
Gender Diversity of the Board
The percentage of gender diversity of the board (GENBA %) variable is negative but
statistically not significant. Therefore, we cannot accept proposition P4: That there are less
female directors on the board of cartel firms than the non-cartel firms. Yet, this result may not
be surprising, that statistical significance was lacking, given the sparse distribution of females on
cartel and non-cartel firms (5.5% on cartel boards, and 11.1% amongst non-cartel firms).
192
The result consistent with many studies conducted using different factors like experience,
attitude etc. which prove that women are less corrupt than men (e.g. Cheung and Hernandez-
Julian, 2006; Swamy, Azfar, Knack et al., 1999).
Barsky and colleagues (1997 cited in Berger et al., 2012) and Jianakoplos and Bernasek (1998
cited in Berger et al., 2012), documented that female executives tend to be more risk averse in
decision making relating to financial concerns, which support this study findings.
Board Duration
The duration of the board (DURBA) is statistically negative but insignificant. However, the
results suggest that the longer the duration of the board, the lower is the number of cartel
formation in UK-based firms, and thus the lower are the incentives to engage in cartel formation.
Therefore, we cannot accept proposition P5, that the average duration of the cartel board is less
than the non-cartel firms.
The number of board members appointed during the CEO’s regime preceding the cartel
formation, JOIN, is negative and statistically significant (β=-0.20, z=-1.17, p<0.10). The more
directors who join a board, the less likelihood that cartel formation will arise. This is consistent
with the finding that board duration, DURBA, is also negatively linked to cartel formation. This
is consistent with Vance’s (1983) claim that boards of long duration are generally interested in
achieving the goals of the organisation.
Board Remuneration
Moreover, the proposition that the board remuneration for cartel firms is higher than in non-
cartel firms - addressed in proposition P6 is confirmed in the results. The coefficient for variable
remuneration (Remun) is positive and statistically significant (β=0.03, z=3.55, p<0.05). These
results indicate that the board of UK-based firms who are convicted in cartel formation have
higher board compensation levels than non-cartel firms. This finding is consistent with research
developing different theoretical models all linking incentives and fraud, which find positive
relations between board compensation and fraud (Bar-Gill and Bebchuk, 2003a and 2003b;
Goldman and Slezak, 2003; Chesney and Gibson-Asner, 2004; Robison and Santore, 2011).
193
Control Variables
Firm Ownership Status
The current status of the firm (COSTA) has a positive impact on the number of incidences of
cartel formation and discovery (β=1.08, z=3.44, p<0.05). Recall that this variable takes on the
value of 1 if the firm is publicly-traded and the value of 0 if it is privately-owned and controlled.
The positive coefficient suggests that UK-based public firms are more likely to form cartel than
UK-based private firms. The results also show that the impact of the firm ownership (COSTA)
is quite definite as one can fully reject the null hypothesis that the coefficient is not significantly
different from zero.
Firm Sale
The average sale for the 3-year period pre-cartel formation (SALEBA) has a positive and
significant coefficient (β=0.04, z=3.05, p<0.05). This suggests that UK-based firms with higher
average sale are more likely to engage in cartel formation. This result is support the earlier
finding that UK-based public firms are more likely to form cartel (COSTA), since public firms
are larger thus their sales is expected to be higher. This result indicates that the higher the
previous three years average sale, the more likely that the firm will involve in cartel formation.
Poor Financial Performance
The poor performance of a firm (PPER) has also a negative and significant coefficient (β=-0.30,
z=-2.50, p<0.05). This result is in contrast with that of DeAngelo and DeAngelo (1990)
DeAngelo et al. (1994), and Beasley and Hermanson et al. (2006). Their results suggest a
positive and significant relationship between poor performance and firm fraud, but since firms
collude together not only to maximise profits but also to maintain their price, this result suggests
that the UK-based cartel firms are more likely to have a good financial performance, which also
supports our previous results that more UK-based public firms are likely to collude than private
firms.
Herfindahl-Hirschman Index
The Herfindahl-Hirschman Index (HHI) has a significant and positive coefficient (β=1.77, z=
2.02, p<0.05). This result indicates that the null hypothesis that the coefficient is not
significantly different from 0 can be rejected. This finding is unsurprising since high market
concentrations, measured by the Herfindahl-Hirschman Index, indicate an industry that is
194
dominated by few, oligopolistic firms. Such firms can more easily engage in cartel activity such
as price fixing, and create artificial supply shortages, since problems of cartel co-ordination are
much reduced.
Current Ratio
The average current ratio (CURRRATIOB) has a negative coefficient but statistically not
significant. This finding shows that as the current ratio increases, the incentive to form a cartel
reduces, and vice versa. The results are consistent with how financially constrained or distressed
firms (with higher debt ratios) are more likely to engage in cartel activity so as to stabilise or
even improve their performance.
Legal Environment
Chapter two discussed previously that the U.S Department of Justice (DoJ) is the first to impose
fines and prison sentences on individuals involved in cartel agreements. Therefore, in order to
control for the legal environment, we added the variable (DoJ). This variable describes the
jurisdictional zone where the conviction case was set (cartel formation and discovery). The
variable took a value of 1 when the firm is found to have committed a cartel criminal
infringement by the DoJ, and 0 if otherwise. The commission of a cartel criminal infringement is
essentially cartel formation and discovery, which is the dependent variable. As can be observed
there is a strong positive relationship between the number of incidences of cartel formation and
discovery (CONV) and the number of UK-based firms convicted by the DoJ. This implies that
the higher the number of UK-based cartel firms, the higher the number of cartel convictions by
the DoJ, and vice versa.
5.6.2 Ownership Structure Estimation Results
The main objective of this model is to determine whether or not ownership structure of the firms
influences cartel formation. The identity of the large shareholders (family firms in this section)
determines the kind of ownership concentration within a firm. The large shareholders also
establish the relationship between the performance of the firm and the type of ownership. The
concentration of ownership in this thesis is divided into two owner groups to allow for its
evaluation: the stock owns by outside directors and family-owned and controlled firms. Table
5.7 below shows the results for model 2:
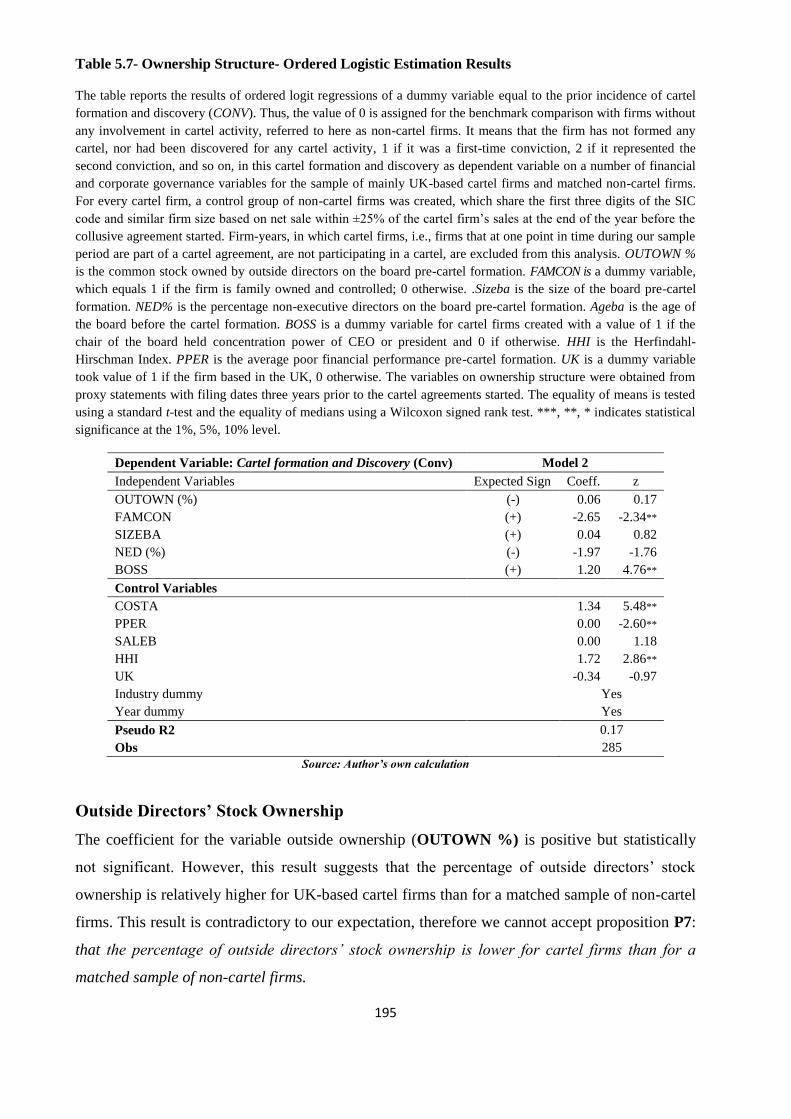
195
Table 5.7- Ownership Structure- Ordered Logistic Estimation Results
The table reports the results of ordered logit regressions of a dummy variable equal to the prior incidence of cartel
formation and discovery (CONV). Thus, the value of 0 is assigned for the benchmark comparison with firms without
any involvement in cartel activity, referred to here as non-cartel firms. It means that the firm has not formed any
cartel, nor had been discovered for any cartel activity, 1 if it was a first-time conviction, 2 if it represented the
second conviction, and so on, in this cartel formation and discovery as dependent variable on a number of financial
and corporate governance variables for the sample of mainly UK-based cartel firms and matched non-cartel firms.
For every cartel firm, a control group of non-cartel firms was created, which share the first three digits of the SIC
code and similar firm size based on net sale within ±25% of the cartel firm’s sales at the end of the year before the
collusive agreement started. Firm-years, in which cartel firms, i.e., firms that at one point in time during our sample
period are part of a cartel agreement, are not participating in a cartel, are excluded from this analysis. OUTOWN %
is the common stock owned by outside directors on the board pre-cartel formation. FAMCON is a dummy variable,
which equals 1 if the firm is family owned and controlled; 0 otherwise. .Sizeba is the size of the board pre-cartel
formation. NED% is the percentage non-executive directors on the board pre-cartel formation. Ageba is the age of
the board before the cartel formation. BOSS is a dummy variable for cartel firms created with a value of 1 if the
chair of the board held concentration power of CEO or president and 0 if otherwise. HHI is the Herfindahl-
Hirschman Index. PPER is the average poor financial performance pre-cartel formation. UK is a dummy variable
took value of 1 if the firm based in the UK, 0 otherwise. The variables on ownership structure were obtained from
proxy statements with filing dates three years prior to the cartel agreements started. The equality of means is tested
using a standard t-test and the equality of medians using a Wilcoxon signed rank test. ***, **, * indicates statistical
significance at the 1%, 5%, 10% level.
Dependent Variable: Cartel formation and Discovery (Conv) Model 2
Independent Variables Expected Sign Coeff. z
OUTOWN (%) (-) 0.06 0.17
FAMCON (+) -2.65 -2.34**
SIZEBA (+) 0.04 0.82
NED (%) (-) -1.97 -1.76
BOSS (+) 1.20 4.76**
Control Variables
COSTA 1.34 5.48**
PPER 0.00 -2.60**
SALEB 0.00 1.18
HHI 1.72 2.86**
UK -0.34 -0.97
Industry dummy Yes
Year dummy Yes
Pseudo R2 0.17
Obs 285
Source: Author’s own calculation
Outside Directors’ Stock Ownership
The coefficient for the variable outside ownership (OUTOWN %) is positive but statistically
not significant. However, this result suggests that the percentage of outside directors’ stock
ownership is relatively higher for UK-based cartel firms than for a matched sample of non-cartel
firms. This result is contradictory to our expectation, therefore we cannot accept proposition P7:
that the percentage of outside directors’ stock ownership is lower for cartel firms than for a
matched sample of non-cartel firms.
196
Family-Owned and Controlled Firms
The formation of a cartel is significantly and negatively influenced by the family as the results
given in Table 5.7 signify. The claim that family owners create enhanced governance and
supervisory systems has been affirmed through this result. The agency problem between
managers and owners can be lessened through family control which is why significant and
negative effects of family shareholdings are obtained (Fama and Jensen, 1983). The large
shareholders are better able to monitor the management compared to small shareholders. This is
because large shareholders internalise larger aspects of the monitoring costs and possess
sufficient voting power in corporate decisions. Small shareholders, on the other hand, are only
able to influence corporate decision making at a minimum basis. Because small shareholders
have little influence on decision making, the managers then hold the control of the firm, who
possess both the opportunities and incentive of misusing their position. It is therefore concluded
that corporate performance would be adversely affected by the ownership-control separation
(Laiho, 2011; Hamdani and Yafeh, 2010; Leech, 2001).
In addition Laiho (2011) states that a more effective monitoring takes place through a more
concentrated ownership in the form of large shareholders. Effective monitoring has two
significant obstacles that may be solved by large shareholders: staying informed to enable
reaping sufficient benefits towards exceeding the costs of obtaining the needed information; and
possessing an adequately large share of the votes in order to influence corporate outcomes (even
in circumstances of minority holding). Small shareholders, on the other hand, have difficulty
carrying this out collectively as they are only able to internalise a small aspect of the potential
gains and endure free-rider problems. An agency problem identified here is therefore the
incentive of large shareholders to gain private benefits at the detriment of the small shareholders
(Laiho, 2011; Kaisanlahti, 2002; Bebchuck, 1999).
Therefore, we cannot accept the proposition P8: that cartel likely to be formed by family-owned
and controlled firms (large shareholders).
197
CEO Concentration Power
The coefficient for the concentration power variable (BOSS) was found to be positive and
statistically different from zero in estimating its influence on cartel formation (CONV).This
positive figure shows that concentration power increases incentives to form cartel. Therefore, we
reject the null hypothesis that the coefficient is not significantly different from zero at the 5%
level of significance. This is consistent with prior studies, which discuss the case of fraud in
general (Loebbecke et al., 1989; Jensen, 1993). Hence P13: is accepted, that firms committing
cartel are more likely to have CEOs who also have a dual role serving as board chairs.
5.6.3 CEO Characteristics Estimation Results
The main objective of this model is to determine whether or not CEO characteristics affect cartel
formation. Table 5.8 below shows the results for model 3, 4, 5 and 6:
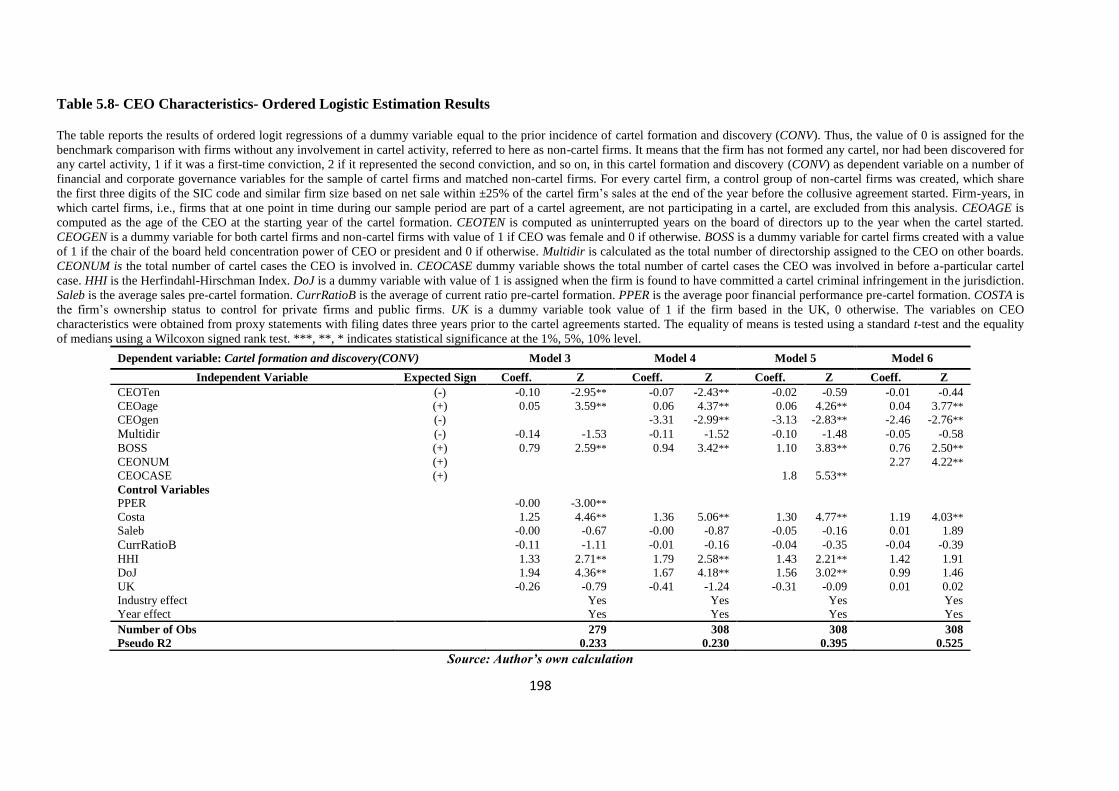
198
Table 5.8- CEO Characteristics- Ordered Logistic Estimation Results
The table reports the results of ordered logit regressions of a dummy variable equal to the prior incidence of cartel formation and discovery (CONV). Thus, the value of 0 is assigned for the
benchmark comparison with firms without any involvement in cartel activity, referred to here as non-cartel firms. It means that the firm has not formed any cartel, nor had been discovered for
any cartel activity, 1 if it was a first-time conviction, 2 if it represented the second conviction, and so on, in this cartel formation and discovery (CONV) as dependent variable on a number of
financial and corporate governance variables for the sample of cartel firms and matched non-cartel firms. For every cartel firm, a control group of non-cartel firms was created, which share
the first three digits of the SIC code and similar firm size based on net sale within ±25% of the cartel firm’s sales at the end of the year before the collusive agreement started. Firm-years, in
which cartel firms, i.e., firms that at one point in time during our sample period are part of a cartel agreement, are not participating in a cartel, are excluded from this analysis. CEOAGE is
computed as the age of the CEO at the starting year of the cartel formation. CEOTEN is computed as uninterrupted years on the board of directors up to the year when the cartel started.
CEOGEN is a dummy variable for both cartel firms and non-cartel firms with value of 1 if CEO was female and 0 if otherwise. BOSS is a dummy variable for cartel firms created with a value
of 1 if the chair of the board held concentration power of CEO or president and 0 if otherwise. Multidir is calculated as the total number of directorship assigned to the CEO on other boards.
CEONUM is the total number of cartel cases the CEO is involved in. CEOCASE dummy variable shows the total number of cartel cases the CEO was involved in before a-particular cartel
case. HHI is the Herfindahl-Hirschman Index. DoJ is a dummy variable with value of 1 is assigned when the firm is found to have committed a cartel criminal infringement in the jurisdiction.
Saleb is the average sales pre-cartel formation. CurrRatioB is the average of current ratio pre-cartel formation. PPER is the average poor financial performance pre-cartel formation. COSTA is
the firm’s ownership status to control for private firms and public firms. UK is a dummy variable took value of 1 if the firm based in the UK, 0 otherwise. The variables on CEO
characteristics were obtained from proxy statements with filing dates three years prior to the cartel agreements started. The equality of means is tested using a standard t-test and the equality
of medians using a Wilcoxon signed rank test. ***, **, * indicates statistical significance at the 1%, 5%, 10% level.
Dependent variable: Cartel formation and discovery(CONV) Model 3 Model 4 Model 5 Model 6
Independent Variable Expected Sign Coeff. Z Coeff. Z Coeff. Z Coeff. Z
CEOTen (-) -0.10 -2.95** -0.07 -2.43** -0.02 -0.59 -0.01 -0.44
CEOage (+) 0.05 3.59** 0.06 4.37** 0.06 4.26** 0.04 3.77**
CEOgen (-) -3.31 -2.99** -3.13 -2.83** -2.46 -2.76**
Multidir (-) -0.14 -1.53 -0.11 -1.52 -0.10 -1.48 -0.05 -0.58
BOSS (+) 0.79 2.59** 0.94 3.42** 1.10 3.83** 0.76 2.50**
CEONUM (+) 2.27 4.22**
CEOCASE (+) 1.8 5.53**
Control Variables
PPER -0.00 -3.00**
Costa 1.25 4.46** 1.36 5.06** 1.30 4.77** 1.19 4.03**
Saleb -0.00 -0.67 -0.00 -0.87 -0.05 -0.16 0.01 1.89
CurrRatioB -0.11 -1.11 -0.01 -0.16 -0.04 -0.35 -0.04 -0.39
HHI 1.33 2.71** 1.79 2.58** 1.43 2.21** 1.42 1.91
DoJ 1.94 4.36** 1.67 4.18** 1.56 3.02** 0.99 1.46
UK -0.26 -0.79 -0.41 -1.24 -0.31 -0.09 0.01 0.02
Industry effect Yes Yes Yes Yes
Year effect Yes Yes Yes Yes
Number of Obs 279 308 308 308
Pseudo R2 0.233 0.230 0.395 0.525
Source: Author’s own calculation
199
CEO Tenure
The multivariate test results emphasize the univariate comparisons that were presented in Table
5.2. The ordered logit model shows that the CEO tenure coefficient, CEOTEN used in models 3
and 4 is negative and significantly different from zero in estimating cartel formation and
discovery (CONV), given other predictor variables in all models (β=-0.10, z=-2.95, -2.43,
p<0.05). The results confirm the earlier pairwise univariate comparison between UK-based
cartel firms and non-cartel firms. This finding is in consistent with P10; the results indicate that
the number of years the CEO has served as director for cartel firms is actually less than for non-
cartel firms. It gives light to the assumption about whether CEO tenure, along with overlap of
CEO and board chair roles (BOSS), help carry out the monitoring process of corruption
activities for cartel firms (Mace 1986; Patton and Baker 1987; Vancil 1987).
Hence, the result is in contrast with some studies investigating CEO tenure and firm fraud.
Loebbecke et al.’s (1989) study found a positive relationship between the two variables, but the
fraud was often very specifically in connection with ‘income smoothing’ behaviour after a
pronounced growth period which is then followed by much poorer financial performance in a
subsequent downturn. Longer serving CEOs wished to smooth income, and likely had the depth
of knowledge and intra-firm connections to make this form of fraud more plausible and likely.
The controls used in this study in fact minimise the role of poor financial performance as a
predictor for cartel activity. Even if many aspects are similar, a direct comparison between the
studies is not altogether appropriate for every variable.
The finding is however in line with researchers who conducted another logit analysis between
fraud and non-fraud firms, using CEO tenure as an independent variable (Beasley, 1996). The
basis of Beasley’s study is much closer to the study conducted here, and in fact Beasley’s study
used similar variables CEO tenure (CEOTen) and overlap of the CEO and board chair roles
(BOSS) in the logit analysis. The variable BOSS was also found to be positively correlated with
the likelihood of financial fraud misstatements. The finding also agrees with how long-tenured
CEOs are less likely to have appropriate strategies (Wiersema and Bantel, 1992). This is of
interest if cartel activity is accepted as a measure of a lack of strategic change ability, i.e. opting
for the status quo amongst cartel firms. The results are also consistent with evidence suggesting
that firms are more likely to be involved in cartel crime when CEO tenure is low, or
equivalently, when CEO turnover is high (Han, 2010). Hence, it is possible to say that this
200
research extends previous research on fraudulent financial misstatements and board composition,
and finds comparable results for how board composition and CEO tenure are likely to affect the
probability of cartel formation and discovery.
Therefore, P10 is accepted: the number of years a CEO had served as a director for a cartel firm
is less than that for non-cartel firms. If CEO entrenchment has in fact been found to have
various negative consequences, especially in terms of excess remuneration and the stacking of
outside directorships (Vafeas 2003), one benefit is to make cartel formation relatively less likely.
The effect is not, however, large. Based on the figures above, the null hypothesis that the
coefficient is not significantly different from zero can be rejected at 5% level of significance.
The effect is not large in quantity but still has a strong signature in the data.
CEO Age
Consistent with expectations, the results of all the models show a positive and significant
relationship between CEO age (CEOAGE) and the likelihood of cartel formation in UK-based
firms (β=0.05, z=3.62, p<0.05). The parameter is significant at 5% level of significance,
suggesting that the null hypothesis that the factor loading on CEO age is not significantly
different from zero can be rejected. The evidence suggests that the older the CEO, the higher is
the incentive to engage in cartel formation. Firms engaging in strategic change often have top
management teams (defined to include the CEO as well as second executive levels)
characterised by a lower average age (Han, 2010). Older executive teams (on average in the first
and sector tier management hierarchy), are in their study more conservative in terms of strategy
development.
Older CEOs are likely to be more conservative and this has a positive impact on firm
performance, but also less likelihood of fraud (and increased CEO tenure means less fraud)
(Stevens et al., 1978). However, fraud happens amongst single firms – it is a singular activity by
one firm. Cartel formation on the other hand has different and more social dynamics. Older
CEOs may have strong established social networks that enable the communication necessary to
cartel formation. Older CEOs may have worked for many organisations and established a
number of strong networks. As a result, engaging in collusion with other firms will be less
difficult (Beasley, 1996). Older CEOs established in certain industries can also understand how
those market structures perhaps make the formation of a cartel agreement a ‘rational decision’.
201
On average, the probability that a CEO will leave the firm falls up to the age of 52 but begins to
rise beyond that. CEO turnover therefore does increase with age. However, those CEOs that
approach retirement age but whose firm has a superior corporate performance are less likely to
leave the firm, than those that have nearly reached retirement age and whose firms are
performing poorly. The latter are more likely to retire early, and thus increase CEO turnover and
lower CEO tenure. Older CEOs may use the shorter career time remaining to at least ensure
maintaining their personal benefits. Engaging in cartel activity could be seen as a means of
retaining and insuring continued levels of expected remuneration (and status) before eventually
retiring and leaving the firm (Bebchuck and Grinstein, 2005).
On the contrary, younger CEOs should expect in comparison to have a longer tenure with the
firm. Younger CEOs in the early stages of corporate careers are yet to establish strong networks,
and may not wish to suffer the reputational consequences of discovered cartel activity so early in
their careers. Consequently engaging in cartel activity may be more difficult and higher risk for
younger CEOs, and so less expected of younger CEOs in the organisational culture. Younger
CEOs may therefore be more interested in maintaining a good reputation by maximising
shareholder wealth through competitive means and building competitive advantage. In addition
then, younger CEOs have a longer time in their career path and thus would be more interested in
protecting their long-term careers from reputational damage.
Therefore P9 as well as P10 are accepted: the age of the CEO for cartel firms is higher than for
non-cartel firms, but that CEO tenure has a reverse effect. One possible implication would be to
combine the two propositions, that an older CEO with a shorter expected tenure may well use
wide corporate social network connections, perhaps pressured by poorer corporate performance
and the avoidance of forced early retirement, to resort to cartel formation as a pseudo-strategic
response to market conditions. However, the relationship between CEO tenure and CEO age is
difficult to model but generally, the risk of termination does increase for thirteen years, to only
then decrease (Brookman and Thistle, 2009). Brookman and Thistle (2009) concluded that
corporate governance does function as reasonably expected, and that CEO age, tenure,
retirement and corporate performance do act in tandem, as described above.
CEO Gender
Several studies suggest that compared with men, women are less likely to participate in corrupt
practices (Cheung and Hernandez-Julian, 1999; Swamy et al., 1999). Byrnes, et al., (1999)
202
observed that in different activities men were more willing to take risk than women. Sundén and
Surette (1998) and Bernasek and Shwiff (2001), documented that women are considerably more
risk averse than men. In a study on betting behaviour of men and women by Bruce and Johnson
(1994) and Johnson and Powell (1994), it was observed that women show a lesser inclination
towards risk-taking than men.
Consistent with this previous research, the results here show a very significant negative
coefficient for CEOGEN in Model 4, 5 and 6 (β=0.94, z=3.28, p<0.05). This shows that the
CEO gender of the UK-based cartel firms has a very significant negative impact on the number
of convictions on cartel formation. In fact, the impact of CEO gender was the highest value
coefficient discovered in any of the regression models. Therefore, we accept P11: that there are
less female CEOs represented in cartel firms, compared with non-cartel firms.
Multiple-Directorship
In all previous models the coefficient for multiple directorships; Multidir is found to be negative
but statistically not significant. Therefore, we cannot accept the proposition P12: that board of
directors of cartel firms are less likely to have directors who work on other boards, compared
with boards of directors of non-cartel firms. However, the results suggest that the number of
cartel formation and discovery in UK-based firms reduces as multiple directorship increases.
These results are consistent with prior research where illicit activity is being modelled alongside
corporate governance variables (Gilson, 1990; Kaplan and Reishus, 1990; Brickley et al., 1999;
Shivdasani, 1993; Ferris et al., 2003). The results of these authors show that boards of directors
of firms committing fraud are less likely to have directors who work on other boards, compared
with boards of directors amongst non-fraud firms. Although multiple directorships as a variable
appear to reduce the formation of cartel as evidenced by its negative impact on the number of
convictions for cartel formation, its impact appears to be only a minimal one.
CEO Concentration Power
The coefficient for the concentration power variable (BOSS) was found to be positive and
statistically different from zero in estimating its influence on cartel formation and discovery
(CONV), given other predictor variables in all models (β=0.83, z=2.80, p<0.05). This positive
figure shows that concentration power increases incentives to commit cartel crime given that the
number of cartel formation and discovery increases with an increase in power concentration.
Therefore, we reject the null hypothesis that the coefficient is not significantly different from
203
zero at the 5% level of significance. This is consistent with prior studies, which discuss the case
of fraud in general (Loebbecke et al., 1989; Jensen, 1993). Hence P13 is accepted, that firms
committing cartel are more likely to have CEOs who also have a dual role serving as board
chairs.
Both CEOCASE and CEONUM variables are significant for how they both made very
noteworthy contributions to explaining the variability in the data. For all models without the
inclusion of the number of cartel cases or cases of misconduct, the pseudo-R2 is under 0.3.
Although the value of pseudo-R2 is not to be compared with R
2 in ordinary logistical regression,
the values of pseudo-R2 do have a comparative value used in the same data set for comparing the
effects of individual variables on data variance. Hence, only by including CEO cases and CEO
misconduct cases, on the part of the CEO, does the pseudo-R2 value reach towards or exceed
0.5, and in fact, the number of cases of CEO misconduct shows more ability to describe variance
than cartel cases. This is to be expected when generally the number of misconduct cases will be
greater than the number of cartel cases – the average number of CEO misconduct cases was in
fact 1.75, and for CEO cartel involvement, 0.82.
Firm Sale
Surprisingly however, the average sales of firms three years pre-cartel (SALEBA) has an
opposite sign to previous models. The SALEBA coefficient is negative but statistically
insignificant. The robust standard error of the parameter is 0.008 and the p-value is 0.00. The
negative coefficient suggests that the lower the average sales figure three years prior to the cartel
formation, the higher the incentive to engage in cartel activity. These findings suggest that UK-
based firms with healthy sales and income flow would find it less relevant to engage in collusive
behaviour, such as price fixing and other cartel activities. However, although sale as a control
variable appears to have a negative impact on the number of convictions for cartel crime, its
impact appears to be negligible.
5.6.4 Board Characteristics, Ownership Structure and CEO Characteristics
Estimation Results
The results for all the above models are used for board and CEO characteristics separately, and
to have a more realistic setting, model 7 includes both board and CEO characteristics jointly.
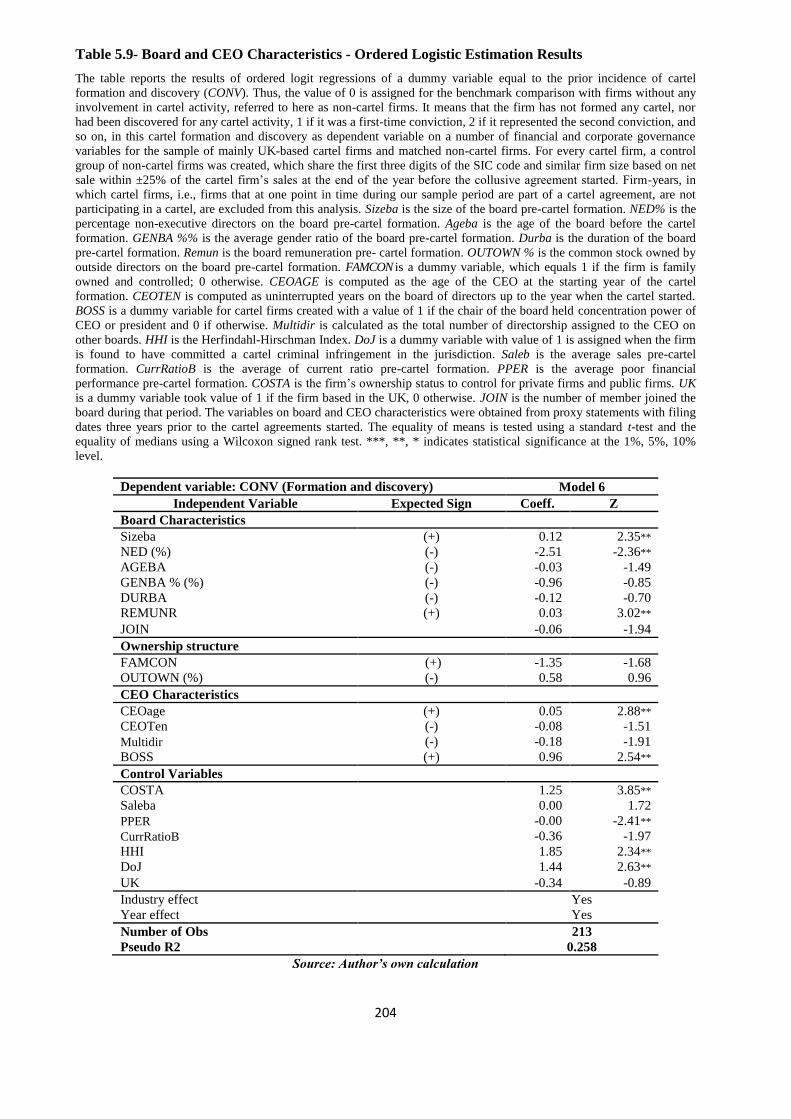
204
Table 5.9- Board and CEO Characteristics - Ordered Logistic Estimation Results
The table reports the results of ordered logit regressions of a dummy variable equal to the prior incidence of cartel
formation and discovery (CONV). Thus, the value of 0 is assigned for the benchmark comparison with firms without any
involvement in cartel activity, referred to here as non-cartel firms. It means that the firm has not formed any cartel, nor
had been discovered for any cartel activity, 1 if it was a first-time conviction, 2 if it represented the second conviction, and
so on, in this cartel formation and discovery as dependent variable on a number of financial and corporate governance
variables for the sample of mainly UK-based cartel firms and matched non-cartel firms. For every cartel firm, a control
group of non-cartel firms was created, which share the first three digits of the SIC code and similar firm size based on net
sale within ±25% of the cartel firm’s sales at the end of the year before the collusive agreement started. Firm-years, in
which cartel firms, i.e., firms that at one point in time during our sample period are part of a cartel agreement, are not
participating in a cartel, are excluded from this analysis. Sizeba is the size of the board pre-cartel formation. NED% is the
percentage non-executive directors on the board pre-cartel formation. Ageba is the age of the board before the cartel
formation. GENBA %% is the average gender ratio of the board pre-cartel formation. Durba is the duration of the board
pre-cartel formation. Remun is the board remuneration pre- cartel formation. OUTOWN % is the common stock owned by
outside directors on the board pre-cartel formation. FAMCON is a dummy variable, which equals 1 if the firm is family
owned and controlled; 0 otherwise. CEOAGE is computed as the age of the CEO at the starting year of the cartel
formation. CEOTEN is computed as uninterrupted years on the board of directors up to the year when the cartel started.
BOSS is a dummy variable for cartel firms created with a value of 1 if the chair of the board held concentration power of
CEO or president and 0 if otherwise. Multidir is calculated as the total number of directorship assigned to the CEO on
other boards. HHI is the Herfindahl-Hirschman Index. DoJ is a dummy variable with value of 1 is assigned when the firm
is found to have committed a cartel criminal infringement in the jurisdiction. Saleb is the average sales pre-cartel
formation. CurrRatioB is the average of current ratio pre-cartel formation. PPER is the average poor financial
performance pre-cartel formation. COSTA is the firm’s ownership status to control for private firms and public firms. UK
is a dummy variable took value of 1 if the firm based in the UK, 0 otherwise. JOIN is the number of member joined the
board during that period. The variables on board and CEO characteristics were obtained from proxy statements with filing
dates three years prior to the cartel agreements started. The equality of means is tested using a standard t-test and the
equality of medians using a Wilcoxon signed rank test. ***, **, * indicates statistical significance at the 1%, 5%, 10%
level.
Dependent variable: CONV (Formation and discovery) Model 6
Independent Variable Expected Sign Coeff. Z
Board Characteristics
Sizeba (+) 0.12 2.35**
NED (%) (-) -2.51 -2.36**
AGEBA (-) -0.03 -1.49
GENBA % (%) (-) -0.96 -0.85
DURBA (-) -0.12 -0.70
REMUNR (+) 0.03 3.02**
JOIN -0.06 -1.94
Ownership structure
FAMCON (+) -1.35 -1.68
OUTOWN (%) (-) 0.58 0.96
CEO Characteristics
CEOage (+) 0.05 2.88**
CEOTen (-) -0.08 -1.51
Multidir (-) -0.18 -1.91
BOSS (+) 0.96 2.54**
Control Variables
COSTA 1.25 3.85**
Saleba 0.00 1.72
PPER
-0.00 -2.41**
CurrRatioB -0.36 -1.97
HHI 1.85 2.34**
DoJ 1.44 2.63**
UK -0.34 -0.89
Industry effect Yes
Year effect Yes
Number of Obs 213
Pseudo R2 0.258
Source: Author’s own calculation
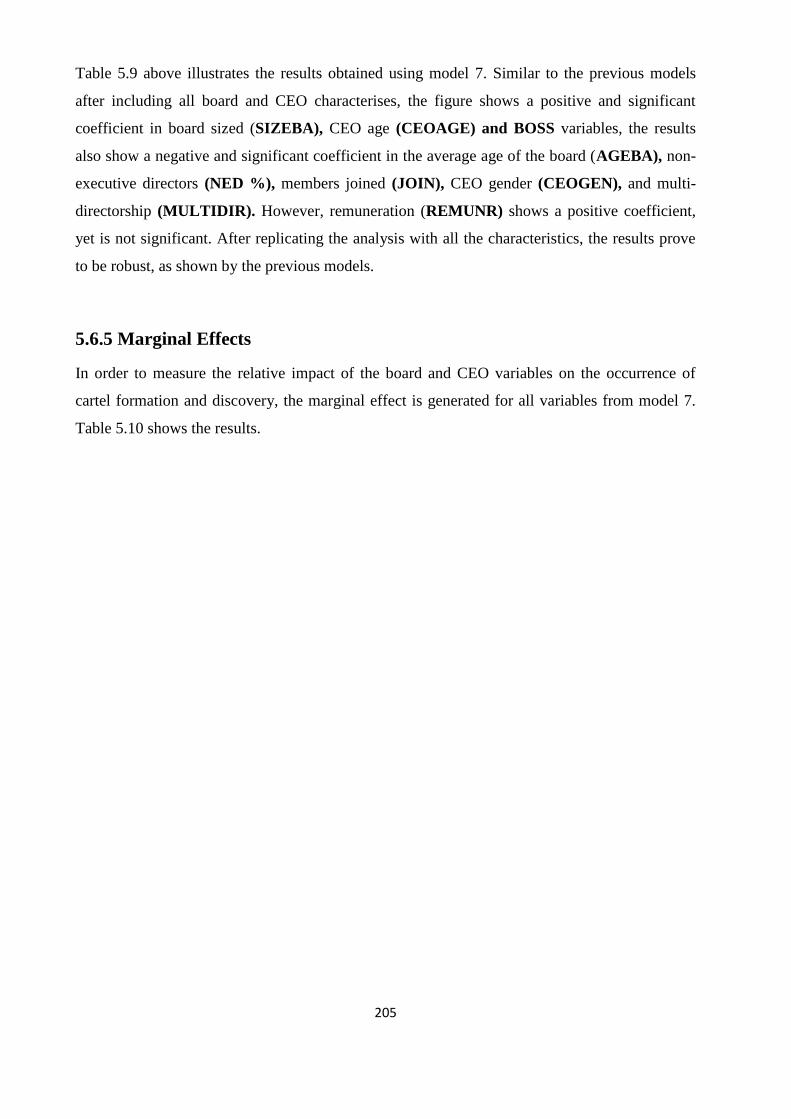
205
Table 5.9 above illustrates the results obtained using model 7. Similar to the previous models
after including all board and CEO characterises, the figure shows a positive and significant
coefficient in board sized (SIZEBA), CEO age (CEOAGE) and BOSS variables, the results
also show a negative and significant coefficient in the average age of the board (AGEBA), non-
executive directors (NED %), members joined (JOIN), CEO gender (CEOGEN), and multi-
directorship (MULTIDIR). However, remuneration (REMUNR) shows a positive coefficient,
yet is not significant. After replicating the analysis with all the characteristics, the results prove
to be robust, as shown by the previous models.
5.6.5 Marginal Effects
In order to measure the relative impact of the board and CEO variables on the occurrence of
cartel formation and discovery, the marginal effect is generated for all variables from model 7.
Table 5.10 shows the results.
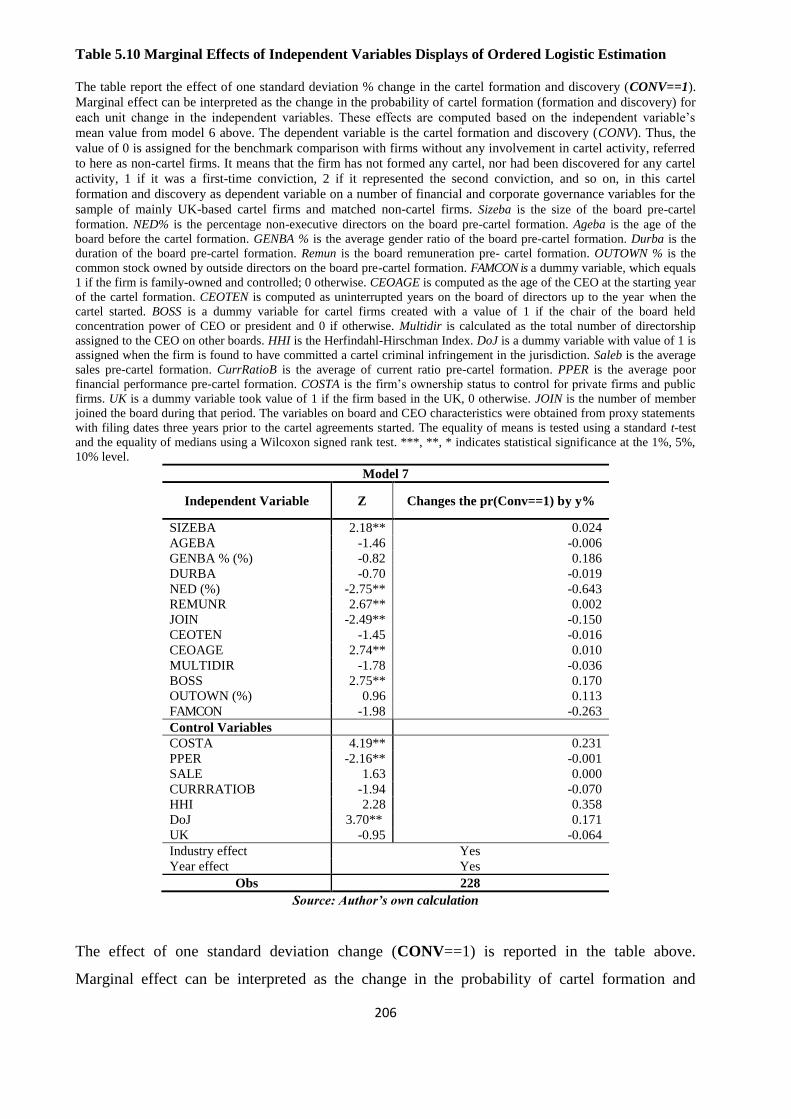
206
Table 5.10 Marginal Effects of Independent Variables Displays of Ordered Logistic Estimation
The table report the effect of one standard deviation % change in the cartel formation and discovery (CONV==1).
Marginal effect can be interpreted as the change in the probability of cartel formation (formation and discovery) for
each unit change in the independent variables. These effects are computed based on the independent variable’s
mean value from model 6 above. The dependent variable is the cartel formation and discovery (CONV). Thus, the
value of 0 is assigned for the benchmark comparison with firms without any involvement in cartel activity, referred
to here as non-cartel firms. It means that the firm has not formed any cartel, nor had been discovered for any cartel
activity, 1 if it was a first-time conviction, 2 if it represented the second conviction, and so on, in this cartel
formation and discovery as dependent variable on a number of financial and corporate governance variables for the
sample of mainly UK-based cartel firms and matched non-cartel firms. Sizeba is the size of the board pre-cartel
formation. NED% is the percentage non-executive directors on the board pre-cartel formation. Ageba is the age of the
board before the cartel formation. GENBA % is the average gender ratio of the board pre-cartel formation. Durba is the
duration of the board pre-cartel formation. Remun is the board remuneration pre- cartel formation. OUTOWN % is the
common stock owned by outside directors on the board pre-cartel formation. FAMCON is a dummy variable, which equals
1 if the firm is family-owned and controlled; 0 otherwise. CEOAGE is computed as the age of the CEO at the starting year
of the cartel formation. CEOTEN is computed as uninterrupted years on the board of directors up to the year when the
cartel started. BOSS is a dummy variable for cartel firms created with a value of 1 if the chair of the board held
concentration power of CEO or president and 0 if otherwise. Multidir is calculated as the total number of directorship
assigned to the CEO on other boards. HHI is the Herfindahl-Hirschman Index. DoJ is a dummy variable with value of 1 is
assigned when the firm is found to have committed a cartel criminal infringement in the jurisdiction. Saleb is the average
sales pre-cartel formation. CurrRatioB is the average of current ratio pre-cartel formation. PPER is the average poor
financial performance pre-cartel formation. COSTA is the firm’s ownership status to control for private firms and public
firms. UK is a dummy variable took value of 1 if the firm based in the UK, 0 otherwise. JOIN is the number of member
joined the board during that period. The variables on board and CEO characteristics were obtained from proxy statements
with filing dates three years prior to the cartel agreements started. The equality of means is tested using a standard t-test
and the equality of medians using a Wilcoxon signed rank test. ***, **, * indicates statistical significance at the 1%, 5%,
10% level.
Model 7
Independent Variable Z Changes the pr(Conv==1) by y%
SIZEBA 2.18** 0.024
AGEBA -1.46 -0.006
GENBA % (%) -0.82 0.186
DURBA -0.70 -0.019
NED (%) -2.75** -0.643
REMUNR 2.67** 0.002
JOIN -2.49** -0.150
CEOTEN -1.45 -0.016
CEOAGE 2.74** 0.010
MULTIDIR -1.78 -0.036
BOSS 2.75** 0.170
OUTOWN (%) 0.96 0.113
FAMCON -1.98 -0.263
Control Variables
COSTA 4.19** 0.231
PPER -2.16** -0.001
SALE 1.63 0.000
CURRRATIOB -1.94 -0.070
HHI 2.28 0.358
DoJ 3.70** 0.171
UK -0.95 -0.064
Industry effect Yes
Year effect Yes
Obs 228
Source: Author’s own calculation
The effect of one standard deviation change (CONV==1) is reported in the table above.
Marginal effect can be interpreted as the change in the probability of cartel formation and
207
discovery for each unit change in the independent variables. These effects are computed based
on the independent variable’s mean value.
Model (7) shows that one unites change in the board size (Sizeba) leads to an increase in the
probability of cartel formation by 2.4%. The percentage of non- executive director (NED %) has
the largest marginal effect; where one unites increase in non- executive director (NED %) lead
to a -64.3% decrease in the probability of cartel formation. Besides, one unites increase in the
percentage of board remuneration (Remun) leads to a 0.2% increase in the probability of cartel
formation. Moreover, one unites increase in (JOIN) the number of member joined the board lead
to a -15% decrease in the probability of cartel formation.
Furthermore, the CEO concentration power (BOSS) variable result shows that a one unit
increase in BOSS leads to a 17% increase in the probability of cartel formation. The CEO
gender (CEOage) in addition, shows that a one unite increase in CEOage leads to a 1% increase
in the probability of cartel formation (CONV==1).
The current ownership status of the firm (COSTA) has a positive impact on the number of
incidences of cartel formation and discovery; one unites increase in (COSTA) leads to a 23%
increase in the probability of cartel formation. Additionally, the poor performance of a firm
(PPER) one unite decrease in (PPER) leads to a 1% increase in the probability of cartel
formation (CONV==1).
5.6.6 CEO Compensation Estimation Results
Top management levels are responsible for taking the decision of forming cartel and then
imposing this decision upon the management of the organisation who strives to hide any kind of
collusive agreement (Harrington, 2006a). Many compensation schemes are provided to the top
managers and it is necessary to understand if these schemes may help in facilitating the collusive
behaviour. The above results prove that there is a strong association between CEO
characteristics and cartel formation and discovery; therefore, the following sections examine the
relationship between the CEO compensation package and the incidence of cartel formation and
discovery. Due to the availability of the data the observation number shrunk to 92 firms (46
cartel firms and 46 non-cartel firms). Therefore, Binary regression (logistic model) is used for
CEO compensation. The dependent variable is cartel formation and discovery (Cartel), is a

208
dummy variable which takes the value of 1 if the firm participated and discovered in cartel
agreement, and 0 otherwise. The table below report the results obtained for model 8, 9 and 10:
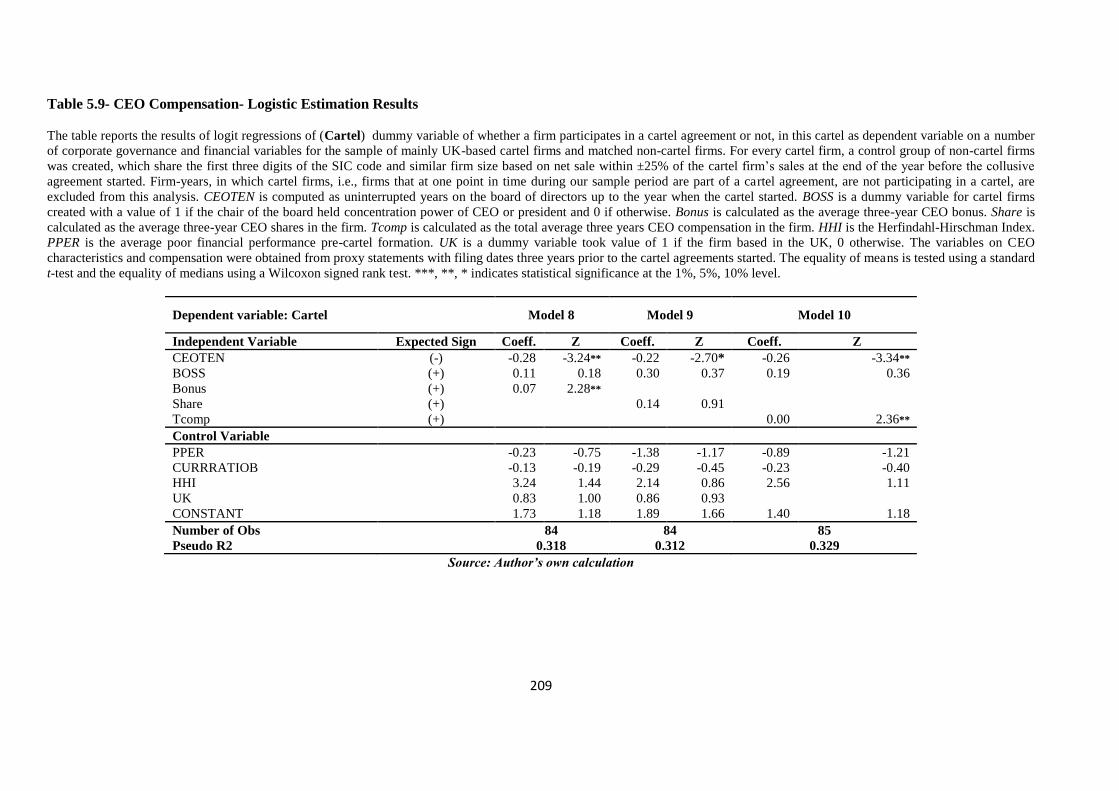
209
Table 5.9- CEO Compensation- Logistic Estimation Results
The table reports the results of logit regressions of (Cartel) dummy variable of whether a firm participates in a cartel agreement or not, in this cartel as dependent variable on a number
of corporate governance and financial variables for the sample of mainly UK-based cartel firms and matched non-cartel firms. For every cartel firm, a control group of non-cartel firms
was created, which share the first three digits of the SIC code and similar firm size based on net sale within ±25% of the cartel firm’s sales at the end of the year before the collusive
agreement started. Firm-years, in which cartel firms, i.e., firms that at one point in time during our sample period are part of a cartel agreement, are not participating in a cartel, are
excluded from this analysis. CEOTEN is computed as uninterrupted years on the board of directors up to the year when the cartel started. BOSS is a dummy variable for cartel firms
created with a value of 1 if the chair of the board held concentration power of CEO or president and 0 if otherwise. Bonus is calculated as the average three-year CEO bonus. Share is
calculated as the average three-year CEO shares in the firm. Tcomp is calculated as the total average three years CEO compensation in the firm. HHI is the Herfindahl-Hirschman Index.
PPER is the average poor financial performance pre-cartel formation. UK is a dummy variable took value of 1 if the firm based in the UK, 0 otherwise. The variables on CEO
characteristics and compensation were obtained from proxy statements with filing dates three years prior to the cartel agreements started. The equality of means is tested using a standard
t-test and the equality of medians using a Wilcoxon signed rank test. ***, **, * indicates statistical significance at the 1%, 5%, 10% level.
Dependent variable: Cartel Model 8 Model 9 Model 10
Independent Variable Expected Sign Coeff. Z Coeff. Z Coeff. Z
CEOTEN (-) -0.28 -3.24** -0.22 -2.70* -0.26 -3.34**
BOSS (+) 0.11 0.18 0.30 0.37 0.19 0.36
Bonus (+) 0.07 2.28**
Share (+) 0.14 0.91
Tcomp (+) 0.00 2.36**
Control Variable
PPER -0.23 -0.75 -1.38 -1.17 -0.89 -1.21
CURRRATIOB -0.13 -0.19 -0.29 -0.45 -0.23 -0.40
HHI 3.24 1.44 2.14 0.86 2.56 1.11
UK 0.83 1.00 0.86 0.93
CONSTANT 1.73 1.18 1.89 1.66 1.40 1.18
Number of Obs 84 84 85
Pseudo R2 0.318 0.312 0.329
Source: Author’s own calculation
210
CEO Tenure
Similar to the previous results on CEO tenure the comparison model shows that the CEO tenure
coefficient CEOten used in models 8, 9, and 10 is negative and significantly different from zero
in estimating cartel formation and discovery (Cartel). The results indicate that the number of
years the CEO has served as director for UK-based cartel firms is actually less than non-cartel
firms.
CEO Compensation
The share variable (SHARE) indicates that the effect is not large. Based on the total
compensation (Tcomp), the null hypothesis that the coefficient is not significantly different from
zero can be rejected. There is therefore a significant difference in the total compensation and
bonus between the cartel and non-cartel groups. It therefore rejects P15 - that the average CEO
share for cartel firms is higher than non-cartel firms and accepts P14 and P16 – that the average
CEO bonus for cartel firms is higher than non-cartel firms (P14) and that the total CEO
compensation for cartel firms is higher than non-cartel firms (P16). These are consistent with
the literature, that the CEOs of firms with weaker governance (where cartelisation) is possible
structures receive greater compensation (Core et al., 1999). These are also consistent with the
notion that compensation packages help enhances the collusion (Spagnolo, 2000).
211
5.7 Chapter Summary
This chapter reports the results of empirical findings on the association between three sets of
variables, i.e. board composition, CEO characteristics, and CEO compensation and cartel
formation, over the period 1990 to 2008.
Two types of analysis are performed, univariate and multivariate, to analyse the sample of this
research. The univariate test applies the T test. The multivariate analysis adopts a regression
analysis. Overall, the estimation results show relations between CEO tenure, CEO age, CEO
gender, the concentration power of the CEO, size of the board, the duration of the board, the
percentage of non-executive director and CEO compensation, in respect of the likelihood of
cartel formation and discovery amongst otherwise matched firms where market and legal
environmental controls are also modelled.
The ability to co-ordinate cartel activity would seem to be affected by past experience of the
CEOs. Whenever, CEOCASE and CEONUM are each added to the models 6 and 7 concerned
with CEO characteristics, both values have strong and significant positive effects on the
likelihood of raised incidences of cartel formation and discovery. Past CEO history can be a
guide to future proclivities to cartel formation. In other words, cartel activity, if it is not a habit,
is an ingrained response by some CEOs to the problems of financial, market, and economic
uncertainty, at the very least. In fact, the pseudo-R2 value when these two variables are added to
the model rises considerably and doubles, approximately, compared with CEO-based models
without board characteristics, or CEO and board characteristics together, without CEOCASE
and CEONUM. In logistic regression there is no direct equivalent to the R-squared found in
ordinary least squares regression but pseudo-R2 values can play a similar role (if technically
there are different from OLS types, and there are various pseudo-R2 techniques. In this study,
CEONUM and other CEO characteristics can themselves account for a great deal more variance
than other models, either CEO variable without CEONUM, or combined CEO and board
characteristics. This means that the history of the CEO can be a critical factor in determining
future cartel activity.
In the next chapter, a discussion of corporate governance and cartel is presented, alongside
ownership concentration in cartel formation, compliance code needs vis-a-vis cartels, and
corporate anti-cartel compliance programme.
212
Chapter Six
Discussion
This chapter presents and discusses the results reported in Chapter Five in an effort to provide an
answer to the research question identified in the first chapter. Those results relating to the
relationship between cartel and corporate governance are discussed first; followed by a
discussion on cartel and the compliance code needs and the corporate anti-cartel programme.
6.1 Corporate Governance and Cartel Formation
This study has investigated by empirical means across a controlled and matched set of data just
what attributes of corporate governance can significantly mitigate the likelihood of cartel
formation. Many of those attributes in each of the models with negative co-efficient have been
shown under their specific modelling conditions to have a significant empirically measurable
effect on desisting from cartel formation.
This study is part of the developing empirical based ‘technology’ of corporate governance,
whereby empirical research is done precisely on soft system analyses of corporate governance.
This study extends these kinds of research in a new direction, to the applicability of an empirical
study of corporate governance and cartel formation, based on individual and group attributes.
Much of the reason for these sorts of developments in corporate governance has been driven by
the new importance of risk management in almost every sphere of corporate activity, but
especially as risk management exists to mitigate the risks of illicit activity. This particular
potential use of the study will be developed in the recommendations section.
This research aims to find if there is a link between corporate governance characteristics and
cartel formation in UK-based cartel firms. The cartel data set consists of 150 cartel firms, where
114 firms are from the UK. These firms have formed cartel and discovered in 52 cartel cases that
operated in all around the world, and were found guilty by DoJ, EC, and OFT/CC between 1990
and 2008.
A cartel in general is a management response to a challenging set of economic and technological
circumstances. Typically in the past, the response has been described by more econometric and
structural arguments. The cartel emerged from economic pressure. These forces are still of
213
course to be acknowledged as prime, and cannot be discounted or minimised. However, this
study, after controlling for market and legal environment, also focuses on how human and
organisational factors are likely to either aggravate or mitigate the formation of a cartel. Chapter
Five describes in detail just how such factors can and do have significant influence on the
likelihood of cartel formations and discovery.
In the contemporary period, the opportunities and the potential benefits of cartel formation have
only increased, given the modernisation processes that globalisation has introduced across the
globe, along with vast information exchange (H schelrath and Weigand, 2010). The relationship
between corporate governance and market competition which was discussed in Chapter Three
confirm that market information and new opportunities for hidden communication after all are
the basic requirements for a cartel to even become possible (e.g. Keasey et al., 2005; Van
Frederikslust et al., 2008; du Plessis et al., 2011; McCahery, 2002; Januszweski et al., 2002). In
any economic downturn, it is likely that the incentives for cartel formation will only increase
(Lipczynski and Wilson, 2001). In the context of the current global competition, it is becoming
clear that international competition has risen in complexity well beyond the degree that most
economists can cope with in their models and, generally speaking, in their understanding
(Grossman, 2004).
The period covered by this study, 1990–2008, according to management guru Peter Drucker,
saw the beginning of a transformation of society and business culture into an era when “people
don’t understand the world anymore, and the past is not sufficient to explain the future”
(Childress and Senn, 1995: 3). Change is becoming less predictable and still unremitting. Firms
are experiencing considerable rates of failure in strategic change programmes, threatening the
survival of many firms in the headwind of globalisation. The pressure on CEOs and boards to
navigate firms through this period of new competitive pressure has been intense.
New information technology and organisational factors including globalisation raised the
potential and incentives for international and multiple project contacts between firms. These
changes are still to be rationalised and described adequately in orthodox economic theory. In
fact, Grossman (2004) argues that it is the new dynamics of strategic business management in a
globalised market, including forms of corporate governance, that are driving these new
economic and organisational structures, some of which may be opaque to regulators. Thus, the
capacity of boards and CEOs to “game the system”, which includes cartel formation, has raced
ahead of the capacity of anti-trust authorities to follow and investigate (Harrington, 2006b).
214
Modern cartels can indeed have remarkably sophisticated organisational structures. The purpose
of this sophistication is so that the corporate governance of the cartel can proceed with
monitoring and punishment of the cartel’s governance structures. How to adapt to these forces
and new complexity in how cartels operate and disguise their activity is an increasing challenge
to regulators, who now have to cope with the added complexity of international cartels in the
globalised business environment. It has been emphasised that firms surviving the competition
tend to possess optimal governance structures, and those who fail to adapt their governance
structures to changes in the business environment are likely to lead to demise (Kole and Lehn,
1997). This assertion is a prelude for this study to focus on CEO and board characteristics as
factors that can enable cartel formation and detection.
Certain CEO characteristics such as age, gender, tenure, remuneration, and dual executive-board
roles exacerbate the likelihood of cartel formation. This is mirrored in the results showing that
cartel firms characterised by having larger board size (Sizeba) compared to non-cartel firms;
lower percentage of independent member (non-executive) (NED %); higher average board
remuneration (Remun); less likely that cartel firm is owned and controlled by family; older
CEOs represented on the board (FAMCON); having older CEOs represented on the board
(CEOage); having CEO who served a less number of years as a director (CEOten); less likely
to have a female CEO represented (CEOgen); more likely to have CEOs who’s combined CEO-
chairman position (BOSS); and a higher average of CEOs bonuses (Bonus) and compensation
packages (Tcomp). All of these findings serve the purpose of cartel firms to persist in cartel
formation.
Successfully adapting to an increasingly complex and highly competitive global market,
straddling national and cultural boundaries, will indeed require regulators, to pay attention to
“diagnosing and changing organisational culture”, including corporate governance (Cameron
and Quinn, 2006). Most of the literature argues that successful firms those that have maintained
profitability and higher than normal financial-returns are characterised by particular clear
defined conditions.2 These conditions involve obtaining (1) high barriers to entry, (2)
Products/services which are non-substitutable, (3) large market share, (4) buyers and suppliers
with low bargaining power, and (5) competition between competitors. (Porter, 1980)
2 Discussed in details in Chapter Two

215
A focus on the ownership structure and composition of boards and the occupancy of the CEO,
which are exactly the characteristics described in this study, could help identify some of the
preliminary features of organisational structure which allow cartels to develop. The empirical
study of cartel risk assessment is in fact growing, and this study is a step in that direction. This
study is part of how “diagnosing and changing organisational culture” can be performed on an
empirical basis in the direction of a growing threat of expanded international cartel operations
(Cameron and Quinn, 2006). If board and CEOs cannot be held accountable for their own age
and gender, it is still the case that shareholders, markets, and regulators may be interested in how
a collective group of board members and the CEO can present a risk profile (which is high in
terms of the formation of a cartel) or recidivist behaviour in cartel activity.
The likelihood for CEOs and board of directors to thrive financially in cartel firms is seen in the
fact that firms collude together in order to maximise profits and maintain their price, suggesting
that they are also likely to have good financial performance (Spagnolo, 2005). Boards and CEOs
who view cartel as a protector of firms and of sector stability, more than as a potential source of
artificially inflated profits, may well be more the contemporary rationale for cartel formation
(Connor and Helmers, 2007). The benefits that CEOs and boards of directors obtain from their
positions in cartel firms are confirmed by the findings that the board remuneration (Remun) for
these firms is higher than for non-cartel firms.
The ideal step is to discover where corporate networks between CEOs and boards are actually
fixated on the classic hard-core cartel manipulation of price, supply and market share
(Grossman, 2004). What this study has demonstrated is that CEO and board characteristics have
a potentially important role to play in helping identify what kinds of attributes attached to
corporate governance can actually add to the likelihood of cartel formation and cartel activity.
This indeed would be valuable information. Therefore, to model cartel risk assessment, which
would generally include econometric data, the board and CEO characteristics can be
meaningfully attached to a more expanded and still empirically driven basis.
The inclusion in this study of poor financial performance (PPER) and ratio of assets to liabilities
(CurrRatioB) has been used for control purposes to focus with empirical precision on board and
CEO characteristics, whilst not ignoring the influence of econometric data. Thus, given how the
data have been matched and controlled for the information on age, gender, tenure, board
structure etc., can potentially improve the accuracy of explaining how and why cartel activity
begins.
216
Before cartel scandals erupted, studies concluded that as expected, institutional investors and
financial analysts did not assess firms solely on financial performance criteria. Rather, they also
based their judgments on prognoses about the boards and CEOs on human resource management
factors influencing the success of the firm. It is worthy of note that lack of apparent relationship
is found between the financial performance of the firm and implementation of several
directorships (Kiel and Nicholson, 2006).
Where does the value of a board and CEO lie, and how can criteria be established for making
such assessments in relation to cartel avoidance? What might this mean for identifying scenarios
where boards or CEOs are more likely to commit to cartel formation as a brand of strategy, and
of colluding with competitors against the consumer? Can the quantitative study of different
board and CEO attributes contribute to an assessment of the latent value of a corporate
governance structure? Would firms, noting the outcome of a study such as this, take
responsibility and demonstrate some measures of accountability by adapting its CEO and board
personnel to lower the risk of cartel activity? Would some compendium of all of the negative co-
efficient characteristics (e.g. CEOgen, NED% etc) finally be added to the list above? The
prospect seems unlikely but there is after all a growing body of evidence that certain corporate
arrangements of CEOs and boards is more likely to produce illicit activity, and the costs of illicit
activity are growing considerably. Regulatory measures are increasing, but there are more
intangible costs such as reputational damage. Commentators after the collapse of the case against
BA apparently left the court with their “reputations unsullied” (Joshua, 2010). Such a situation is
unlikely to be repeated, and the prosecution in US courts would almost certainly have led to
considerable repercussions for all the reputations of the defendants.
A great deal of the informal leadership qualities and capabilities of CEOs and board
characteristics enabling cartel formation can hardly be modelled empirically. The study found a
direct relationship between communication of strategy by investor relations departments, and the
ratings of analysts. All modern firms now realise that investor relationship is an important
criterion for investing amongst investors. Stakeholders’ relations have very much risen, and
continue to rise in importance (Low and Siesfeld, 1998).
These matters of informal influence and communication are highly complex and difficult if not
impossible to judge with certainty on an empirical basis. In the past, the tendency has been to
answer such questions with the analysis of econometric measures that are quantifiable and
217
impersonal. The challenge of this study is that the personal attributes of CEOs and boards can
make a significant contribution to the risk profile of a cartel being formed. This indeed would be
to ‘diagnose’ organisational culture in a quite radical direction.
The link to economic benefits of diagnosing organisational culture with respect to cartel
formation would be to lower the monitoring and agency costs of compliance with the law. At the
radical end of action on cartel monitoring and investigation, firms with lower risk profile might
be subject to less intrusive monitoring, or have taken action to lower their ‘cartel risk’ in terms
of corporate governance, and greater leniency. Many types of experiments in cartel monitoring
and investigation are being tried and have been discussed in this study. The fact that cartels are
ongoing and maybe in fact increasing in number will itself spur new experiment in terms of
corporate regulation. The US, UK and EU have all made considerable revisions to competition
law in the past decade. Empirical research is the order of the day, and applying empirical
research to cartels and corporate governance, even if the results may be difficult to interpret or
implement in regulation, can hardly be ignored.
The rising tide of anti-cartel legislation across the globe has been consistently noted in this
study. Any and all instruments for helping identify the likelihood of cartel activity will be
welcome in an atmosphere where cartel prosecutions are becoming far more important. More
resources are being dedicated to investigations, alongside some very public actions against
cartels, including fines that have risen exponentially in value. The 10% of global turnover in
fines must be a very considerable and galvanising threat for management against cartel
formation (Alderman, 2009; Andreas, 2008). The US has certainly led the way in adding to the
criminal basis and criminal sanctions against cartel participants, and the UK and EU have
followed. Yet it is still the case, amidst all of these regulatory activities and new threats of fines
and criminal punishment, that cartel activity is likely to have increased. As before, any and all
means of analysing and explaining cartel formation could be a valuable regulatory and
management tool. The rise in cartel activity and punishments cannot finally be good for the long-
term economic welfare of the global economy.
However, in Norway for example, a new rule has been introduced into the corporate governance
structure of every firm by national regulators. Corporate boards will have to have 40% female
representation by force of law. According to the results of this study, this is bound to have an
effect on cartel activity. Norway has experienced cartel activity (e.g. the cement cartel), and the
new rule was not put in place as an anti-cartel measure, but as a social justice measure and a
218
commitment to the rights of women. However, this kind of radical action is expected to have
significant benefits in terms of risk management since female participation at board level and
senior management level has been found to inhibit illicit and fraudulent activity. In other words,
a commitment to social justice via gender politics that also has risk management benefits may
also add an anti-cartel effect to Norwegian corporate culture. The outcome remains to be seen,
but the fact is that risk management and CEO and board attributes have become a normative
mode of analysis of corporate governance.
It must be noted that the board characteristics that are linked to cartel formation and detection
also necessitate the consideration of factors leading to how cartel have been formed in the first
place. As mentioned earlier in Chapter Five, the dependent variable (CONV) distinguishes those
firms that formed cartel (which are however detected) from all others firms; some of which are
not in cartel, and others of which are in undetected cartel. The dependent variable in this case
might decrease given the increased likelihood/attractiveness of cartel formation, which likewise
makes cartel formation less attractive and hence making detection easier.
Despite the establishment of board characteristics in the study where some have been linked to
firms that have been detected of cartel, the dependent variable is said to increase with the
likelihood/attractiveness of cartel as indicated by the factors that lead to cartel formation. Factors
that are likely to establish cartel are high seller market concentration, which is ushered by
presence of entry barriers, number of firms, quality differences/ product differentiation, seller
concentration, buyer power, and demand elasticity (Connor, 2008). In firms thus examined for
the formation/existence of cartel, high seller concentration (HHI) appears to be a prevailing
condition along with (product) homogeneity, which is usually considered an important condition
for effective collusion. These factors are undoubtedly present within the market environment
where both cartel and non-cartel firms operate in a high seller market concentration and the
advantages that cartelisation provides might enable even non-cartel firms to commit cartel due to
these. Both cartel and non-cartel firms operate in such environment, which would lead us to ask
why non-cartel firms are not committing cartel despite the attractiveness posed by these factors.
The assumption that might take place therefore is that these firms might in fact be committing
cartel also but are not yet caught doing so; or that they might not be committing cartel at all. The
only certain thing here is that cartel firms are committing cartel as shown by the evidence of
their formal detection.
219
If non-cartel firms that have not been detected of cartelisation happen to commit cartel, an
insightful position would be to look at the characteristics of the board that serve as the
independent variable for this study; as there are findings establishing some board characteristics
in cartel firms, which are not present in non-cartel firms (e.g., larger size of the board of
directors; lower percentage of independent (non-executive) members; lower average age of
board directors; higher board remuneration; higher CEO age; etc.).
Quantitative research has already shown that even for highly efficient firms, in industries where
the concentration index HHI is high, a stable cartel is even likely (Prokop, 1999). The
concentration index HHI with its positive correlation with CONV indicates how, as might be
expected, with more concentration there are often fewer firms, and hence decision-makers
involved in a cartel, making it easier for a cartel to form (Grossman, 2004). This expectation was
also found to be correct in this study, with a considerable strength of effect. In all of the models,
the HHI index had a strong aggravating influence on the likelihood of cartel formation. This
result in all of the models also acts as a gratifying quality check for the data collection and model
design processes.
Thus, good financial performance and apparently good corporate governance do not diminish the
likelihood of cartel formation. Structural factors in the market are important, and these cannot be
discounted (Aubert, 2007). However, this study has shown that board and CEO characteristics
can and should also be added to the analyses of cartel formation, in both qualitative and
quantitative fashions. These are matters of organisational culture and decision making, and the
factors identified here certainly do not imply that the decision, or action, to implement a cartel
arrangement is even rational or personal. The effect is still generic but cannot be ignored. For
instance, the financial crisis may have a rationale in profit-making, but the group effect was
highly irrational. Are cartels in fact always rational? Research by Asch and Seneca (1976)
suggested that cartels based on seemingly simple profit motives may even defy their own aims,
and in fact harbour an irrational strategy (Asch and Seneca, 1976). Other strategies, such as
innovation, or bringing in new personnel, may have been superior. A cartel after all is a
conservative response to a dynamic market environment.
Therefore, if it seems far-fetched to invoke CEO and board characteristics as the absolute focus
of an anti-cartel compliance code, or of regulatory monitoring, the new and increasingly
universal devotion to the arts of risk management is in effect only a major umbrella for the kind
of analysis conducted here. Tenure has been studied a great deal, as discussed, and gender is
220
increasingly of interest. However, the co-efficient for CEO characteristics, gender (CEOgen) by
far has the greatest inhibitory effect on cartel formation (-2.96, in model 4), and in terms of
board characteristics, the percentage of non-executive directors (NED %) also had a very
sizeable inhibitory effect (-3.40, see model 1). It is said that gender differences may not exist
when seen in the context of corporate decision-making, and the reason is either the women
would try to outdo men in terms of taking risk or since the decision would be made together by
men and women, there could not really be gender difference in the decision made (Zahid et al.,
2006).
In an experiment conducted by Hamaguchi et al. (2009), gender was included as an individual or
social background variable, in an experiment mostly designed to look for group size effects on
cartel dissolution, along with leniency programme characteristics. The design of the research
(which also proceeds by logistic regression), is very much alike the research pursued here in this
study. There is certainly more attention being given to individual characteristics than ever before
in the non-econometric analyses. Once more, the coefficient for gender in the logistic regression
was significantly negative in showing that as well as women have a negative impact on cartel
formation, women also have a positive impact on cartel dissolution (p<0.05), since “fewer men
dissolved their cartels than women” (Hamaguchi, Kawagoe and Shibata, 2009). The fact of the
matter is that gender can have as powerful an effect on cartel formation likelihood as the HHI
concentration index, which seems a remarkable feature of the sensitivity of organisational
culture to being diluted away from an ‘old-boy’ network characterisation. This may not be a
quantifiable statement on ‘old-boy’ networks, but the evidence is still there in the regression
analysis of data on gender influences controlled for market environment. ). Another study by
Byrnes et al. (1999) found that men are more willing to take risk than women, and this gender
difference in risk taking decreases as age increases. However, no indication of difference in
performance was noted despite the presence of risk-related behaviour difference between male
and female fund managers in a study conducted by Niessen and Ruenzi (2006).
Moreover, the classic problems of principal-agent divisions of managerial responsibility, typified
by aims and objectives dominated by personal gain, as well as profit maximisation, are in many
ways inherited by the problem of a cartel. How a CEO and board (with certain characteristics)
are more likely to assure their own personal gain and profit maximisation (including firm
stability in difficult market conditions), through a cartel arrangement, can now be said to take
place with some empirical precision, even if little is being said of the psychological and
economic reasons for the cartel’s formation. This research is neither economic (if it controls for

221
market conditions), nor psychological (which of course is unexamined) but certain definite
attributes have been discovered which would be of some importance for the internal and external
regulatory monitoring of cartel.
Tacit collusion between oligopolistic firms has been fairly well understood after decades of
research on games theory (Friedman, 1971; Green and Porter, 1984). These analyses work with
the ‘standard’ assumption that firms maximise discounted expected profits. The effects of
observed managerial incentives on long-term (oligopolistic) competition, and how managers
with a preference for “smooth time-paths of profits” [also noted in the literature as “income
smoothing” (Loebbecke et al., 1989)] can sustain cartels at lower discount factors, make the
presence of a cartel arrangement less observable, and allow a cartel seem less of a criminal
offence (Spagnolo, 2004 and 2005). The economic cycle can have a considerable effect
alongside managerial incentives, together with the threat of being forcibly retired (discussed in
Chapter Five). In the study of Buccirossi and Spagnolo (2007), the authors mentioned that a
critical role is played by factors of corporate governance in determining a firm’s behaviour
towards competition as well as in identifying the key players in ascertaining anti-competitive
behaviour.
The tied nature of an array of economic factors and CEO and board incentives cannot be
ignored. There is no claim for isolating CEO and board characteristics as inherently influential
on their own, but only those that can be distinguished in controlled circumstances. These
characteristics can and will play a part in real world scenarios where cartel formation is likely.
In the real world, where strategic management and economic forces as part of globalisation are
linked more than ever, it is the case that other organisational factors still influence a firm’s
objective function to generate a profit on behalf of its shareholders. Understanding the soft-
system complexity is important to help understand how factors such as CEO characteristics,
board characteristics and ownership structure can affect market behaviour, as well as how
economic behaviour affects corporate governance. Corporate governance is said to comprise
market competitiveness as an external mechanism, as pointed out by Lin (2001) in the literature
review. The systems of corporate control and corporate activity under observation in this study
are highly dynamic between market conditions and corporate volition. This is especially true
given the prevalence of control and agency problems, when firms may follow objectives that are
qualitatively and quantitatively different from the standard assumption of profit maximisation
(Spagnolo, 2004).
222
Some portions of the control and agency problems of firms when they embark on cartel
formation and take risk (such as a growing risk in the contemporary anti-cartel vendetta of the
U.S DoJ, for instance) can now be explained by the distribution of CEO and board attributes
analysed in the study. However, these characteristics are only generic and not liable so far to be
part of any individual hiring practice assessment mechanism. Yet, like much of social change
and corporate culture in general, such as the diversity management concept, matters that before
were seen as irrelevant to corporate success, and merely the presence of liberal anguish, now
appear as crucial elements of strategy in a globalised economy. What a CEO is, or what a board
is, in terms of age, tenure and gender may be seen to be static and immaterial to future success
compared with the incipient knowledge and experience held by CEOs and the board. However,
what those characteristics also veil are tendencies, for and against, the formation of a cartel.
A cartel however cannot be communicated to investors or be broadcast as part of a strategy, as it
is an illegitimate form of strategising, when stakeholders in corporate activities begin to include
other competitors acting illegally as conspirators. Therefore, a cartel is an organisational culture
in direct opposition, or standing in contradiction, to what most business commentators and
analysts today identify as best corporate governance and strategic practice - meaning
transparency and accountability. Transparency and accountability are what enable the underlying
reasons for corporate strategy, and help their enactment, thus enhancing CEO and board
credibility. The quality of corporate strategy must be tied to communication - strategy is
basically an outline of how a business will achieve its goals, usually by innovation and talented
employees – but a cartel cannot be communicated. This must be why, at least partly, non-
executive directorships inhibit cartel formation, since such directors are intrinsically more biased
towards transparency and accountability, without heed to long-standing, more entrenched
relationships in a firm. Hence, the percentage of non-executive directors (NED %), and the
avoidance of concentrated power in organisational authority (BOSS), appear as distinctive
inhibitors and aggravators of the likelihood for cartel formation.
It may be examined that the easiest and most visible characteristic of a board is its size. The
board is supposed to summon experience and good judgement to all decision-making and
supervisory functions at the highest level of strategic thinking in the firm. How can the larger
board take a decision, or follow an action or strategy that is more likely to lead to cartelisation as
is the case of the analysis here? Clearly, it is likely that cartel formation will be connected in
some way to an intermediate term strategy. It is true that boards are being asked to perform more
223
functions and assume more responsibility. One empirically-based micro-perspective study on
how boards actually ‘do’ strategy showed how boards may have very little interaction with daily
organisational practices (Hendry, 2010). Boards often conduct only a reactive or procedural
supervision around strategy (oversight and auditing functions). This is board management as
‘board management by exception’, that is, boards only act in exceptional circumstances.
Otherwise, the board is merely a compliance overseer without much actual insight into the
business and its detailed functioning. However, raising the profile and importance of this
activity, particularly with regard to risk management, does today have a greater strategic
importance, specifically in light of corporate governance scandals. There are only increasing
demands on boards for oversight functions and board controls to have a strategic importance,
and not to be mere passive vehicles of thin compliance checking (Hendry, 2010).Yet, enlarged
boards may not be the answer.
The literature review emphasised that if cartel agreement can be considered a failure of corporate
control, i.e. a failure of the board to control (e.g., CEO, individual directors), then it may be
furthered that the likelihood of a firm to get into the cartel agreement is positively related with
the size of the board (Gonzalez and Schmid, 2012). Board size (SIZEBA) used as a variable in
two of the regression models both showed that significant differences existed between cartel and
non-cartel firms, with the board size of cartel firms averaging around two more board directors
than non-cartel firms, rather it is board quality, and especially the presence of engaged non-
executive directors (NED%) which has the desired effect of determining cartel formation. OFT
(2011) stated that directors in smaller firms might become more involved in day-to-day business
practices of their firm, and might therefore be more knowledgeable of any actual or potential
breach of competition law. In contrast, directors in larger firms might not be as involved as the
directors in smaller firms. In a logit regression analysis of 75 matched firms characterised by
fraud and no-fraud histories,
“no-fraud firms have boards with significantly higher percentages of outside members than
fraud firms” and, “as outside director ownership in the firm and outside director tenure on the
board increase, and as the number of outside directorships in other firms held by outside
directors decreases, the likelihood of financial statement fraud decreases” (Beasley, 1996: 459).
Non-executive directors (NED %) maintain the integrity of their erstwhile contracts to perform
monitoring function as part of corporate governance, and the concentration of CEO and board
chairman roles (BOSS) exactly opposes the contractual independence proven to be necessary for
224
capable corporate governance in virtually all studies of the subject. In the literature, it is
recognised that contracts with third parties may have important strategic effects on the quality of
corporate governance. Many of the corporate governance variables discussed in this study, such
as board remuneration (Remun) and CEO compensation (Tcomp), can be viewed as “contracts
with third parties from the point of view of competitors” (Buccirossi and Spagnolo, 2007). In this
regard, CEOs and boards are all third parties to be engaged variously by firms competing for the
services of board members and experienced CEOs. This is part of the market in corporate
governance, in terms of human resources.
A cartel exists to defeat or at least negate this form of contract that should exist within firms.
Contracts with CEOs and board members should require these actors, in fulfilment of their
corporate leadership roles, to usher the interests of one firm and compete with all other firms.
The rational self-interest of economic activity should extend to governance and leadership. This
is why the DoJ, EC, and CC/OFT all have strict rules about joint ventures and mergers, which
may interfere with the self-interested structuring of market forces, from consumers to corporate
entities. The doctrine of the corporate veil and that legal function assumes that the corporate
form is acting as a single corporate entity. A cartel defeats or negates the doctrine of the
corporate veil by veiling many corporate entities within a collective corporate entity that has in
fact no legal status in corporate law.
The characteristics of the board and CEO which might function as markers for cartel formation
would be white-collar criminals capable of expert networking at very high levels of corporate
activity, and who are willing to become an offender, and often a re-offender, with the aim and
objective of securing corporate gains that ultimately should benefit the said offender(s), but
however, are deferred gains in terms of their own wealth and remuneration. This is the behaviour
of a personality and group of people who appreciate the organisational culture of at least one
industrial sector, and who are heavily invested personally, and even idealise, the status of their
own firm amongst other firms within that sector.
Cartel is a defence of an industry as well as of a firm, against the interests of the consumer in
general. In fact, cartel participants even over-identify with corporate culture and dis-identify
with consumer culture. This may even help explain why aged CEOs (CEOage) with shorter
tenure (CEOten) expectations may be more responsible for cartel formation than other older
CEOs, since such CEOs may be about to depart from corporate culture after a long association.
In the threat of departure, the potential comfort of a cartel as a point of identification with a
225
shared corporate culture amongst multiple firms may be more appealing. This of course is to
verge on a psychological explanation of CEO characteristics. In this group of people, it makes
more sense that corporate fines, and any other corporate sanction, will have less impact since
these individuals are already identifying with corporate cartel culture, and these forms of
punishment are an ordinary risk, rather than a critical risk, of corporate activity. This must help
explain the difference in recidivism in the UK and U.S jurisdictions. In the UK, to abandon
competition in favour of a cartel, on a number of occasions, already indicates the more
normative identification of CEOs and boards with corporate versus consumer culture. This is
clearly not the case with the aggressive and hostile pursuit of cartel activity by US authorities,
where the corporate contract with the consumer, and never with other corporations, remains
moral and ethical as well as economic virtue par excellence.
In fact, the negation of the erstwhile capitalist and free market contract with the consumer will
thereby homogenise corporate governance around a hidden corporate ‘cartel’ structure. This is a
strategy to defeat the conflict between firms by substituting the cartel agreement as the principal
agent of agents. A cartel negates the point of view of other firms acting as competitors looking
on at CEO and board contracts. In other words, the cartel defeats the market in corporate
governance, or at least suspends the market in corporate governance for the duration of the
cartel. Why should a market in corporate governance exist when it is understood that profits and
market shares are already pre-determined in advance? Any movement at C-suite level between
erstwhile ‘competitor’ firms during the operation of a cartel would seem an ineffective and even
disruptive manoeuvre.
A cartel is a strategy that seeks to nullify strategy – this also helps explain why older and not
younger CEOs seem to be more palatable to cartel formation, if older CEOs are strategically
exhausted, and only have a network of contacts, an address book to put it crudely, as a strategy
in difficult conditions. This research has indicated that C-suite transfers between firms are
generally an inhibition on cartel formation (JOIN). A cartel is a stasis of strategy that is partly
reflected in the individual characteristics of older CEOs with shorter tenure, and a lesser traffic
in the market for corporate governance within a firm. The results from previous research on the
role of outside directors in monitoring management and controlling agency problems suggest
that a relatively large percentage of independent directors serve as a substitute for other types of
monitoring mechanisms (Booth et al., 2002). In the literature review, Rajagopalan and Datta
(1996) examined any possible association between CEO characteristics and comprehensive
industry conditions and found out that a limited role is played by industry conditions in tackling

226
differences in CEO tenure, educational background, and functional heterogeneity. Moreover,
Booth et al. (2002) found that agency problems between management and shareholders played a
role in motivations to add outside directors, or as this study agrees, JOIN had a negative co-
efficient compared to raised cartel formation and discovery (CONV).
In a scenario of denied contractual obligations to compete, the only strategic competitor to a
cartel – since the consumer is now the enemy - becomes the regulatory bodies with direct
supervisory powers of investigation, both commercial and criminal. Related to the question if C-
suite movement between cartel members has any significance could be the question if movement
between public and private entity personnel could have any influence on cartel formation. Thus,
many of the recommendations of this study, as well as focussing on risk assessments as a new
avenue of anti-cartel activity, will focus on regulation becoming more proactive. In this regard,
the US DoJ has been and continues to be in the vanguard of anti-cartel criminal and civil
procedures. However, there does remain room for more research in how to identify preliminaries
that help the formation of cartels. The figures for cartel discovery suggest that there is still a
great deal of room for improvement in detection rates.
In many ways, this study has complemented the work of Grillo (2002). Instead of focus on
competition law and how market strategies are nullified by the “straightforward co-ordination on
market strategies”, the focus of this research describes how multiple firms design and practice an
organisational culture in a cartel arrangement, or what Grillo calls “an anticompetitive object”.
This anticompetitive object can more easily be reproduced amongst certain kinds of boards and
with certain types of CEO – this is the conclusion of this research. In many ways, the obvious
object is obtained and arranged by recruiting a CEO with a previous history of cartel formation
and involvement. In fact, CEOCASE was more significant than CEONUM as seen by the
difference in the coefficients in Models 5 and 6. In these models, CEO tenure, age, managerial
position in respect of the chairman of the board being the CEO, and multiple directorships, are
all the same, as well as the control variables. The difference is the addition of either the CEO’s
total number of cartel cases the CEO was involved in (CEONUM); versus the CEO involvement
in another cartel at the same time (CEOCASE). By the lower coefficient for the number of
cartel cases, cartel cases have a raised effect compared to the number of cases per se. Past
history is a guide to the future, and that previous involvement in cartel activity may well be an
indicator of future involvement in cartel arrangements.
227
The research in part constitutes a profiling exercise. However, in criminal justice studies in
general, the more focused the profiling technique is on individual offenders (including CEOs);
the more controversial becomes the use of profiling. For instance, in light of recent events in the
UK after the collapse of the cartel trial against British Airways (BA) for fuel surcharges, lawyers
argued that “criminal cases should be selected based on the strength of evidence and not on the
profile of the defendants” (Beaton-Wells and Exrachi, 2010).
Any use of quantitative (general spreadsheet, actuarial, or machine learning) techniques in
gauging and understanding the behaviour of individuals is controversial. However, business
culture is becoming more data-centric and analytical in its use of insights derived from the
analysis of datasets. Best practice is increasingly focused on such insights often with more
centralised control over decision-making. Boards and senior management would be the prime
users of risk tools that invoke actuarial practices.
However, the conversion of data to the management of individual persons and contexts is
contestable (Aitken et al., 1996). Assembled data cannot and should not determine decisions on
individuals, even in principle. The necessary appreciation of the dynamism of individuals
supposedly cannot be recreated from collected data, no matter if the analysis is expert and adroit.
Others argue that the level of accuracy of actuarial tools is too uncertain for estimating any
individual’s risk, especially in terms of offending rates (Hart, Michie and Cooke, 2007). This
would include rates of cartel offences and the associated risks of cartel formation by certain
CEOs.
The subject of this research thus will attract criticism as an inappropriate method for identifying
the raised likelihood of cartel activity. Newer methods and uses of profiling may be ‘interesting’,
but any method should be used according to its suitability for specific applications (Sampson and
Laub, 2005). However, in the criminological literature, it has been more and more accepted, with
more and more proof having been accumulated, that actuarial methods of offender profiling have
greater accuracy than clinical (versus personal, and intuitive professional assessments done face-
to-face). Statistical means can predict the likelihood of recidivism better than clinical
assessments made by professionals (Veljanovski, 2011).
The fact that many UK firms are recidivist, and take part in multiple cartel arrangements at
multiple times, might also suggest that some ‘objective’ quality of the corporate governance and
organisational culture is persistent, and given over to abetting the formation of cartels. This may
228
of course be partly dependent on the market environment (the HHI index in particular), as well
as the legal environment (the latter as a deterrent to recidivism, such as in the US), but the
organisational culture and human resource selections of an organisation may be given to
accommodate the possibility of engaging in cartel arrangements. Firms with given board and
CEO characteristics in certain industries and market conditions have a latent tendency to
cartelise competition. This reproduction of an anticompetitive object must indeed be facilitated
by the human resource management of cartel firms, whether or not boards and CEO positions are
publicly advertised, or whether the positions are filled with private sponsorship of known
individuals (the old-boy network in classic terminology).
A truer measure of the ability of a board to get involved in a cartel arrangement, and access or
consolidate market power, is the board’s bargaining power, or the power of a board to bargain
with others and demonstrate, and remonstrate, that a cartel is the necessary and sufficient
condition for the economic welfare of all parties to the cartel (and even the consumer in the
cartel of the crisis situation). The reason most cartel fail is due to new entrants outside of the
cartel entering a market, and thereby disrupting the cartel to the point of breakdown (Grossman,
2004). Often, entry will be followed by an invitation to join a cartel, and without a successful
conclusion to the ‘bargaining problem’ of new quotas, failure is more likely, but this is not
labelled an entry problem per se, and is a bargaining problem. Therefore, for a cartel to be
expected to last, the board, and CEO, plus any other organisers, must be capable of bargaining
for its duration.
This is not to refer to the bargaining power of economic competition (with sellers and buyers
bargaining over the best price for a product). This is instead to bargain over entry to a cartel, and
for one firm to lever other firms into a cartel, even though other firms may judge that the
potential ‘price’ they are paying (fines, loss of reputation, and criminal charges) is too high,
compared to the promised benefit of raised or secured profits. Can cartels be treated as an
investment? Schelling (1960) cites the example of an oligopolistic market whose apparent
domination by the few using price leadership may in fact be an “unprofitable distinction evaded
by the small firms and assumed perforce” by bigger firms. Smaller firms may well seek out
differentiators that large firms eschew and instead opt for the supposed safety of a cartel and its
pseudo-contractual commitment between competitors.
However, like an actual contract, a cartel arrangement is usually the “assumption of a’ transfer
cost,’ not a real cost”, and entry into a cartel by all of the interested parties does not remove the
229
“range of indeterminacy” that is the transfer cost of moving in or out of the cartel (Schelling,
1960). This is by knowing how to judge this transfer cost, which is usually a matter of
significant CEO, board or senior management experience, operational influence control, and
board monitoring processes. This is why both CEOAGE and BOSS were positive influences on
cartel formation likelihood.
6.1.1 Ownership Concentration and Cartel Formation
Literature suggests that shareholder value is maximized through the authority and greater
incentives of the larger shareholders. The larger owners have greater motivation as well as better
opportunities than the smaller shareholder to exercise authority over the manager, according to
the empirical evidence available (Jensen and Meckling, 1976; Zeckhouser and Pound, 1990;
Burkart, 1997).
Further models have been created from the views of Jensen and Meckling (1976) regarding
issues of ownership structure, and consider not just the extent of ownership of the firm insiders,
but also the concentration of outside shareholders’ holdings (OUTOWN %). The larger
shareholders largely internalize the costs of supervision in addition to possessing adequate
voting power to be able to have an impact on the corporate decisions which is why management
is supervised better through them rather than the smaller shareholders.
Firm profitability is considered to be positively affected by the structure of ownership (Berle and
Means (1932)). The expectations of the agency theory have been supported by other scholars in
continuation of this debate (Jensen and Meckling, 1976). This includes the greater managerial
incentives to diversify when ownership and control are separated as the managers are able to
gain personal benefits due to risk diversification and reduction. This follows from the fact that
managerial performance cannot be supervised by the greater number of shareholders. If the
ownership was more concentrated (family firms) or if there was a single shareholder, managers
would not have enough freedom to utilize firm resources (Shleifer and Vishny, 1997).
Diversification studies have shown that in product or market diversification, greater personal
benefits including financial and reputational are acquired by the managers during product or
market diversification due to risk aversion, empire building and expense preference (Thomsen &
Pedersen, 2000). Greater shareholder value is created through ownership concentration which
also offsets corporate diversification. The managers’ tendency to increase their monetary status
230
and reputation through diversification and rapid development does not maximize the firm’s
market value, as the agency theory states (Jensen and Meckling, 1976). When the managers are
not forced by the owners or external investors to meet the interest of the owners which is to
enhance the firm’s market value, they are not inclined to downsize or diversify in the reverse
manner. According to the agency theory, the ownership structure hence determines the
managers’ tendency to increase firm value. Further examination of this theory was carried out by
Amihud and Lev (1981), with the results confirming the view that investments in unrelated
mergers and acquisitions were less likely to be made by the managers employed in firms that had
large shareholders.
The systems of control that bring about an alignment of the managers’ interests with that of the
shareholders’ is another aspect of corporate governance that is being studied. Ownership
concentration (family firms for example) which includes risk and incentive efficiency trade-off
is an example of such a control mechanism (Jensen & Meckling, 1976; Demsetz, 1983; Shleifer
& Vishny, 1986). A greater motivation to supervise is possessed by the larger shareholders,
which is why they need to compel the managers to bring their goals in line with their interests of
enhancing the share value. However, when ownership concentration exceeds a certain degree,
Fama and Jensen (1983) argue that managers get a chance to become entrenched and confiscate
the minority shareholders’ assets. The possibility of a non-linear association between firm
performance and ownership concentration is hence being argued over by the scholars now.
Ownership concentration in firms does not necessarily lead to greater disclosure; however a
positive and vital impact comes about through the composition of the board. There is a strong
association between ownership concentration and quality of corporate governance in legal
regimes that are weak, as has been suggested through the negative coefficient of law variable
with the index of corporate governance. Ownership concentration hence becomes the method of
resolution of agency conflict between the shareholders that are in control and the ones in
minority when the investors are not given ample legal protection. Poor legal security then leads
to ownership concentration (La Porta et al., 1999; Durnev and Kim, 2006).
Additionally, agency problems between the families in control and other shareholders may either
aggravate or alleviate due to family control, which plays a significant role in addition to
ownership concentration. Steijvers et al. (2010) puts forward the view that family-controlled
firms are more likely to encounter agency problems. In such firms, the controlling family has the
complete authority to appoint the members of its family to the board or management team
231
because of which it is able to attain maximum benefits for itself and have a low level of
corporate transparency. In such situations, external monitoring is not favoured by the family-
controlled firms so that the private interests of the family are protected, which is why low-
quality auditors are hired (Niskanen et al., 2011a).
The results revealed in this study exhibits the concept of ownership concentration prevailing in
cartel firms. This ownership concentration is understood within the context of a prevailing global
competition where firms collude in order to increase their profitability and stability. Laiho
(2011) has emphasised that the firm’s resources might be extracted by dominant owners due to
high ownership concentration. The firm’s ownership structure may be taken into account with
regard to this; as such structure enables ease of ownership concentration, as shown by high-
ownership owners who use their position to obtain private benefit.
However, the formation of cartel is significantly and negatively influenced by the family firm
(FAMCON) as the results shown in Model 2. The claim that family owners create enhanced
governance and supervisory systems has been affirmed through this result. The agency problem
between managers and owners can be lessened through family control which is why significant
and negative effects of family shareholdings are obtained (Fama and Jensen, 1983). The large
shareholders are better able to monitor the management compared to small shareholders. This is
because large shareholders (family firms) internalise larger aspects of the monitoring costs and
possess sufficient voting power in corporate decisions. Small shareholders, on the other hand,
are only able to influence corporate decision making at a minimum basis. Because small
shareholders have little influence on decision making, the managers then hold the control of the
firm, who possess both the opportunities and incentive of misusing their position. It is therefore
concluded that corporate performance would be adversely affected by the ownership-control
separation (Laiho, 2011; Hamdani and Yafeh, 2010; Leech, 2001). According to James (1999),
there is greater efficiency in investments as families possess a long term perspective on
investment. When the shareholders have a long term view, the manager’s tendency to take
myopic investment decisions can be greatly reduced, as Stein (1989) asserts.
An explanation of this result could be as demonstrated in Chapter Five that the study sample is
dominated by UK public firms, and according to Desender (2009) and Franks and Mayer (1997)
who have argued that shareholder structures are fairly varied across countries, where frequency
of dispersed ownership is seen in listed firms of US and UK, which means that several small
shareholders are associated with the phenomenon of dispersed ownership and dispersed voting
232
power. When there is a wide distribution of share ownership, for example in the UK, the owners
do have the motivation to become active owners and as their proportion of shareholdings is quite
small; their voting power is quite weak which means that they can cause little influence on
decision making (cartel formation), which makes the decision on the top management hands.
6.2 Cartel and Compliance Code Needs
Cartels have never been feared and loathed as they are often today. Before WWII and the height
of cartel dominance, cartel governed roughly 40% of world trade (UN Department of Economic
Affairs, 1947). Only since the post-WWII settlement, and especially with US economic
dominance, have cartel been treated as more or less abhorrence to economic welfare. In Europe,
Japan and Korea, cartel instead received a much more tolerant dispensation. Yet today, there is
without question a “hardening of attitude of competition authorities worldwide towards cartel”
(Whish, 2009). The US has always been uncompromising, the OECD has made major
interventions in denouncing especially hard-core cartel. In Chapter Two, it has been shown that
the number of cartel cases filed by the antitrust fell by 49% from 1990 to 2007, alongside the
number of firms charged annually, which decreased continuously. The penalties imposed on
convicted firms have increased however (Connor, 2008). In 2005, the EC set up its own
dedicated Cartel Directorate and the UK has very recently loosened the criminal elements of its
cartel offence to make prosecution easier. Furse (2004) for instance, contested the equivalence of
cartel activity with theft, pointing to the voluntary participation of the customer, albeit on false
information. However, the UK Enterprise Act’s own intention was to make the analogy more
accessible. The history of antitrust legislation in Europe itself has been “very much one of
American influence” (Wils, 2005 and 2006).
The US value system around competition is that a “working competitive process is a precious
public benefit that should be safeguarded” (Cseres, Schinkel, and Vogelaar, 2006). This is
becoming more of a new norm, in the UK and EU jurisdictions, although resistance in the UK
remains perplexingly strong. In a 2007 public survey, only a quarter of respondents ‘strongly
agreed’ price fixing was even dishonest, and fewer than ten percent felt criminal prosecution and
imprisonment was then an appropriate punishment (Stephan, 2008a). Another problem is how
the EC still remains inconsistent and excessively secret as to how fines and penalties, especially
in regard of leniency measures, finally affect outcomes (Veljanovsk, 2011). For instance, one of
the worst recidivists, Akzo Nobel, received complete immunity in the Calcium Carbide cartel
despite involvement in four previous cartels. Akzo similarly received full immunity in the
233
Sodium Chlorate cartel discovery but once more, past cartel infringements were not presented as
aggravating circumstances deserving of exemplary punishment. Vafeas (2003) also worryingly
found that “the audit committee is mostly regarded as a compliance committee”. Where the
number of outside directors is limited (NED% is low), new directors are likely to go on the audit
committee and remain in the committee for an extended period of time. This expectation and
restriction of choice may well lower the quality of monitoring independence so that a more
passive compliance, rather than proactive auditing, may be the norm (Vafeas, 2003).
This finding in fact may have implications for the monitoring of a compliance code for cartel
activity. The audit function of the initial risk assessment and identification process might
experience the same problems as other auditing bodies when committee membership defaults to
longer tenures. The committee should have as wide a body of participants as possible, including
outside directors, with change on a regular basis. The tenure of the audit committee thus shares
some aspects of the result for CEO tenure, and this change guards against cartel formation.
Being proactive in anti-cartel is first of all being aware of either regulators or board members.
The “paramount problem” around optimising an oligopolistic market structure is “to devise and
maintain communication systems that permit behaviour to be co-ordinated in the common
interest” (Scherer and Ross, 1990). This communication will solve the two working problems of
co-ordination on price, and enforceability of arrangements in order to stop cheating and
‘chiselling’ (Symeonidis, 2002). Social ties and a ‘homogeneity of values’ can foment collusion
and make design, co-ordination, and cartel agency problems more easily solved (Symeonidis,
2002). An infamous example of board level conviviality producing a cartel was the Gary
Dinners that made for an American steel cartel in the early 20th
century, which made cooperation
between affectionately known competitors “more binding… than any written or verbal
contract” (Scherer and Ross, 1990).
As noted in §2.10, the forces and motivations between internal corporate incentives and market
conduct are very complex. Yet, displaying and communicating control over corporate
governance and internal controls is now a very desirable and incentivised corporate goal. These
forces and motivations have been particularly studied in the context of strategic delegation, but
much less with respect to cartel practices. In particular, if shareholders also may benefit from
collusion, the question of shareholder responsibility in inducing collusive agreement arises. This
study has not investigated these kinds of effects.
234
The literature on cartel formation and collusion more generally has consistently underestimated
the importance of channels and skills in communication that assist the formation and
sustainability of cartel. Economics is mostly concerned with equilibrium outcomes, and not the
dynamic organisational structures and paths of communication by which equilibrium becomes
more likely through exchanges of information. By contrast, this is exactly the type of analysis
called for in legal proceedings investigating collusion. There is a pronounced gap between the
theoretical quality of economics and the practical matter of establishing accountability and
attributing responsibility (Grout and Sonderegger, 2005). This gap may well be one reason why
the frequency of prosecution in some jurisdictions, such as the UK, has been lamentably low.
The fact that the authorities are now more willing to pierce the corporate veil in pursuit of
executive connected to cartel operation is a significant step that firms and executives must bear
in mind with care. The new willingness to pierce the veil is most noticeable around bribery and
fraud activities. For instance, consultancies are not establishing more and more supervisory and
internal audit controls to help with information accuracy, comprehensiveness, and currency, and
hence with regulatory compliance.
Ernst and Young’s (2012) report, Global bribery and corruption fraud risks, describe how the
Securities and Exchange Commission (SEC) recently settled a civil action against a retailer after
two executives were charged in connection with bribery at Brazilian subsidiary, when customs
officials were bribed. While the two executives had no direct supervisory role and absolutely no
operational connection to the subsidiary, and hence had no connection to the improper payments,
the SEC argued that both executives failed to comply with the rigorous terms of the Foreign
Corrupt Practices Act (FCPA), simply by failing to ensure a sufficient level of internal control
(Young, 2012). Could there be a system of internal control that may be expected to police and
act as a deterrent against the risk of cartel formation? This study has made a contribution to
understanding how, and in what comparative measure, CEO and board characteristics do
contribute to cartel formation likelihood.
Research such as this is also being pursued in a wider geographic frame. In China, where
corruption and poor corporate governance have been increasingly recognised, new studies have
shown that board characteristics play a vital role in assuring good corporate governance (Gulzar
and Wang, 2011). Studies have found, as here, that there are significant and positive correlations
between management earnings and CEO / chair concentration power (BOSS in this study), board
235
meetings, female directorships (GENBA % in this study) and concentrated ownership
(FAMCON in this study) (Young, 2012).
Fama’s (1980) well-known analysis of the principal-agent problem dispensed with the
presumption that a firm has a distinctive set of owners, in any definitive sense. The legendary
roles of the ‘entrepreneur’ and of the strong guidance of an owner-leader should also be
contained for the purpose of analysing modern corporate entities of considerable size and
complexity. The two functions usually attributed to the entrepreneur - management and risk
bearing - are taken as naturally separate factors “within the set of contracts a firm is called”
(Fama, 1980). The firm is disciplined by competition from other firms, and this competition
spurs the evolution of management devices (and risk tools) for efficiently monitoring the
performance of the corporate board as well as the CEO. Individual participants including the
CEOs and outside directors, as well as managers, are presented with both disciplinary measures
and opportunities by markets vying for their services, and this form of competition is transmitted
into the firm from without, to operate within the firm (intra-firm competition) as well as outside
it (inter-firm competition) (Fama, 1980).
This is apparently critical since cartel competition exists to nullify first of all, by definition,
inter-firm competition. However, this research has shown that inter-firm competition may be
highly significant in protecting against the risk of cartel formation. That is, female CEO
(CEOgen) and a higher percentage of non-executive directors (NED%) can present an anti-
cartel, competitive effect, in terms of corporate governance, against the constellation of an aged
CEO (CEOage) with not a great deal of tenure (CEOten) left, in all likelihood, who is capable
and prepared to organise a cartel. This study would support the notion that internal competition
over corporate governance, through stable boards with female representation and outside
directors, can balance the risk of cartel formation.
Yet, cartel remains complex and dynamic objects. There may be an apparent explication of why
CEOs and boards might choose to form a cartel, but price dynamics alone are not altogether
sufficient to explain any given cartel in its specific political and social context, as well as in
economic context. The weight of research so far has more or less emphasised how cartels fail,
rather than why they arise (except as price mechanism for market power by oligopolistic forces).
This research has instead contributed to an effort to describe both qualitatively and quantitatively
some of the factors that might precipitate cartel formation, by researching the data and
developing a model of matched cartel and non-cartel firms, and then comparing cartel and non-
236
cartel attributes as to CEO and corporate governance characteristics. As Fear (2007) comments,
the “internal organisational dynamics of cartels needs more research, embedding it in economic,
organisational, and political theory”.
Internal controls comprise a great many delegated and now often automated functions of
corporate governance. Sarbanes-Oxley changed the landscape of corporate governance by
nominating corporate boards as responsible for highly detailed auditing and internal control
processes that must be monitored and assured by the board. Risk management, which used
perhaps to be an arcane mandate of mathematical and economic exactitude, now assumes a far
more system-wide and holistic role, including overall IT and information resources. If boards
make decisions on internal control and auditing, and this responsibility assumes a greater profile
today, as in SOX – how this responsibility could be denominated in respect of internal controls
over cartel formation - remains a subject for more research.
The fundamental question has been who will police the policy in respect of the corporate board
and CEOs of major corporations? There are two paths to supervision. The internal supervisory is
a function of the board, which is supposed to fulfil the remit of policing. The second is of course
external supervision and engagement with public regulators (which also leaves open the question
of who can regulate public entities with equal integrity).
The answer in the past would have been to rely on the integrity of the board, in a passive
manner, and especially a manner that rested on the social and intellectual distinction of the board
and its inferred status, as well as the board’s presumed integrity. There are two problems with
this perspective. Recent history has shown that boards are either corruptible (the old boys’
network adage), or not engaged enough. The frequency of board meetings in some firms can
even be very low. It will be regulators, partly as third parties overseeing contracts that will have
to bear the extra burdens of time and other resources.
Therefore, it is appreciated how the US DoJ has set a highly sophisticated example of how to
disrupt cartel activity using its carrot-and-stick techniques. In tandem with individual sanctions,
amnesty programmes have been developed for individual executives, often to find if multiple
cartel arrangements are in progress. When a firm fixes prices in one market, cartel arrangements
in other markets may well be likely, in the experience of DoJ investigators (LeClair, 2011). The
latest version of DoJ amnesty dispensation, Amnesty Plus, invites executives to disclose all past
and current involvement in collusive agreements, but with increased individual penalties for
237
obstructing justice in a cartel case. The DoJ has embarked on extensive publicity exercises to
broadcast as widely as possible the new risks attached to remaining silent in a cartel case. The
whole culture of cartel disruption by investigatory bodies, if the US lead is taken (and the OECD
is a strong supporter of such a lead) will be to exercise increased pressure on individuals at all
levels, but especially at board and C-suite level. Executive obstruction of justice will be treated
by DoJ investigations as aggravated offences if discovered (LeClair, 2011). Sentences in the US
are of increasing severity, so much so that the average sentence for antitrust offences between
2000–2005 was double that of the 1990s (Cseres, Schinkel, and Vogelaar, 2006). Directors have
been known to lie to firm lawyers for many years as to meetings with competitors (Jephcott and
Lübbig, 2003). This kind of behaviour should become unacceptable.
Studies have now investigated the career path of individual managers who have been involved in
cartel activity. Rosenboom’s (2012) research for instance focussed on Holland, where the usual
EC penalties (10 percent of overall global revenue) and personal fines up to € 450,000 are turned
into public information. The effect is to exert reputational damage and a strong negative effect in
career progression. The study uses binary and multinomial logit modelling techniques similar to
those used in this study. Rosenboom showed that reputational damage is in fact linked to
subsequent career damage, and that by extension, more grievous reputational damage will have a
greater deterrent effect on individual managers who may be tempted to engage in cartel activity.
Since cartel activity is increasingly a strategic management choice in a globalised environment,
where the temptations may be considerable and the cloaking and difficulty of investigation
effects of international collusion may be great, Rosenboom’s findings are also significant for
CEO and management deterrent.
Increasing the individual punishment factor to include jail sentence would be expected to have a
large effect. Since this study has found that individual CEO characteristics have a large effect on
the likelihood of cartel formation, responding with individual sanctions that deliberately
undermine the reputation of individuals, meaning jail sentences even of minimal length, could
have significant deterrent effects. Further research is called for to help quantify and qualify just
how jail sentences have career effects, but of course, research in the US where sentencing is
more routine, does show that recidivism is a very rare event. Europe thus has much to learn in
developing a comparable punishment regime to match that of American experience (as well as
learning from the leniency programmes which also can affect individual behaviour).
238
Corporate governance is an effective tool for maintaining performance and safeguarding the
corporate financial security of firms, and this is especially critical in emerging and privatising
economies. These kinds of economies (including those in China) are generally exposed to higher
external risks, operational transitions, and diversification (Dharwardkar, George, and Brandes,
2000). The proper scope of corporate governance in agency theory is limited to the relationship
between managers and owners of the firm. Agency costs include those involved in shareholders
monitoring the performance of managers. Yet, designing a contract to eliminate all possible
sources of agency risk is impossible (Jensen and Murphy, 2004). There will always be agency
risks involved in the limited firm form of organisation. Agency theory requires good corporate
governance tools, techniques, policies and procedures to minimise agency costs. This study, by
providing a new empirical tool, could contribute to monitoring the risks of collusion, especially
in developing countries, and help investors or other firms with decisions around investment,
whether capital or foreign direct investment.
Firms will also do well to examine the risk of inadvertent cartel activity. A leading UK antitrust
lawyer, Luke Tolaini, advised that the new UK measures mean employees might go to jail for
inadvertent behaviour. Deliberate price fixing may offer a clear example, but more subtle and
less blatant cases might arise, and hence “employees at risk really need to be trained in what
they can and can’t do when it comes to communications with competitors” (Chadderton, 2012).
Training around cartel provision will need to be increased amongst firms. Boards should also be
aware that sudden price changes and employee familiarity with competitors’ strategies, or
meetings with competitors, need to be investigated (OFT, 2010). It is also worth noting that
compliance programme may well act as an aggravating factor in the imposition of any fine
(Jephcott and Lübbig, 2003).
Moreover, a firm facing cartel-related exposure must navigate a path laden with pitfalls: varying
obligations and exposure across jurisdictions; risk of cross-jurisdictional disclosure even without
a waiver; and the fact that amnesty or leniency in one jurisdiction does not ensure amnesty or
leniency in another. Firms must carefully evaluate the conflicting incentives and complications
around cartels, and develop a sophisticated global approach to mitigate cartel-related exposure
with a comprehensive compliance programme (Fishbein, Kafele and O’Neill, 2012). Given that
fines are likely to rise, as evidence mounts that the deterrent effect is wholly sub-optimal, the
implementation and adaptation of a compliance code will only become more pressing (Lande
and Connor, 2011).
239
6.3 Corporate Anti-Cartel Compliance Programme
There are five basic elements that have been identified as pivotal to a comprehensive compliance
code program (Furse and Nash, 2004):
i. Audit function – This is a broad based assessment of what firm activities might actually
be subject to competition law. As such, the audit is a risk identification procedure.
The audit is to be conducted by either firm or external lawyers with advanced
knowledge and experience of competition law. An audit can identify prospective
problems that could potentially be of significance in relation to competition law. The
audit should cover both the civil/ administrative and criminal law elements of the
appropriate legislation. Separating out civil from criminal codes and sanctions is not
advised, and sends the wrong signal that there are lesser penalties for some forms of
cartel activity. Familiarity with the firm, the market, and market dynamics would be
essential to establish a baseline standard of transparency that should grow in time.
Questionnaires directed to senior management and board personnel, as well as the
CEO, shall seek out relevant financial and corporate information, plus the internal
perceptions of firm activity. An acfirming document should provide a description of
competition law and typical cartel terminology, including typical cover phrases that
disguise cartel operations. As a distinct form of audit practice, there should be special
focus on the sales and marketing departments, since these employees have the
greatest volume of communication exchanges with other firms and competitors.
Private contracts over intermediate products (such as the lysine cartel) present
especially higher (structural) risks of cartel formation. Past problems and personnel
likely to be involved should be focus points. Areas of high, medium, and low risk
activity can be identified and placed in a special risk register, using “examples of
activities that raise competition law risk” (OFT, 2010).
ii. Risk assessment – The risk assessment draws on the audit to measure and balance out
the potential consequences of those activities affected by competition and cartel
offences in the civil and criminal spheres. Jurisdictional differences such as the de
minimis condition of EU legislation (not applicable in the US) should be made clear.
A cost benefit analysis in the EU might persuade a firm that a risk is acceptable since
the threat of detection and penalties may be lesser than abandoning a specific activity.
However, criminal sanction will have to be assessed on different as well as more
240
intangible merits. The reputational costs to senior management and the firm, and
incarceration for senior management, may be too imperative in certain jurisdictions to
allow any, even minor dispensation, towards cartel activity. Either the activity
triggering cartel offence sanctions is terminated or notification given to the relevant
authority of the arrangement with an application for exemption from e.g. EU Article
81. The risks associated with continuation of the activity, and concealment, including
the destruction of evidence, should be made clear, including terms of imprisonment
and personal fines.
iii. Modifications in organisational behaviour and responses to competition law using the
findings of the audit and risk assessment. The design and implementation of any
compliance programme depends heavily on proper sponsorship by C-suite executives
and senior management through mission statements including norms and values
expected of the organisational culture of the firm. A code of ethics can be used to
achieve a similar effect of high expectations in regard of organisational behaviour.
The expectations must be placed upon all relevant employees and directors. The
expectations of full compliance with the law might also be contained in written
undertakings in employment contracts which allow for disciplinary proceedings
should an employee be found to have engaged in cartel activity. Specific conduct
modifications after the fact of the initial setting of policy must also be formalised and
written down in redesigned policies. The board and ethics committee should maintain
sufficient autonomy from the CEO and senior management in respect of
independently monitoring code compliance, and be offered sufficient resources and
authority to implement that monitoring role with exactitude and authority.
iv. Training. Once suitable policies are in place, training must be at the heart of the risk
mitigation process. The risk assessment of the firm’s activities must be fully
understood by all employees, and that either intentional or negligent breaches of
cartel law can command an assortment of disciplinary, civil and potentially criminal
sanctions. Training, as well as notifying employees of the adverse effects of cartel
infringements, should also stress building employee confidence over ‘the rules of the
game,’ and stimulate an ethical business culture with reputational advantages to the
firm. The same training can include and augment many other forms of compliance,
over anti-bribery, corruption, internal fraud, or health and safety and environmental
issues. All new employees should be trained in the code. More generally, the details
241
of the law itself should be available for further inspection. The firm’s attitude should
be proactive and reinforced by follow-on training sessions for all staff. The firm shall
take account all relevant legal and market developments as well as evolving global
and industry standards to update and adopt the compliance code as necessary to
ensure its continued effectiveness. In particular, all members of the board should be
completely familiar with current requirements for code compliance. Periodic testing
of employees’ knowledge of competition law should be undertaken. In particular,
testing can focus on the particular risks on non-compliance with certain firms in
certain market positions. For instance, the risks of cartel involvement are different for
small player in very large markets compared to dominant firms (OFT, 2010). Joint
ventures and co-operative arrangements may need special diligence and training.
Training by ‘box-ticking’ for all employees without distinction of roles and risk
exposure, or a ‘one size fits all’ approach to compliance can in fact be
counterproductive (OFT, 2010: 28). Complex matters of competition law, including
intellectual property and patent abuse, should be covered as appropriate.
v. Cultural change if necessary, along with proper evaluation of current behaviour and the
identification of improvements and gaps, with an action plan to remedy current or
potential shortcomings. The issue of cartel code compliance should be a regular point
of discussion at board and senior management meetings. An ethics committee may
encourage and support anti-cartel policies at every level of firm activity, including
subsidiaries. Compliance and reporting potential violations of compliance should
become the duty of employees at every level of the firm. Confidential reporting
channels and amnesty programmes should be developed. The OFT recommends
appointing a ‘compliance champion’ so that responsibility and accountability is
further personalised and has a focus point in the organisation, at the same time as
code compliance develops as a general norm (OFT, 2010: 18). Violations of
competition law at any level should be immediately reported to the authorities. The
allowable scope of communications and relations with competitors, and within trade
associations, should be understood. Communication records should be treated on a
potential evidentiary basis, and procedures for handling ‘smoking guns’ must be
formalised. Ultimately, management by exception (C-suite takes over from senior
management only in more egregious examples) of non-compliance is no longer an
acceptable practice.
242
6.4 Chapter Summary
This chapter highlights the results laid down in Chapter Five to offer specific answers to the
research questions. A cartel is a response of the firm to the increasingly competitive and
challenging environment. This study tackles how human and organisational factors can
potentially exacerbate or reduce the formation of cartel. Globalisation, modernisation processes,
and technological advancement increased the opportunities and potential benefits of cartel
formation. The link between corporate governance and market competition demonstrates the rise
of complex international competition prevailing in the current global environment, which
therefore ushers the formation of cartels. Contacts amongst firms have been raised by new
information technology and the rise of globalisation, which characterise the new dynamics of
strategic business management in a globalised system. Optimal governance structures are likely
to characterise firms surviving the competition, whilst failure and demise are the potential
outcomes for those who fail to adapt their corporate governance structures to the rapidly
changing business environment.
Before the upsurge of cartel scandals, firms were not assessed solely on financial performance
criteria but also on analysis of boards and CEOs. The study has focused not on competition law
or the nullification of market strategies, but on how organisational culture in a cartel
arrangement is created and practiced by multiple firms.
The persistence of some objective quality of corporate governance is seen in the recidivism of
several firms participating in multiple cartel arrangements, which is in part dependent on the
market environment, as shown by the HHI index. Amongst firms with given board and CEO
characteristics, a hidden tendency to cartelise competition is indicated. In order for a cartel to
persist, it is important for the board, the CEO, and other organisers to bargain for its duration.
This study identifies the dependent variable as detected and non-detected cartel firms and those
not in cartels at all. However, firms not committing cartels cannot be absolutely discounted of
the possibility of cartel commission just because no detection had taken place, but it is also
possible that they too are into cartels but have not been detected. The concept of ownership
concentration amongst cartel firms is demonstrated in this report. Such ownership concentration
operates in firms’ collusion within the globalised environment.

243
In terms of cartels and compliance code needs, there exists corporate anti-cartel compliance
programme, which includes audit function, risk assessment, training, organisational behaviour
modifications and responses to competition law, as well as cultural change and proper evaluation
of current behaviour.
The next chapter provides a summary of research results, recommendations, limitations of the
research, suggestions for future research, and conclusion, finalising the findings and insights for
this study.
244
Chapter Seven
Summary and Conclusion
7.1 Introduction
This chapter summarises this research study and its key findings. It will be structured as below:
1. Summary of the research results
2. Research recommendations
3. Limitations of the research
4. Suggestions for future research
5. Conclusion
7.2 Summary of Research Results
Fifteen propositions and main findings of their tests are summarised in Table 7.1. The results
generally suggest that there is a relationship between corporate governance attributes and cartel
formation.
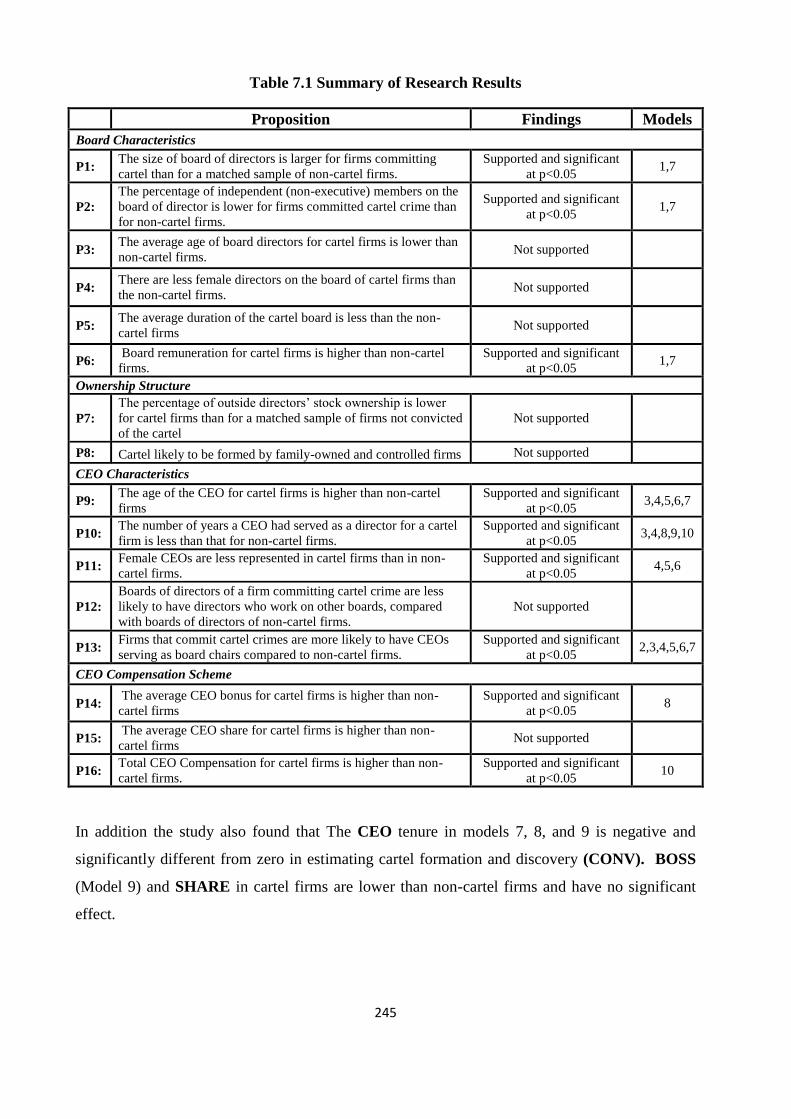
245
Table 7.1 Summary of Research Results
Proposition Findings Models
Board Characteristics
P1: The size of board of directors is larger for firms committing
cartel than for a matched sample of non-cartel firms.
Supported and significant
at p<0.05 1,7
P2:
The percentage of independent (non-executive) members on the
board of director is lower for firms committed cartel crime than
for non-cartel firms.
Supported and significant
at p<0.05 1,7
P3: The average age of board directors for cartel firms is lower than
non-cartel firms. Not supported
P4: There are less female directors on the board of cartel firms than
the non-cartel firms. Not supported
P5: The average duration of the cartel board is less than the non-
cartel firms Not supported
P6: Board remuneration for cartel firms is higher than non-cartel
firms.
Supported and significant
at p<0.05 1,7
Ownership Structure
P7:
The percentage of outside directors’ stock ownership is lower
for cartel firms than for a matched sample of firms not convicted
of the cartel
Not supported
P8: Cartel likely to be formed by family-owned and controlled firms Not supported
CEO Characteristics
P9: The age of the CEO for cartel firms is higher than non-cartel
firms
Supported and significant
at p<0.05 3,4,5,6,7
P10: The number of years a CEO had served as a director for a cartel
firm is less than that for non-cartel firms.
Supported and significant
at p<0.05 3,4,8,9,10
P11: Female CEOs are less represented in cartel firms than in non-
cartel firms.
Supported and significant
at p<0.05 4,5,6
P12:
Boards of directors of a firm committing cartel crime are less
likely to have directors who work on other boards, compared
with boards of directors of non-cartel firms.
Not supported
P13: Firms that commit cartel crimes are more likely to have CEOs
serving as board chairs compared to non-cartel firms.
Supported and significant
at p<0.05 2,3,4,5,6,7
CEO Compensation Scheme
P14: The average CEO bonus for cartel firms is higher than non-
cartel firms
Supported and significant
at p<0.05 8
P15: The average CEO share for cartel firms is higher than non-
cartel firms Not supported
P16: Total CEO Compensation for cartel firms is higher than non-
cartel firms.
Supported and significant
at p<0.05 10
In addition the study also found that The CEO tenure in models 7, 8, and 9 is negative and
significantly different from zero in estimating cartel formation and discovery (CONV). BOSS
(Model 9) and SHARE in cartel firms are lower than non-cartel firms and have no significant
effect.
246
Moreover, Board size (Sizeba), board duration (DURBA) and non-executive directors
(NED(%)) have a significant difference between UK cartel firm-home and UK cartel firm-
abroad in terms of board characteristics. Board age (AGEBA), gender of the board (GENBA
(%)) and outside ownership (OUTOWN (%)) have no significant difference based on p-value of
0.05.
CEO Characteristics, CEO tenure (CEOten) and CEO age (CEOage) demonstrate a significant
difference along with CEO compensation. The size of the board (SIZEBA) and board duration
(DURBA) indicate a significant difference at p<0.05, along with the age of the board at p<0.01.
7.3 Research Recommendations
Recommendation 1: All firms should maintain a compliance code in respect of anti-cartel
expectations.
Internal management controls must both incentivise and constrain managers to remain within the
limits set in firm law, but if these controls are not in place, identifying accountability becomes
far more difficult. Accountability is obfuscated by having poor internal controls, and these
controls may be left deliberately diffuse at senior levels of management. Other “professional
hiding techniques” and “indemnification methods” would include finding low-level scapegoats,
and contractual insurance as a bonus or benefit that contains a clause to leave the firm with
immediate effect if antitrust proceedings could have any ultimate personal consequences (Cseres
et al., 2006). These types of omissions and escapes must be avoided, and a compliance code will
go some way to eradicating lapses and corrupt practices such as these types of arrangements.
In the Hampton Review in the UK, it was found out that too many forms and duplication of
regulatory activities placed a significant burden not only on the regulated third party, but also on
the regulator, and degraded the efficiency of regulation. The development of a risk register on
potential cartel activity could alleviate some of these burdens on regulators, who often, are
woefully under-resourced, especially in regard to investigating complex and international
arrangements of hidden collusions.
Recommendation 2: Data related to potential cartel arrangements should be proffered by firms
and made obligatory by regulators in order to alleviate the burdens of sector inspections in
competition reviews.

247
Firms that have no history of cartel activity and which have developed anti-cartel compliance
codes would obviously benefit from lighter touch inspections. The carrot and stick approach
should also include how data is collected. The research conducted in this study encountered a
range of difficulties assembling a comprehensive set of data on cartel activity alongside CEO
and board characteristics. Any accurate risk assessment process automatically requires
comprehensive and current data to be effective. Knowing that regulatory data now include CEO
and board characteristics would place more effective supervisory pressures on CEOs and boards
to not engage with cartel activity. Accountability will be enhanced by improved and
comprehensive data collection.
Studies have detected tacit or secret collusion using econometric techniques that only require
average price data and a minimal amount of other data (Ganslandt, et al., 2007).This study
performs a similar function in respect of organisational data, but the assembly of such data
remains a substantial opportunity cost for researchers. Hence one of the recommendations of the
study will be not only around co-operation of leniency or sanctions, or other matters of
disciplinary policy, but also around information, and the kinds of information strategies that
national and international authorities will require to publish as regular schedules, if anything like
real time risk assessment, or detection of collusion is to become more likely.
Recommendation 3: Cartel should be distinguished between hard-core and crisis cartel.
Leniency programmes should reflect the distinction. A categorisation procedure for labelling
cartel as ‘hard-core’ should be followed and extra remedies applied in the aftermath in terms of
transparency, this would include board and CEO characteristics. A board that has previous cartel
experience and goes on to commit further recidivist acts of cartel activity should be punished
with extra and punitive sanctions.
Recommendation 4: Sanctions should be capable of deterring firms, including board members
and CEOs, from cartel participation; lifetime bans on board participation or CEO responsibilities
should be considered for the most egregious hard-core cartel arrangements.
The cartel offence in the UK set out within Part VI of the Enterprise Act of 2002 remains the
single piece of UK competition law to be criminal in nature, with breaches facing prison terms
of up to five years (and unlimited fines). The act is stand-alone, and not connected to other
competition laws, and is directed at individuals, not corporate entities. The same board directors
248
in breach of the Act may also be disqualified, and it is this latter punishment that is reckoned to
have the maximum impact on rates of compliance. The cartel offence is sufficient grounds alone
for disqualification, although this is a recent phenomenon (Furse, 2004). The director of a firm
found to have breached the law may also be found “unfit to be concerned in the management of
a firm” (Furse, 2004). This is upheld even if only the omission of action against the breach is
found, where reasonable grounds would have suspected the matter of the breach, or the director
had direct responsibility and should have known the breach. Competition disqualification orders
or undertakings (CDO / CDU) can follow, with the disqualification period potentially reaching
15 years. There is a great deal of discretion in such arrangements, perhaps too much for the
maximal deterrent effect on individual CEOs and board members.
To separate hard-core from other forms of cartel, and especially the so-called ‘crisis cartel’ is
one recommended distinction of contemporary thinking on the subject of cartel. Cartel do not
always have a uniformly destructive intent or purpose. In economic crises, the national and
international competition authorities maintains an advocacy role for enhancing competition but
when price and market volatility, (and the consequences of that volatility), become severe
(especially for poorer producers), then ‘crisis cartel’ may be accepted as a viable practical
alternative that may have some merit as a temporary remedy to market volatility. Other
intervention measures should be considered, amongst them financial market and credit
alternatives (OECD, 2004). However, the results of this study show that a focus, like U.S. DoJ
practice, should be maintained on individual CEO and board responsibility.
The outcome or ‘Response’ by the UK Government’s Department for Business, Innovation and
Skills (BIS) to its own competition review created much controversy with lowering the criminal
standard for the UK cartel offence. Critics have recently berated the dangers of lowering the
standard since expanding the scope of criminal behaviour is dangerous, merely to expedite
prosecutions. Patel and Gottlieb (2012) point to the injustice of prosecuting “mid-level
executives who may not be privy to the full commercial impact of their actions”. Therefore, the
legal fraternity and government are expanding the organisational scope of cartel offences to sub-
CEO and sub-board levels of management. This in fact should be encouraged.
The OECD’s (2002) new lead on this change – “individual sanctions can strengthen the
incentive of directors and employees to resist corporate pressure to engage in unlawful activity,
and thus enhance the level of deterrence”– is partly spurred by how individuals in the US went
to great lengths, and offered to pay punitive levels of fines, to avoid prison.
249
Recommendation 5: Co-operation and policy formation amongst countries should be
considerably expanded so as to facilitate the detection of international cartel activities.
By necessity, with the GATT and WTO reduction and dismantling of tariff barriers, competition
is seen by CEOs and directors through a thorough “international lens” (LeClair, 2011). This
internationalisation process has indeed changed the way cartels co-operate and how competition
laws must be regulated and enforced. First, regulation and investigation will often involve
domestic and foreign firms. Disclosing and sharing confidential commercial information, as part
of a prosecution, must be done with utmost care, in consideration of foreign legislation
negotiated in parallel between foreign regulators (LeClair, 2011). This may lead to inefficiencies
as well as unfamiliar complexity. Different sanctions in different jurisdictions also raise
questions of justice. The OECD has strongly supported harmonisation of domestic privacy laws
in connection with antitrust investigations (LeClair, 2011: 107).
Recommendation 6: The group total turnover rule should be applied with greater consistency
and frequency.
Attributing liability to a parent firm has potentially significant consequences for all firms with
economic activity in the EU (Atlee, Botteman and Joshua, 2012):
i. The maximum fine limit of 10% of global turnover now applies to aggregate group sales
on a global basis as a single economic unit, which means subsidiaries can be jointly
and severally liable for fines, which would finally become times the limit that would
have applied to them as separate economic units.
ii. The risk of discovering recidivism, i.e. CONV>1 - which can attract more punitive levels
of fines – will now automatically increase if any previous cartel activity amongst
subsidiaries could potentially be taken into account (Atlee et al., 2012).
The expectation is that deterrence effects will be raised. The deterrence signal and threat of
sanctions applied to large firms and especially multinationals will be watched and incorporated
into an organisational culture when in fact “total group turnover is taken as the yardstick” (Atlee
et al., 2012). The actions of subsidiaries would be accountable, and then court decisions taken
against parent firms could make filing civil damages more plausible and financially viable. In
such a regulatory and legal environment, the imperative to recreate an anti-cartel culture across a
whole organisation, with all that implies for C-suite sponsorship, resource commitment and new
250
norms and values, will be much more easily promulgated. This approach to deterrence and
prosecution has been lacking in the UK.
Recommendation 7: As the UK authorities acknowledge, there should be greater sharing of
expertise or secondments in order to improve case management”, precisely in order to bring a
proactive competition perspective to sectoral regulation, instead of only more passive
administrative regulation (such as monitoring mergers and acquisitions, and concentration
indices, as the main pro-competition features of any sector) (Business Innovation and Skills,
2012). The expansion of these exchanges on an international front should be sponsored by
governments, but there is much to be done at national levels.
Recommendation 8: Sspecialist risk assessment tools should be used and shared between
countries in order to make regulation and investigation more efficient and less costly to firms
and regulators. Bilateral and multilateral consultations over risk assessment procedures should
be formalised and established on a regular cycle.
For instance, in this study, a risk assessment procedure could have been developed from
grouping CEO and board characteristic risk factors, and plotting the two aggregates on a graph
with a 2x2 matrix overlay. An example template is given in Appendix 9.
Recommendation 9: Records of cartel activity and sanctions against any single firm should be
placed in the international domain, in a specialist register for access by sanctioned public bodies
and researchers.
The difficulty in espousing transparency in corporate governance, partly for mitigating the
agency problem by information symmetries between principals and agents, is that the business
and managerial world is tirelessly inventive and improvisational. In oligopolistic markets, some
incentives induce income smoothing that allows shareholders to enjoy high collusive profits, and
the low-powered managerial incentives are “optimal” in how they induce behaviour that
ultimately maximises firm profits. Increased transparency through Corporate Governance “codes
of best practice” may then have negative consequences, if those measures reinforce the pro-
collusive effect of increasing the cost – or prevent entirely – a secret renegotiation of top
managers’ compensation. Like all monitoring regimes, with too great an intensity of
surveillance, all kinds of behaviour are driven ‘underground’, and these can even exacerbate
milder forms of corporate abuse, including less hard-core cartel formation. Therefore, one of the
251
messages of the empirical research could be that only very high risks of the more egregious
collusive behaviour should be recorded and policed, at least to begin with.
Recommendation 10: More specialist risk assessment research should be funded into the
organisational cultures and structures that facilitate cartel formation. Recognition should be
made that the regulative, normative and cognitive-cultural aspects of cartel activity must be
investigated along with traditional economic activities.
Recommendation 11: In relation to Recommendation 10, cartel culture can be reproduced, like
any other form of corporate culture, by hiring practices. The power of CEOCASE and
CEONUM to basically predict recidivist behaviour is striking. There should be research in
human resource management studies as to how those CEOs and board members who have
participated and facilitated cartel activity, were actually recruited. How corporate action is
embedded within social networks assumed almost the status of conventional wisdom in
organisation theory throughout the 1980s, with the rise of ‘economic sociology’ that criticised
the ‘under socialised’ quality of economics in general (Granovetter, 1985). Inter-corporation
links between directors have since then attracted a significant amount of attention (Davis and
Robbins, 2004). Examining such links around cartels from a human resource management
perspective may be instructive. Remuneration and rewards have been studied in depth in the
research, and this research has also included remuneration (REMUN) as a factor in cartel
formation. Empirically speaking, the size of remuneration effects (around -0.03) was much
lower than many of the other effects such as gender. The investigation of cartels could and
should also be extended further back in time to the recruitment processes of cartel firms, and
whether or not boards and CEO positions are publicly advertised, or whether the positions are
filled with private sponsorship of known individuals. The successes of “carrot-and-stick”
policies – invoking harsher penalties for cartel ringleaders and instigators, but improving
programmes designed to reward defecting cartel members who then co-operate with competition
authorities, should be extended. Data collection should follow through on how changes in CEO
and board personnel follow from both carrot-and-stick approaches.
252
7.4 Limitations of the Research
Corporate governance is certainly rising in interest with “truly interdisciplinary” research
undertaken by researchers not only in the fields of economics and finance, but also in law,
management, and accounting (Bebchuk and Weisbach, 2010). The relationship between
corporate governance practice and cartel, in a time of rising cartel activity, deserves more
research, which must be of an interdisciplinary kind.
In this study, the internal control environment is focussed on board characteristics and not on
board decisions or activities. The model is a static model of board and CEO characteristics.
Empirical studies, such as this one, are insufficient to extract the dynamic measures of personal
force that all cartel, and especially sophisticated cartel, must muster in their lead organisers.
Chen (2008) revealed how a CEO’s delegation of authority over collusion, and the decision-
making in connivance of collusion, can actually mitigate the temptation of a subordinate to
renege or whistle blow on the cartel. Thus, CEOs and board members may use their personal
influence, and charisma, to trap others in a cartel and its maintenance, by effectively ‘framing’
the subordinate as an active participant in the cartel. This is added to the research indicating that
minimising the maximum temptation to renege on assumed active participation, or a relational
contract, is the best strategy for cartel longevity (Baker, Gibbons and Murphy, 2002). The
CEO’s personal charisma and influence is critical in these matters, and of course will remain an
elusive characteristic to model.
Also, in hierarchical but decentralised firms, the exposure of top executives, such as CEOs and
board members, is often minimal compared to that of senior managers (Chen, 2008). However,
there is little data as yet on individuals in cracked cartel. This study is one effort to supplant that
lack. One study found only two firms from nine where top executives had decision-making roles
in collusion, within a study of decentralised firms (Harrington, 2006a). Therefore, the data here
could be further checked whether or not this feature of collusion exists in the data set.
In common with most empirical studies, this research considers known cartels as well as those
not detected but might also be involved in cartelisation. The dependent variable (CONV) which
separates those firms that formed cartels that were detected from all other firms some of which
were not in cartels and other which were in cartel but were not detected/ discovered. The non-
cartel firms however, might also be in cartel but have not been discovered/ detected, which
cannot qualify them to be called "cartel firms" in this study. Therefore, there is a possibility that
253
some of the non-cartel firms in this study are already in undetected/ undiscovered cartel. Most
cartels then are clandestine in their co-ordination and organisation of cartel activities, as would
be expected. Cartel members typically attempt to cover up or destroy evidence of their meetings
and communications. Suggestions in the cartel literature are that only about 10% to 30% of all
such conspiracies are discovered and punished (Connor, 2008).
Undiscovered cartels may be more durable or may differ in some other economic characteristics,
but it is also possible that discovery is tied only to managerial personality characteristics (e.g.,
the tendency to become a whistle-blower), which are distributed disproportionately to discovered
cartels. If the latter is true, then the discovered cartels in this report may be representative of the
majority of cartels that are hidden. However, much more research will be needed into how cartel
duration is helped by CEO and board characteristics. The bargaining power of CEOs and boards
to effect a working cartel arrangement would need studies in greater depth, but of course this
will be a difficult study to engage with for any CEO or board member who wishes to continue
with a corporate career.
Firms right now resort to codes to dissemble over firm names, plus encryption software,
anonymous mailboxes including email, and select use of memory sticks instead of desktops, and
encrypted mobile communications, all to secure secret co-ordination of the cartel (Whish, 2009).
This research has contributed to the organisational dynamics of firms, but some of these
technical issues need more research as part of organisational culture that rely on technology for
illicit activity.
The study is also dominated by UK firms. There can be little doubt that the profile of CEO and
board characteristics as well as ownership structure would shift for a study dominated by
Chinese firms for example, where it is well known collusion and secret networks of influence
have led to expropriation and price fixing schemes. The field of research remains to be opened
onto the Asian experience of cartel operation, and with the rise of the BRIC economies (Brazil,
Russia, India and China); this research could have some influence on policy directions for a
global economy.
254
7.5 Suggestions for Future Research
Even though the results of this research provide evidence that a number of corporate governance
attributes are significantly related to cartel formation, there are several areas that are not covered,
although that might be relevant to corporate governance and the formation of cartel.
One of the possible avenues for future study is testing other corporate governance attributes that
might aid the cartel formation, such as the audit committee and institutional investor.
An additional avenue for future research is to test the period post cartel (after) conviction and
compare it with the period pre-cartel formation (before). In this study, the focus was only on
period pre-cartel formation. However, it will be beneficial to compare the corporate structure for
firms’ post cartel convictions to see if there are any corporate governance changes.
Another possibility for future research is to test the corporate governance structure for multiple
abusers (recidivism) and single abusers, to find out whether or not there is a visible difference
between their corporate governance structures.
7.6 Conclusion
This chapter presents a summary and conclusion of this study. The results are summarised and
their recommendations are discussed. The potential limitations then are presented before the
avenues for future research are highlighted.
This study utilises cartel firms from an original data set of 1,901, with highest representation
from UK firms, thereby supporting the decision to use UK firms as the focus of the study.
There are a total number of 150 cartel firms involved, of which 114 are from the UK. The
study purports to determine which characteristics of the participating firms’ boards of
directors are associated with cartel formation and discovery. The results confirm that there is
likelihood amongst public firms to engage in cartel agreements than private firms. This study
identifies the attributes of corporate governance, which are grouped in four types as the
following: board of directors’ characteristics, ownership structure, CEO characteristics, and
CEO compensation package.
255
The challenge of this study is that the personal attributes of CEOs and boards can make a
significant contribution to the risk profile of a cartel being formed. This indeed would be to
‘diagnose’ organisational culture in a quite radical direction. The study suggests and finds that
some corporate governance attributes are associated with cartel formation. The results reveal
consistency with prior researches, that cartel firms have different corporate governance
relative to a control sample in the three years prior to cartel formation. Specifically, the study
concludes that cartel firms characterised by having larger board size compared to non-cartel
firms; lower percentage of independent member (non-executive); higher average of board
remuneration; less likely that cartel firm is owned and controlled by family; older CEOs
represented on the board; having CEO who served a less number of years as a director; less
likely to have a female CEO represented; more likely to have CEOs who’s combined CEO-
chairman position; and a higher average of CEOs bonuses and compensation packages.
The main contribution of this research is to fill-in the existing gap in the literature on the
relationship between corporate governance attributes and cartel formation. This study provides a
contribution to understand how, and in what comparative measure, board characteristics, CEO
characteristics and ownership structure do contribute to cartel formation likelihood. By
providing an empirical instrument, this study may also contribute to monitoring the risks of
collusion. The findings also consider the requirements for disclosure of corporate governance
practices.
256
Bibliography
Abreu, D. (1986) External equilibria of oligopolistic supergames. Journal of Economic Theory,
39 (1): 191-223.
Abreu, D., Pierce, D. and Stacchetti, E. (1985) Optimal cartel equilibria with imperfect
monitoring. Journal of Economic Theory, 39 (1): 251-269.
Adams, R. and Ferreira, D. (2003) Diversity and incentives: evidence from corporate boards.
University of Stockholm. Working Paper.
Adams, R., Almeida, H. and Ferreira, D.,(2004) ‘Understanding the relationship between
founder-CEOs and firm performance’, Working Paper .
Adams, R., Almeida, H., and Ferreira, D. (2005) Powerful CEOs and their impact on corporate
performance. Review of Financial Studies, 18 (4): 1403-1432.
Adams, R., Hermalin, B., and Weisbach, M. (2010) The role of boards of directors in corporate
governance: A conceptual framework and survey. Journal of Economic Literature, 48 (1):
58-107.
Agarwal, S., J. C. Driscoll, X. Gabaix, and D. Laibson (2009) The age of reason. Financial
decisions over the life-cycle with implications for regulation. Brookings Papers on
Economic Activity, Fall 2009, 51-117.
Agrawal, A., and G. Mandelker (1990) Large Shareholder and the monitoring of manager: The
case of anti- takeover charter amendments. Journal of Financial and Quantitative Analysis,
25 (2): 143-161.
Agrawl, A., Jaffe, J. F., & Karpoff, J. M. (1999). Management turnover and governance changes
following the revelation of fraud. JL & Econ., 42, 309
Alder, H. Jr and David J.L. (1997) The explosion of international criminal antitrust enforcement.
Business Crime Bulletin: Compliance and Litigation, 4 (2).
Alderfer, C.P. (2004) Understanding and consulting to family business boards. Family Business
Review, 1(3), 249-261.
Alderman, R. (2009) An update from the serious fraud office: the way forward. Speech at the
Midland Fraud Forum. Birmingham, February.
Alexander, C.R. and Cohen, M.A. (1999) Why do corporations become criminals? Ownership,
hidden actions, and crime as an agency cost. Journal of Corporate Finance, 5 (1), 1-34.
Ali, A., T. Y. Chen, and S. Radhakrishnan. (2007). ‘‘Corporate Disclosures by Family Firms.’’
Journal of Accounting and Economics 44: 238–286
Allen, F., Douglas, G., (2000). Corporate governance and competition. In: Corporate
Governance Theoretical and Empirical Perspectives. Cambridge University Press,
Cambridge.
Allen, G.C. (1966) The structure of industry in Britain. Second Edition. London: Longman.
257
Allen, William, (1992), Redefining the role of outside directors in an age of global competition,
in Robert A.G. Monks and Nell Minow, eds.: Corporate Governance (Blackwell,
Cambridge, MA).
Alonso, P., Palenzuela, V., Iturriaga, F., (2000)“Managers’ discretionary behavior, earnings
management and corporate governance: An empirical international analysis”, Working
Paper, Universidad de Valladolid.
Amihud, Y., and Lev, B. (1981). CorporationRisk Reduction as a Managerial Motive for
Conglomerate Mergers. The Bell Journal of Economics, 12(2), 605-617.
Anderson, C. A. and Anthony, R. N. (1986). The new corporate directors: Insights for board
members and executives (New York: Whiley).
Anderson, C., Jayaraman, N., and Mandelker, G. (1992) Top management change and corporate
performance: Evidence on Japanese firms. University of Pittsburgh, Oakland. Working
Paper.
Anderson, R. C., and D. M. Reeb. (2003). ‘‘Founding-Family Ownership and Firm Performance:
Evidence from the S&P 500.’’ Journal of Finance 58: 1301–1328.
Anderson, R. C., and D. M. Reeb. (2004). ‘‘Board Composition: Balancing Family Influence in
S&P 500 Firms.’’ Administrative Science Quarterly 49: 209–237
Anderson, R.C., Mansi, S.A., and Reeb, D.M. (2004) Board characteristics, accounting report
integrity, and the cost if debt. Journal of Accounting and Economics, 37 (3): 315-342.
Andreas, S. (2008) The UK cartel offence: Lame duck or back mamba? ESRC Centre for
Competition Policy and Norwich Law School, University of East Anglia. CCP Working
Paper.
Antia, M., Pantzalis, C., and Park, J. (2010) CEO decision horizon and firm performance: An
empirical investigation. Journal of Corporate Finance, 16 (3): 288-301.
Ararat, M., Claessens, S., and Yurtoglu, B. (2011) Synthesis report: Third international
conference on corporate governance in emerging markets.
Astrachan, J. H., and M. C. Shanker. (2003). ‘‘Family Businesses’ Contribution to the U.S.
Economy: A Closer Look.’’ Family Business Review 3: 211–219.
Atlee, L., Botteman, Y. and Joshua, J. (2012) Cartels and leniency. The European Antitrust
Review, 37 (2).
Aubert, C. (2007) Instruments for cartel deterrence and conflicts of interest. In J. Stennek (ed.)
The political economy of antitrust (Contributions to Economic Analysis, Vol. 282). Emerald
Group Publishing Limited, pp. 123-148.
Aubert, C., Rey, P., and Kovacic, W. (2006) The impact of leniency and whistle-blowing
programs on cartels. International Journal of Industrial Organization, 24 (6): 1241-1266.
258
Australian Competition & Consumer Commission, (2009). ACCC approach to cartel
investgations.
Bagwell K. and Staiger R. (1997) Collusion over the business cycle. Journal of Economics, 28
(1): 82-106.
Bain, J.S. (1949) A note on pricing monopoly and oligopoly. The American Economics Review,
39 (2): 448-464.
Bain, J.S. (1950) Workable competition in oligopoly: Theoretical considerations and some
empirical evidence. The American Economics Review, 40 (2): 35-47.
Bain, J.S. (1951) Relation of profit rates to industry concentration: American manufacturing,
1936-1940. Quarterly Journal of Economics 65 (3): 293-324
Bain, J.S. (1954) Economies of scale, concentration, and the condition of entry in twenty
manufacturing industries. The American Economics Review, 44 (1): 15-39.
Bain, J.S. (1956) Barriers to new competition. Cambridge, MA: Harvard University Press.
Bainbridge, S. (1993) Insider trading under the restatement of the law governing lawyers.
Journal of Corporate Law, 19 (1): 1-41.
Bajtelsmit, V., and Bernasek, A. (1996) Why do women invest differently than men? Financial
Counseling and Planning, 7: 1-10.
Baker, H. K. and Anderson, R. (2010) Corporate governance: A synthesis of theory, research,
and practice. New Jersey: John Wiley and Sons, Inc.
Baliga, R., Moyer, C., and R. Rao, (1996), ''CEO duality and firm performance: What's the fuss?
Strategic Management Journal 17, 41-53.
Balling, M., Hennessy, E., and O'Brien, R. (1998) Corporate governance, financial markets, and
global convergence. The Netherlands: Kluwer Academic Publishers.
Barber, B. M., & Odean, T. (2001). Boys will be boys: Gender, overconfidence, and common
stock investment. The Quarterly Journal of Economics, 116(1), 261-292.
Bar-Gill, O. and Bebchuk, L. (2003b) The costs of permitting managers to sell shares.
Cambridge: Harvard Law School.
Bar-Gill, O. and Bebchuk, L.A. (2003a) Misreporting corporate performance. Harvard
University Discussion Paper No. 400.
Barker, R.M. (2009) Competition, parties, and the determinants of change in European corporate
governance. A macro-comparative analysis. Doctoral dissertation. London: Oxford
University.
Barontini, R., & Caprio, L. (2006). The effect of family control on firm value and performance:
Evidence from continental Europe. European Financial Management, 12(5), 689-723.
259
Barro, J.R. and Barro, R.J. (1990) Pay, performance, and turnover of bank CEOs. Journal of
Labor Economics, 8 (4): 448-481.
Barsky, R.B., Juster, F.T., Kimball, M.S., and Shapiro, M.D. (1997) Preference parameters and
behavioral heterogeneity: An experimental approach in the health and retirement study.
Quarterly Journal of Economics, 112 (1): 537-579.
Baum, C.F. (2006) An introduction to modern econometrics using Stata. US: Stata Press.
Beasley, J. S. (2012) Research handbook on executive pay. Glos, UK: Edward Elgar Publishing
Limited.
Beasley, M.S. (1996) An empirical analysis of the relation between the board of director
composition and financial statement fraud. The Accounting Review, 71 (4): 443-465.
Beasley, M.S. and Hermanson, D.R. (2006) How sales executives can avoid accounting fraud
allegations. Review of Business, 27 (1): 33-40.
Beaton-Wells and Ezrachi, A. (eds.) (2011) Criminalising cartels: Critical studies of an
international regulatory movement. Oregon: Hart Publishing.
Beatty, R.P. and Zajac, E.J. (1994). “Managerial Incentives, Monitoring, and Risk Bearing: A
Study of Executive Compensation, Ownership, and Board Structure in Initial Public
Offerings.” Administrative Science Quarterly, 39(2):313-335.
Bebchuk, L. (1999) A rent-protection theory of corporate ownership and control. NBER
Working paper 7203. Cambridge, MA: National Bureau of Economics Research.
Bebchuk, L., Cohen, A., Ferrell, A., (2009). What matters in corporate governance? Review of
Financial Studies 22, 783-827
Bebchuk, L.A. and Grinstein, Y. (2005) The growth of executive pay. Oxford Review of
Economic Policy, 21 (1): 283-303.
Bebchuk, L.A. and Weisbach, M.S. (2010) The state of corporate governance research. Review
of Financial Studies, 23 (3): 939-961.
Becker, G.S. (1968) Crime and punishment: An economic approach. Journal of Political
Economy, 76 (1): 169-217.
Bell, T., Szykowny, S., and Willingham, J. (1993) Assessing the likelihood of fraudulent
financial reporting: A cascaded logit approach. Montvale, N.J.: KPMG Peat Marwick.
Benkel, M., Mather, P., and Ramsay, A. (2006) The assassination between corporate governance
and earnings management: The role of independent. Corporate Ownership and Control, Vol.
3.
Berger, A.N., Kick, T., and Shaeck, K. (2012) Executive board composition and bank risk
taking. Discussion Paper. Frankfurt: Deutsche Bundesbank.
Berle, A., and Means, G. (1932). The Modern Corporation and Private Property. New York:
Harcourt, Brace, and World.
260
Bertrand, M. and Mullainathan, S. (2003) Enjoying the quiet life? Corporate governance and
managerial preferences. Journal of Political Economy, 111(5): 1043-1075.
Bertrand, M., Mehta, P. and Mullainathan, S. (2002). ‘Ferreting out tunneling: an application to
Indian business groups’. Quarterly Journal of Economics, 117, 121–48
Bhagat, S., Brickley, J. A., and Lease, R. C. (1985). Incentive effects of stock purchase plans.
Journal of Financial Economics, 14(2), 195-215.
Bharat, S.T., Narayan, M.P., and Seyhun, H.N. (2009) Are women executives disadvantaged?
University of Michigan. Unpublished Manuscript.
Bilimoria, D. and Piderit, S.K. (1994) Board committee membership: Effects of sex-based bias.
Academy of management journal, 37(6): 1453-1477.
Black, B. (2001) The corporate governance behaviour and market value of Russian firms.
Emerging Markets Review, 2 (2): 89-108.
Booth, J.R., Cornett, M.M. and Tehranian, H. (2002) Boards of directors, ownership, and
regulation. Journal of Banking and Finance, 27 (1): 1973-1996.
Borokhovich, K.A., Parrino, R., and Trapani, T. (1996) Outside directors and CEO selection.
Journal of Financial and Quantitative Analysis, 31 (3): 337-355.
Bouckaert, J., Van Dijk, T., & Verboven, F. (2010). Access regulation, competition, and
broadband penetration: An international study.Telecommunications Policy, 34 (11), 661-
671.
Boyd, B.K. (1995). “CEO duality and firm performance: A contingency model.” Strategic
Management Journal, 16(4):301-312.
Bradbury, M., Mak, Y., and Tan, S. (2006) Board characteristics, audit committee characteristics
and abnormal accruals. Pacific Accounting Review, 18 (2): pp. 47-68.
Braga, S. and Black, B. (2000) Board independence and long-term firm performance.
Breit, W. and Elzinga, K. (1986) Antitrust penalty reform: An economic analysis. Washington
DC: American Enterprise Institute for Public Policy Research.
Brickley, J.A. (2003) Empirical research on CEO turnover and firm performance: A discussion.
Journal of Accounting and Economics, 36 (1-3): 227-233.
Brickley, J.A., Coles, J.F. and Terry, R.L. (1994) Outside directors and the adoptions of poison
pills. Journal of Financial Economics, 35: 377-390.
Brickley, J.C., Linck, J.S. and Coles, J.L. (1999) What happens to CEOs after they retire? New
evidence on career concerns, horizon problems, and CEO incentives. Journal of Financial
Economics, 52(3): 341?377.
Brickley, J.C.S. and Zimmerman, J. (2000) An introduction to game theory and business
strategy. Journal of Applied Corporate Finance, 13 (2): 84-98.
261
Brock, W.A. and Scheinkman, J. (1985) Price setting supergames with capacity constraints.
Review of Economic Studies, 52: 371-382.
Brookman, J. and Thistle, P.D. (2009) CEO tenure, the risk of termination and firm value,
Journal of Corporate Finance, 15 (3): 331-344 (2009).
Brouthers, K. D., Brouthers, L. E. and Werner, S. (2000) ‘Influences on Strategic Decision-
Making in the Dutch Financial Services Industry’, Journal of Management 26: 863–83
Brouwer, M. (2008) Governance and innovation: A historical view. New York: Routledge.
Brown, William O., Jr., and Michael T. Maloney, (1999), Exit, voice, and the role of
corporate directors: Evidence from acquisition performance, Working paper, University
of Virginia.
Bucciol, A., and R. Miniaci (forthcoming) Household portfolios and implicit risk preference.
Review of Economics and Statistic
Buccirossi, P. and Spagnolo, G. (2006) Leniency policies and illegal transactions. Journal of
Public Economics, 90: 1281-1297.
Buccirossi, P. and Spagnolo, G. (2007) Corporate governance and collusive behaviour. CEPR
Discussion Paper No. DP6349.
Buchanan, B. (1974) Building organizational commitment: The socialization of managers in
work organizations. Administrative Science Quarterly, 19(4): 533-546.
Buch-Hansen, H. (2008) Rethinking the history of European level merger control. A critical
political economy perspective. CBS PhD Series, 26 (1).
Buck, T, Bruce, A, Main, B.G.M. and Udueni, H. (2003). “Long Term Incentive Plans,
Executive Pay and UK Company Performance.” Journal of 40(7):1709-1727. Management
Studies,
Budzinski, O. and Christiansen, A. (2005) Competence allocation in the EU competition policy
system as an interest-driven process. Journal of Public Policy, 25(03), 313-337.
Burhop, C. and Lubbers, T. (2008) Cartels, managerial incentives, and productive efficiency in
German coal mining. Bonn: Max Planck Institute for Research on Collective Goods.
Burke, R.J. and Mattis, M.C. (2000) Women on corporate boards of directors: International
challenges and opportunities. Vol. 14. NY: Kluwer Academic Publishing.
Business Innovation and Skills (2012) Growth, competition and the competition regime -
Government response to consultation.
Business Roundtable, (1997), Statement on corporate governance, Washington, DC
Byrd, J.W. and Hickman, K.A. (1992) Do outside directors monitor managers? Evidence from
tender offer bids. Journal of Financial Economics, 32(2), 195-221.

262
Byrnes, J. P., Miller, D. C., & Schafer, W. D. (1999). Gender differences in risk taking: A meta-
analysis. Psychological bulletin, 125(3), 367.
Cabrera, S.F. (2010) Risky business: A theoretical model applied to the advancement of
executive women. Unpublished doctoral thesis presented to Cornell University.
Cadbury, A. (1992) Report of the committee on the financial aspects of corporate governance.
UK: Financial Reporting Council.
Cadbury, A. (2002) Corporate governance and chairmanship, a personal view. London: Oxford
Press.
Calkins, S. (1997) Corporate compliance and the antitrust agencies' bi-modal penalties. Law and
Contemporary Problems, 60 (1): 127-167.
Cameron, K.S. and Quinn, R.E. (2006) Diagnosing and changing organizational culture based on
the competing values framework. San Francisco: Jossey-Bass.
Campbell, J. Y. (2001) Household Finance. Journal of Finance 61, 1553–1604
Canadian Competition Bureau (2002) Annual report.
Carpenter, M. A., Pollock, T. G. and Leary, M. M. (2003). ‘Testing a model of reasoned risk-
taking: governance, the experience of principals and agents, and global strategy in high-
technology IPO firms’.Strategic Management Journal, 24, 802–14
Carter, D.A., Simkins, B.J. and Simpson, W.G. (2003) Corporate governance, board diversity,
and firm value. Financial Review, 38(1), 33-53.
Catalyst (2004) The Bottom Line: Connecting corporate performance and gender diversity. New
York: Catalyst Publication.
Chadderton, S. (2012) Lawyers give mixed response to launch of new competition and markets
authority. The Lawyer, 15th March (2012). Retrieved on May 3, 2012
Charness, G. B., & Gneezy, U. (2007). Strong evidence for gender differences in investment.
Charness, G., & Gneezy, U. (2004). Gender differences in financial risk-taking.
Charreaux and Desbrieres (2001) Corporate governance: Stakeholder value versus shareholder
value. Journal of Management and Governance, 5 (1).
Chen, C.J.P., Chen, S., and Su, X. (2005) Profitability regulation earnings management, and
modified audit opinions: Evidence from China. Auditing: A Journal of Practice and Theory,
20 (2): 9-30.
Chen, J. and Yao, S. (2006) Globalization, competition and growth in China. Oxon: Routledge.
Chen, L. (2008) Essays in CEO compensation and auditing. Proquest, Ann Arbor, MI: LLC,
UMI Mircroform.
263
Chen, T.,( 2005). Executive compensation contracts of family firms. Working paper, University
of Texas at Dallas.
Cheng, S. (2004) RandD expenditures and CEO compensation. The Accounting Review, 79 (2):
305-328.
Chesney, M. and Gibson-Asner, R. (2004) Stock options and managers' incentives to cheat.
University of Zurich. Working Paper.
Cheung, A. and Hernandez-Julian, R. (2006) Gender and Corruption: A Panel Data Analysis.
Child, J. (1974) Managerial and organizational factors associated with company performance.
Journal of Management Studies, 11:13-27.
Chizema, A. and T. Buck. (2006). “Neo-institutional theory and institutional change: Towards
empirical tests on the ”Americanization” of German executive pay.” International Business
Review, 15(5):488-504.
Chtourou, S., Bedard, J., Courteau, L., (2001) “Corporate governance and earnings
management”, working paper.
Clarke, T. (2007) International corporate governance: A comparative approach. NY: Routledge.
Clayman, M.R., Fridson, M.S., and Troughton, G.H. (2012) Corporate finance: A practical
approach. Second Edition. Mason, OH: Cengage Learning.
Coles, J., Brickley, J. and Jarrell, G. (1997) Leadership structure: Separating the CEO and
chairman of the board. Journal of Corporate Finance, 3 (3): 189-220.
Coles, J.D.N. and Naveen, L. (2008) Boards: Does one size fit all? Journal of Financial
Economics, 87 (1): 329-356.
Coles, J.W. and Hesterly, W.S. (2000) Independence of the chairman and board composition:
Firm choices and shareholder value. Journal of Management, 26 (2): 195-214.
Commission of the European Communities (2009) Communication from the commission to the
European Parliament and the council: Report on the functioning of Regulation 1/2003.
Compte, O. (1998), Communication in Repeated Games with Imperfect Private Monitoring,
Econometrica (66), 597-626.
Compte, O, Jenny, F. and Rey, P. (2002) Capacity constraints, mergers and collusion. European
Economic Review, 46(1): 1-29.
Connor J.M. and Helmers, C.G. (2006) Statistics on modern private international cartels: 1990-
2005. Retrieved on April 13, 2012
Connor, J.M. (2005) Optimal deterrence and private international cartels. SSRN. Retrieved on
June 219, 2012
Connor, J.M. (2008) Global price fixing. Berlin: Springer-Verlag Berlin Heidelberg.
264
Connor, J.M. (2010) Has the European Commission become more severe in punishing cartels?
Effects of the 2006 Guidelines. Retrieved on April 13, 2012
Connor, J.M. and Lande, R.H. (2011) How high do cartels raise prices? Implications for reform
of sentencing guidelines.
Connor, J.M., Bolotova, Y., and Miller, D.J. (2008) Factors influencing the magnitude of cartel
overcharges: an empirical analysis of the US market. Heidleberg: Springer Verlag.
Conyon, M. and Mallin, C. (1997) A review of compliance with Cadbury. Journal of General
Management, 22 (1): 24-37.
Conyon, M.J. (2006). “Executive Compensation and Incentives.” Academy of Management
Perspectives, 20(1):25-44.
Core, J., Guay, W. and Rusticus, T. (2001) Does weak governance cause weak stock returns? An
examination of firm operating performance and analysts' expectations. The Journal of
Finance, 61 (2): 655-687.
Core, J.E., Holthausen, R. and Larcker, D.F. (1999) Corporate governance, CEO compensation,
and firm performance. Journal of Financial Economics 51 (3): 371-406.
Cotter, J.F., Shivdasani, A. and Zenner, M. (1997) Do independent directors enhance target
shareholder wealth during tender offers? Journal of Financial Economics, 43(2), 195-218.
Coughlan, A.T. and Schmidt, R.M. (1985) Executive compensation, management turnover, and
firm performance: An empirical investigation. Journal of Accounting and Economics, 7(1),
43-66.
Council of Institutional Investors,( 1998), Core policies, positions and explanatory notes,
Washington, DC
Council, F. R. (2010). The UK corporate governance code. London: Financial Reporting
Council.
Craycraft, C., Craycraft, J.L. and Gallo, J.C. (1997) Antitrust sanctions and a firm's ability to
pay. Review of Industrial Organization, 12 (1): 171-183.
Cremers, M., Nair, B.V., Peyer, U., 2008. Takeover defenses and competition.Journal of
Empirical Legal Studies 5, 791-818
Croci, Ettore, Gonenc, Halit and Ozkan, Neslihan, CEO Compensation, Family Control, and
Institutional Investors in Continental Europe (2012)
Daboub, A. J., Rasheed, A. M. A., Priem, R. L. and Gray, D. A. (1995) ‘Top Management Team
Characteristics and Corporate Illegal Activity’, Academy of Management Review 20: 138–
70
Dahya, J. And N.G. Travlos, (2000), '' Does the one man show pay? Theory and evidence on the
dual CEO, ''European Financial Management 16.
Dahya, Jay, (2005) "One Man Two Hats - What's All the Commotion!"
265
Daily, C. And D. Dalton, (1997), ''Separate but not independent: board leadership structure in
large corporations,'' International Corporate Governance an International Review 5, 126-
136.
Daily, C. M. and Dalton, D.R. (1992) The relationship between governance structure and
corporate performance in entrepreneurial firms. Journal of Business Venturing, 7(5), 375-
386.
Daily, C.M. and Dalton, D.R. (1997) CEO and board chair roles held jointly or separately: Much
ado about nothing? Academy of Management Executive, 11 (3): pp. 11-20.
Daily, C.M., Dalton, D.R., and Canella, A.A. (2003) Corporate governance: Decades of dialogue
and data. Academy of Management Review, 28 (3): pp. 371-382.
Dalton, D., Daily, C., Ellstrand, A., and Johnson, J. (1998) Meta-analytic reviews of board
composition, leadership structure, and financial performance. Strategic Management
Journal, 19 (1): 269-290.
Dang, R. and Vo, L. (2012) Women on Corporate Boards of Directors: Theories, Facts, and
Analysis. In S. Boubaker and D. K. Nguyen (Eds.) Board directors and corporate social
responsibility. NY: Palgrave MacMillan.
Dann, L.Y., Del Guercio, D. and Partch, M. (2003) Governance and boards of directors in
closed-end investment companies.
Davidson, R., Goodwin-Stewart, J., and Kent, P. (2005) Internal governance structures and
earnings management. Accounting and Finance, 45 (1): 241-267.
Davis, G.F. and Thompson, T.A. (1994) A social movement perspective on corporate control.
Administrative Science Quarterly, 39 (1): 141-173.
Davis, J.H., Schoorman, F.D., and Donaldson, L. (1997) Toward a stewardship theory of
management. Academy of Management Review, 22 (1): 20-47.
DeAngelo, H. and DeAngelo, L. (1990) Dividend policy and financial distress: An empirical
investigation of troubled NYSE firms. The Journal of Finance, 45 (5): 1415-1431.
DeAngelo, H., DeAngelo, L., and Skinner, D.J. (1994) Accounting choice in troubled
companies. Journal of Accounting and Economics, 17 (1): 113-143.
Dechow, P.M. and Sloan, R.G. (1991) Executive incentives and the horizon problem: An
empirical investigation. Journal of Accounting and Economics, 14 (1): 51-89.
Demsetz, H. (1983). The Structure of Ownership and the Theory of the Firm. Journal of Law and
Economics, 26(2), 375-390.
Demsetz, H. and Lehn, K. (1985) The structure of corporate ownership: Causes and
consequences The Journal of Political Economy, 93 (1): 1155-1177.
Denis, D.K. and McConnell, J.J. (2003). “International Corporate Governance.” Journal of
Financial and Quantitative Analysis, 38(1):1-36.
266
Department of Trade and Industry (1988) Review of restrictive trade practices policy. London:
HMSO.
Department of Trade and Industry (1989) Opening markets. London: HMSO.
Department of Trade and Industry (1992) Abuse of market power. London: HMSO.
Department of Trade and Industry (2001) A world class competition regime. London: The
Stationery Office.
Desender, K.A. (2009) The relationship between the ownership structure and the role of the
board. V. K. Zimmerman Center for International Education and Research in Accounting.
University of Illinois.
Dharwardkar, R.G.G. and Brandes, P. (2000) Privatization in emerging economies: An agency
perspective. Academy of Management Review, 25 (3): 650-669.
Dimitropoulos, P.E., Asteriou, D., (2010). The effect of board composition on the
informativeness and quality of annual earnings: empirical evidence from Greece. Research
in International Business and Finance 24, 190–205.
Dixit, A.K. and Nalebuff, B.J. (1993) Thinking strategically: The competitive edge in business,
politics, and everyday life. London: WW Norton.
Donaldson, L. (1990) The ethereal hand: Organizational economics and management theory.
Academy of management Review, 15(3): 369-381.
DTI (1989) Opening Markets: New Policies on Restrictive Trade Practices, Cmd.727, London:
Department of Trade and Industry/HMSO
Du Plessis, J.J., Hargovan, A., and Bagaric, M. (2011) Principles of contemporary corporate
governance. NY: Cambridge University Press.
Duchin, R., J. Matsusaka, and O. Ozbas. (2010). When are outside directors effective? Journal of
Financial Economics 96: 195-214.
Durnev, Art and E. Han Kim (2006) To Steal or Not to Steal: Firm Attributes, Legal
Environment, and Valuation, Journal of Finance, vol LX(3), 1461-1493.
Ebrahim, A. (2007). Earnings management and board activity: an additional evidence. Review of
Accounting and Finance, 6(1), 42-58
Eckel, C. C., & Grossman, P. J. (2003). Forecasting risk attitudes: An experimental study of
actual and forecast risk attitudes of women and men.Virginia Tech Department of
Economics Working Paper.
Eisenberg, T. Sundgren, S. and Wells, M.T. (1998) Larger board size and decreasing firm value
in small Firms, Journal of Financial Economics, 48 (1): 35-54
Eisenhardt, K.M. (1988/1989) Agency theory: An assessment and review. Academy of
Management Review, 14 (1):57-74.
267
Ellis, C. and Wilson, W. (2003) Cartels, price fixing, and corporate leniency: what doesn't kill us
makes us stronger. Manuscript. Oregon: University of Oregon.
Elsaid, E. (2012) Age, CEO succession, and risk taking. Accounting and Finance Research, 1
(2): 77-86.
Elzinga, K.G. and Breit, W. (1986) The antitrust penalties: A study in law and economics. New
Haven: Yale University Press.
European Commission (2008) Antitrust: Commission fines car glass producers over €1.3 billion
for market sharing cartel.
European Commission (2009) Economic crisis in Europe: causes, consequences and responses.
Directorate-General for Economic and Financial Affairs. Office for Official Publications of
the European Communities.
European Communities (1998) Guidelines on the method of setting fines. Official Journal of the
European Union, 9 (3).
European Communities (2004) Notice on cooperation within the Network of Competition
Authorities. Official Journal of the European Union, 101(43).
Evans, L. and Hughes, P. (2003) Competition policy in small distant open economies: some
lessons from the economics literature. NZ Treasury Working Paper, 03/31.
Evenett, S.J., Levenstein, M.C. and Suslow, V.Y. (2001) International cartel enforcement:
lessons from the 1990s. World Economy, 24 (9): 1-34.
Fahlenbrach, R., (2005), ‘Founder-CEOs and stock market performance’, Working Paper (Ohio
State Univer-sity).
Faleye, O., (2007), ''Does one has fit all? The case of corporate leadership structure'' Journal of
Management and Governance, Vol 13. N.3, 239-259
Fama, E.F. (1980) Agency problems and the theory of the firm. The Journal of Political
Economy, 288-307.
Fama, E.F. and Jensen, M.C. (1983) Separation of ownership and control. Journal of Law and
Economics, 26 (1): 301-325.
Fear, J. (2007) Cartels and competition: Neither market nor hierarchies. Working Papers
Harvard Business School Division of Research, 7 (11).
Ferguson, J.M. (1974) Advertising and competition: Theory, measurement, fact. Cambridge:
Ballinger.
Ferris, S.P., Jagannathan, M. and Pritchard, A.C. (2003) Too busy to mind the business?
Monitoring by directors with multiple board appointments, The Journal of Finance, 58 (3):
1087-1112.
Field, A. (2005). Discovering Statistics Using SPSS. London, SAGE Publications Ltd.
268
Fields, T.D., Lys, T.C., Vincent, L., (2001). Empirical Research on Accounting Choice. Journal
of Accounting and Economics 31, 255-307.
Filatotchev, I., Toms, S., and Wright, M. (2006) The firm's strategic dynamics and corporate
governance life-cycle. International Journal of Managerial Finance, 2 (4): 256-279.
Finkelstein, S. and Boyd, B.K. (1998) How much does the CEO matter? The role of managerial
discretion in the setting of CEO compensation. Academy of Management Journal, 41 (2):
179-199.
Finkelstein, S. and D'Aveni, R.A. (1994). ”CEO duality as a double-edged sword: how board of
directors balance entrenchment avoidance and unity of command.” Academy of
Management Journal, 37(5):1079-1108.
Finkelstein, S., Hambrick, D.C., and Cannella, A.A. (2009) Strategic leadership: Theory and
research on executives, top management teams, and boards. NY: Oxford University Press.
Fishbein, S., Kafele, H.L. and O'Neill, C. (2012) Confidentiality Waivers In Global Cartel
Investigations. Cartel Digest.
Fisher, F.M. (1979) Diagnosing monopoly. Amsterdam: JAI Press.
Fizel, J.L. and Louie, K.K. (1990) CEO retention, firm performance and corporate governance.
Managerial and Decision Economics, 11(3): 167-176.
Forbes, D.P. and Milliken, F.J. (1999) Cognition and corporate governance: understanding
boards of directors as strategic decision-making groups. Academy of Management Review,
24(3): 489-505.
Ford, R.C., and Richardson, W.D. (1994). Ethical Decision Making: A Review of the Empirical
Literature. Journal of Business Ethics, Vol. 13, No. 3: pp. 205-221.
Fraas, A. G. and D. F. Greer (1977). Market structure and price collusion: An empirical analysis.
Journal of Industrial Economics 26 (1), 21-44.
Frankl, Jennifer L. (1999). An Analysis of Japanese Corporate Structure, 1915-1937. Journal of
Economic History, 59: 997
French, J.R. and Raven, B. (1959) The bases of social power.
Friedman, J. W. (1971) A non-cooperative equilibrium for supergames. Review of Economic
Studies, 38 (1): 1-12.
Furse, M. (2004) Competition law Of the EC And UK. Oxford: Oxford University Press.
Furse, M. and Nash, S. (2004) The cartel offence. Oxford: Hart Publishing.
Gallo, J.C., Dau-Schmidt, K., Craycraft, J.L. and Parker, C.J. (2000) Department of Justice
antitrust enforcement, 1955-1997: An empirical study. Review of Industrial Organization,
17(1): 75-133.
269
Gallo, J.C., Dau-Schmidt, K.G., Craycraft, J.L. and Parker, C.J. (1994) Criminal penalties under
The Sherman Act: A study of law and economics. Research in Law and Economics, 16: 1-
73.
Gallo, J.C.K. and Goshal, V. (1996) Changes in economic activity, political stance and
variations in the Department of Justice's antitrust enforcement. University of Cincinnati.
Working Paper.
Ganslandt, M., Persson, L. and Vasconcelos, H. (2007) Asymmetric collusion and merger
policy. Research Institute of Industrial Economics. Working Paper Series 719.
Garoyan, L. and Mohn, P.O. (1985) Board of directors of cooperatives. Second Edition. CA:
Regents of the University of California.
Gaver, J.J., Gaver, K.M. and Austin, J.R. (1995) Additional evidence on bonus plans and income
management. Journal of Accounting and Economics, 19(1): 3-28.
Geradin, D. (2004) Modernisation and enlargement. Oxford: Oxford University Press.
Gerber, M. (2001) Law and competition in 20th century Europe: Protecting Prometheus. Oxford:
Oxford University Press.
Gereffi, G. (2011). Global Value Chains and International Competition.Antitrust Bulletin, 56(1),
37-64.
Gervais, S., and Odean, T. (2001) Learning to be overconfident. Review of Financial Studies,
14, 1-27.
Gibbons, R. and Murphy, K.J. (1990) Relative performance evaluation for chief executive
officers. Industrial and Labor Relations Review, 43 (1): 3OS-51s.
Gillette, A.B., Noe, T.H., and Rebello, M.J. (2003) Corporate board composition, protocols, and
voting behaviour: Experimental evidence. The Journal of Finance, 58(5): 1997-2032.
Gillian, S., Hartzell, J.C. and R. Parrino. (2009). Explicit vs. Implicit Contracts: Evidence from
CEO Employment Agreements. The Journal of Finance 64, 1629-1655
Gilson, S.C. (1990) Bankruptcy, boards, banks, and block holders. Journal of Financial
Economics, 27 (1): 355-387.
Giroud, X. and Mueller, H. (2011) Corporate governance, product market competition, and
equity prices. The Journal of Finance, 66 (2): 563-600.
Global Competition Review (2013) The antitrust review of the Americas. CFIUS Review, pp.
12-14.
Golden, B.R. and Zajac, E.J. (2001) When will boards influence strategy? Inclination× power=
strategic change. Strategic Management Journal, 22(12): 1087-1111.
Goldman, E. and S. Slezak S. (2003) Delegated portfolio management and rational prolonged
mispricing. Journal of Finance, 58 (1): 288-311.
270
Gomez-Mejia, L., Larraza-Kintana, M. and Makri, M. (2003). ‘The determinants of executive
compensation in family-controlled public corporations’. Academy of Management Journal,
46, 226–37.
Gompers, P., Ishii, J., and Metrick, A. (2003) Corporate governance and equity prices. The
Quarterly Journal of Economics, 118 (1): 107-156.
Gonzales, T.A., Schmid, M., and Yermack, D. (2013) Smokescreen: How managers behave
when they have something to hide. Finance Working Papers.
Gonzalez, T.A. and Schmid, M. (2012) Corporate governance and antitrust behaviour. Gallen,
Switzerland: Swiss Institute of Banking and Finance, university of St. Gallen.
Goodstein, J., Gautam, K., and Boeker, W. (1994) The effects of board size and diversity on
strategic change. Strategic Management Journal, 15(3): 241-250.
Goyal, V.K. and Park, C.W. (2002) Board leadership structure and CEO turnover. Journal of
Corporate Finance, 8(1): 49-66.
Grable, J. E., McGill, E. S., and Britt, S. (2009) Risk tolerance estimation bias: The age effect.
Journal of Business and Economics Research, 7 (1): 1-12.
Graham, J. R. (1999) Herding among investment newsletters: Theory and evidence. Journal of
Finance 54, 237-268
Granovetter, M. (1985) Economic action and social structure: The problem of embeddedness,
The American Journal of Sociology, 91 (3): 481-510.
Green, E. and Porter, R. (1984) Non-cooperative collusion under imperfect price information.
Econometrica, 55 (1): 87-100.
Green, S. (2004). “Unfinished business: Abolish the Imperial CEO!” The Journal of Corporate
Accounting & Finance September/October:19-22.
Grillo, M. (2002) Collusion and facilitating practices: A new perspective in antitrust analysis.
European Journal of Law and Economics, 14 (2):151-169.
Grossman, P.Z. (2004) How cartels endure and how they fail: Studies of industrial collusion.
Cheltenham: Edward Elgar.
Grout, P.A. and Sonderegger, S. (2005) Predicting cartels. OFT Economic Discussion Paper,
OFT773, March issue.
Gruca, Thomas and D. Sudarshan (1995), “A Framework for Entry Deterrence Strategy: The
Competitive Environment. Choices and Consequences,” Journal of Marketing, 59 (July), 44
-55
Guadalupe, M., Pérez-González, F., (2010). Competition and Private Bene?ts of Control,
Working Paper. Columbia Univers
271
Gulzar, M.A. and Wang, Z. (2011) Corporate governance characteristics and earnings
management: Empirical evidence from Chinese listed firms. International Journal of
Accounting and Financial Reporting, 1 (1): 133-151.
Hall, Brian J. and Liebman, Jeffrey B., Are CEOs Really Paid Like Bureaucrats? (1998). The
Quarterly Journal of Economics.
Hallock, K.F. (2002) The gender pay and employment gaps for top managers in US non-profits.
Lausten. Working Paper.
Haltiwanger, J. and Harrington, J. (1991) The impact of cyclical demand movements on
collusive behaviour. The Rand Journal of Economics, 22: 89-106.
Hamaguchi, Y., Kawagoe, T. and Shibata, A. (2009) Group size effects on cartel formation and
the enforcement power of leniency programs. International Journal of Industrial
Organization, 27 (1): 145-165 (2009).
Hambrick, D. C. and S. Finkelstein (1987). 'Managerial discretion: A bridge between polar
views of organizational outcomes', Research in Organizational Behaviour, 9, pp. 369-406.
Hambrick, D.C. and Mason, P.A. (1984) Upper echelons: The organization as a reflection of its
top managers. Academy of management review, 9 (2): 193-206.
Hamdani, A. and Yafeh, Y. (2010) Institutional investors as minority shareholders: Do they
matter when ownership is concentrated? London: Centre for Economic Policy Research.
Hammond, S.D. (2005a) Caught in the act: Inside an international cartel. OECD Competition
Committee Working Party No. 3. Public Prosecutors Program, Paris: OECD'
Hammond, S.D. (2005b) An update of the Antitrust Division's criminal enforcement program.
Department of Justice.
Han, K.C. and Suk, D.Y. (1998) The Effect of Ownership Structure on Firm Performance:
Additional Evidence. Review of Financial Economics, 7 (2): 143-155.
Han, M.J. (2010) Short-term managerial contracts facilitate cartels. Amsterdam Center for Law
and Economics. Working Paper No. 2010-16.
Haniffa, R. and Cooke, T. (2002) Culture, corporate governance and disclosure in Malaysian
corporations. ABACUS, 38 (1): 317-349.
Harding, C. and Joshua, J. (2003) Regulating cartels in Europe: A study of the legal control of
corporate delinquency. Oxford: Oxford University Press.
Harrington, J. (2006a) How do cartels operate?
Harrington, J. (2006b) Corporate leniency programmes and the role of the antitrust authority in
detecting collusion.
Harrington, J. (2006c) Modeling the birth and death of cartels with an application to evaluating
antitrust policy.
272
Harrison, J. R., D. L. Torres and S. Kukalis (1988). 'The changing of the guard: Turnover and
structural change in the top-management positions', Administrative Science Quarterly, 33,
pp. 211-232.
Hart, O. (1995) Corporate governance: Some theory and implications. The Economic Journal,
105 (430): 678-689.
Hart, S.D., Michie, C. and Cooke, D.J. (2007) Precision of actuarial risk assessment instruments:
Evaluating the "margins of error" of group v. individual predictions of violence. British
Journal of Psychiatry, 190 (1): 60-65.
Hay, G. A. and D. Kelley (1974). An empirical survey of price fixing conspiracies. Journal of
Law and Economics 17 (1), 13-38.
Hazarika, S., Karpoff, J.M., and Nahata, R. (2012) Internal corporate governance, CEO turnover,
and earnings management. Journal of Financial Economics, 104 (April issue): 44-69.
Healy, P. (1985) Evidence on the effect of bonus schemes on accounting procedure and accrual
decisions. Journal of Accounting and Economics, 7 (1): 85-107.
Healy, P., Palepu. K., (2001). Information asymmetry, corporate disclosure, and the capital
markets: A review of the empirical disclosure literature. Journal of Accounting and
Economics 31, 405-440.
Hendry, J. (2010) Strategic decision-making, discourse, and strategy as social practice. Journal
of Management Studies, 37 (1): 955-977.
Hermalin, B. and Weisbach, M.S. (1988) The determinants of board composition. Rand Journal
of Economics, 19 (1): 589-606.
Hermalin, B.E. and Weisbach, M.S. (2003) Boards of directors as an endogenously determined
institution: survey of economic literature. Economic Policy Review 9 (1): 7-26.
Hermanson, D.R., Moran, B., Rossie, C. and Wolfe, D. (2006) Continuous monitoring of
transactions to reduce fraud, misuse, and errors. Journal of Forensic Accounting, June issue:
17-30.
Hillman, A.J., Cannella, A.A., and Harris, I.C. (2002) Women and racial minorities in the
boardroom: How do directors differ? Journal of Management, 28 (6): 747-763.
Hinz, R. P., McCarthy, D. D., & Turner, J. A. (1997). “Are women conservative investors?
Gender differences in participant-directed pension Pennsylvania Press. Positioning Pensions
for the Year 2000 (pp. 91–103) Philadelphia: University of investments” In Mitchell, O.
(Ed.)
Holmstrom, B. (1999) Managerial incentive problems: A dynamic perspective. The Review of
Economic Studies, 66 (1): 169-182.
Holmström, B., and Tirole, J. (1993). Market liquidity and performance monitoring. Journal of
Political Economy, 678-709.
273
Hopkins, B.R. and Gross, V.C. (2009) Non-profit governance: law, practices, and trends. NY:
Wiley.
Hopner, M. and Krempel, L. (2004) The politics of the German company network. Competition
and Change, 8 (4): 339-356.
Hopt, K.J., Kanda, H., Roe, M.J., Wymeerch, E., and Prigge, S. (2005) Comparative corporate
governance" The state of the art and emerging research. London: Oxford University Press.
Hou,K.,Robinson, T.D., (2006). Industry concentration and average stock returns.The Journal of
Finance 61, 1927-1956.
Huschelrath, K. and Weigand, J. (2010) Fighting Hard Core Cartels. CEER Discussion Paper
No. 10-084.
Huse, M., and Solberg, A.G. (2006). Gender Related Boardroom Dynamics: How Scandinavian
Women Make and can Make Contributions on Corporate Boards. Women in Management
Review, Vol. 21, No. 2: pp. 113-130
Hutchinson, M. and Gul, F. (2004) Investment opportunity set, corporate governance practices
and firm performance. Journal of Corporate Finance, 10 (1): 595-614.
Jackson, M., and Lazear, E. P. (1988). Stock, options, and deferred compensation. Hoover
Institution, Stanford University.
Jaggi, B., Leung, S., & Gul, F. (2009). Family control, board independence and earnings
management: Evidence based on Hong Kong firms. Journal of Accounting and Public
Policy, 28(4), 281-300.
Jamali, D., Safieddine, A., and Daouk, M. (2007) Corporate governance and women: An
empirical study of top and middle women managers in Labanese Banking Sector. Corporate
Governance: An International Review, 7 (5): 574-585.
James, H. (1999). Owner as Manager, Extended horizons and the family firm. International
Journal of the Economics of Business 6: 41-56
Januszweski, S.I., Koke, J., and Winter, J.K. (2002) Product market competition, corporate
governance, and form performance: an empirical analysis for Germany. Research in
Economics, 56 (3): 299-332.
Jensen, M. (1993) The modern industrial revolution: Exit, and the failure of internal control
Systems, Journal of Finance, 48 (1): 831-880.
Jensen, M.C. and Meckling, W.H. (1976) Theory of the firm: Managerial behavior, agency costs
and ownership structure. Journal of Financial Economics, 3 (4): 305-360.
Jensen, M.C. and Murchy, K.J. (1990) CEO incentives: it's not how much you pay, but how.
Harvard Business Review (May-June): 138-153.
Jensen, M.C. and Murphy, K.J. (2004) Remuneration: where we've been, how we got there, what
are the problems, and how to fix them? Finance Working Paper 44, European Corporate
Governance Institute.
274
Jenter, D. and K. Lewellen. (2010). Performance-Induced CEO Turnover. Working Paper Stan-
ford.
Jephcott, M. and Lübbig, T. (2003) Law of cartels. Bristol: Jordans.
Jianakoplos, N.A. and Bernasek, A. (1998) Are women more risk averse? Economic Inquiry, 36
(1) 620-630.
John, K. and Senbet, L. (1998), ‘‘Corporate governance and board effectiveness’’, Journal of
Banking and Finance, Vol. 22 No. 4, pp. 371-403
Johnson, A.S., Theodore, C.M., Sorin, S.,(2009). A re-examination of corporate governance and
equity prices. Review of Financial Studies 22,4753-4786.
Johnson, J.L., Daily, C.M., and Ellstrand, A.E. (1996) Boards of directors: A review and
research agenda. Journal of Management, 22 (3): 409-438.
Jones, C. (2009) The effects of CEO and top management team heterogeneity on competitive
aggressiveness. Ann Arbor, MI: ProQuest LLC.
Joshua, J. (2010). Shooting the messenger: does the UK criminal cartel offence have a
future?. The Antitrust Source, 1
Judge Jr, W.Q. and Zeithaml, C.P. (1992) Institutional and strategic choice perspectives on
board involvement in the strategic decision process. Academy of management Journal, 766-
794.
Kaisanlahti, T. (2002) Minority shareholders in the Finnish system of corporate governance.
ETLA Discussion Papers. Finland: The Research Institute of the Finnish Economy (ETLA)
810.
Kang, H., Cheng, M., and Gray, S.J. (2007) Corporate governance and board composition:
Diversity and independence of Australian boards. An International Review, 15 (2): 194-207.
Kang, J.-K. and Shivdasani, A. (1995) Firm performance, corporate governance, and top
executive turnover in Japan. Journal of Financial Economics, 38 (1): 29-58.
Kao, L. and Chen, A. (2004) The effects of board characteristics on earnings management.
Corporate Ownership and Control, 1 (3): 96-107.
Kaplan, S. N. and Minton, B. A. (2008), How Has CEO Turnover Changed? International
Review of Finance, 12: 57-87.
Kaplan, S.N. (1994) Top executive rewards and firm performance: a comparison of Japan and
the US. Journal of Political Economy, 102 (3): 510-546.
Kaplan, S.N. and Reishus, D. (1990) Outside directorships and corporate performance, Journal
of Financial Economics, 27 (2): 389-410 (1990).
Karuna, C., (2007). Industry Product-Market Competition and Corporate Governance, Working
Paper. University of California, Irvine.
275
Katz, R. (1982), ‘Project Communication and Performance: An Investigation into the Effects of
Group Longevity’, Administrative Science Quarterly,Vol.27,pp. 81–104.
Keasey, K., Thompson, S., and Wright, M. (2005) Corporate governance: Accountability,
enterprise, and international comparisons. Mason, OH: John Wiley and Sons, Ltd.
Kenny, M. E., Blustein, D. L., Chaves, A., Grossman, J. M., & Gallagher, L. A. (2003). The role
of perceived barriers and relational support in the educational and vocational lives of urban
high school students. Journal of Counseling Psychology, 50(2), 142.
Kensinger, J. W. (2012) Research in finance. First Edition. UK: Emerald Group Publishing
Limited.
Kiel, G.C. and Nicholson, G. J. (2006) Multiple directorships and corporate performance in
Australian listed companies. Corporate Governance: An International Review, 14 (6): 530-
546.
Klein, A. (1998) Firm performance and board committee structure. Journal of Law and
Economics, 41 (1): 275-303.
Klein, A. (2002) Audit committee, board of director characteristics, and earnings management.
Journal of Accounting and Economics, 33 (1): 375-400.
Kole, S. and Lehn, K. (1997) Deregulation, the evolution of corporate governance structure, and
survival. The American Economic Review, 87 (2): 421-425.
Kole, S.R. (1997) The complexity of compensation contracts. Journal of Financial Economics,
43(1): 79-104.
Korn/Ferry International, (1998), 25th Annual Board of Directors Study Los Angeles, CA.
La Porta R, Lopez-de-Silanes F, Shleifer A, Vishny R. (1999). Corporate ownership around the
world. Journal of Finance 54: 471-517
Lacker, D. and Tayan, B. (2011) Corporate governance matters: A closer look at organizational
choices and their consequences. NJ: FT Press.
Laiho, T. (2011) Agency theory and ownership structure - Estimating the effect of ownership
structure on firm performance. School of Economics, Aalto University.
Landes, W.M. (1983) Optimal sanctions for antitrust violations. University of Chicago Law
Review, 50 (1): 652-678.
Larcker, D.F., Richardson, S.A., and Tuna, I. (2007) Corporate governance, accounting
outcomes, and organizational performance. Accounting review, 82 (4): 963-1008.
Lausten, M. (2002) CEO turnover, firm performance and corporate governance: Empirical
evidence on Danish firms. International Journal of Industrial Organization, 20 (3): 391-414.
LeClair, M. S. (2011) Cartelization, antitrust and globalization in the US and Europe. London:
Routledge.
276
Lee, C., Rosenstein, S., Rangan, N., Davidson III, W. (1992) Board composition and shareholder
wealth: The case of management buyouts. Financial Management 21 (1): 58-72.
Leech, D. (2001) Shareholder voting power and corporate governance: A study of large British
companies. Nordic Journal of Political Economy, 27 (1): 33-54.
Leech, D. (2002) Shareholder voting power and ownership control of companies. The University
of Warwick.
Lehmkuhl, D. (2008) On government, governance and judicial review: the case of European
competition policy. Journal of public policy, 28(01): 139-159.
Leong, F.T. and Austin, J.T. (2006) The psychology research handbook: A guide for graduate
students and research assistants. London: Sage Publications, Inc.
Leuz, C., Nanda, D. and Wysocki, P. (2003) Investor protection and earnings management: an
international comparison. Journal of Financial Economics, 69(3): 505-527.
Levenstein, M.C. and Suslow, V.Y. (2006) What determines cartel success? Journal of
Economic Literature, 44 (March), 43-95.
Levenstein, M.C., Suslow, V.Y. and Oswald, L.J (2003) International price-fixing cartels and
developing countries: a discussion of effects and policy remedies. William Davidson
Institute Working Paper, no. 538, pp. 1-78.
Levi, M., Li, K., and Zhang, F. (2010) Deal or no deal: Hormones and the mergers and
acquisitions game. Management Science, 56 (9): 1462-1483.
Li, J. and Harrison, J.R. (2008). “National Culture and the Composition and Leadership
Structure of Boards of Directors.” Corporate Governance: An International
Review,16(5):375-385.
Lin, C. (2001) Corporatisation and corporate governance in China's economic transition.
Economics of Planning, 34 (1-2): 5-35.
Lipczynski, J. and Wilson, J. (2001) Industrial organisation: An analysis of competitive markets.
Harlow: Prentice Hall.
Lipton, M. and Lorsch, J. (1992) A modest proposal for improved corporate governance.
Business Lawyer 48, 59-77.
Loderer, C. and Peyer, U. (2002) Board overlap, seat accumulation and share prices. European
Financial Management, 8 (2): 165-192.
Loebbecke, J., Eining, M. and Willingham, J. (1989) Auditor's experience with material
irregularities: Frequency, nature, and detectability. Auditing: A Journal of Practice and
Theory, Fall Issue, 1-28.
Loos, M.P. (2010) Directors' liability: A worldview review. Netherlands: Kluwer Law
International.
277
Lynall, M.D., Golden, B.R. and Hillman, A.J. (2003). “Board composition from adolescence to
maturity: a multitheoretic view.” Academy of Management Review, 28(3):416<431.
MacCrimmon, K. R. and Wehrung, D. A. (1990) Characteristics of risk taking executives.
Management Science, 36 (4): 422-435.
Mace, M.L. (1986) Directors: Myth and reality. Boston, Mass.: Harvard Business School Press.
Macnee, C.L. and McCabe, S. (2008) Understanding nursing research: Reading and using
research in evidence-based practice. Second Edition. PA: Lippincott Williams.
Mallette, P. and K. L. Fowler (1992). 'Effects of board composition and stock ownership on
the adoption of 'poison pills', Academy of Management Journal, 35, pp. 1010-1035
Mallin, C.A. (2006) International corporate governance. A case study approach. Glos, UK:
Edward Elgar Publishing Limited.
Mangel, R. and Singh, H. (1993) Ownership structure, board relationships and CEO
compensation in large US corporations. Accounting and Business Research, 23 (1): 339-
350.
Markóczy, L. (1997) ‘Measuring Beliefs: Accept No Substitutes’, Academy of Management
Journal 40(5): 1228–42.
Mattis, M.C. (2000) Women corporate directors in the United States: Women in Management:
International Challenges and Opportunities, pp. 43-56.
Maxfield, M.G. and Babbie, E.R. (2012) Basics of research methods: For criminal justice and
criminology. Belmont, CA: Wadsworth Cengage Learning.
McAfee, R.P., Vincent, D., Williams, M.A., and Williams, M. (1993) Collusive bidding in
hostile takeovers. Journal of Economics and Management Strategy, 2 (4): 449-482.
McCahery, J.A., Moerland, P., and Raaijmakers, T. (2002) Corporate governance regimes:
Convergence and diversity. London: Oxford University Press.
McConnaughy, D., Walker, M., Henderson, G. and Chandra, M., ‘Founding family controlled
firms:efficiency and value’, Review of Financial Economics, Vol. 7, 1998, pp. 1–19.
McConnell, J. J. and Servaes, H. (1990). ‘Additional evidence on equity ownership and
corporate value’.Journal of Financial Economics, 27, 595–612.
McGowan, L. (2005) Europeanization unleashed and rebounding: The modernization of EC
cartel policy. Journal of European Public Policy, 12(6): 986-1004.
McGowan, L. and Wilks, S. (1995) Competition policy: The first supranational policy in the
European Union. European Journal of Political Research, 28 (2): 141-169.
McKnight, P.J. and Weir, C. (2009) Agency costs, Corporate governance mechanisms and
ownership structure in large UK publicly quoted companies: A panel data analysis. The
Quarterly Review of Economics and Finance, 49 (1): 139-158.
278
Means, B. (2008) A voice-based framework for evaluating claims of minority shareholder
oppression in the close corporation. Georgetown Law Journal, 97 (1): 1207-1256.
Miller, D. (1991) Stale in the saddle: CEO tenure and the match between organization and
environment. Management Science, 37 (1): 43-52.
Mintzberg, H. (1983) Structures in fives. Designing effective organizations London: Sage
Publishing.
Mishra, R. K. and Jhunjhunwala, S. (2013) Diversity and the effective corporate board. NY:
MacMillan.
Miwa, Yoshiro, and J. Mark Ramseyer, (2000), Corporate governance in transitional
economies: Lessons from the pre-war Japanese cotton textile industry, Journal of Legal
Studies 29,171-204.
Mizruchi, M. S. (1983). 'Who controls whom? An examination of the relation between
management and boards of directors in large corporations', Academy of Management
Review, 8, pp. 42M35.
Monks, R. A. G. and Minow, N. (2011) Corporate governance. West Sussex, UK: John Wiley
and Sons.
Morck, R., A. Shleifer and R. W. Vishny (1989). 'Alternative mechanisms for corporate
control', American Economic Review, 79, pp. 842-852.
Morck, R., and B. Yeung. (2003). ‘‘Agency Problems in Large Family Business Groups.’’
Entrepreneurship: Theory and Practice 27: 367–382.
Morck, R., Shleifer, A., and Vishny, R.W. (1988) Management ownership and market valuation:
An empirical analysis. Journal of financial economics, 20 (1): 293-315.
Morck, R., Wolfenzon, D. and Yeung, B. (2005). ‘Corporate governance, economic retrench,
and growth’.Journal of Economic Literature, 63, 655–720.
Morck, R.K. (2000) Concentrated corporate ownership. Chicago: The University of Chicago
Press.
Morgan, E.J. (2009) Controlling cartels - implications of the EU policy reforms. European
Management Journal, 27 (1): pp. 1-12.
Morgan, E.J. (2010) Criminal cartel sanctions under the UK enterprise act: an assessment. NY:
McGraw-Hill.
Motta, M. (2007) Cartels in the European Union: Economics law, practice. NY: Prentice Hall.
Muranda, Z. (2006) Financial distress and corporate governance in Zimbabwean banks.
Corporate Governance, 6 (5): 643-654.
Murphy K. (1986) Incentives, learning, and compensation: a theoretical and empirical
investigation of managerial labour contracts. Rand Journal of Economics 17: 59-76
279
Murphy, K.J. (1999) Executive compensation. Handbook of Labor Economics, 3 (1): 2485-
2563.
Muth, M.M. and Donaldson, L. (1998). “Stewarship theory and board structure: a contingency
approach.” Corporate Governance, 6(1):5-28.
Myllys, K. (1999). “The Role of the Non-Executive Board and the CEO in Managing the
Change: a survival battle in Finnish Banking.” Corporate Governance: An International
Review, 7(4):311-320.
National Association of Corporate Directors (1996), Report of the NACD Blue Ribbon
Commission on Director Professionalism (NACD, Washington DC).
Nguyen, H. and Faff, R. (2007) Impact of board size and board diversity on firm value:
Australian evidence. Corporate Governance and Ownership. 4 (2): 24-32.
Nicholson, G.J. and Kiel, G.C. (2003) Board composition and corporate performance: How the
Australian experience informs contrasting theories of corporate governance. Corporate
Governance: An International Review, 11 (3): 189-205.
Nickell, J.S., (1996). Competition and corporate performance. The Journal of Political Economy
104, 724-746
Niessen, A., & Ruenzi, S. (2006). Sex matters: gender and mutual funds.manuscript, University
of Cologne.
Niskanen, M., Karjalainen, J., and Steijvers, T. (2011a), ―Audit quality: the role of board
structure infamily firms,working paper , University of Eastern Finland, Kuopio, 13 June
OECD (2002) Fighting hard-core cartels: harm, effective sanctions and leniency programmes.
Paris: Organisation for Economic Co-operation and Development.
OECD (2004) Report on the nature and impact of hard core cartels and sanctions against cartels
under national competition laws. Paris: Organisation for Economic Co-operation and
Development.
Office of Fair Trading (2003a) Competition disqualification orders, guidance. OFT 510. London:
OFT.
Office of Fair Trading (2004a) Guidance as to the appropriate amount of a penalty. OFT 423.
London: OFT.
Office of Fair Trading (2010a). Company directors and competition law: A consultation on OFT
Guidance. London: OFT.
Official Journal of the European Communities (2002) Commission notice on immunity from
fines and reduction of fines in cartel cases.
OFT Press Release (2008) Three imprisoned in first OFT criminal prosecution for bid-rigging.
Ong, C.H. and Lee, S.H. (2001). “Board functions and firm performance: A review of directions
for future research.” Journal of Comparative 4(1):1-20.International Management,
280
Oxelheim, L. (2008) Markets and compensation for executives in Europe. UK: Emerald Group
Publishing Limited.
Ozkan, A. and Ozkan, N. (2004), Corporate cash holdings: an empirical investigation of
UK companies, Journal of Banking and Finance, Vol. 28 No. 9, pp. 2103-2134
Palepu, K.G. (1986), 'Predicting Takeover Targets: A Methodological and Empirical Analysis',
Journal of Accounting and Economics, Vol.8, pp.3-35
Palia, D. and Ravid, S. A., ‘The role of founders in large companies: entrenchment or valuable
human capital?’, Working Paper (Rutgers University, 2002).
Papadopoulos, A. S. (2010). The international dimension of EU competition law and policy.
Cambridge University Press.
Parker, L.D. (2007). “Internal Governance in the Nonprofit Boardroom: a participant observer
study.” Corporate Governance: An International Review, 15(5):923-934.
Patel, R. and Gottlieb, C. (2012) Reform of the UK competition regime.
Patton, A. and J. C. Baker (1987). 'Why won't directors rock the boat?', Harvard Business
Review, 65(6), pp. 10-12, 16, 18.
Pearce, J.A. and Zahra, S.A. (1992) Board composition from a strategic contingency perspective.
Journal of Management Studies, 29 (4): 411-438.
Peasnell, K. V., Pope, P. F., & Young, S. (2005). Board monitoring and earnings management:
do outside directors influence abnormal accruals? Journal of Business Finance &
Accounting, 32(7&8), 1311-1346.
Peasnell, K.V., Pope, P.F., and Young, S. (2000a) Accrual management to meet earnings targets:
UK evidence pre-and post-Cadbury. The British Accounting Review, 32 (4): 415-445.
Peng, M.W. (2004) Outside directors and frim performance during institutional transitions.
Strategic Management Journal, 25 (5): 453-471.
Pérez-González, Francisco. 2006. "Inherited Control and Firm Performance." American
Economic Review, 96(5): 1559-1588.
Pfeffer, J. (1982) Organizations and organization theory. Pitman, Marshfield.
Pfeffer, J., and Salancik, G. R. (1978). The external control of organizations: A resource
dependence perspective. New York: Harper and Row.
Pi, L. And S.G. Timme, (1993), ''Corprate control and bank efficiency'', Journal of Banking and
Finance 17, 515-530
Porter, M.E. (1980) Competitive Strategy: Techniques for Analyzing Industries and
Competitors. New York: Free Press.
Porter, M.E. and Sakakibara, M. (2004) Competition in Japan. Journal of Economic
Perspectives, 18 (1): 27-50.
281
Porter, R.H. and Zona, J.D. (1993) Ohio school milk markets: an analysis of bidding. RAND
Journal of Economics. 30 (1): 263-288.
Posner, R.A. (1970) A statistical study of antitrust enforcement. Journal of Law and Economics,
13 (1): 365-419.
Posner, R.A. (1976) Antitrust law: An economic prospective. Chicago: University of Chicago
Press.
Posner, R.A. (1980) Optimal sanctions for white collar crime. American Criminal Law Review
17 (1): 409.
Powell, M. & Ansic, D. (1997). Gender Differences in risk behaviour in financial decision-
making: an experimental analysis.Journal of Economic Psychology 18, 605-628.
Pratt, J.H. (1994) Changes in United Kingdom competition laws: A wasted opportunity.
European Competition Law Review, 15 (2).
Prendergast, C. and Stole, L. (1996) Impetuous youngsters and jaded old-timers: Acquiring a
reputation for learning. Journal of Political Economy, 104 (6): 1105-1134.
Price, M., & Norris, D. M. (2009). White-collar crime: Corporate and securities and
commodities fraud. Journal of the American Academy of Psychiatry and the Law
Online, 37(4), 538-544.
Raith, M. (1996) Product differentiation, uncertainty, and the stability of collusion. London
School of Economics, STICERD Discussion Paper Series EI/16: 49.
Rajagopalan, N. and Datta, D.K. (1996) CEO characteristics: Does industry matter? Academy of
Management Journal, 39 (1): 197-215.
Rechner, P.L. and Dalton, D.R. (1991) CEO duality and organizational performance: A
longitudinal analysis. Strategic Management Journal, 12 (1): 155-161.
Rezaee, Z. (2007) Corporate governance post- Sarbanes-Oxley: Regulations, requirements, and
integrated processes. NY: Wiley.
Rezaee, Z. (2009) Corporate governance and ethics. NY: Wiley.
Rhoades, D., Rechner, P., & Sundaramurthy, C. (2000). Board composition and financial
performance: a meta-analysis of the influence of outside directors. Journal of Managerial
Issues, 12(1), 76-91.
Roberts, J., McNulty, T., and Stiles, P. (2005) Beyond agency conceptions of the work of the
non?executive director: Creating accountability in the boardroom. British Journal of
Management, 16(1): S5-S26.
Roberts, K. (1985) Cartel behavior and adverse selection. Journal of Industrial Economics, 33:
401-413.
282
Roberts, S.B. and Rosenberg, I. (2006) Nutrition and aging: Changes in the regulation of energy
metabolism with aging. Physiological Reviews, 86(2): 651-667.
Robison, D. and Santore, R. (2006) Managerial incentives, fraud, and firm value.
Robison, H. and Santore, R. (2011) Managerial incentives, fraud, and firm value. Financial
Review, 46 (2): 281-311.
Roe, M.J. (1994) Strong managers, weak owners. The Political Roots of American Corporate
Finance. Princeton University Press, Princeton.
Rosenboom, N.S.R. (2012) Career development after cartel prosecution: Cartel versus non-cartel
managers, Journal of Competition Law and Economics, 8 (1): 145-165.
Rosenstein, S., and Wyatt, J.G. (1990) Outside directors, board independence, and shareholder
wealth. Journal of Financial Economics, 26 (1): 175-191.
Sahm, C. R. (2007) How much does risk tolerance change? Board of Governors of the Federal
Reserve System, Finance and Economics Discussion Series 2007-66.
Salancik, G. (1977) New directors in organizational behaviour. Chicago: St. Clair Press.
Salancik, G. (1977), ‘Commitment and Control of Organizational Behavior and Belief ’, in B.M.
Staw and G.R. Salancik (eds.), New Directions in Organizational Behavior (St. Claire Press,
Chicago), pp. 1–54
Sanchez, I. (2009) The effectiveness of corporate governance: board structure and business
technical efficiency in Spain. Central European Journal of Operations Research, 18 (3): 311-
339.
Scharfstein, D.S. and Stein, J.C. (1990) Herd behavior and investment. The American Economic
Review, 80 (3): 465-479.
Schaub, A. (2001) Cartel enforcement by the European Commission. Fighting Cartels: Why and
how? Konkurrensverket, Swedish Competition Authority, pp. 185-190.
Schelling, T.C. (1960) The strategy of conflict. Cambridge, MA: Harvard University Press.
Scherer, F.M. and Ross, D. (1990) Industrial market structure and economic performance. 3rd
ed. Boston, Mass.: Houghton Mifflin.
Schmitt, N. and Weder, R. (1998) Sunk costs and cartel formation: Theory and application to the
dyestuff industry. Journal of Economic Behaviour and Organization, 36 (2): 197-220.
Scholes, M. S. (1991). Stock and Compensation*. The Journal of Finance,46(3), 802-823.
Schubert, R., Brown, M., Gysler, M., and Brachinger, H. W. (1999) Financial decision-making:
Are women really more risk-averse? The American Economic Review, 89(2): 381-385.
Schwab, S.J., and R.S. Thomas (2006). An Empirical Analysis of CEO Employment
Contracts:What Do Top Executives Bargain For? Washington and Lee Law Review 63,
231-270
283
Sealy, L.S. and Milman, D. (2012) Annotated guide to the insolvency legislation. 15th Edition,
Vol. 2. London: Sweet and Maxwell.
Serfling, M. A. (2012) CEO age and the riskiness of corporate policies. Social Science Research
Network.
Serwinek, P. (1992) ‘Demographic and Related Differences in Ethical Views Among Small
Businesses’, Journal of Business Ethics 11(7): 555–66.
Sharma, S. K. (2011) E-adoption and socio-economic impacts: Emerging infrastructural effects.
Hershey, PA: IGI Global.
Shivdasani, A (1993) Board composition, ownership structure, and hostile takeovers. Journal of
Accounting and Economics, 16 (1-3): 167-198.
Shivdasani, A. (2003) Board composition, ownership structure, and hostile takeovers. Journal of
Accounting and Economics, 16 (1): 167-198.
Shivdasani, A. and Yermack, D. (1999) CEO involvement in the selection of new board
members: an empirical analysis. Journal of Finance, 54 (5): 1829-1853.
Shleifer, A. and Vishny, R. W. (1997) A survey of corporate governance. Journal of Finance
52(2): 737-783.
Shleifer, A. and Vishny, R.W. (1989) Management entrenchment: The case of manager-specific
investments. Journal of Financial Economics, 25 (1): 123-139.
Shleifer, A., & Vishny, R. (1986). Large shareholders and corporate control. Journal of Political
Economy, 94, 461-488.
Shoemaker, P.J.H. (1980). Experiments on decisions under risk: The expected utility hypothesis.
Boston: Martinus Nijhoff Publishing.
Shrader, C., Blackburn, V. and Iies, P. (1997) Women in Management and firm financial
performance: An exploratory study. Journal of Managerial Issues, 9, 355-372
Shultz, S. (2001) The board book: Making your corporate board a strategic force in your
company's success. NY: American Management Association (AMACOM).
Singh, V. and Vinnicombe, S. (2004) Why so few women directors in top UK boardrooms?
Evidence and theoretical explanations. Corporate governance: An International Review, 12
(4): 479-488.
Singh, V., Vinnicombe, S. and Johnson, P. (2001) Women directors on top UK boards.
Corporate Governance, 9 (1): 206-216.
Sitaru, D. (2011) Corporations and partnerships in Romania. The Netherlands: Kluwer Law
International BV.
Smith, C.W. and Watts, R.L. (1982) Incentive and tax effects of executive compensation plans.
Australian Journal of Management, 7(2): 139-157.
284
Snyder, C.M. (1996) A dynamic theory of countervailing power. The Rand Journal of
Economics, 28 (3): 747-769.
Solomon, J. (2007) Corporate governance and accountability. NY: John Wiley and Sons, Ltd
Solomon, J. (2010) Corporate governance and accountability. 3rd Edition. NY: Wiley and Sons.
Spagnolo, G. (1998) Shareholder-value maximization and tacit collusion. European Economic
Review, 49 (6): 1501-1523.
Spagnolo, G. (2000). Stock-related compensation and product-market competition. The RAND
Journal of Economics, 22-42.
Spagnolo, G. (2004) Divide et impera: Optimal deterrence mechanisms against cartels (and
organized crime). Manuscript, University of Mannheim, Germany.
Spagnolo, G. (2005) Managerial incentives and collusive behaviour. European Economic
Review, 49 (6): 1501-1523.
Staiger, R. W. and Wolak, F. A. (1992) Collusive Pricing with Capacity Constraints in the
Presence of Demand Uncertainty. RAND Journal of Economics 23, 203-220.
Steijvers, T., Voordeckers, W., and Vanhoof, K. (2010), ―Collateral, relationship lending and
family firms, Small Business Economics, Vol. 34 No. 3, pp. 243-259
Stein, J. (1989). Efficient capital markets, inefficient firms: A model of myopic corporate
behaviour. Quarterly Journal of Economics 103: 655-669.
Stephan, A. (2008a) The UK cartel offence: Lame duck or black mamba? CCP Working Paper
08-19, pp. 30.
Stevens, J.M., Beyer, J.M. and Trice, H.M. (1978) Assessing personal, role, and organizational
predictors of managerial commitment. Academy of Management Journal, 23 (2): 380-396.
Stigler, G. (1968) The organization of industry. Chicago, IL: University of Chicago Press.
Stoeberl, P. A. and Sherony, B. C. (1985). Board efficiency and effectiveness. (In E. Matter and
M. Balls (Eds.), Handbook for corporate directors (pp. 12.1- 12.10). New York: McGraw-
Hill)
Stone, M. and Rasp, J. (1991) Tradeoffs in the choice between logit and OLS for accounting
choice studies. Accounting Review, 66 (1): 170-187.
Sunden, A. E. (2004) How do individual accounts work in the Swedish pension system? Center
for Retirement Research at Boston College.
Sunden, A. E., and Surette, B. J. (1998) Gender differences in the allocation of assets in
retirement savings plans. The American Economic Review, 88 (2): 207-211.
Swamy, A.V., Lee, Y., Azfar, O., and Knack, S. (1999) Gender and corruption. IRIS Center.
Working Paper No. 232.
285
Symeonidis, G. (2002) Cartel stability with multiproduct firms. International Journal of
Industrial Organization, 20 (1): 339-352.
Tacheva, S., and Huse, M. (2006). Women Directors and Board Task Performance: Mediating
and Moderating Effects of Board Working Style. Conference Paper presented at European
Academy of Management Meeting, Oslo.
Tagg, B. (2013) Before the signing: Structuring children's choirs for success. NY: Oxford
University Press.
Taylor, R.N. (1975) Age and experience as determinants of managerial information Processing
and decision-making performance. Academy of Management, 18 (1): 74-81.
The Economist (2002) Sustaining the poor's development.
Thépot, F. (2011) Leniency and individual liability: Opening the black box of the cartel. The
Competition Law Review, 7 (2): 221-240.
Thomsen, S., and Pedersen, T. (2000, Jun.). Ownership Structure and Economic Performance in
the Largest European Companies. Strategic Journal Management, 21(6), 689-705.
Tirole, J. (1988) The theory of industrial organization. NY: MIT Press.
Tosi, H.L., Brownlee, A.L., Silva, P., and Katz, J.P. (2003) An empirical exploration of
decision-making under agency controls and stewardship structure. Journal of Management
Studies, 40 (8): 2053-2071.
Triki, T., Sami, H., and Ureche-Rangan, L. (2012) How Successful are Women in Breaking the
Glass Ceiling? Evidence from the US Market. In S. Boubaker and D. K. Nguyen (Eds.)
Board directors and corporate social responsibility. NY: Palgrave MacMillan.
Tufano, P. and Sevick, M. (1997) Board structure and fee-setting in the US mutual fund
industry. Journal of Financial Economics, 46 (3): 321.
U.S. Department of Justice (1993) Corporate leniency policy.
UN Department of Economic Affairs (1947) International cartels: A league of nations
memorandum. New York: Lake Success.
Vafeas, N. (2003) Length of board tenure and outside director independence. Journal of Business
Finance and Accounting, 30 (7-8): 1043-1064.
Van den Berghe, L.A.A., and Levrau, A. (2002) The role of the venture capitalist as monitor of
the company: a corporate governance perspective. Corporate Governance: An International
Review, 10(3): 124-135.
Van Dijk, T., & Verboven, F. (2010). Implementing the passing-on defence in cartel damages
actions. Global Competition Litigation Review, 3(3), 98-106.
Van Frederikslust, R.A.I, Ang, J.S., and Sudarsanam, P.S. (2008) Corporate governance and
corporate finance: A European perspective. NY: Routledge.
286
Van Horne, J.C. and Wachowicz, J.M. (2005) Fundamentals of financial management. Twelfth
Edition. NY: Financial Times Prentice Hall.
Van Miert, K. (1998). Globalization of competition: the need for global governance. Speech at
the VLB Brussels March, 25.
Vance, S.C. (1983) Corporate leadership: Boards of directors and strategy. New York: McGraw-
Hill.
Vancil, R.F (1987) Passing the baton: Managing the process of CEO succession. Harvard
Business School Press. Boston, MA.
Veljanovski, C. (2007) EC merger policy after airtours and GE/Honeywell. Antitrust Bulletin.
Veljanovski, C. (2011) Deterrence, recidivism, and European cartel fines. Journal of
Competition Law and Economics, 7 (1): 871-915.
Vell, D. (2010) Building a board of directors as a strategic weapon. USA: Vell Executive
Search, Inc.
Vicknair, D., Hickman, K. and Carnes, K.C. (1993) A Note on audit committee independence.
Accounting Horizon, 7(1): 53-57.
Villalonga, B. and R. Amit, (2006), “How Do Family Ownership, Control, and Management
Affect Firm Value?” Journal of Financial Economics 80, 385-417
Von Weizsacker (1980) A welfare analysis of barriers to entry. Journal of Economics, 11 (2):
399-420.
Walsh, J. P. and J. K. Seward (1990). 'On the efficiency of internal and external corporate
control mechanisms', Academy of Management Review, 15, pp. 421-458.
Warner, J.B., Watts, R.L., and Wruck, K.H. (1998) Stock prices and top management changes,
Journal of Financial Economics, 20: 461-492.
Watts, R. and Zimmerman, J. (1983) Agency problems, auditing, and the theory of the firm:
Some evidence. Journal of Law and Economics, 26 (1): 613-633.
Watts, R. and Zimmerman, J. (1986) Positive accounting theory. Englewood Cliffs: Prentice-
Hall.
Weir, C., Laing, D., and McKnight, P.J. (2002) Internal and external governance mechanisms:
Their impact on the performance of large UK public companies. Journal of Business
Finance and Accounting, 29 (5): 579-611.
Weisbach, M.S. (1988) Outside directors and CEO turnover. Journal of Financial Economics 20:
431-460.
Whish, R. (2009) Competition law. Oxford: Oxford University Press.
287
Wiersema, M. and Bantel, K. (1992) Top management team demography and corporate strategic
change. Academy of Management Journal, 35 (1): 91-121.
Wilks, S. (2005) Agency escape: decentralization or dominance of the European Commission in
the modernization of competition policy? Governance, 18(3): 431-452.
Willekens, M. and Sercu, P. (2005) Corporate governance at the crossroads. Oxford, UK:
Intersentia.
Williamson, O.E. (1984). The economics of governance: framework and
implications. Zeitschrift für die gesamte Staatswissenschaft/Journal of Institutional and
Theoretical Economics, 140(1), 195-223.
Williamson, O.E. (1985). “The Economic Institutions of Capitalism.” New York: Free Press.
Williamson, O.E. (1988) Corporate finance and corporate governance. Journal of Finance, 43
(3): 567-591.
Wils, W. (2006) Optimal antitrust fines: Theory and practice. London: Sage Publication.
Wils, W.(2005) Is criminalization of EU competition law the answer? In: Criminalization of
competition law enforcement: economic and legal implications for the EU Member States.
Cseres, K.J., Schinkel, M.P. and Vogelaar, F.O.W. (eds.). London: Edward Elgar.
Wolfers, J. (2006) Diagnosing discrimination: Stock returns and CEO gender. Journal of the
European Economic Association, 4(2?3): 531-541.
Wood, M.J. and Ross-Kerr, J.C. (2011) Basic steps in planning nursing research: From question
to proposal. Seventh Edition. London: Jones and Bartlett Publishers, LLC.
Xie, B., Davidson, W.N., and DaDalt, P.J. (2003) Earnings management and corporate
governance: the role of the board and the audit committee. Journal of Corporate Finance, 9
(3): 295-316.
Yermack, D. (1996) Higher market valuation of companies with a small board of directors.
Journal of Financial Economics, 40 (1): 185-221.
Young, E. (2012) Global bribery and corruption fraud risks.
Young, G. J., Stedham, Y. and Beekun, R.I. (2000). “ Boards of directors and the adoption of a
CEO performance evaluatioin process: Agency - and institutional - theory perspectives.”
Journal of Management Studies, 37(2): 277-295.
Young, M. N. and Buchholtz, A. K. (2002) Firm performance and CEO pay: Relational
demography as a moderator. Journal of Managerial Issues, 14 (3): 296-313.
Zahid Lgbal, Sewon O, H, Young Baek (2006), ‘Are Female Executives More Risk-Averse than
Male Executives?’ Atlantic Economic Journal Vol 34 Issue 1, 63
Zahra, S. and Pearce, J. (1989) Boards of directors and corporate financial performance: A
review and integrative model. Journal of Management, 15: 291-244.

288
Zald, M.N. (1969) The power and functions of boards of directors: A theoretical synthesis.
American Journal of Sociology, 75 (1): 97-111.
Zeckhouser, R. J. Pound (1990) Are Large Shareholders Effective Monitors? An Investigation of
Share Ownership and Corporate Performance. In R. Hubbard (ed) Asymmetric Information,
Corporate Finance and Investment. University of Chicago. Chicago Press. 149–180.
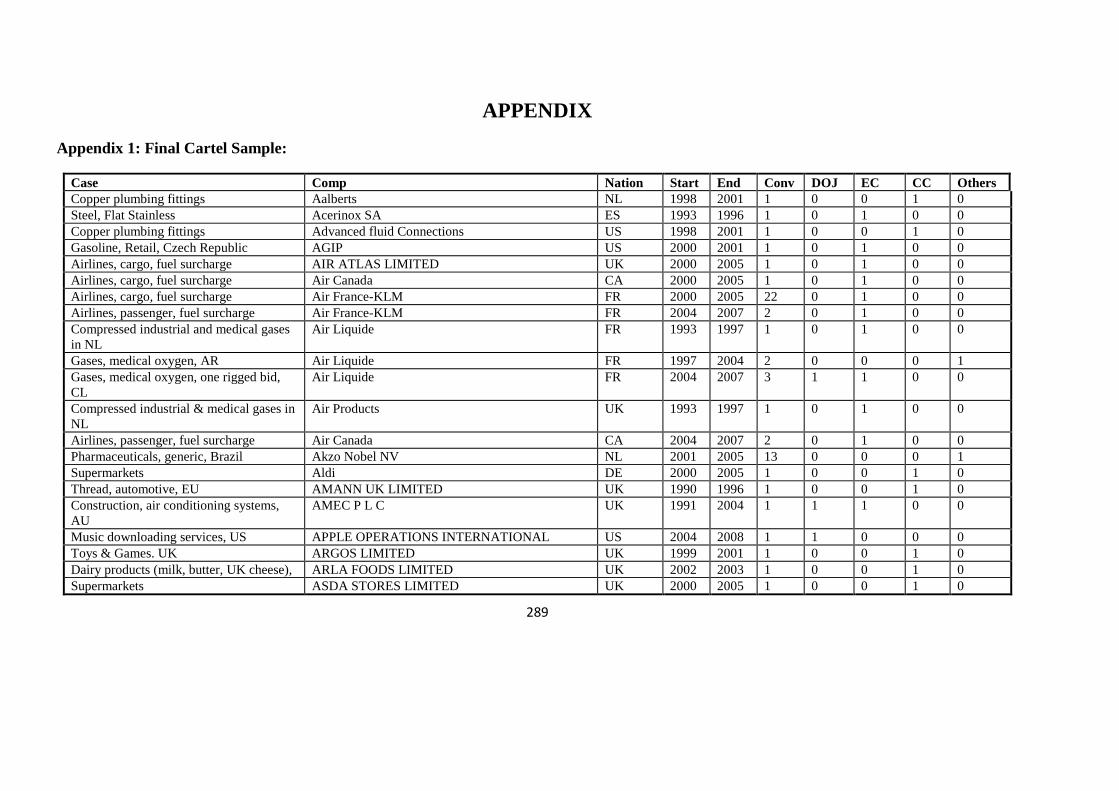
289
APPENDIX
Appendix 1: Final Cartel Sample:
Case Comp Nation Start End Conv DOJ EC CC Others
Copper plumbing fittings Aalberts NL 1998 2001 1 0 0 1 0
Steel, Flat Stainless Acerinox SA ES 1993 1996 1 0 1 0 0
Copper plumbing fittings Advanced fluid Connections US 1998 2001 1 0 0 1 0
Gasoline, Retail, Czech Republic AGIP US 2000 2001 1 0 1 0 0
Airlines, cargo, fuel surcharge AIR ATLAS LIMITED UK 2000 2005 1 0 1 0 0
Airlines, cargo, fuel surcharge Air Canada CA 2000 2005 1 0 1 0 0
Airlines, cargo, fuel surcharge Air France-KLM FR 2000 2005 22 0 1 0 0
Airlines, passenger, fuel surcharge Air France-KLM FR 2004 2007 2 0 1 0 0
Compressed industrial and medical gases
in NL
Air Liquide FR 1993 1997 1 0 1 0 0
Gases, medical oxygen, AR Air Liquide FR 1997 2004 2 0 0 0 1
Gases, medical oxygen, one rigged bid,
CL
Air Liquide FR 2004 2007 3 1 1 0 0
Compressed industrial & medical gases in
NL
Air Products UK 1993 1997 1 0 1 0 0
Airlines, passenger, fuel surcharge Air Canada CA 2004 2007 2 0 1 0 0
Pharmaceuticals, generic, Brazil Akzo Nobel NV NL 2001 2005 13 0 0 0 1
Supermarkets Aldi DE 2000 2005 1 0 0 1 0
Thread, automotive, EU AMANN UK LIMITED UK 1990 1996 1 0 0 1 0
Construction, air conditioning systems,
AU
AMEC P L C UK 1991 2004 1 1 1 0 0
Music downloading services, US APPLE OPERATIONS INTERNATIONAL US 2004 2008 1 1 0 0 0
Toys & Games. UK ARGOS LIMITED UK 1999 2001 1 0 0 1 0
Dairy products (milk, butter, UK cheese), ARLA FOODS LIMITED UK 2002 2003 1 0 0 1 0
Supermarkets ASDA STORES LIMITED UK 2000 2005 1 0 0 1 0
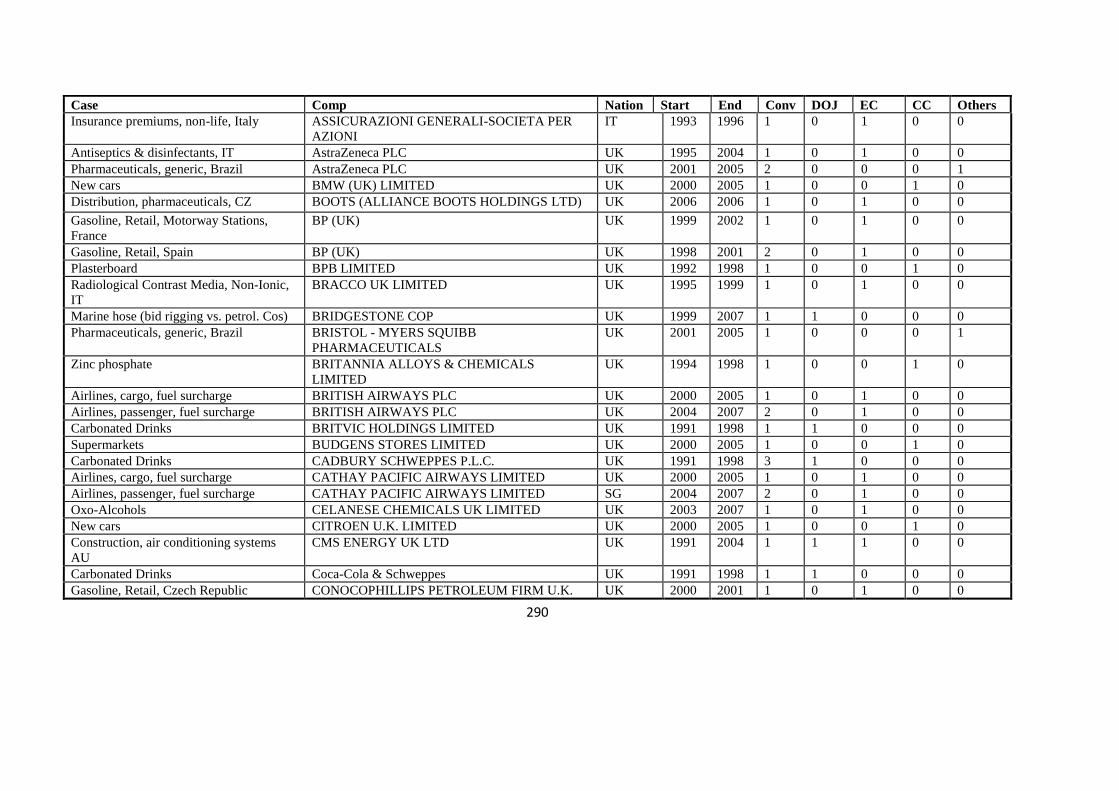
290
Case Comp Nation Start End Conv DOJ EC CC Others
Insurance premiums, non-life, Italy ASSICURAZIONI GENERALI-SOCIETA PER
AZIONI
IT 1993 1996 1 0 1 0 0
Antiseptics & disinfectants, IT AstraZeneca PLC UK 1995 2004 1 0 1 0 0
Pharmaceuticals, generic, Brazil AstraZeneca PLC UK 2001 2005 2 0 0 0 1
New cars BMW (UK) LIMITED UK 2000 2005 1 0 0 1 0
Distribution, pharmaceuticals, CZ BOOTS (ALLIANCE BOOTS HOLDINGS LTD) UK 2006 2006 1 0 1 0 0
Gasoline, Retail, Motorway Stations,
France
BP (UK) UK 1999 2002 1 0 1 0 0
Gasoline, Retail, Spain BP (UK) UK 1998 2001 2 0 1 0 0
Plasterboard BPB LIMITED UK 1992 1998 1 0 0 1 0
Radiological Contrast Media, Non-Ionic,
IT
BRACCO UK LIMITED UK 1995 1999 1 0 1 0 0
Marine hose (bid rigging vs. petrol. Cos) BRIDGESTONE COP UK 1999 2007 1 1 0 0 0
Pharmaceuticals, generic, Brazil BRISTOL - MYERS SQUIBB
PHARMACEUTICALS
UK 2001 2005 1 0 0 0 1
Zinc phosphate BRITANNIA ALLOYS & CHEMICALS
LIMITED
UK 1994 1998 1 0 0 1 0
Airlines, cargo, fuel surcharge BRITISH AIRWAYS PLC UK 2000 2005 1 0 1 0 0
Airlines, passenger, fuel surcharge BRITISH AIRWAYS PLC UK 2004 2007 2 0 1 0 0
Carbonated Drinks BRITVIC HOLDINGS LIMITED UK 1991 1998 1 1 0 0 0
Supermarkets BUDGENS STORES LIMITED UK 2000 2005 1 0 0 1 0
Carbonated Drinks CADBURY SCHWEPPES P.L.C. UK 1991 1998 3 1 0 0 0
Airlines, cargo, fuel surcharge CATHAY PACIFIC AIRWAYS LIMITED UK 2000 2005 1 0 1 0 0
Airlines, passenger, fuel surcharge CATHAY PACIFIC AIRWAYS LIMITED SG 2004 2007 2 0 1 0 0
Oxo-Alcohols CELANESE CHEMICALS UK LIMITED UK 2003 2007 1 0 1 0 0
New cars CITROEN U.K. LIMITED UK 2000 2005 1 0 0 1 0
Construction, air conditioning systems
AU
CMS ENERGY UK LTD UK 1991 2004 1 1 1 0 0
Carbonated Drinks Coca-Cola & Schweppes UK 1991 1998 1 1 0 0 0
Gasoline, Retail, Czech Republic CONOCOPHILLIPS PETROLEUM FIRM U.K. UK 2000 2001 1 0 1 0 0
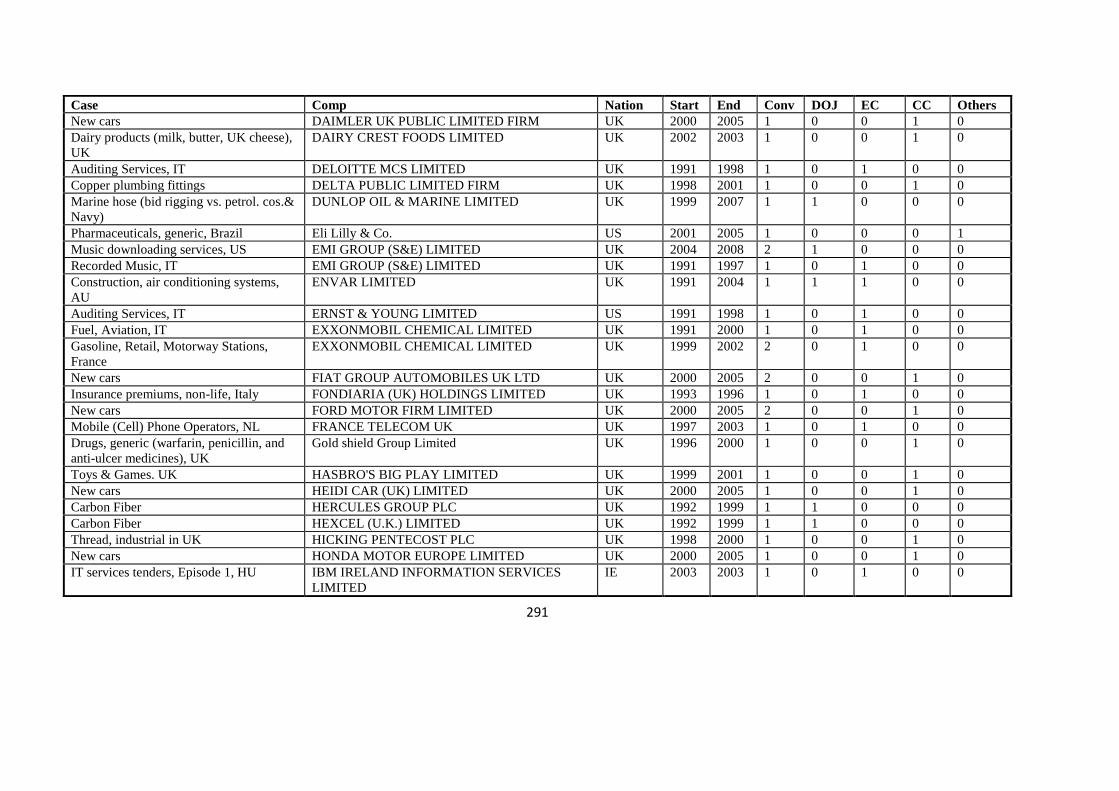
291
Case Comp Nation Start End Conv DOJ EC CC Others
New cars DAIMLER UK PUBLIC LIMITED FIRM UK 2000 2005 1 0 0 1 0
Dairy products (milk, butter, UK cheese),
UK
DAIRY CREST FOODS LIMITED UK 2002 2003 1 0 0 1 0
Auditing Services, IT DELOITTE MCS LIMITED UK 1991 1998 1 0 1 0 0
Copper plumbing fittings DELTA PUBLIC LIMITED FIRM UK 1998 2001 1 0 0 1 0
Marine hose (bid rigging vs. petrol. cos.&
Navy)
DUNLOP OIL & MARINE LIMITED UK 1999 2007 1 1 0 0 0
Pharmaceuticals, generic, Brazil Eli Lilly & Co. US 2001 2005 1 0 0 0 1
Music downloading services, US EMI GROUP (S&E) LIMITED UK 2004 2008 2 1 0 0 0
Recorded Music, IT EMI GROUP (S&E) LIMITED UK 1991 1997 1 0 1 0 0
Construction, air conditioning systems,
AU
ENVAR LIMITED UK 1991 2004 1 1 1 0 0
Auditing Services, IT ERNST & YOUNG LIMITED US 1991 1998 1 0 1 0 0
Fuel, Aviation, IT EXXONMOBIL CHEMICAL LIMITED UK 1991 2000 1 0 1 0 0
Gasoline, Retail, Motorway Stations,
France
EXXONMOBIL CHEMICAL LIMITED UK 1999 2002 2 0 1 0 0
New cars FIAT GROUP AUTOMOBILES UK LTD UK 2000 2005 2 0 0 1 0
Insurance premiums, non-life, Italy FONDIARIA (UK) HOLDINGS LIMITED UK 1993 1996 1 0 1 0 0
New cars FORD MOTOR FIRM LIMITED UK 2000 2005 2 0 0 1 0
Mobile (Cell) Phone Operators, NL FRANCE TELECOM UK UK 1997 2003 1 0 1 0 0
Drugs, generic (warfarin, penicillin, and
anti-ulcer medicines), UK
Gold shield Group Limited UK 1996 2000 1 0 0 1 0
Toys & Games. UK HASBRO'S BIG PLAY LIMITED UK 1999 2001 1 0 0 1 0
New cars HEIDI CAR (UK) LIMITED UK 2000 2005 1 0 0 1 0
Carbon Fiber HERCULES GROUP PLC UK 1992 1999 1 1 0 0 0
Carbon Fiber HEXCEL (U.K.) LIMITED UK 1992 1999 1 1 0 0 0
Thread, industrial in UK HICKING PENTECOST PLC UK 1998 2000 1 0 0 1 0
New cars HONDA MOTOR EUROPE LIMITED UK 2000 2005 1 0 0 1 0
IT services tenders, Episode 1, HU IBM IRELAND INFORMATION SERVICES
LIMITED
IE 2003 2003 1 0 1 0 0
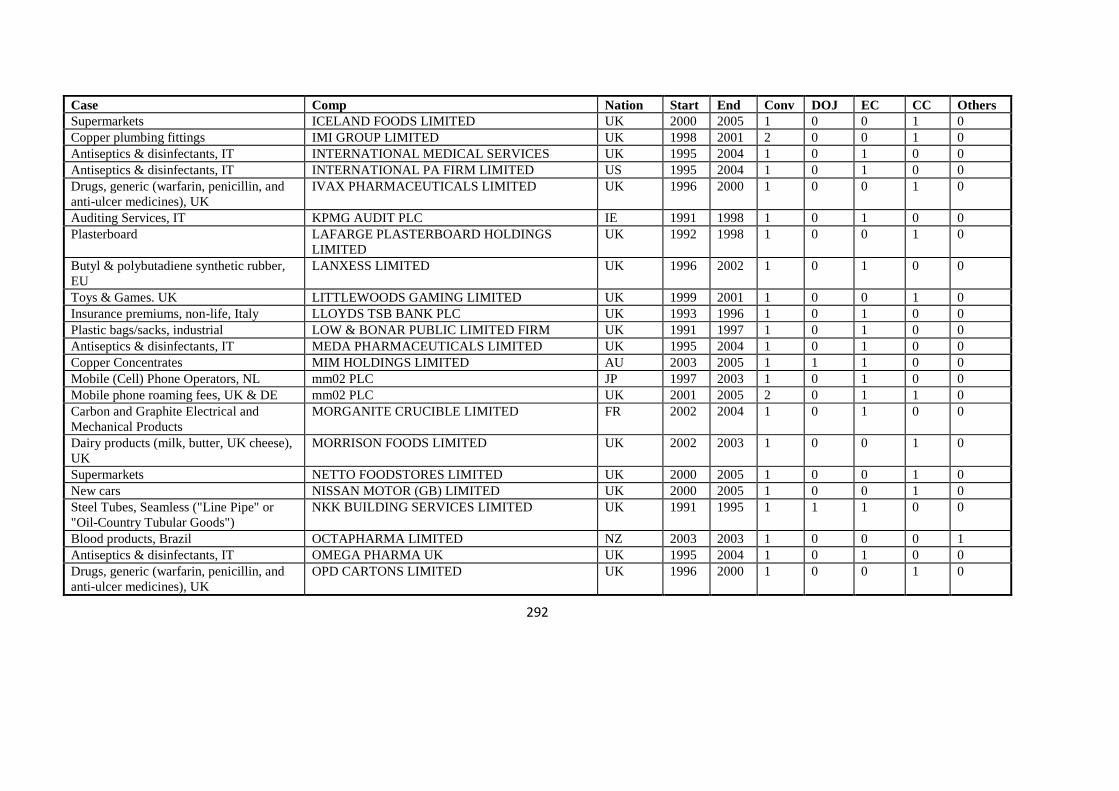
292
Case Comp Nation Start End Conv DOJ EC CC Others
Supermarkets ICELAND FOODS LIMITED UK 2000 2005 1 0 0 1 0
Copper plumbing fittings IMI GROUP LIMITED UK 1998 2001 2 0 0 1 0
Antiseptics & disinfectants, IT INTERNATIONAL MEDICAL SERVICES UK 1995 2004 1 0 1 0 0
Antiseptics & disinfectants, IT INTERNATIONAL PA FIRM LIMITED US 1995 2004 1 0 1 0 0
Drugs, generic (warfarin, penicillin, and
anti-ulcer medicines), UK
IVAX PHARMACEUTICALS LIMITED UK 1996 2000 1 0 0 1 0
Auditing Services, IT KPMG AUDIT PLC IE 1991 1998 1 0 1 0 0
Plasterboard LAFARGE PLASTERBOARD HOLDINGS
LIMITED
UK 1992 1998 1 0 0 1 0
Butyl & polybutadiene synthetic rubber,
EU
LANXESS LIMITED UK 1996 2002 1 0 1 0 0
Toys & Games. UK LITTLEWOODS GAMING LIMITED UK 1999 2001 1 0 0 1 0
Insurance premiums, non-life, Italy LLOYDS TSB BANK PLC UK 1993 1996 1 0 1 0 0
Plastic bags/sacks, industrial LOW & BONAR PUBLIC LIMITED FIRM UK 1991 1997 1 0 1 0 0
Antiseptics & disinfectants, IT MEDA PHARMACEUTICALS LIMITED UK 1995 2004 1 0 1 0 0
Copper Concentrates MIM HOLDINGS LIMITED AU 2003 2005 1 1 1 0 0
Mobile (Cell) Phone Operators, NL mm02 PLC JP 1997 2003 1 0 1 0 0
Mobile phone roaming fees, UK & DE mm02 PLC UK 2001 2005 2 0 1 1 0
Carbon and Graphite Electrical and
Mechanical Products
MORGANITE CRUCIBLE LIMITED FR 2002 2004 1 0 1 0 0
Dairy products (milk, butter, UK cheese),
UK
MORRISON FOODS LIMITED UK 2002 2003 1 0 0 1 0
Supermarkets NETTO FOODSTORES LIMITED UK 2000 2005 1 0 0 1 0
New cars NISSAN MOTOR (GB) LIMITED UK 2000 2005 1 0 0 1 0
Steel Tubes, Seamless ("Line Pipe" or
"Oil-Country Tubular Goods")
NKK BUILDING SERVICES LIMITED UK 1991 1995 1 1 1 0 0
Blood products, Brazil OCTAPHARMA LIMITED NZ 2003 2003 1 0 0 0 1
Antiseptics & disinfectants, IT OMEGA PHARMA UK UK 1995 2004 1 0 1 0 0
Drugs, generic (warfarin, penicillin, and
anti-ulcer medicines), UK
OPD CARTONS LIMITED UK 1996 2000 1 0 0 1 0
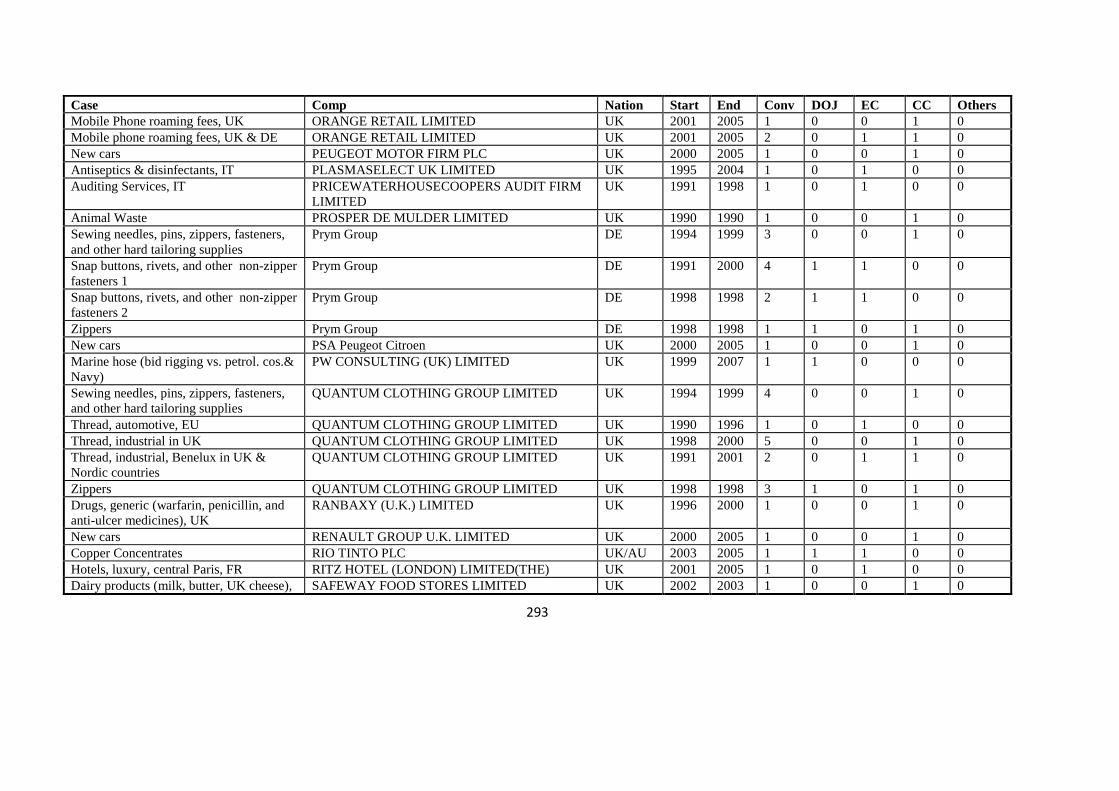
293
Case Comp Nation Start End Conv DOJ EC CC Others
Mobile Phone roaming fees, UK ORANGE RETAIL LIMITED UK 2001 2005 1 0 0 1 0
Mobile phone roaming fees, UK & DE ORANGE RETAIL LIMITED UK 2001 2005 2 0 1 1 0
New cars PEUGEOT MOTOR FIRM PLC UK 2000 2005 1 0 0 1 0
Antiseptics & disinfectants, IT PLASMASELECT UK LIMITED UK 1995 2004 1 0 1 0 0
Auditing Services, IT PRICEWATERHOUSECOOPERS AUDIT FIRM
LIMITED
UK 1991 1998 1 0 1 0 0
Animal Waste PROSPER DE MULDER LIMITED UK 1990 1990 1 0 0 1 0
Sewing needles, pins, zippers, fasteners,
and other hard tailoring supplies
Prym Group DE 1994 1999 3 0 0 1 0
Snap buttons, rivets, and other non-zipper
fasteners 1
Prym Group DE 1991 2000 4 1 1 0 0
Snap buttons, rivets, and other non-zipper
fasteners 2
Prym Group DE 1998 1998 2 1 1 0 0
Zippers Prym Group DE 1998 1998 1 1 0 1 0
New cars PSA Peugeot Citroen UK 2000 2005 1 0 0 1 0
Marine hose (bid rigging vs. petrol. cos.&
Navy)
PW CONSULTING (UK) LIMITED UK 1999 2007 1 1 0 0 0
Sewing needles, pins, zippers, fasteners,
and other hard tailoring supplies
QUANTUM CLOTHING GROUP LIMITED UK 1994 1999 4 0 0 1 0
Thread, automotive, EU QUANTUM CLOTHING GROUP LIMITED UK 1990 1996 1 0 1 0 0
Thread, industrial in UK QUANTUM CLOTHING GROUP LIMITED UK 1998 2000 5 0 0 1 0
Thread, industrial, Benelux in UK &
Nordic countries
QUANTUM CLOTHING GROUP LIMITED UK 1991 2001 2 0 1 1 0
Zippers QUANTUM CLOTHING GROUP LIMITED UK 1998 1998 3 1 0 1 0
Drugs, generic (warfarin, penicillin, and
anti-ulcer medicines), UK
RANBAXY (U.K.) LIMITED UK 1996 2000 1 0 0 1 0
New cars RENAULT GROUP U.K. LIMITED UK 2000 2005 1 0 0 1 0
Copper Concentrates RIO TINTO PLC UK/AU 2003 2005 1 1 1 0 0
Hotels, luxury, central Paris, FR RITZ HOTEL (LONDON) LIMITED(THE) UK 2001 2005 1 0 1 0 0
Dairy products (milk, butter, UK cheese), SAFEWAY FOOD STORES LIMITED UK 2002 2003 1 0 0 1 0
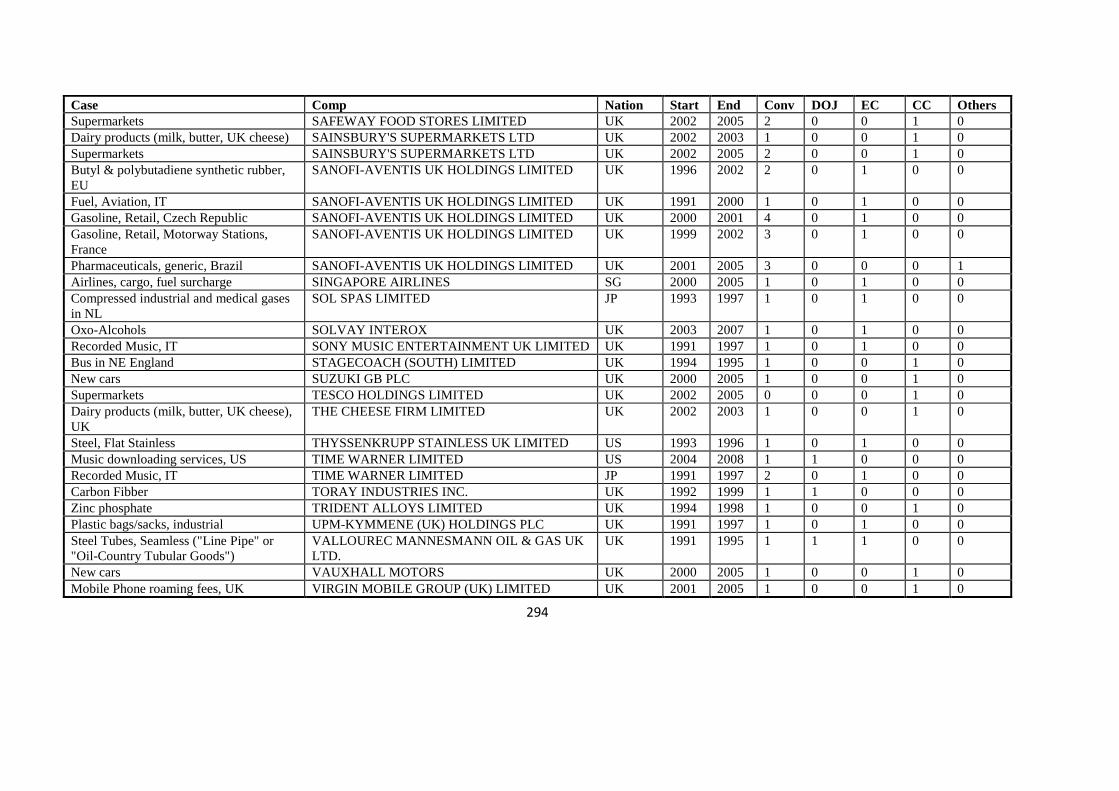
294
Case Comp Nation Start End Conv DOJ EC CC Others
Supermarkets SAFEWAY FOOD STORES LIMITED UK 2002 2005 2 0 0 1 0
Dairy products (milk, butter, UK cheese) SAINSBURY'S SUPERMARKETS LTD UK 2002 2003 1 0 0 1 0
Supermarkets SAINSBURY'S SUPERMARKETS LTD UK 2002 2005 2 0 0 1 0
Butyl & polybutadiene synthetic rubber,
EU
SANOFI-AVENTIS UK HOLDINGS LIMITED UK 1996 2002 2 0 1 0 0
Fuel, Aviation, IT SANOFI-AVENTIS UK HOLDINGS LIMITED UK 1991 2000 1 0 1 0 0
Gasoline, Retail, Czech Republic SANOFI-AVENTIS UK HOLDINGS LIMITED UK 2000 2001 4 0 1 0 0
Gasoline, Retail, Motorway Stations,
France
SANOFI-AVENTIS UK HOLDINGS LIMITED UK 1999 2002 3 0 1 0 0
Pharmaceuticals, generic, Brazil SANOFI-AVENTIS UK HOLDINGS LIMITED UK 2001 2005 3 0 0 0 1
Airlines, cargo, fuel surcharge SINGAPORE AIRLINES SG 2000 2005 1 0 1 0 0
Compressed industrial and medical gases
in NL
SOL SPAS LIMITED JP 1993 1997 1 0 1 0 0
Oxo-Alcohols SOLVAY INTEROX UK 2003 2007 1 0 1 0 0
Recorded Music, IT SONY MUSIC ENTERTAINMENT UK LIMITED UK 1991 1997 1 0 1 0 0
Bus in NE England STAGECOACH (SOUTH) LIMITED UK 1994 1995 1 0 0 1 0
New cars SUZUKI GB PLC UK 2000 2005 1 0 0 1 0
Supermarkets TESCO HOLDINGS LIMITED UK 2002 2005 0 0 0 1 0
Dairy products (milk, butter, UK cheese),
UK
THE CHEESE FIRM LIMITED UK 2002 2003 1 0 0 1 0
Steel, Flat Stainless THYSSENKRUPP STAINLESS UK LIMITED US 1993 1996 1 0 1 0 0
Music downloading services, US TIME WARNER LIMITED US 2004 2008 1 1 0 0 0
Recorded Music, IT TIME WARNER LIMITED JP 1991 1997 2 0 1 0 0
Carbon Fibber TORAY INDUSTRIES INC. UK 1992 1999 1 1 0 0 0
Zinc phosphate TRIDENT ALLOYS LIMITED UK 1994 1998 1 0 0 1 0
Plastic bags/sacks, industrial UPM-KYMMENE (UK) HOLDINGS PLC UK 1991 1997 1 0 1 0 0
Steel Tubes, Seamless ("Line Pipe" or
"Oil-Country Tubular Goods")
VALLOUREC MANNESMANN OIL & GAS UK
LTD.
UK 1991 1995 1 1 1 0 0
New cars VAUXHALL MOTORS UK 2000 2005 1 0 0 1 0
Mobile Phone roaming fees, UK VIRGIN MOBILE GROUP (UK) LIMITED UK 2001 2005 1 0 0 1 0
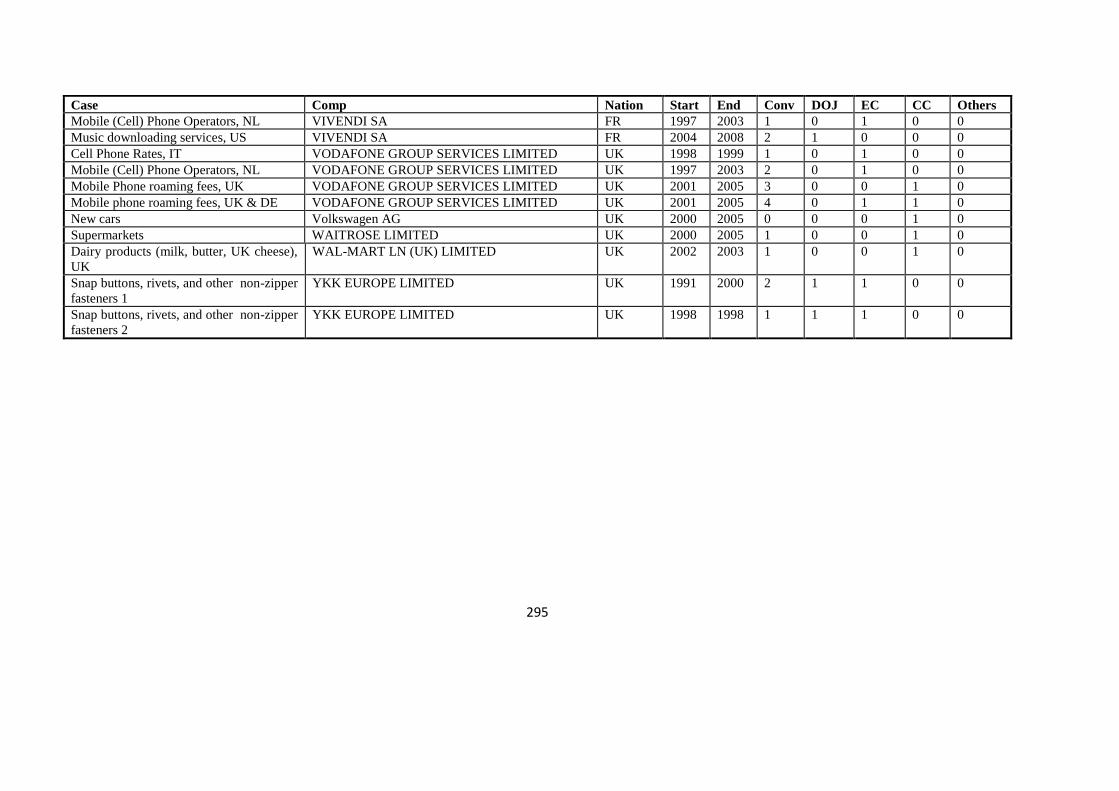
295
Case Comp Nation Start End Conv DOJ EC CC Others
Mobile (Cell) Phone Operators, NL VIVENDI SA FR 1997 2003 1 0 1 0 0
Music downloading services, US VIVENDI SA FR 2004 2008 2 1 0 0 0
Cell Phone Rates, IT VODAFONE GROUP SERVICES LIMITED UK 1998 1999 1 0 1 0 0
Mobile (Cell) Phone Operators, NL VODAFONE GROUP SERVICES LIMITED UK 1997 2003 2 0 1 0 0
Mobile Phone roaming fees, UK VODAFONE GROUP SERVICES LIMITED UK 2001 2005 3 0 0 1 0
Mobile phone roaming fees, UK & DE VODAFONE GROUP SERVICES LIMITED UK 2001 2005 4 0 1 1 0
New cars Volkswagen AG UK 2000 2005 0 0 0 1 0
Supermarkets WAITROSE LIMITED UK 2000 2005 1 0 0 1 0
Dairy products (milk, butter, UK cheese),
UK
WAL-MART LN (UK) LIMITED UK 2002 2003 1 0 0 1 0
Snap buttons, rivets, and other non-zipper
fasteners 1
YKK EUROPE LIMITED UK 1991 2000 2 1 1 0 0
Snap buttons, rivets, and other non-zipper
fasteners 2
YKK EUROPE LIMITED UK 1998 1998 1 1 1 0 0
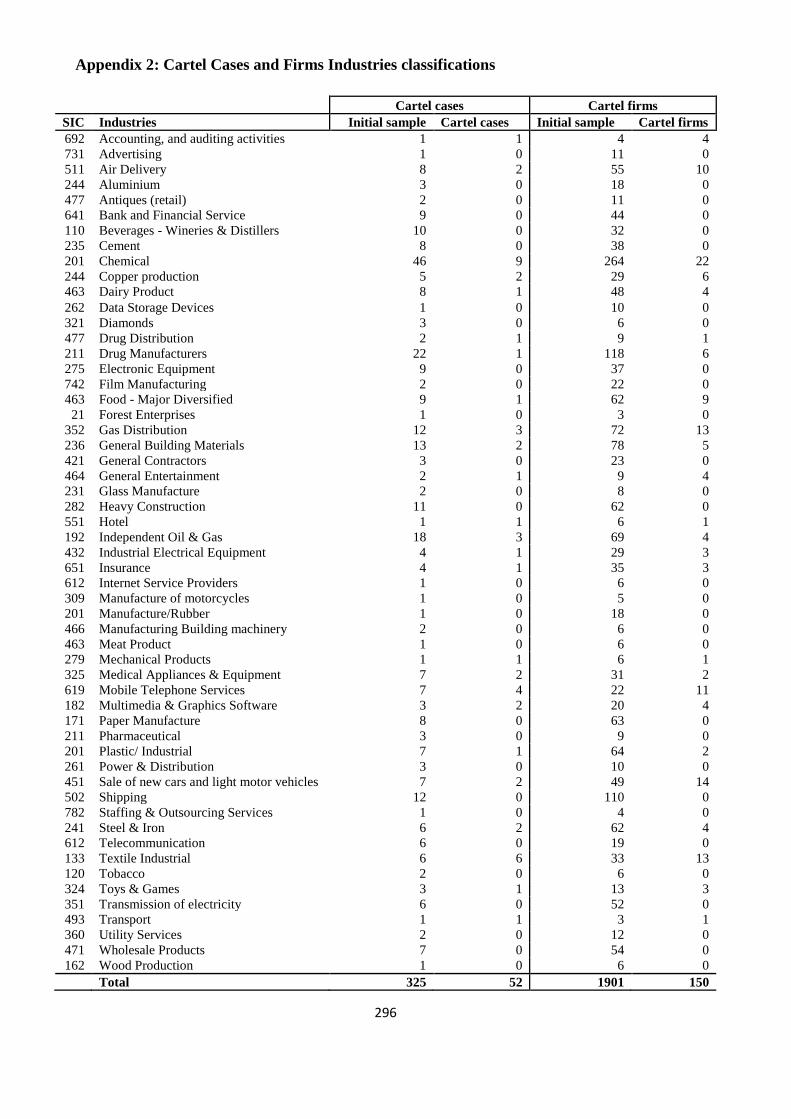
296
Appendix 2: Cartel Cases and Firms Industries classifications
Cartel cases Cartel firms
SIC Industries Initial sample Cartel cases Initial sample Cartel firms
692 Accounting, and auditing activities 1 1 4 4
731 Advertising 1 0 11 0
511 Air Delivery 8 2 55 10
244 Aluminium 3 0 18 0
477 Antiques (retail) 2 0 11 0
641 Bank and Financial Service 9 0 44 0
110 Beverages - Wineries & Distillers 10 0 32 0
235 Cement 8 0 38 0
201 Chemical 46 9 264 22
244 Copper production 5 2 29 6
463 Dairy Product 8 1 48 4
262 Data Storage Devices 1 0 10 0
321 Diamonds 3 0 6 0
477 Drug Distribution 2 1 9 1
211 Drug Manufacturers 22 1 118 6
275 Electronic Equipment 9 0 37 0
742 Film Manufacturing 2 0 22 0
463 Food - Major Diversified 9 1 62 9
21 Forest Enterprises 1 0 3 0
352 Gas Distribution 12 3 72 13
236 General Building Materials 13 2 78 5
421 General Contractors 3 0 23 0
464 General Entertainment 2 1 9 4
231 Glass Manufacture 2 0 8 0
282 Heavy Construction 11 0 62 0
551 Hotel 1 1 6 1
192 Independent Oil & Gas 18 3 69 4
432 Industrial Electrical Equipment 4 1 29 3
651 Insurance 4 1 35 3
612 Internet Service Providers 1 0 6 0
309 Manufacture of motorcycles 1 0 5 0
201 Manufacture/Rubber 1 0 18 0
466 Manufacturing Building machinery 2 0 6 0
463 Meat Product 1 0 6 0
279 Mechanical Products 1 1 6 1
325 Medical Appliances & Equipment 7 2 31 2
619 Mobile Telephone Services 7 4 22 11
182 Multimedia & Graphics Software 3 2 20 4
171 Paper Manufacture 8 0 63 0
211 Pharmaceutical 3 0 9 0
201 Plastic/ Industrial 7 1 64 2
261 Power & Distribution 3 0 10 0
451 Sale of new cars and light motor vehicles 7 2 49 14
502 Shipping 12 0 110 0
782 Staffing & Outsourcing Services 1 0 4 0
241 Steel & Iron 6 2 62 4
612 Telecommunication 6 0 19 0
133 Textile Industrial 6 6 33 13
120 Tobacco 2 0 6 0
324 Toys & Games 3 1 13 3
351 Transmission of electricity 6 0 52 0
493 Transport 1 1 3 1
360 Utility Services 2 0 12 0
471 Wholesale Products 7 0 54 0
162 Wood Production 1 0 6 0
Total 325 52 1901 150

297
Appendix 3: Matching cartel firms with non-cartel firms
Case Comp Peer1 Peer2 Peer3
Copper plumbing fittings Aalberts SUMATRA COPPER & GOLD PLC
Steel, Flat Stainless Acerinox SA RAINHAM STEEL COMPANY LIMITED
Copper plumbing fittings Advanced fluid Connections PRIMARY RESOURCES LIMITED
Gasoline, Retail, Czech Republic AGIP VALVOLINE OIL COMPANY LIMITED
Airlines, cargo, fuel surcharge AIR ATLAS LIMITED RYANAIR LIMITEDFIRST CHOICE HOLIDAYS &
FLIGHTS LIMITED
Airlines, cargo, fuel surcharge Air France-KLM NAVTECH (UK) LIMITED
Airlines, passenger, fuel surcharge Air France-KLM NAVTECH (UK) LIMITED
Compressed industrial and medical gases in NL Air Liquide INEOS FLUOR LIMITED
Gases, medical oxygen, AR Air Liquide INEOS FLUOR LIMITED
Gases, medical oxygen, one rigged bid, CL Air Liquide INEOS FLUOR LIMITED
Compressed industrial and medical gases in NL Air Products ARCH UK BIOCIDES LIMITED
Airlines, cargo, fuel surcharge AirCanada Delta Air Lines, Inc
Airlines, passenger, fuel surcharge AirCanada Delta Air Lines, Inc
Pharmaceuticals, generic, Brazil Akzo Nobel NV GENUS PHARMACEUTICALS LIMITED
Supermarkets Aldi GLANBIA INVESTMENTS LIMITED
Thread, automotive, EU AMANN UK LIMITED GUILFORD MILLS EUROPE LIMITED
Construction, air conditioning systems,AU AMEC P L C MITIE ENERGY LIMITED
Music downloading services, US APPLE OPERATIONS INTERNATIONAL ZAPF CREATION (UK) LIMITED
Toys & Games. UK ARGOS LIMITED HOME SHOPPING DIRECT LIMITED
Dairy products (milk, butter, UK cheese), UK ARLA FOODS LIMITED AN BORD BAINNE LIMITED
Supermarkets ASDA STORES LIMITED MARKS AND SPENCER GROUP P.L.C.
Insurance premiums, non-life, Italy ASSICURAZIONI GENERALI-SOCIETA PER AZIONIBanco Bradesco SA
Antiseptics & disinfectants, IT AstraZeneca PLC SUZUKEN CO., LTD.
Pharmaceuticals, generic, Brazil AstraZeneca PLC SUZUKEN CO., LTD.
New cars BMW (UK) LIMITED PENDRAGON PLC
Distribution, pharmaceuticals, CZBOOTS (ALLIANCE BOOTS HOLDINGS
LIMITED)AAH Pharmaceuticals Ltd.
Gasoline, Retail, Motorway Stations, France BP (UK) POWER HOLDINGS LIMITED Genzyme Corporation
Gasoline, Retail, Spain BP (UK) POWER HOLDINGS LIMITED Genzyme Corporation
Plasterboard BPB LIMITED AMG RESOURCES LIMITED
Radiological Contrast Media, Non-Ionic, IT BRACCO UK LIMITEDSCHERING-PLOUGH PHARMACEUTICALS
(IRELAND) LIMITED
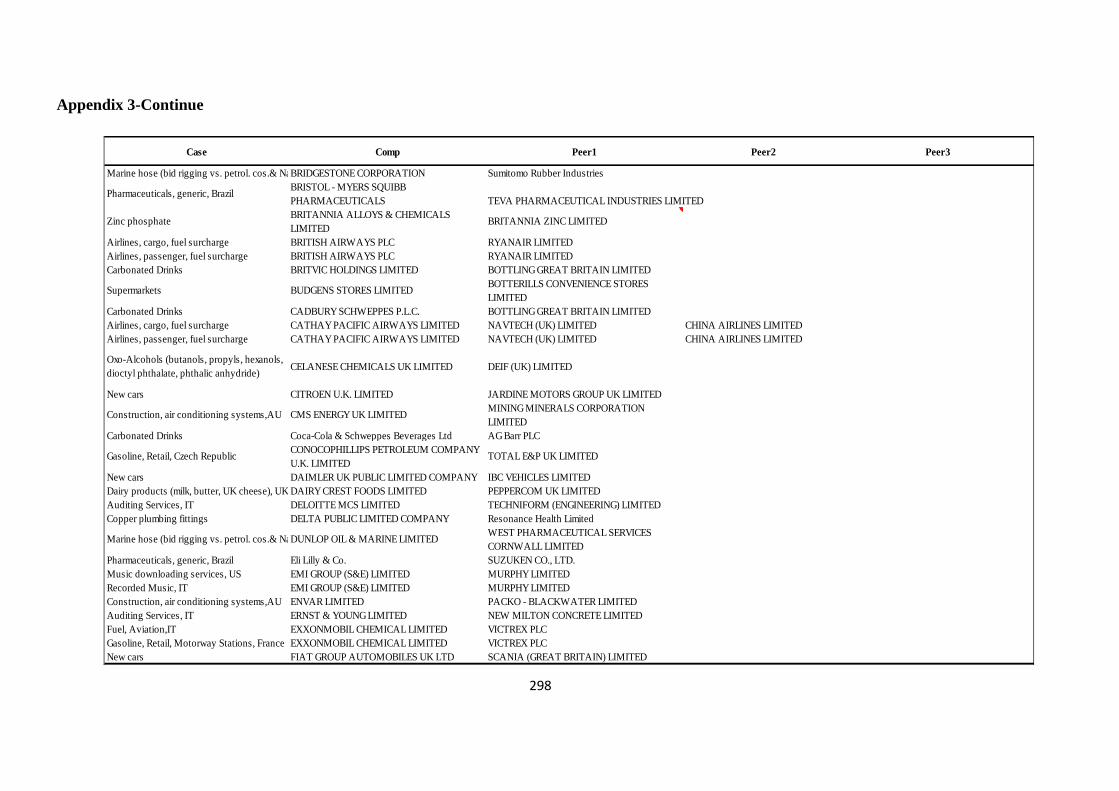
298
Appendix 3-Continue
Case Comp Peer1 Peer2 Peer3
Marine hose (bid rigging vs. petrol. cos.& Navy)BRIDGESTONE CORPORATION Sumitomo Rubber Industries
Pharmaceuticals, generic, BrazilBRISTOL - MYERS SQUIBB
PHARMACEUTICALS TEVA PHARMACEUTICAL INDUSTRIES LIMITED
Zinc phosphateBRITANNIA ALLOYS & CHEMICALS
LIMITEDBRITANNIA ZINC LIMITED
Airlines, cargo, fuel surcharge BRITISH AIRWAYS PLC RYANAIR LIMITED
Airlines, passenger, fuel surcharge BRITISH AIRWAYS PLC RYANAIR LIMITED
Carbonated Drinks BRITVIC HOLDINGS LIMITED BOTTLING GREAT BRITAIN LIMITED
Supermarkets BUDGENS STORES LIMITEDBOTTERILLS CONVENIENCE STORES
LIMITED
Carbonated Drinks CADBURY SCHWEPPES P.L.C. BOTTLING GREAT BRITAIN LIMITED
Airlines, cargo, fuel surcharge CATHAY PACIFIC AIRWAYS LIMITED NAVTECH (UK) LIMITED CHINA AIRLINES LIMITED
Airlines, passenger, fuel surcharge CATHAY PACIFIC AIRWAYS LIMITED NAVTECH (UK) LIMITED CHINA AIRLINES LIMITED
Oxo-Alcohols (butanols, propyls, hexanols,
dioctyl phthalate, phthalic anhydride)CELANESE CHEMICALS UK LIMITED DEIF (UK) LIMITED
New cars CITROEN U.K. LIMITED JARDINE MOTORS GROUP UK LIMITED
Construction, air conditioning systems,AU CMS ENERGY UK LIMITEDMINING MINERALS CORPORATION
LIMITED
Carbonated Drinks Coca-Cola & Schweppes Beverages Ltd AG Barr PLC
Gasoline, Retail, Czech RepublicCONOCOPHILLIPS PETROLEUM COMPANY
U.K. LIMITEDTOTAL E&P UK LIMITED
New cars DAIMLER UK PUBLIC LIMITED COMPANY IBC VEHICLES LIMITED
Dairy products (milk, butter, UK cheese), UK DAIRY CREST FOODS LIMITED PEPPERCOM UK LIMITED
Auditing Services, IT DELOITTE MCS LIMITED TECHNIFORM (ENGINEERING) LIMITED
Copper plumbing fittings DELTA PUBLIC LIMITED COMPANY Resonance Health Limited
Marine hose (bid rigging vs. petrol. cos.& Navy)DUNLOP OIL & MARINE LIMITEDWEST PHARMACEUTICAL SERVICES
CORNWALL LIMITED
Pharmaceuticals, generic, Brazil Eli Lilly & Co. SUZUKEN CO., LTD.
Music downloading services, US EMI GROUP (S&E) LIMITED MURPHY LIMITED
Recorded Music, IT EMI GROUP (S&E) LIMITED MURPHY LIMITED
Construction, air conditioning systems,AU ENVAR LIMITED PACKO - BLACKWATER LIMITED
Auditing Services, IT ERNST & YOUNG LIMITED NEW MILTON CONCRETE LIMITED
Fuel, Aviation,IT EXXONMOBIL CHEMICAL LIMITED VICTREX PLC
Gasoline, Retail, Motorway Stations, France EXXONMOBIL CHEMICAL LIMITED VICTREX PLC
New cars FIAT GROUP AUTOMOBILES UK LTD SCANIA (GREAT BRITAIN) LIMITED
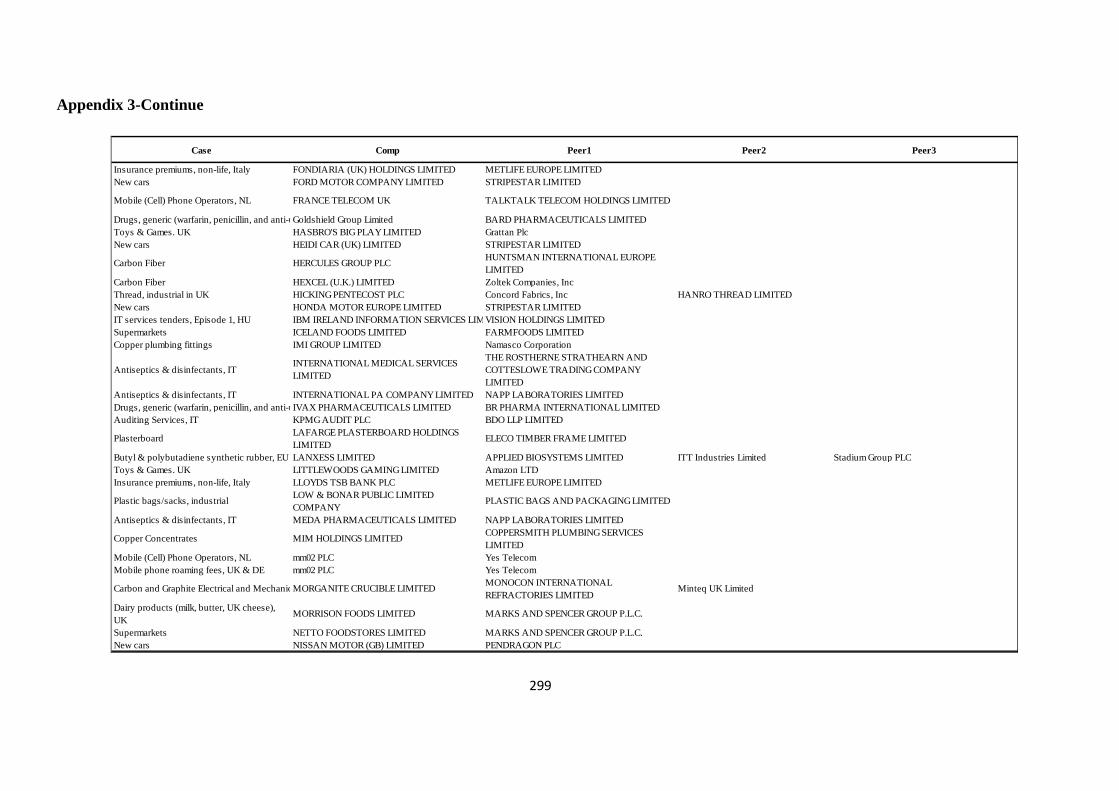
299
Appendix 3-Continue
Case Comp Peer1 Peer2 Peer3
Insurance premiums, non-life, Italy FONDIARIA (UK) HOLDINGS LIMITED METLIFE EUROPE LIMITED
New cars FORD MOTOR COMPANY LIMITED STRIPESTAR LIMITED
Mobile (Cell) Phone Operators, NL FRANCE TELECOM UK TALKTALK TELECOM HOLDINGS LIMITED
Drugs, generic (warfarin, penicillin, and anti-ulcer medicines), UK Goldshield Group Limited BARD PHARMACEUTICALS LIMITED
Toys & Games. UK HASBRO'S BIG PLAY LIMITED Grattan Plc
New cars HEIDI CAR (UK) LIMITED STRIPESTAR LIMITED
Carbon Fiber HERCULES GROUP PLCHUNTSMAN INTERNATIONAL EUROPE
LIMITED
Carbon Fiber HEXCEL (U.K.) LIMITED Zoltek Companies, Inc
Thread, industrial in UK HICKING PENTECOST PLC Concord Fabrics, Inc HANRO THREAD LIMITED
New cars HONDA MOTOR EUROPE LIMITED STRIPESTAR LIMITED
IT services tenders, Episode 1, HU IBM IRELAND INFORMATION SERVICES LIMITEDVISION HOLDINGS LIMITED
Supermarkets ICELAND FOODS LIMITED FARMFOODS LIMITED
Copper plumbing fittings IMI GROUP LIMITED Namasco Corporation
Antiseptics & disinfectants, IT INTERNATIONAL MEDICAL SERVICES
LIMITED
THE ROSTHERNE STRATHEARN AND
COTTESLOWE TRADING COMPANY
LIMITED
Antiseptics & disinfectants, IT INTERNATIONAL PA COMPANY LIMITED NAPP LABORATORIES LIMITED
Drugs, generic (warfarin, penicillin, and anti-ulcer medicines), UK IVAX PHARMACEUTICALS LIMITED BR PHARMA INTERNATIONAL LIMITED
Auditing Services, IT KPMG AUDIT PLC BDO LLP LIMITED
PlasterboardLAFARGE PLASTERBOARD HOLDINGS
LIMITEDELECO TIMBER FRAME LIMITED
Butyl & polybutadiene synthetic rubber, EU LANXESS LIMITED APPLIED BIOSYSTEMS LIMITED ITT Industries Limited Stadium Group PLC
Toys & Games. UK LITTLEWOODS GAMING LIMITED Amazon LTD
Insurance premiums, non-life, Italy LLOYDS TSB BANK PLC METLIFE EUROPE LIMITED
Plastic bags/sacks, industrial LOW & BONAR PUBLIC LIMITED
COMPANYPLASTIC BAGS AND PACKAGING LIMITED
Antiseptics & disinfectants, IT MEDA PHARMACEUTICALS LIMITED NAPP LABORATORIES LIMITED
Copper Concentrates MIM HOLDINGS LIMITEDCOPPERSMITH PLUMBING SERVICES
LIMITED
Mobile (Cell) Phone Operators, NL mm02 PLC Yes Telecom
Mobile phone roaming fees, UK & DE mm02 PLC Yes Telecom
Carbon and Graphite Electrical and Mechanical ProductsMORGANITE CRUCIBLE LIMITEDMONOCON INTERNATIONAL
REFRACTORIES LIMITEDMinteq UK Limited
Dairy products (milk, butter, UK cheese),
UK MORRISON FOODS LIMITED MARKS AND SPENCER GROUP P.L.C.
Supermarkets NETTO FOODSTORES LIMITED MARKS AND SPENCER GROUP P.L.C.
New cars NISSAN MOTOR (GB) LIMITED PENDRAGON PLC
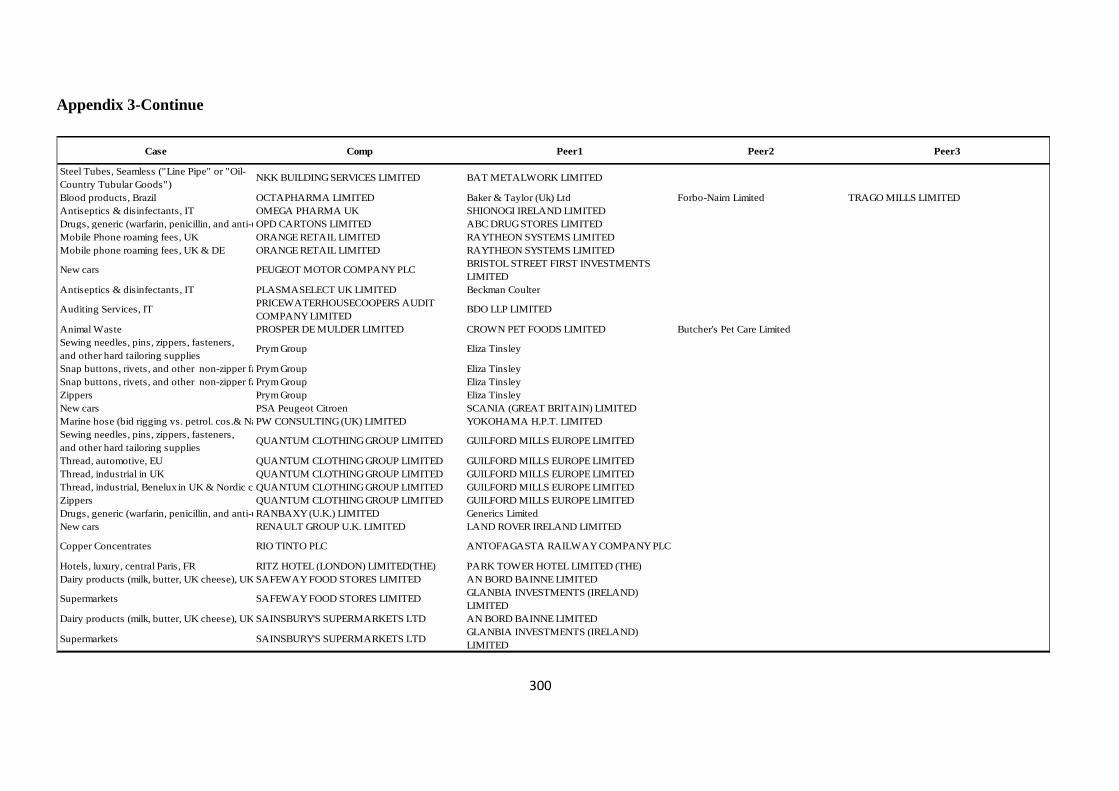
300
Appendix 3-Continue
Case Comp Peer1 Peer2 Peer3
Steel Tubes, Seamless ("Line Pipe" or "Oil-
Country Tubular Goods")NKK BUILDING SERVICES LIMITED BAT METALWORK LIMITED
Blood products, Brazil OCTAPHARMA LIMITED Baker & Taylor (Uk) Ltd Forbo-Nairn Limited TRAGO MILLS LIMITED
Antiseptics & disinfectants, IT OMEGA PHARMA UK SHIONOGI IRELAND LIMITED
Drugs, generic (warfarin, penicillin, and anti-ulcer medicines), UK OPD CARTONS LIMITED ABC DRUG STORES LIMITED
Mobile Phone roaming fees, UK ORANGE RETAIL LIMITED RAYTHEON SYSTEMS LIMITED
Mobile phone roaming fees, UK & DE ORANGE RETAIL LIMITED RAYTHEON SYSTEMS LIMITED
New cars PEUGEOT MOTOR COMPANY PLCBRISTOL STREET FIRST INVESTMENTS
LIMITED
Antiseptics & disinfectants, IT PLASMASELECT UK LIMITED Beckman Coulter
Auditing Services, ITPRICEWATERHOUSECOOPERS AUDIT
COMPANY LIMITEDBDO LLP LIMITED
Animal Waste PROSPER DE MULDER LIMITED CROWN PET FOODS LIMITED Butcher's Pet Care Limited
Sewing needles, pins, zippers, fasteners,
and other hard tailoring suppliesPrym Group Eliza Tinsley
Snap buttons, rivets, and other non-zipper fasteners 1Prym Group Eliza Tinsley
Snap buttons, rivets, and other non-zipper fasteners 2Prym Group Eliza Tinsley
Zippers Prym Group Eliza Tinsley
New cars PSA Peugeot Citroen SCANIA (GREAT BRITAIN) LIMITED
Marine hose (bid rigging vs. petrol. cos.& Navy)PW CONSULTING (UK) LIMITED YOKOHAMA H.P.T. LIMITED
Sewing needles, pins, zippers, fasteners,
and other hard tailoring suppliesQUANTUM CLOTHING GROUP LIMITED GUILFORD MILLS EUROPE LIMITED
Thread, automotive, EU QUANTUM CLOTHING GROUP LIMITED GUILFORD MILLS EUROPE LIMITED
Thread, industrial in UK QUANTUM CLOTHING GROUP LIMITED GUILFORD MILLS EUROPE LIMITED
Thread, industrial, Benelux in UK & Nordic countriesQUANTUM CLOTHING GROUP LIMITED GUILFORD MILLS EUROPE LIMITED
Zippers QUANTUM CLOTHING GROUP LIMITED GUILFORD MILLS EUROPE LIMITED
Drugs, generic (warfarin, penicillin, and anti-ulcer medicines), UK RANBAXY (U.K.) LIMITED Generics Limited
New cars RENAULT GROUP U.K. LIMITED LAND ROVER IRELAND LIMITED
Copper Concentrates RIO TINTO PLC ANTOFAGASTA RAILWAY COMPANY PLC
Hotels, luxury, central Paris, FR RITZ HOTEL (LONDON) LIMITED(THE) PARK TOWER HOTEL LIMITED (THE)
Dairy products (milk, butter, UK cheese), UK SAFEWAY FOOD STORES LIMITED AN BORD BAINNE LIMITED
Supermarkets SAFEWAY FOOD STORES LIMITEDGLANBIA INVESTMENTS (IRELAND)
LIMITED
Dairy products (milk, butter, UK cheese), UK SAINSBURY'S SUPERMARKETS LTD AN BORD BAINNE LIMITED
Supermarkets SAINSBURY'S SUPERMARKETS LTDGLANBIA INVESTMENTS (IRELAND)
LIMITED
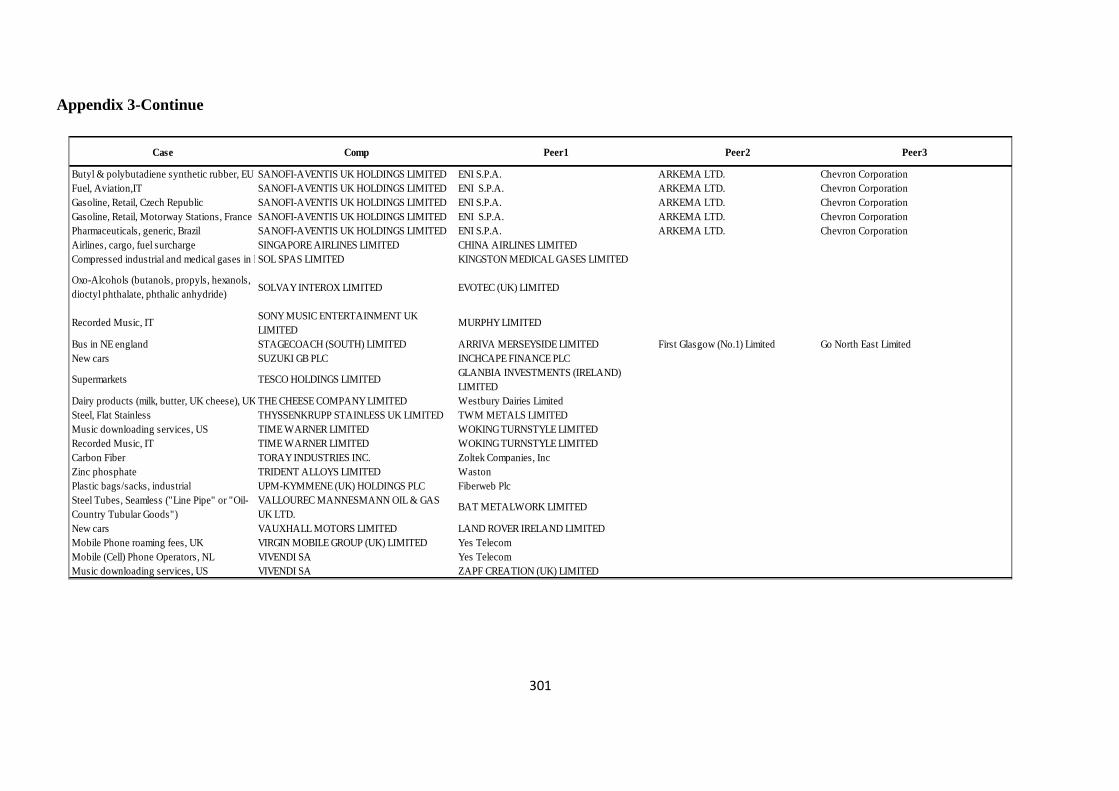
301
Appendix 3-Continue
Case Comp Peer1 Peer2 Peer3
Butyl & polybutadiene synthetic rubber, EU SANOFI-AVENTIS UK HOLDINGS LIMITED ENI S.P.A. ARKEMA LTD. Chevron Corporation
Fuel, Aviation,IT SANOFI-AVENTIS UK HOLDINGS LIMITED ENI S.P.A. ARKEMA LTD. Chevron Corporation
Gasoline, Retail, Czech Republic SANOFI-AVENTIS UK HOLDINGS LIMITED ENI S.P.A. ARKEMA LTD. Chevron Corporation
Gasoline, Retail, Motorway Stations, France SANOFI-AVENTIS UK HOLDINGS LIMITED ENI S.P.A. ARKEMA LTD. Chevron Corporation
Pharmaceuticals, generic, Brazil SANOFI-AVENTIS UK HOLDINGS LIMITED ENI S.P.A. ARKEMA LTD. Chevron Corporation
Airlines, cargo, fuel surcharge SINGAPORE AIRLINES LIMITED CHINA AIRLINES LIMITED
Compressed industrial and medical gases in NL SOL SPAS LIMITED KINGSTON MEDICAL GASES LIMITED
Oxo-Alcohols (butanols, propyls, hexanols,
dioctyl phthalate, phthalic anhydride)SOLVAY INTEROX LIMITED EVOTEC (UK) LIMITED
Recorded Music, ITSONY MUSIC ENTERTAINMENT UK
LIMITEDMURPHY LIMITED
Bus in NE england STAGECOACH (SOUTH) LIMITED ARRIVA MERSEYSIDE LIMITED First Glasgow (No.1) Limited Go North East Limited
New cars SUZUKI GB PLC INCHCAPE FINANCE PLC
Supermarkets TESCO HOLDINGS LIMITEDGLANBIA INVESTMENTS (IRELAND)
LIMITED
Dairy products (milk, butter, UK cheese), UK THE CHEESE COMPANY LIMITED Westbury Dairies Limited
Steel, Flat Stainless THYSSENKRUPP STAINLESS UK LIMITED TWM METALS LIMITED
Music downloading services, US TIME WARNER LIMITED WOKING TURNSTYLE LIMITED
Recorded Music, IT TIME WARNER LIMITED WOKING TURNSTYLE LIMITED
Carbon Fiber TORAY INDUSTRIES INC. Zoltek Companies, Inc
Zinc phosphate TRIDENT ALLOYS LIMITED Waston
Plastic bags/sacks, industrial UPM-KYMMENE (UK) HOLDINGS PLC Fiberweb Plc
Steel Tubes, Seamless ("Line Pipe" or "Oil-
Country Tubular Goods")
VALLOUREC MANNESMANN OIL & GAS
UK LTD.BAT METALWORK LIMITED
New cars VAUXHALL MOTORS LIMITED LAND ROVER IRELAND LIMITED
Mobile Phone roaming fees, UK VIRGIN MOBILE GROUP (UK) LIMITED Yes Telecom
Mobile (Cell) Phone Operators, NL VIVENDI SA Yes Telecom
Music downloading services, US VIVENDI SA ZAPF CREATION (UK) LIMITED
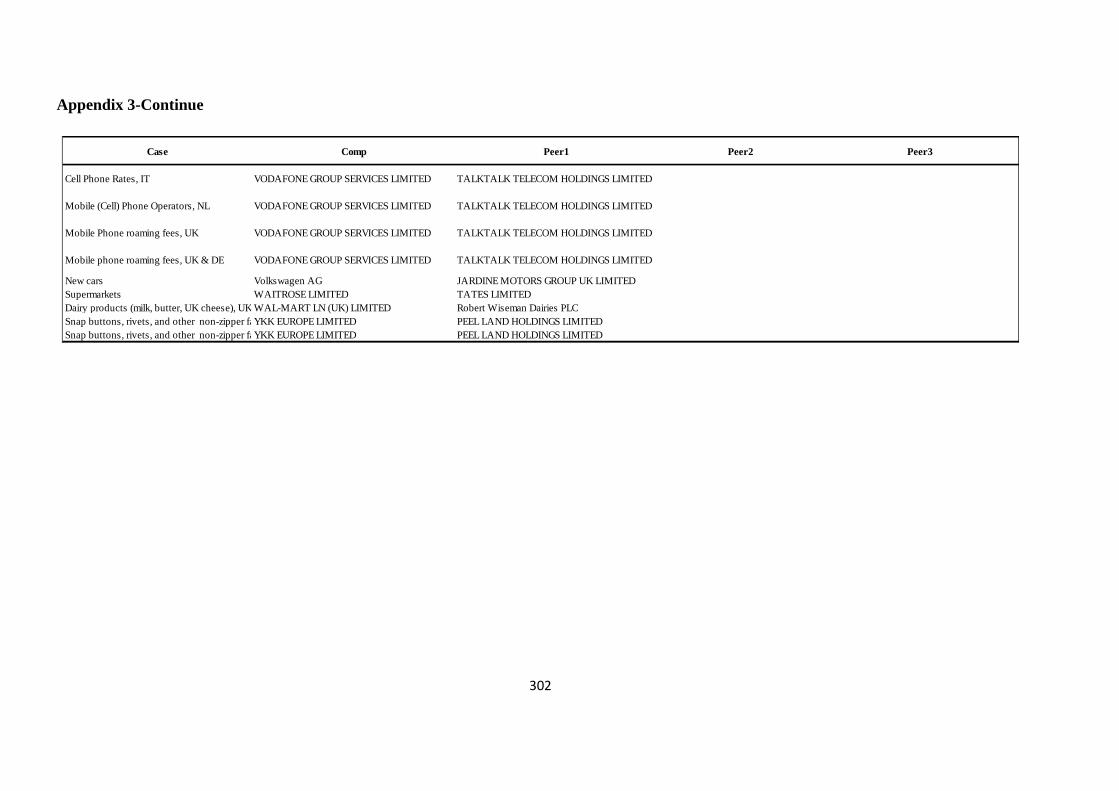
302
Appendix 3-Continue
Case Comp Peer1 Peer2 Peer3
Cell Phone Rates, IT VODAFONE GROUP SERVICES LIMITED TALKTALK TELECOM HOLDINGS LIMITED
Mobile (Cell) Phone Operators, NL VODAFONE GROUP SERVICES LIMITED TALKTALK TELECOM HOLDINGS LIMITED
Mobile Phone roaming fees, UK VODAFONE GROUP SERVICES LIMITED TALKTALK TELECOM HOLDINGS LIMITED
Mobile phone roaming fees, UK & DE VODAFONE GROUP SERVICES LIMITED TALKTALK TELECOM HOLDINGS LIMITED
New cars Volkswagen AG JARDINE MOTORS GROUP UK LIMITED
Supermarkets WAITROSE LIMITED TATES LIMITED
Dairy products (milk, butter, UK cheese), UK WAL-MART LN (UK) LIMITED Robert Wiseman Dairies PLC
Snap buttons, rivets, and other non-zipper fasteners 1YKK EUROPE LIMITED PEEL LAND HOLDINGS LIMITED
Snap buttons, rivets, and other non-zipper fasteners 2YKK EUROPE LIMITED PEEL LAND HOLDINGS LIMITED
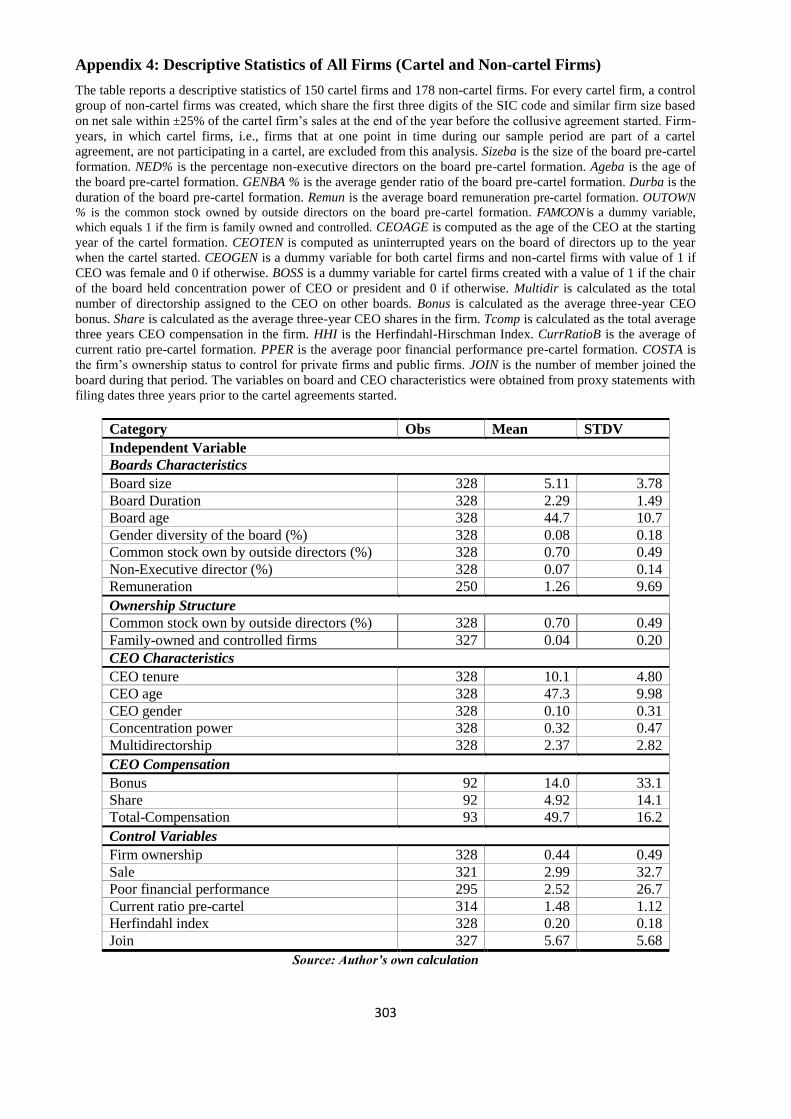
303
Appendix 4: Descriptive Statistics of All Firms (Cartel and Non-cartel Firms)
The table reports a descriptive statistics of 150 cartel firms and 178 non-cartel firms. For every cartel firm, a control
group of non-cartel firms was created, which share the first three digits of the SIC code and similar firm size based
on net sale within ±25% of the cartel firm’s sales at the end of the year before the collusive agreement started. Firm-
years, in which cartel firms, i.e., firms that at one point in time during our sample period are part of a cartel
agreement, are not participating in a cartel, are excluded from this analysis. Sizeba is the size of the board pre-cartel
formation. NED% is the percentage non-executive directors on the board pre-cartel formation. Ageba is the age of
the board pre-cartel formation. GENBA % is the average gender ratio of the board pre-cartel formation. Durba is the
duration of the board pre-cartel formation. Remun is the average board remuneration pre-cartel formation. OUTOWN
% is the common stock owned by outside directors on the board pre-cartel formation. FAMCON is a dummy variable,
which equals 1 if the firm is family owned and controlled. CEOAGE is computed as the age of the CEO at the starting
year of the cartel formation. CEOTEN is computed as uninterrupted years on the board of directors up to the year
when the cartel started. CEOGEN is a dummy variable for both cartel firms and non-cartel firms with value of 1 if
CEO was female and 0 if otherwise. BOSS is a dummy variable for cartel firms created with a value of 1 if the chair
of the board held concentration power of CEO or president and 0 if otherwise. Multidir is calculated as the total
number of directorship assigned to the CEO on other boards. Bonus is calculated as the average three-year CEO
bonus. Share is calculated as the average three-year CEO shares in the firm. Tcomp is calculated as the total average
three years CEO compensation in the firm. HHI is the Herfindahl-Hirschman Index. CurrRatioB is the average of
current ratio pre-cartel formation. PPER is the average poor financial performance pre-cartel formation. COSTA is
the firm’s ownership status to control for private firms and public firms. JOIN is the number of member joined the
board during that period. The variables on board and CEO characteristics were obtained from proxy statements with
filing dates three years prior to the cartel agreements started.
Category Obs Mean STDV
Independent Variable
Boards Characteristics
Board size 328 5.11 3.78
Board Duration 328 2.29 1.49
Board age 328 44.7 10.7
Gender diversity of the board (%) 328 0.08 0.18
Common stock own by outside directors (%) 328 0.70 0.49
Non-Executive director (%) 328 0.07 0.14
Remuneration 250 1.26 9.69
Ownership Structure
Common stock own by outside directors (%) 328 0.70 0.49
Family-owned and controlled firms 327 0.04 0.20
CEO Characteristics
CEO tenure 328 10.1 4.80
CEO age 328 47.3 9.98
CEO gender 328 0.10 0.31
Concentration power 328 0.32 0.47
Multidirectorship 328 2.37 2.82
CEO Compensation
Bonus 92 14.0 33.1
Share 92 4.92 14.1
Total-Compensation 93 49.7 16.2
Control Variables
Firm ownership 328 0.44 0.49
Sale 321 2.99 32.7
Poor financial performance 295 2.52 26.7
Current ratio pre-cartel 314 1.48 1.12
Herfindahl index 328 0.20 0.18
Join 327 5.67 5.68
Source: Author’s own calculation
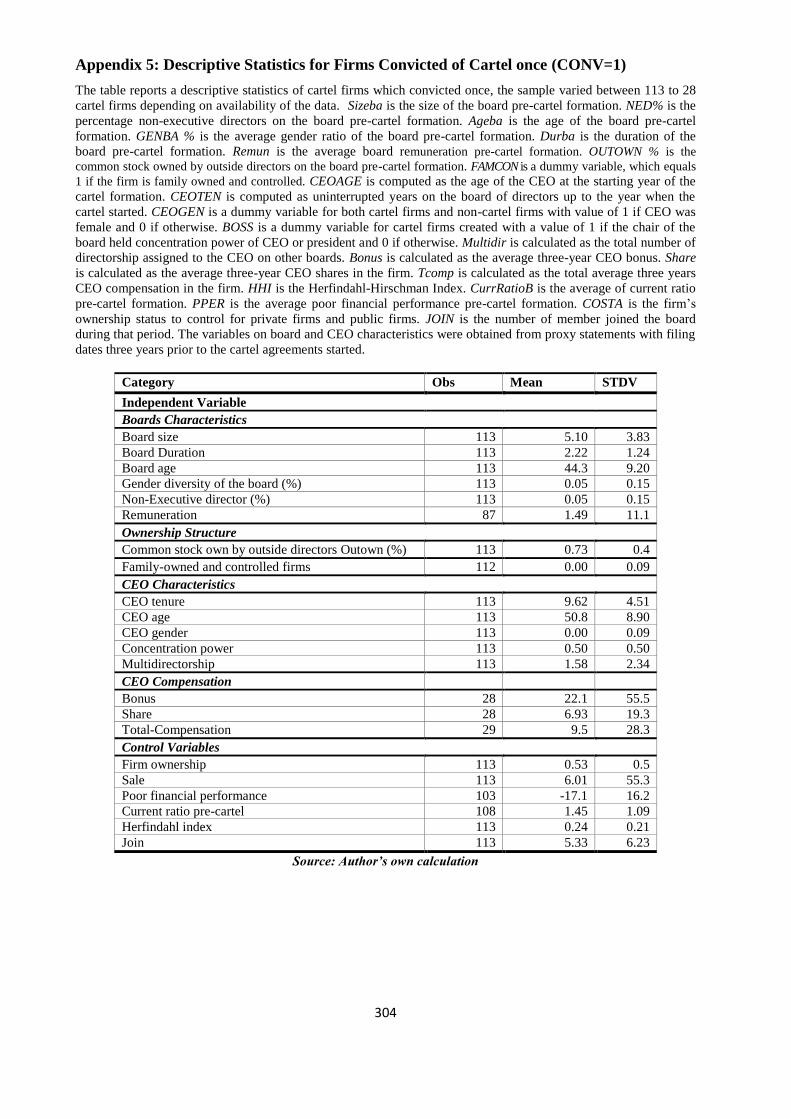
304
Appendix 5: Descriptive Statistics for Firms Convicted of Cartel once (CONV=1)
The table reports a descriptive statistics of cartel firms which convicted once, the sample varied between 113 to 28
cartel firms depending on availability of the data. Sizeba is the size of the board pre-cartel formation. NED% is the
percentage non-executive directors on the board pre-cartel formation. Ageba is the age of the board pre-cartel
formation. GENBA % is the average gender ratio of the board pre-cartel formation. Durba is the duration of the
board pre-cartel formation. Remun is the average board remuneration pre-cartel formation. OUTOWN % is the
common stock owned by outside directors on the board pre-cartel formation. FAMCON is a dummy variable, which equals
1 if the firm is family owned and controlled. CEOAGE is computed as the age of the CEO at the starting year of the
cartel formation. CEOTEN is computed as uninterrupted years on the board of directors up to the year when the
cartel started. CEOGEN is a dummy variable for both cartel firms and non-cartel firms with value of 1 if CEO was
female and 0 if otherwise. BOSS is a dummy variable for cartel firms created with a value of 1 if the chair of the
board held concentration power of CEO or president and 0 if otherwise. Multidir is calculated as the total number of
directorship assigned to the CEO on other boards. Bonus is calculated as the average three-year CEO bonus. Share
is calculated as the average three-year CEO shares in the firm. Tcomp is calculated as the total average three years
CEO compensation in the firm. HHI is the Herfindahl-Hirschman Index. CurrRatioB is the average of current ratio
pre-cartel formation. PPER is the average poor financial performance pre-cartel formation. COSTA is the firm’s
ownership status to control for private firms and public firms. JOIN is the number of member joined the board
during that period. The variables on board and CEO characteristics were obtained from proxy statements with filing
dates three years prior to the cartel agreements started.
Category Obs Mean STDV
Independent Variable
Boards Characteristics
Board size 113 5.10 3.83
Board Duration 113 2.22 1.24
Board age 113 44.3 9.20
Gender diversity of the board (%) 113 0.05 0.15
Non-Executive director (%) 113 0.05 0.15
Remuneration 87 1.49 11.1
Ownership Structure
Common stock own by outside directors Outown (%) 113 0.73 0.4
Family-owned and controlled firms 112 0.00 0.09
CEO Characteristics
CEO tenure 113 9.62 4.51
CEO age 113 50.8 8.90
CEO gender 113 0.00 0.09
Concentration power 113 0.50 0.50
Multidirectorship 113 1.58 2.34
CEO Compensation
Bonus 28 22.1 55.5
Share 28 6.93 19.3
Total-Compensation 29 9.5 28.3
Control Variables
Firm ownership 113 0.53 0.5
Sale 113 6.01 55.3
Poor financial performance 103 -17.1 16.2
Current ratio pre-cartel 108 1.45 1.09
Herfindahl index 113 0.24 0.21
Join 113 5.33 6.23
Source: Author’s own calculation
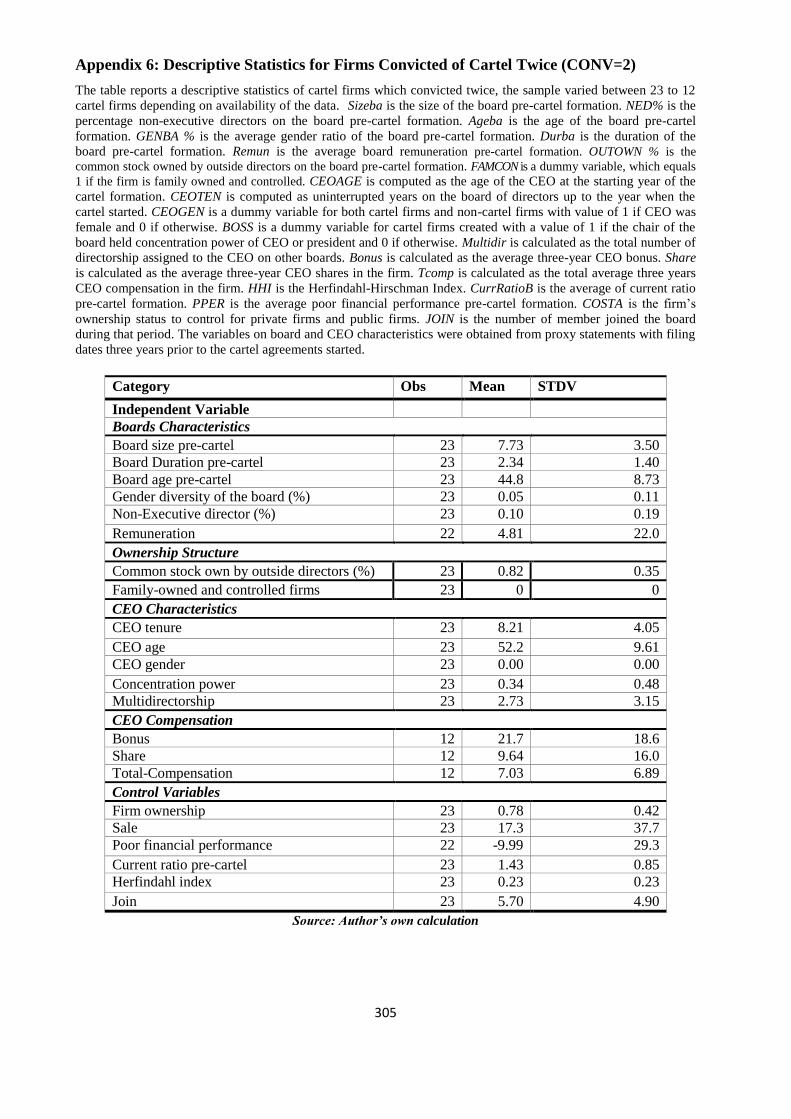
305
Appendix 6: Descriptive Statistics for Firms Convicted of Cartel Twice (CONV=2)
The table reports a descriptive statistics of cartel firms which convicted twice, the sample varied between 23 to 12
cartel firms depending on availability of the data. Sizeba is the size of the board pre-cartel formation. NED% is the
percentage non-executive directors on the board pre-cartel formation. Ageba is the age of the board pre-cartel
formation. GENBA % is the average gender ratio of the board pre-cartel formation. Durba is the duration of the
board pre-cartel formation. Remun is the average board remuneration pre-cartel formation. OUTOWN % is the
common stock owned by outside directors on the board pre-cartel formation. FAMCON is a dummy variable, which equals
1 if the firm is family owned and controlled. CEOAGE is computed as the age of the CEO at the starting year of the
cartel formation. CEOTEN is computed as uninterrupted years on the board of directors up to the year when the
cartel started. CEOGEN is a dummy variable for both cartel firms and non-cartel firms with value of 1 if CEO was
female and 0 if otherwise. BOSS is a dummy variable for cartel firms created with a value of 1 if the chair of the
board held concentration power of CEO or president and 0 if otherwise. Multidir is calculated as the total number of
directorship assigned to the CEO on other boards. Bonus is calculated as the average three-year CEO bonus. Share
is calculated as the average three-year CEO shares in the firm. Tcomp is calculated as the total average three years
CEO compensation in the firm. HHI is the Herfindahl-Hirschman Index. CurrRatioB is the average of current ratio
pre-cartel formation. PPER is the average poor financial performance pre-cartel formation. COSTA is the firm’s
ownership status to control for private firms and public firms. JOIN is the number of member joined the board
during that period. The variables on board and CEO characteristics were obtained from proxy statements with filing
dates three years prior to the cartel agreements started.
Category Obs Mean STDV
Independent Variable
Boards Characteristics
Board size pre-cartel 23 7.73 3.50
Board Duration pre-cartel 23 2.34 1.40
Board age pre-cartel 23 44.8 8.73
Gender diversity of the board (%) 23 0.05 0.11
Non-Executive director (%) 23 0.10 0.19
Remuneration 22 4.81 22.0
Ownership Structure
Common stock own by outside directors (%) 23 0.82 0.35
Family-owned and controlled firms 23 0 0
CEO Characteristics
CEO tenure 23 8.21 4.05
CEO age 23 52.2 9.61
CEO gender 23 0.00 0.00
Concentration power 23 0.34 0.48
Multidirectorship 23 2.73 3.15
CEO Compensation
Bonus 12 21.7 18.6
Share 12 9.64 16.0
Total-Compensation 12 7.03 6.89
Control Variables
Firm ownership 23 0.78 0.42
Sale 23 17.3 37.7
Poor financial performance 22 -9.99 29.3
Current ratio pre-cartel 23 1.43 0.85
Herfindahl index 23 0.23 0.23
Join 23 5.70 4.90
Source: Author’s own calculation
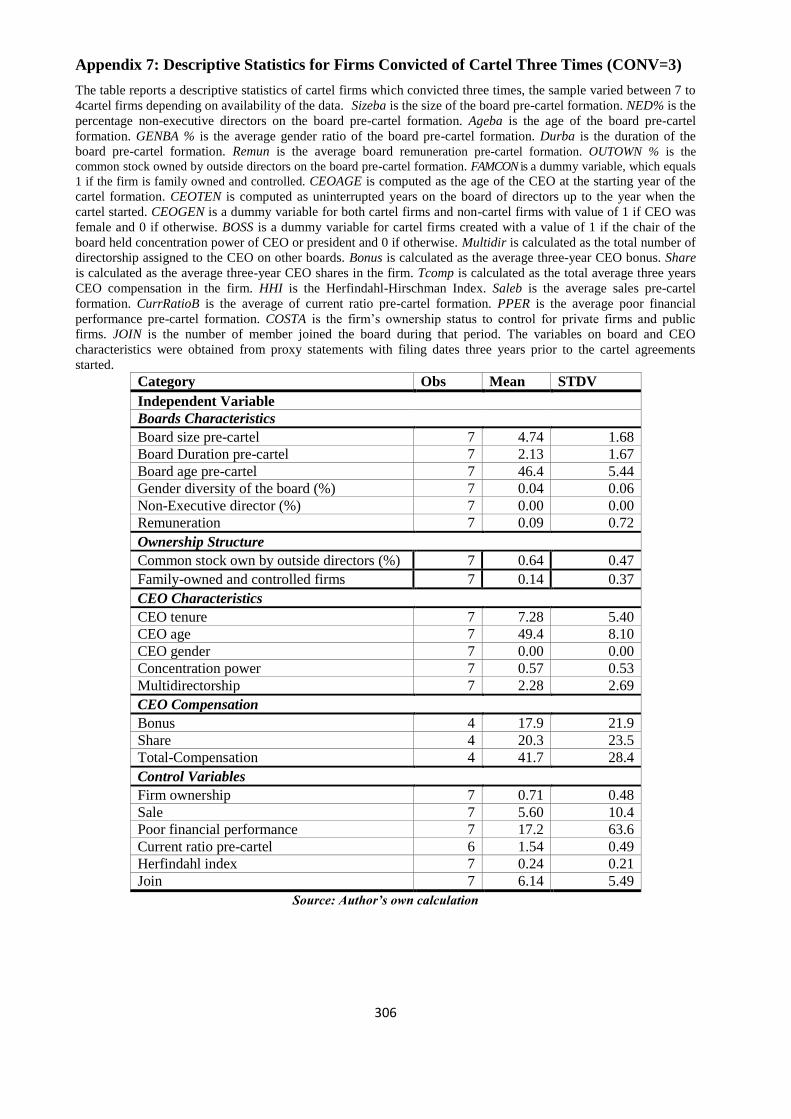
306
Appendix 7: Descriptive Statistics for Firms Convicted of Cartel Three Times (CONV=3)
The table reports a descriptive statistics of cartel firms which convicted three times, the sample varied between 7 to
4cartel firms depending on availability of the data. Sizeba is the size of the board pre-cartel formation. NED% is the
percentage non-executive directors on the board pre-cartel formation. Ageba is the age of the board pre-cartel
formation. GENBA % is the average gender ratio of the board pre-cartel formation. Durba is the duration of the
board pre-cartel formation. Remun is the average board remuneration pre-cartel formation. OUTOWN % is the
common stock owned by outside directors on the board pre-cartel formation. FAMCON is a dummy variable, which equals
1 if the firm is family owned and controlled. CEOAGE is computed as the age of the CEO at the starting year of the
cartel formation. CEOTEN is computed as uninterrupted years on the board of directors up to the year when the
cartel started. CEOGEN is a dummy variable for both cartel firms and non-cartel firms with value of 1 if CEO was
female and 0 if otherwise. BOSS is a dummy variable for cartel firms created with a value of 1 if the chair of the
board held concentration power of CEO or president and 0 if otherwise. Multidir is calculated as the total number of
directorship assigned to the CEO on other boards. Bonus is calculated as the average three-year CEO bonus. Share
is calculated as the average three-year CEO shares in the firm. Tcomp is calculated as the total average three years
CEO compensation in the firm. HHI is the Herfindahl-Hirschman Index. Saleb is the average sales pre-cartel
formation. CurrRatioB is the average of current ratio pre-cartel formation. PPER is the average poor financial
performance pre-cartel formation. COSTA is the firm’s ownership status to control for private firms and public
firms. JOIN is the number of member joined the board during that period. The variables on board and CEO
characteristics were obtained from proxy statements with filing dates three years prior to the cartel agreements
started. Category Obs Mean STDV
Independent Variable
Boards Characteristics
Board size pre-cartel 7 4.74 1.68
Board Duration pre-cartel 7 2.13 1.67
Board age pre-cartel 7 46.4 5.44
Gender diversity of the board (%) 7 0.04 0.06
Non-Executive director (%) 7 0.00 0.00
Remuneration 7 0.09 0.72
Ownership Structure
Common stock own by outside directors (%) 7 0.64 0.47
Family-owned and controlled firms 7 0.14 0.37
CEO Characteristics
CEO tenure 7 7.28 5.40
CEO age 7 49.4 8.10
CEO gender 7 0.00 0.00
Concentration power 7 0.57 0.53
Multidirectorship 7 2.28 2.69
CEO Compensation
Bonus 4 17.9 21.9
Share 4 20.3 23.5
Total-Compensation 4 41.7 28.4
Control Variables
Firm ownership 7 0.71 0.48
Sale 7 5.60 10.4
Poor financial performance 7 17.2 63.6
Current ratio pre-cartel 6 1.54 0.49
Herfindahl index 7 0.24 0.21
Join 7 6.14 5.49
Source: Author’s own calculation
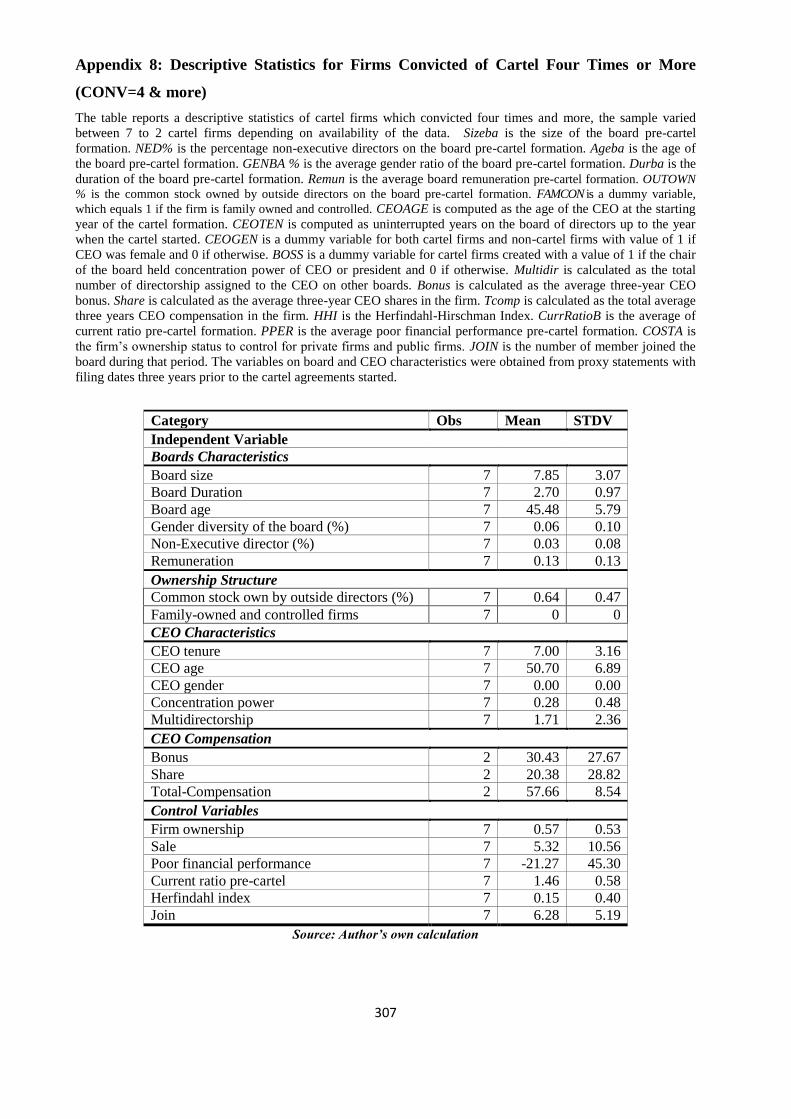
307
Appendix 8: Descriptive Statistics for Firms Convicted of Cartel Four Times or More
(CONV=4 & more)
The table reports a descriptive statistics of cartel firms which convicted four times and more, the sample varied
between 7 to 2 cartel firms depending on availability of the data. Sizeba is the size of the board pre-cartel
formation. NED% is the percentage non-executive directors on the board pre-cartel formation. Ageba is the age of
the board pre-cartel formation. GENBA % is the average gender ratio of the board pre-cartel formation. Durba is the
duration of the board pre-cartel formation. Remun is the average board remuneration pre-cartel formation. OUTOWN
% is the common stock owned by outside directors on the board pre-cartel formation. FAMCON is a dummy variable,
which equals 1 if the firm is family owned and controlled. CEOAGE is computed as the age of the CEO at the starting
year of the cartel formation. CEOTEN is computed as uninterrupted years on the board of directors up to the year
when the cartel started. CEOGEN is a dummy variable for both cartel firms and non-cartel firms with value of 1 if
CEO was female and 0 if otherwise. BOSS is a dummy variable for cartel firms created with a value of 1 if the chair
of the board held concentration power of CEO or president and 0 if otherwise. Multidir is calculated as the total
number of directorship assigned to the CEO on other boards. Bonus is calculated as the average three-year CEO
bonus. Share is calculated as the average three-year CEO shares in the firm. Tcomp is calculated as the total average
three years CEO compensation in the firm. HHI is the Herfindahl-Hirschman Index. CurrRatioB is the average of
current ratio pre-cartel formation. PPER is the average poor financial performance pre-cartel formation. COSTA is
the firm’s ownership status to control for private firms and public firms. JOIN is the number of member joined the
board during that period. The variables on board and CEO characteristics were obtained from proxy statements with
filing dates three years prior to the cartel agreements started.
Category Obs Mean STDV
Independent Variable
Boards Characteristics
Board size 7 7.85 3.07
Board Duration 7 2.70 0.97
Board age 7 45.48 5.79
Gender diversity of the board (%) 7 0.06 0.10
Non-Executive director (%) 7 0.03 0.08
Remuneration 7 0.13 0.13
Ownership Structure
Common stock own by outside directors (%) 7 0.64 0.47
Family-owned and controlled firms 7 0 0
CEO Characteristics
CEO tenure 7 7.00 3.16
CEO age 7 50.70 6.89
CEO gender 7 0.00 0.00
Concentration power 7 0.28 0.48
Multidirectorship 7 1.71 2.36
CEO Compensation
Bonus 2 30.43 27.67
Share 2 20.38 28.82
Total-Compensation 2 57.66 8.54
Control Variables
Firm ownership 7 0.57 0.53
Sale 7 5.32 10.56
Poor financial performance 7 -21.27 45.30
Current ratio pre-cartel 7 1.46 0.58
Herfindahl index 7 0.15 0.40
Join 7 6.28 5.19
Source: Author’s own calculation
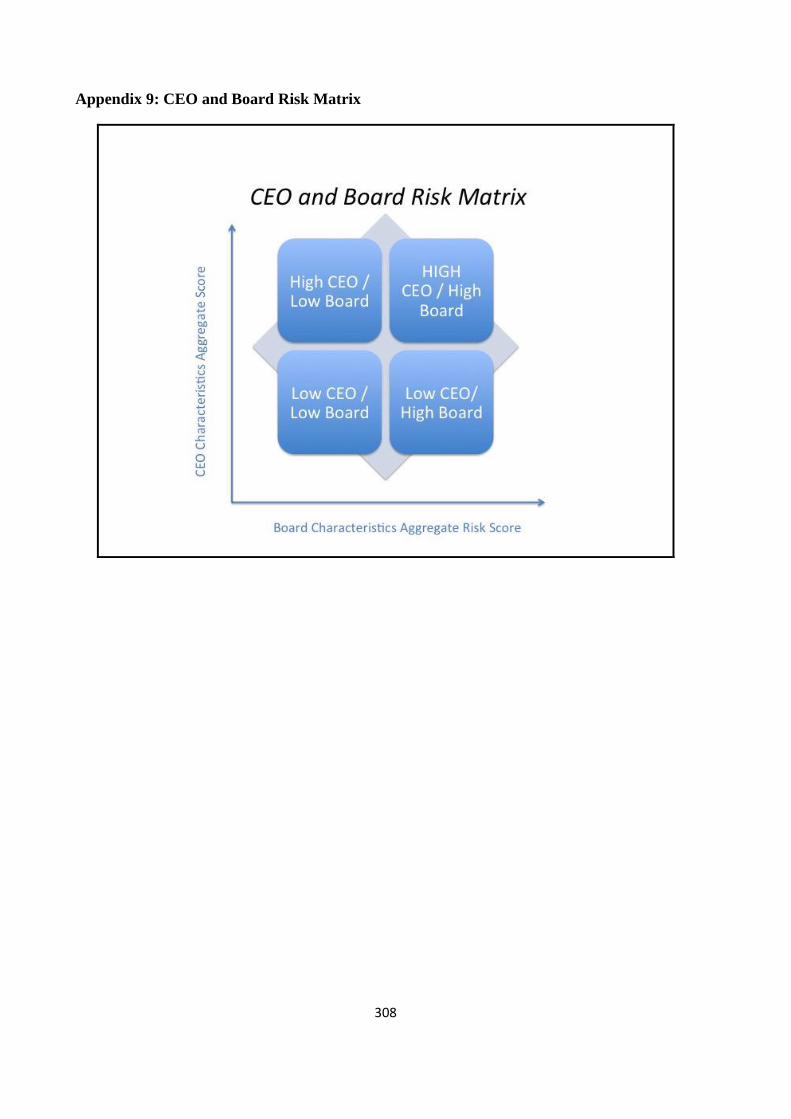
308
Appendix 9: CEO and Board Risk Matrix