corporate presentation -...
TRANSCRIPT

Investor RelationsTelefônica Brasil S.A.October, 2018
Corporate Presentation

Fixed
Mobile
EBITDA & OpCF
Transforming fixed revenue mix driven by expressive fiber acceleration
Solid performance in postpaid and macro improvement to accelerate mobile trends
Digitalization and smart capex allocation to continue to improve EBITDA and OpCF margins
Strong cash flow growth boosted by cash tax gains leading to unprecedented dividend yield
22
2018 MAIN MESSAGES TO THE MARKET
Cash Flow & Shareholder
Remuneration
3Q17 3Q18 3Q17 3Q18
33
-16.4¹%
-9.1%
28.5%
0.8%
-14.8%1,865 1,660 1,589
487 475 491
720 819 926
445 421 405
759 633 634
4,2764,008 4,045
3Q17 2Q18 3Q18
YoY
Voice and Others5Pay TV4UBBxDSL³Data and IT²
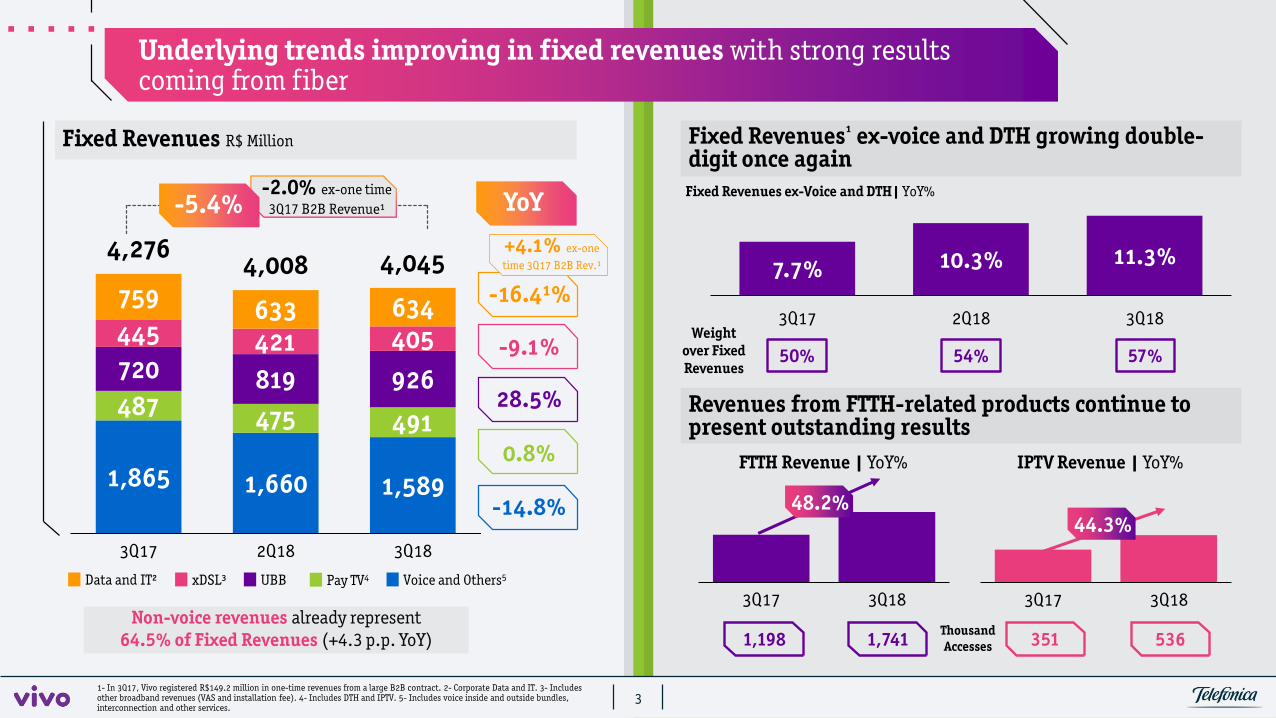
Fixed Revenues¹ ex-voice and DTH growing double-digit once again
Underlying trends improving in fixed revenues with strong results coming from fiber
FTTH Revenue | YoY% IPTV Revenue | YoY%
Fixed Revenues R$ Million
Revenues from FTTH-related products continue to present outstanding results
Non-voice revenues already represent 64.5% of Fixed Revenues (+4.3 p.p. YoY)
Fixed Revenues ex-Voice and DTH| YoY%
Weight over Fixed Revenues
-2.0% ex-one time 3Q17 B2B Revenue¹-5.4%
1- In 3Q17, Vivo registered R$149.2 million in one-time revenues from a large B2B contract. 2- Corporate Data and IT. 3- Includes other broadband revenues (VAS and installation fee). 4- Includes DTH and IPTV. 5- Includes voice inside and outside bundles, interconnection and other services.
+4.1% ex-one time 3Q17 B2B Rev.¹
48.2%44.3%
7.7% 10.3% 11.3%
3Q17 2Q18 3Q18
57%50% 54%
351 5361,198 1,741 Thousand Accesses
44
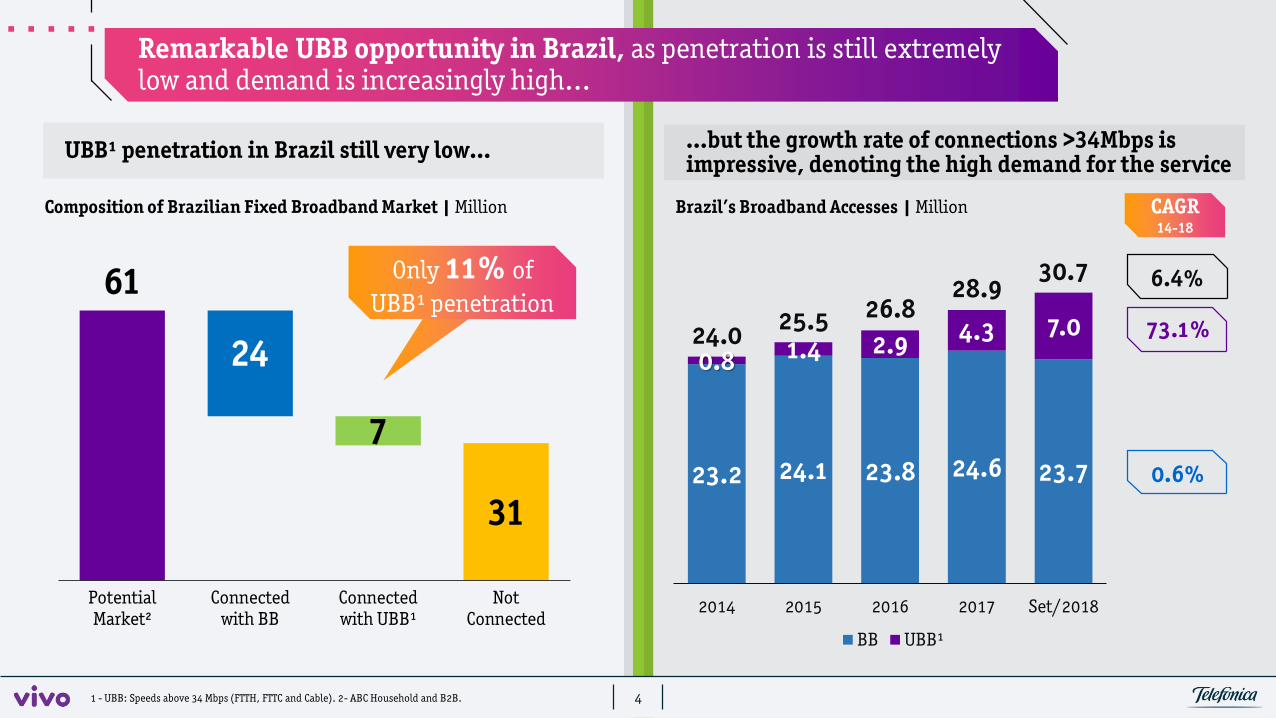
Remarkable UBB opportunity in Brazil, as penetration is still extremely low and demand is increasingly high…
31
61
24
7
PotentialMarket²
Connectedwith BB
Connectedwith UBB¹
NotConnected
Only 11% of UBB¹ penetration
…but the growth rate of connections >34Mbps is impressive, denoting the high demand for the service UBB¹ penetration in Brazil still very low…
Composition of Brazilian Fixed Broadband Market | Million
1 - UBB: Speeds above 34 Mbps (FTTH, FTTC and Cable). 2- ABC Household and B2B.
23.2 24.1 23.8 24.6 23.7
0.8 1.4 2.9 4.3 7.024.0 25.5 26.828.9
30.7
2014 2015 2016 2017 Set/2018
BB UBB¹
Brazil’s Broadband Accesses | Million
73.1%
0.6%
6.4%
CAGR 14-18

55
…allowing us to capture an excellent set of results in FTTH cities launched in 2017 and 2018
...and the cities launched in 2018 are performing even better as we optimize deployment & operations
Outstanding results in the 16 FTTH cities launched in 2017, confirming unique UBB opportunity in Brazil…
BB ARPU (R$)
Average Best Case
BB Share
UBB Share
69 76
36% 81%
73% 100%
_Faster deployment of FTTH, which will allow us to build +1MM HPs until the end of the year, with enhanced performance of salesforce, leading to strong results in cities launched this year
_As a result, take-up over HPs beating the internal expectations in almost every city
_Average BB ARPU of cities launched in 2018 reaching R$72, 5% higher than average ARPU of cities launched in 2017 and 21% higher than average BB ARPU
7 8 9≈15
2017 Sep/18 2018YE 2020E
16 >25
Sep/18 2018 2019E
FTTH HPs | Million New FTTH CitiesKPIs from cities launched in 2017
Take-up over HPs in some cities launched in 2017 already reaching long-term target (>30%), with an
average of 42% of penetration over installed capacity
2P ARPU above R$100 and 3P ARPU above R$149
66
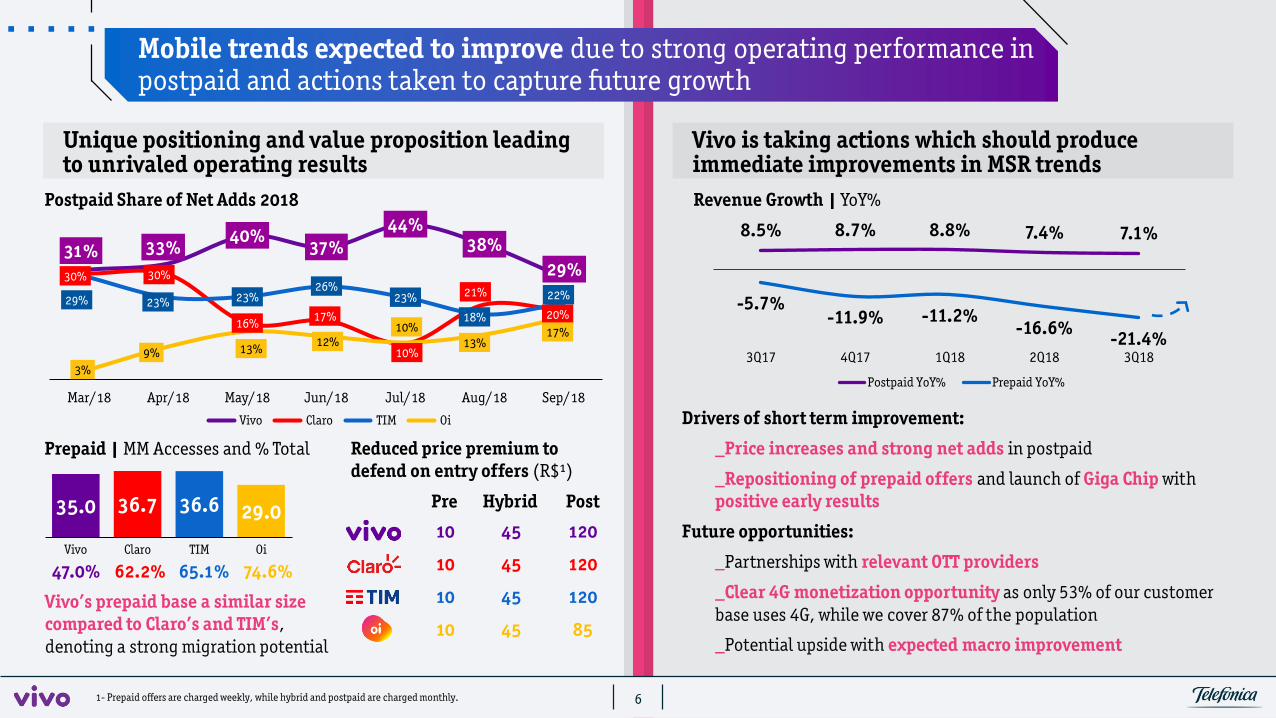
Mobile trends expected to improve due to strong operating performance in postpaid and actions taken to capture future growth
Postpaid Share of Net Adds 2018
Unique positioning and value proposition leading to unrivaled operating results
Prepaid | MM Accesses and % Total
35.0 36.7 36.6 29.0
Vivo Claro TIM Oi
47.0% 62.2% 65.1% 74.6%
Pre Hybrid Post
120
120
120
85
45
45
45
45
10
10
10
10
Reduced price premium to defend on entry offers (R$¹)
Vivo’s prepaid base a similar size compared to Claro’s and TIM’s, denoting a strong migration potential
1- Prepaid offers are charged weekly, while hybrid and postpaid are charged monthly.
Drivers of short term improvement:
_Price increases and strong net adds in postpaid
_Repositioning of prepaid offers and launch of Giga Chip with positive early results
Future opportunities:
_Partnerships with relevant OTT providers
_Clear 4G monetization opportunity as only 53% of our customer base uses 4G, while we cover 87% of the population
_Potential upside with expected macro improvement
8.5% 8.7% 8.8% 7.4% 7.1%
-5.7%-11.9% -11.2%
-16.6% -21.4%3Q17 4Q17 1Q18 2Q18 3Q18
Postpaid YoY% Prepaid YoY%
31% 33%40%
37%44%
38%29%30% 30%
16% 17%
10%
21%
20%29% 23% 23%
26%23%
18%
22%
3%9% 13% 12%
10%13%
17%
Mar/18 Apr/18 May/18 Jun/18 Jul/18 Aug/18 Sep/18
Vivo Claro TIM Oi
Vivo is taking actions which should produce immediate improvements in MSR trendsRevenue Growth | YoY%

77
Digitalization and smart capex allocation to continue to improve EBITDA and OpCF margins
Strong EBITDA margin evolution on the back of cost reduction through digitalization and simplification
33.9% 35.1% 35.1% 35.8% 36.3%
2017 9M18 2018C 2019C 2020C
EBITDA Margin | Real and Consensus
We are comfortable with sell-side consensus for EBITDA Margin, confident we can over-deliver on projections
Digitalization and simplification efforts already impacting positively our cost dynamics, resulting in the decrease of important lines
BILLING & POSTING CALL CENTER
INSTALLATION & MAINTENANCE
PHYSICAL TOP-UPS
-31% YoY-8% YoY
-19% YoY -13% YoY
1/3
Proportion of annual Opex with potential to be impacted by digitalization initiatives
Investments focused on cutting-edge technologies, improving returns and customer experience
8.0 8.0 8.0
0.5 1.0 1.0<8.5 9.0 9.0
2018 2019 2020
Base Capex Fiber Acceleration Project
_Smart Capex allocation should already lead to savings in 2018
_Reducing investments in legacy technologies such as 2G, 3G, Copper and DTH
_R$7 billion in 3 years to be invested in FTTH expansion
_Robust investment in 4G and 4G+ focused especially in enhancing quality for us to continue to provide the best mobile experience
_R$3 billion in 3 years invested to transform our IT platform
3Q18
Capex| R$ Billion

88
In 3Q18, we registered a new tax asset of R$ 2.4 bn related to contributions of PIS/COFINS over ICMS made by Vivo between 2004 and 2013
Impact from decisions for TELESP and Vivo on income statement and balance sheet
Record Net Income to be registered in 2018 to produce unique level of remuneration
EBITDA
2Q18: TELESP (2003-2014)
3Q18: Vivo (2004-2013)
Financial Result
Tax Asset (Balance Sheet)
2.0
1.8
3.8
1.4
1.0
2.4
R$ Billion _Impact on Income Statement in 2Q and 3Q18 generating a relevant additional profit
Tax assets to compensate payment of federal taxes during the next years generating an incremental source of cash while allowing for stronger shareholder remuneration
Note: numbers shown above do not consider other one-offs registered in 2Q18 and 3Q18 which impacted results of these quarters. Considering these one-offs, the net effect of all one-offs on net income would be of R$3.6 billion.
Total
_Potential for unprecedented shareholder remuneration from distributions based on 2018 net income
_Other processes still waiting for final judgement could generate extra gains in the future
3.4
2.8
6.2

99
Strong cash flow growth boosted by cash tax gains leading to record net income and unprecedented dividend yield
Free Cash Flow generation growing on a yearly basis even with higher level of investments in 2018…
3,2364,557 4,847
9M16 9M17 9M18
Free Cash Flow from Business Activities | R$ Million
_FCF to be boosted in around R$2 billion per year going forward due to tax assets registered in 2Q and 3Q18
_Cash tax gains represent more than 8% of current market cap
_Extra proceeds more than compensate additional Capex envelope defined for fiber acceleration project (2018-20)
9M18 Net Income 61% higher than FY2017 figure, with potential to beat 2018 consensus
4,6097,442 7,805
2017 9M18 2018C
Net Income | R$ Million, Real and Consensus
_Net Income in 2018 to beat current sell-side consensus estimations
_R$3.2 billion of Interest on Capital already declared YTD
Unprecedented dividend yield coming from distributions based on 2018 net income,
considerably above Brazil’s risk free rate
…and future evolution will be positively impacted by tax gains from 2Q and 3Q18

Backups

-3.50% -3.50%
0.99% 1.36%2.50%
2015 2016 2017 2018E 2019
10.70%6.30%
2.95% 4.40% 4.20%
2015 2016 2017 2018E 2019
14.25% 13.75%
7.00% 6.50% 8.00%
2015 2016 2017 2018E 2019
8.50%11.50% 12.80% 12.50% 12.30%
2015 2016 2017 2018E 2019
% YoY
% annual rate %
Expectations for an economic recovery represent a potential upside…
GDP Growth1
% YoY
Inflation¹
Interest Rate¹ Unemployment2
11111) Source: Focus (November 1st, 2018 – GDP numbers were revised by IBGE);
2) Source: Telefônica Brasil estimates.
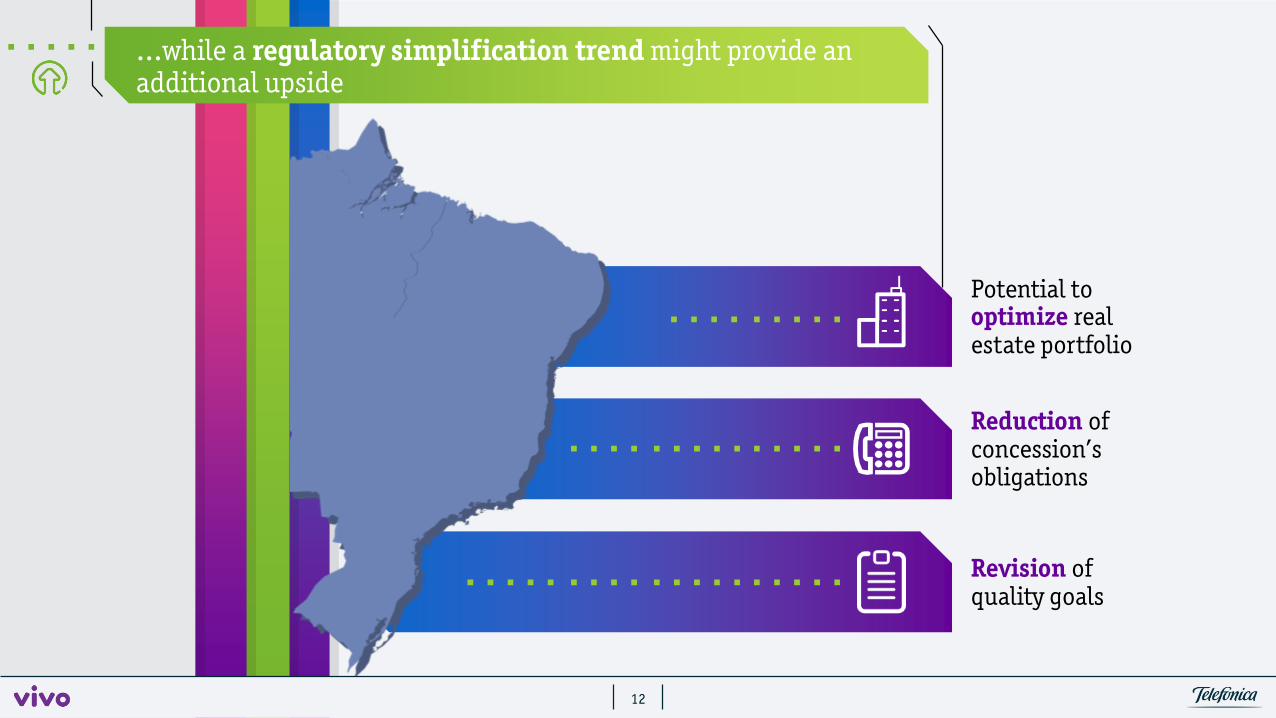
…while a regulatory simplification trend might provide an additional upside
Reduction ofconcession’s obligations
Revision of quality goals
Potential to optimize real estate portfolio
1212
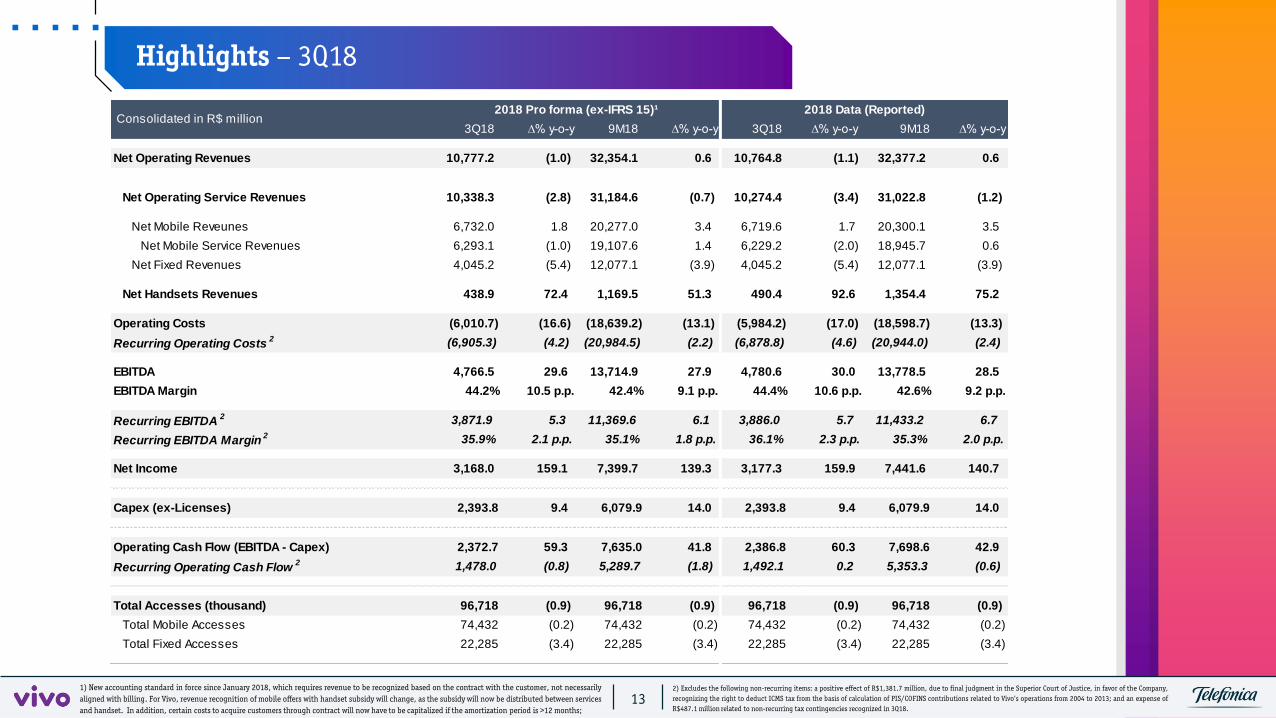
Highlights – 3Q18
131) New accounting standard in force since January 2018, which requires revenue to be recognized based on the contract with the customer, not necessarilyaligned with billing. For Vivo, revenue recognition of mobile offers with handset subsidy will change, as the subsidy will now be distributed between servicesand handset. In addition, certain costs to acquire customers through contract will now have to be capitalized if the amortization period is >12 months;
2) Excludes the following non-recurring items: a positive effect of R$1,381.7 million, due to final judgment in the Superior Court of Justice, in favor of the Company,recognizing the right to deduct ICMS tax from the basis of calculation of PIS/COFINS contributions related to Vivo’s operations from 2004 to 2013; and an expense ofR$487.1 million related to non-recurring tax contingencies recognized in 3Q18.
3Q18 ∆% y-o-y 9M18 ∆% y-o-y 3Q18 ∆% y-o-y 9M18 ∆% y-o-y
Net Operating Revenues 10,777.2 (1.0) 32,354.1 0.6 10,764.8 (1.1) 32,377.2 0.6
Net Operating Service Revenues 10,338.3 (2.8) 31,184.6 (0.7) 10,274.4 (3.4) 31,022.8 (1.2)
Net Mobile Reveunes 6,732.0 1.8 20,277.0 3.4 6,719.6 1.7 20,300.1 3.5
Net Mobile Service Revenues 6,293.1 (1.0) 19,107.6 1.4 6,229.2 (2.0) 18,945.7 0.6
Net Fixed Revenues 4,045.2 (5.4) 12,077.1 (3.9) 4,045.2 (5.4) 12,077.1 (3.9)
Net Handsets Revenues 438.9 72.4 1,169.5 51.3 490.4 92.6 1,354.4 75.2
Operating Costs (6,010.7) (16.6) (18,639.2) (13.1) (5,984.2) (17.0) (18,598.7) (13.3)
Recurring Operating Costs2 (6,905.3) (4.2) (20,984.5) (2.2) (6,878.8) (4.6) (20,944.0) (2.4)
EBITDA 4,766.5 29.6 13,714.9 27.9 4,780.6 30.0 13,778.5 28.5
EBITDA Margin 44.2% 10.5 p.p. 42.4% 9.1 p.p. 44.4% 10.6 p.p. 42.6% 9.2 p.p.
Recurring EBITDA2 3,871.9 5.3 11,369.6 6.1 3,886.0 5.7 11,433.2 6.7
Recurring EBITDA Margin2 35.9% 2.1 p.p. 35.1% 1.8 p.p. 36.1% 2.3 p.p. 35.3% 2.0 p.p.
Net Income 3,168.0 159.1 7,399.7 139.3 3,177.3 159.9 7,441.6 140.7
Capex (ex-Licenses) 2,393.8 9.4 6,079.9 14.0 2,393.8 9.4 6,079.9 14.0
Operating Cash Flow (EBITDA - Capex) 2,372.7 59.3 7,635.0 41.8 2,386.8 60.3 7,698.6 42.9
Recurring Operating Cash Flow2 1,478.0 (0.8) 5,289.7 (1.8) 1,492.1 0.2 5,353.3 (0.6)
Total Accesses (thousand) 96,718 (0.9) 96,718 (0.9) 96,718 (0.9) 96,718 (0.9)
Total Mobile Accesses 74,432 (0.2) 74,432 (0.2) 74,432 (0.2) 74,432 (0.2)
Total Fixed Accesses 22,285 (3.4) 22,285 (3.4) 22,285 (3.4) 22,285 (3.4)
Consolidated in R$ million 2018 Pro forma (ex-IFRS 15)¹ 2018 Data (Reported)
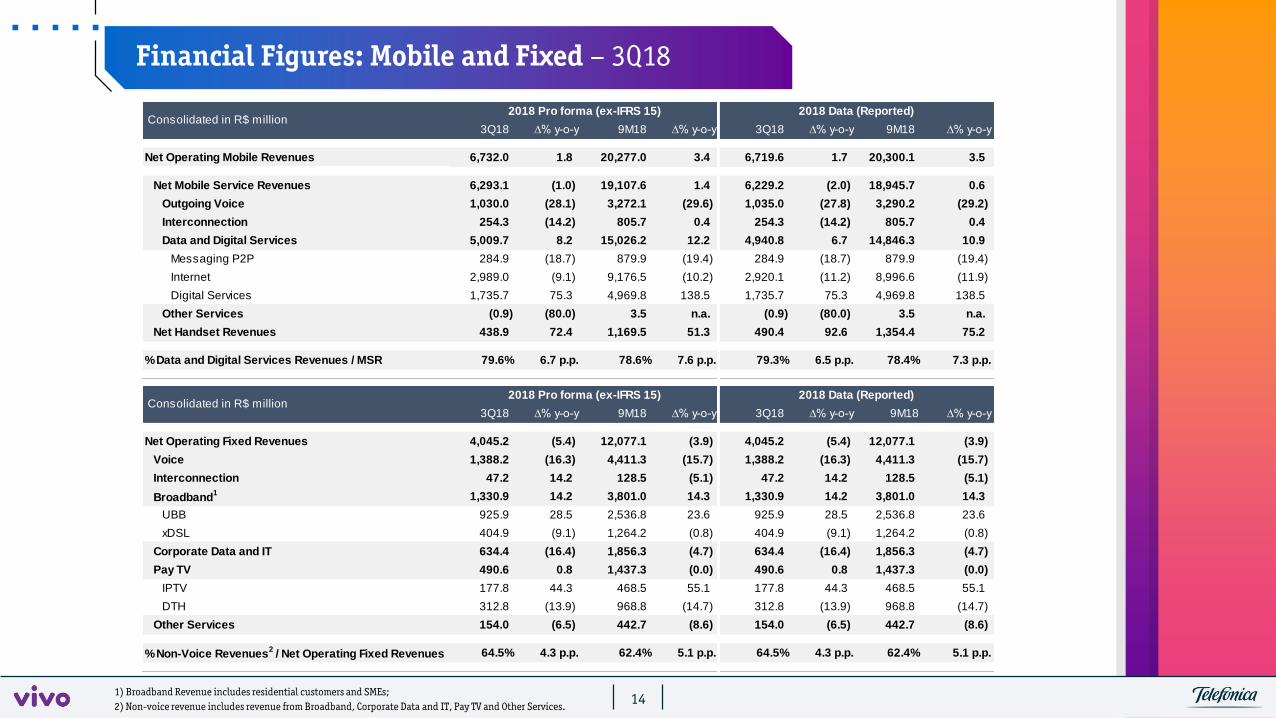
Financial Figures: Mobile and Fixed – 3Q18
141) Broadband Revenue includes residential customers and SMEs;2) Non-voice revenue includes revenue from Broadband, Corporate Data and IT, Pay TV and Other Services.
3Q18 ∆% y-o-y 9M18 ∆% y-o-y 3Q18 ∆% y-o-y 9M18 ∆% y-o-y
Net Operating Mobile Revenues 6,732.0 1.8 20,277.0 3.4 6,719.6 1.7 20,300.1 3.5
Net Mobile Service Revenues 6,293.1 (1.0) 19,107.6 1.4 6,229.2 (2.0) 18,945.7 0.6
Outgoing Voice 1,030.0 (28.1) 3,272.1 (29.6) 1,035.0 (27.8) 3,290.2 (29.2)
Interconnection 254.3 (14.2) 805.7 0.4 254.3 (14.2) 805.7 0.4
Data and Digital Services 5,009.7 8.2 15,026.2 12.2 4,940.8 6.7 14,846.3 10.9
Messaging P2P 284.9 (18.7) 879.9 (19.4) 284.9 (18.7) 879.9 (19.4)
Internet 2,989.0 (9.1) 9,176.5 (10.2) 2,920.1 (11.2) 8,996.6 (11.9)
Digital Services 1,735.7 75.3 4,969.8 138.5 1,735.7 75.3 4,969.8 138.5
Other Services (0.9) (80.0) 3.5 n.a. (0.9) (80.0) 3.5 n.a.
Net Handset Revenues 438.9 72.4 1,169.5 51.3 490.4 92.6 1,354.4 75.2
% Data and Digital Services Revenues / MSR 79.6% 6.7 p.p. 78.6% 7.6 p.p. 79.3% 6.5 p.p. 78.4% 7.3 p.p.
2018 Data (Reported) Consolidated in R$ million
2018 Pro forma (ex-IFRS 15)
3Q18 ∆% y-o-y 9M18 ∆% y-o-y 3Q18 ∆% y-o-y 9M18 ∆% y-o-y
Net Operating Fixed Revenues 4,045.2 (5.4) 12,077.1 (3.9) 4,045.2 (5.4) 12,077.1 (3.9)
Voice 1,388.2 (16.3) 4,411.3 (15.7) 1,388.2 (16.3) 4,411.3 (15.7)
Interconnection 47.2 14.2 128.5 (5.1) 47.2 14.2 128.5 (5.1)
Broadband1 1,330.9 14.2 3,801.0 14.3 1,330.9 14.2 3,801.0 14.3
UBB 925.9 28.5 2,536.8 23.6 925.9 28.5 2,536.8 23.6
xDSL 404.9 (9.1) 1,264.2 (0.8) 404.9 (9.1) 1,264.2 (0.8)
Corporate Data and IT 634.4 (16.4) 1,856.3 (4.7) 634.4 (16.4) 1,856.3 (4.7)
Pay TV 490.6 0.8 1,437.3 (0.0) 490.6 0.8 1,437.3 (0.0)
IPTV 177.8 44.3 468.5 55.1 177.8 44.3 468.5 55.1
DTH 312.8 (13.9) 968.8 (14.7) 312.8 (13.9) 968.8 (14.7)
Other Services 154.0 (6.5) 442.7 (8.6) 154.0 (6.5) 442.7 (8.6)
% Non-Voice Revenues2 / Net Operating Fixed Revenues 64.5% 4.3 p.p. 62.4% 5.1 p.p. 64.5% 4.3 p.p. 62.4% 5.1 p.p.
2018 Data (Reported) Consolidated in R$ million
2018 Pro forma (ex-IFRS 15)

Mobile Operating Figures – 3Q18
151) Source: Teleco – August 2018. 2) Pro-forma data, excluding the effects of IFRS 15.
Thousand 3Q18 3Q17 ∆% 2Q18 ∆% 9M18 9M17 ∆%
Total Mobile Accesses 74,432 74,562 (0.2) 75,262 (1.1) 74,432 74,562 (0.2)
Postpaid 39,415 35,664 10.5 38,435 2.5 39,415 35,664 10.5
M2M 7,637 5,854 30.5 7,114 7.4 7,637 5,854 30.5
Prepaid 35,017 38,897 (10.0) 36,827 (4.9) 35,017 38,897 (10.0)
Market Share 31.8% 30.9% 0.8 p.p. 32.0% (0.2) p.p. 31.8% 30.9% 2.7 p.p.
Postpaid 41.1% 42.1% (1.0) p.p. 41.2% (0.1) p.p. 41.1% 42.1% (2.3) p.p.
M2M 42.5% 40.4% 2.1 p.p. 42.1% 0.4 p.p. 42.5% 40.4% 5.1 p.p.
Net Additions (830) 227 n.a. 164 n.a. (508) 784 n.a.
Postpaid 980 981 (0.1) 936 4.7 2,644 2,274 16.3
Market Share of Postpaid Net Additions 36.5% 35.1% 3.8 36.7% (0.7) 33.5% 42.5% (21.2)
Market Penetration1 112.0% 116.1% (4.1) p.p. 112.5% (0.5) p.p. 112.0% 116.1% (3.5) p.p.
Monthly Churn 3.7% 3.4% 0.3 p.p. 3.0% 0.7 p.p. 3.3% 3.4% (3.0) p.p.
Postpaid ex. M2M 1.8% 1.8% 0.0 p.p. 1.7% 0.0 p.p. 1.7% 1.7% (1.6) p.p.
Prepaid 5.6% 4.8% 0.8 p.p. 4.2% 1.4 p.p. 4.8% 4.7% 1.5 p.p.
ARPU (R$/month)2 27.9 28.4 (1.7) 28.3 (1.4) 28.3 28.2 0.3
Voice 5.7 7.7 (26.1) 6.1 (6.4) 6.0 8.2 (25.9)
Data 22.2 20.7 7.4 22.3 (0.1) 22.2 20.1 11.0
Postpaid ex. M2M ARPU2 51.5 51.5 0.0 52.3 (1.6) 52.1 52.0 0.2
Prepaid ARPU2 11.6 13.5 (14.4) 11.7 (1.2) 12.1 13.4 (10.1)
M2M ARPU2 2.6 2.8 (6.9) 2.7 (3.7) 2.7 3.0 (11.5)
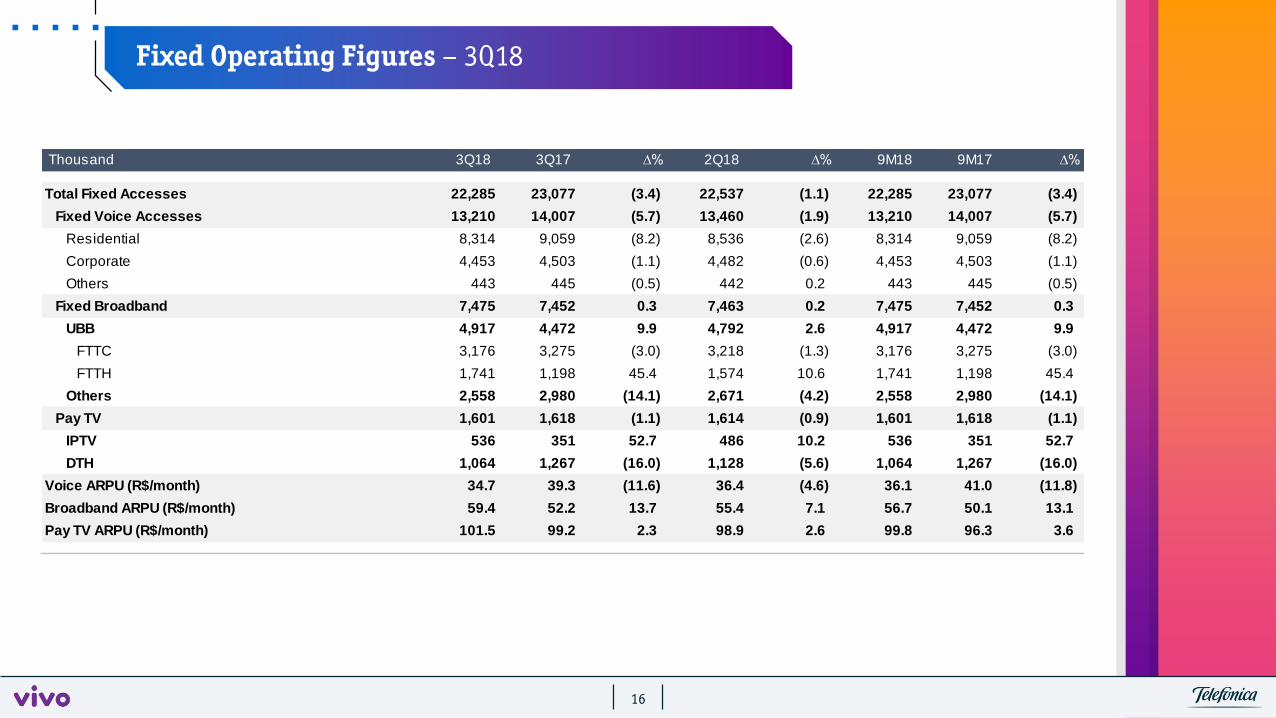
Fixed Operating Figures – 3Q18
16
Thousand 3Q18 3Q17 ∆% 2Q18 ∆% 9M18 9M17 ∆%
Total Fixed Accesses 22,285 23,077 (3.4) 22,537 (1.1) 22,285 23,077 (3.4)
Fixed Voice Accesses 13,210 14,007 (5.7) 13,460 (1.9) 13,210 14,007 (5.7)
Residential 8,314 9,059 (8.2) 8,536 (2.6) 8,314 9,059 (8.2)
Corporate 4,453 4,503 (1.1) 4,482 (0.6) 4,453 4,503 (1.1)
Others 443 445 (0.5) 442 0.2 443 445 (0.5)
Fixed Broadband 7,475 7,452 0.3 7,463 0.2 7,475 7,452 0.3
UBB 4,917 4,472 9.9 4,792 2.6 4,917 4,472 9.9
FTTC 3,176 3,275 (3.0) 3,218 (1.3) 3,176 3,275 (3.0)
FTTH 1,741 1,198 45.4 1,574 10.6 1,741 1,198 45.4
Others 2,558 2,980 (14.1) 2,671 (4.2) 2,558 2,980 (14.1)
Pay TV 1,601 1,618 (1.1) 1,614 (0.9) 1,601 1,618 (1.1)
IPTV 536 351 52.7 486 10.2 536 351 52.7
DTH 1,064 1,267 (16.0) 1,128 (5.6) 1,064 1,267 (16.0)
Voice ARPU (R$/month) 34.7 39.3 (11.6) 36.4 (4.6) 36.1 41.0 (11.8)
Broadband ARPU (R$/month) 59.4 52.2 13.7 55.4 7.1 56.7 50.1 13.1
Pay TV ARPU (R$/month) 101.5 99.2 2.3 98.9 2.6 99.8 96.3 3.6
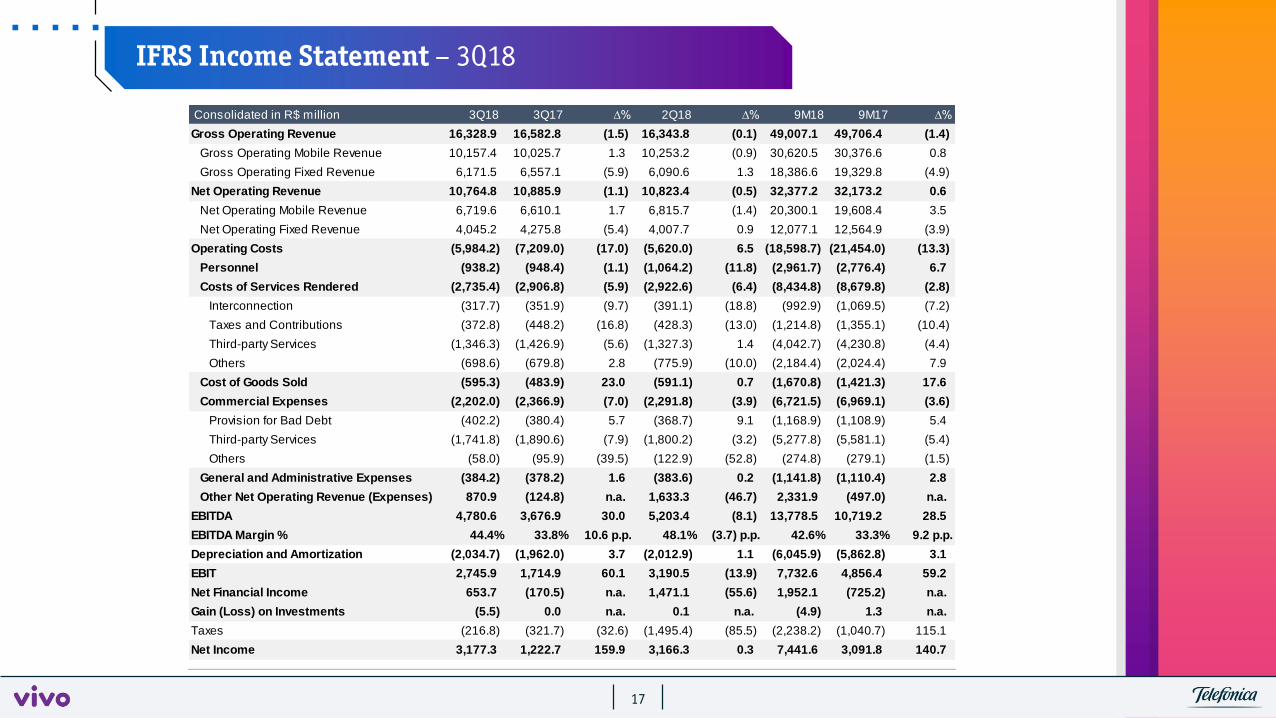
IFRS Income Statement – 3Q18
17
Consolidated in R$ million 3Q18 3Q17 ∆% 2Q18 ∆% 9M18 9M17 ∆%
Gross Operating Revenue 16,328.9 16,582.8 (1.5) 16,343.8 (0.1) 49,007.1 49,706.4 (1.4)
Gross Operating Mobile Revenue 10,157.4 10,025.7 1.3 10,253.2 (0.9) 30,620.5 30,376.6 0.8
Gross Operating Fixed Revenue 6,171.5 6,557.1 (5.9) 6,090.6 1.3 18,386.6 19,329.8 (4.9)
Net Operating Revenue 10,764.8 10,885.9 (1.1) 10,823.4 (0.5) 32,377.2 32,173.2 0.6
Net Operating Mobile Revenue 6,719.6 6,610.1 1.7 6,815.7 (1.4) 20,300.1 19,608.4 3.5
Net Operating Fixed Revenue 4,045.2 4,275.8 (5.4) 4,007.7 0.9 12,077.1 12,564.9 (3.9)
Operating Costs (5,984.2) (7,209.0) (17.0) (5,620.0) 6.5 (18,598.7) (21,454.0) (13.3)
Personnel (938.2) (948.4) (1.1) (1,064.2) (11.8) (2,961.7) (2,776.4) 6.7
Costs of Services Rendered (2,735.4) (2,906.8) (5.9) (2,922.6) (6.4) (8,434.8) (8,679.8) (2.8)
Interconnection (317.7) (351.9) (9.7) (391.1) (18.8) (992.9) (1,069.5) (7.2)
Taxes and Contributions (372.8) (448.2) (16.8) (428.3) (13.0) (1,214.8) (1,355.1) (10.4)
Third-party Services (1,346.3) (1,426.9) (5.6) (1,327.3) 1.4 (4,042.7) (4,230.8) (4.4)
Others (698.6) (679.8) 2.8 (775.9) (10.0) (2,184.4) (2,024.4) 7.9
Cost of Goods Sold (595.3) (483.9) 23.0 (591.1) 0.7 (1,670.8) (1,421.3) 17.6
Commercial Expenses (2,202.0) (2,366.9) (7.0) (2,291.8) (3.9) (6,721.5) (6,969.1) (3.6)
Provision for Bad Debt (402.2) (380.4) 5.7 (368.7) 9.1 (1,168.9) (1,108.9) 5.4
Third-party Services (1,741.8) (1,890.6) (7.9) (1,800.2) (3.2) (5,277.8) (5,581.1) (5.4)
Others (58.0) (95.9) (39.5) (122.9) (52.8) (274.8) (279.1) (1.5)
General and Administrative Expenses (384.2) (378.2) 1.6 (383.6) 0.2 (1,141.8) (1,110.4) 2.8
Other Net Operating Revenue (Expenses) 870.9 (124.8) n.a. 1,633.3 (46.7) 2,331.9 (497.0) n.a.
EBITDA 4,780.6 3,676.9 30.0 5,203.4 (8.1) 13,778.5 10,719.2 28.5
EBITDA Margin % 44.4% 33.8% 10.6 p.p. 48.1% (3.7) p.p. 42.6% 33.3% 9.2 p.p.
Depreciation and Amortization (2,034.7) (1,962.0) 3.7 (2,012.9) 1.1 (6,045.9) (5,862.8) 3.1
EBIT 2,745.9 1,714.9 60.1 3,190.5 (13.9) 7,732.6 4,856.4 59.2
Net Financial Income 653.7 (170.5) n.a. 1,471.1 (55.6) 1,952.1 (725.2) n.a.
Gain (Loss) on Investments (5.5) 0.0 n.a. 0.1 n.a. (4.9) 1.3 n.a.
Taxes (216.8) (321.7) (32.6) (1,495.4) (85.5) (2,238.2) (1,040.7) 115.1
Net Income 3,177.3 1,222.7 159.9 3,166.3 0.3 7,441.6 3,091.8 140.7
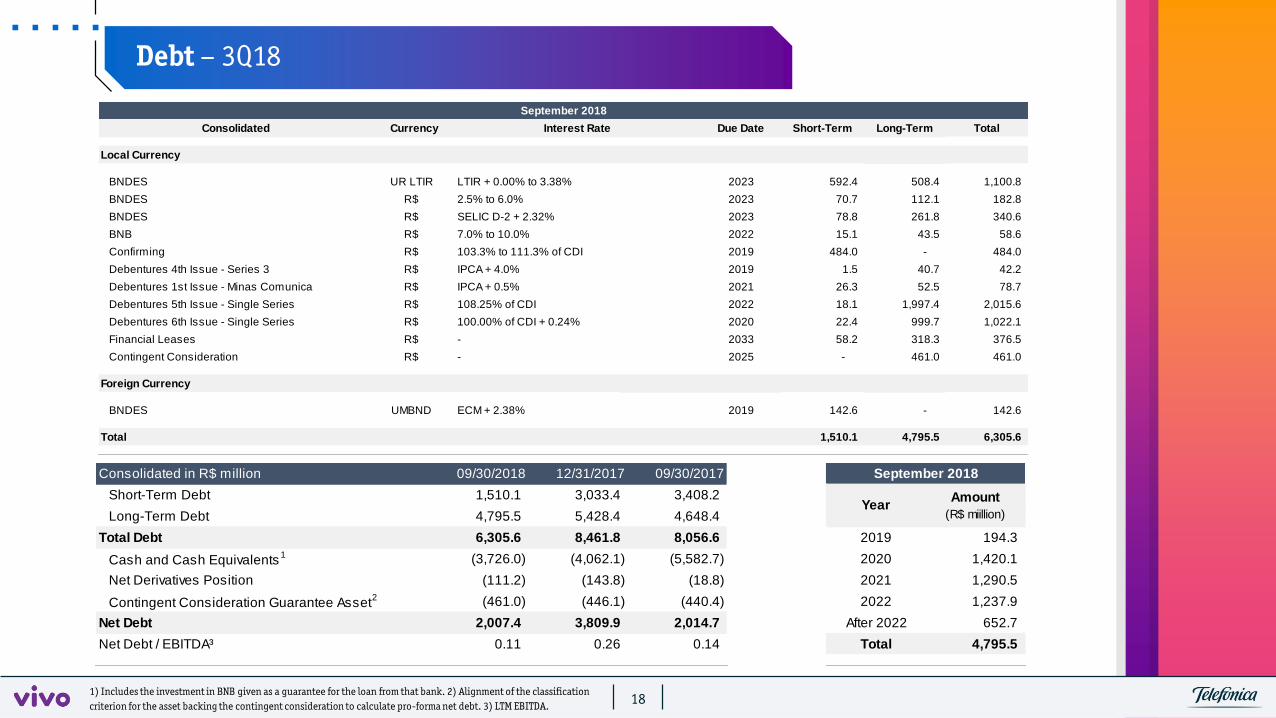
Debt – 3Q18
181) Includes the investment in BNB given as a guarantee for the loan from that bank. 2) Alignment of the classification criterion for the asset backing the contingent consideration to calculate pro-forma net debt. 3) LTM EBITDA.
Consolidated Currency Due Date Short-Term Long-Term Total
Local Currency
BNDES UR LTIR 2023 592.4 508.4 1,100.8
BNDES R$ 2023 70.7 112.1 182.8
BNDES R$ 2023 78.8 261.8 340.6
BNB R$ 2022 15.1 43.5 58.6
Confirming R$ 2019 484.0 - 484.0
Debentures 4th Issue - Series 3 R$ 2019 1.5 40.7 42.2
Debentures 1st Issue - Minas Comunica R$ 2021 26.3 52.5 78.7
Debentures 5th Issue - Single Series R$ 2022 18.1 1,997.4 2,015.6
Debentures 6th Issue - Single Series R$ 2020 22.4 999.7 1,022.1
Financial Leases R$ 2033 58.2 318.3 376.5
Contingent Consideration R$ 2025 - 461.0 461.0
Foreign Currency
BNDES UMBND 2019 142.6 - 142.6
Total 1,510.1 4,795.5 6,305.6
SELIC D-2 + 2.32%
7.0% to 10.0%
103.3% to 111.3% of CDI
IPCA + 4.0%
September 2018
Interest Rate
LTIR + 0.00% to 3.38%
2.5% to 6.0%
108.25% of CDI
100.00% of CDI + 0.24%
-
IPCA + 0.5%
-
ECM + 2.38%
Consolidated in R$ million 09/30/2018 12/31/2017 09/30/2017
Short-Term Debt 1,510.1 3,033.4 3,408.2 Amount
Long-Term Debt 4,795.5 5,428.4 4,648.4 (R$ miillion)
Total Debt 6,305.6 8,461.8 8,056.6 2019 194.3
Cash and Cash Equivalents1 (3,726.0) (4,062.1) (5,582.7) 2020 1,420.1
Net Derivatives Position (111.2) (143.8) (18.8) 2021 1,290.5
Contingent Consideration Guarantee Asset2 (461.0) (446.1) (440.4) 2022 1,237.9
Net Debt 2,007.4 3,809.9 2,014.7 After 2022 652.7
Net Debt / EBITDA³ 0.11 0.26 0.14 Total 4,795.5
Year
September 2018

1919
IFRS 15: new accounting standard in force since January 2018, which requires revenue to be recognized based on the contract with the customer, not necessarily aligned with billing. For Vivo, revenue recognition of mobile offers with handset subsidy will change, as the subsidy will now be distributed between services and handset. In addition, certain costs to acquire a customer through a contract will now have to be capitalized if the amortization period is >12 months.
Pro forma¹ Reported¹
R$ million 3Q18w/o IFRS Δ% YoY IFRS
Adjustments3Q18
w/ IFRS Δ% YoY
Net Operating Revenue 10,777.2 -1.0% -12.4 10,764.8 -1.1%
Net Service Revenue 10,338.4 -2.8% -63.9 10,274.5 -3.4%
Net Mobile Service Revenue 6,293.1 -1.0% -63.9 6,229.2 -2.0%
Net Fixed Revenue 4,045.3 -5.4% 0.0 4,045.3 -5.4%
Net Handset Revenue 438.9 72.4% 51.5 490.4 92.6%
Recurring Operating Costs -6,905.3 -4.2% 26.5 -6,878.8 -4.6%
Personnel -939.9 -0.9% 1.7 -938.2 -1.1%
Commercial Expenses -2,226.8 -5.9% 24.8 -2,202.0 -7.0%
Recurring EBITDA 3,871.9 5.3% 14.1 3,886.0 5.7%
Recurring EBITDA Margin 35.9% 2.1 p.p. 0.2 p.p. 36.1% 2.3 p.p.
Net Income 3,168.0 159.1% 9.3 3,177.3 159.9%
Effects of IFRS 15 on our 3Q18 results
1- Reported figures and YoY variation consider in 2017 IAS 18 accounting and in 2018 IFRS 15 accounting, while pro forma figures and YoY variation consider in 2017 and 2018 IAS 18 accounting.

+55 11 3430.3687
www.telefonica.com.br/ir
FOR FURTHER INFORMATION:
INVESTOR RELATIONS