corporate presentation - d1io3yog0oux5.cloudfront.net€¦ · 2012 2013 2014 2015 ... 8 projected...
TRANSCRIPT

Corporate Presentation
March, 2018
NASDAQ: LGND

The following presentation contains forward-looking statements regarding Ligand’s prospects, plans and strategies, drug development programs and collaborations. Forward-looking statements include financial projections, expectations regarding research and development programs, and other statements including words such as “will,“ “should,” “could,” “plan,” etc. Actual events or results may differ from Ligand’s expectations. For example, drug development program benefits may not be realized and there can be no assurance that Ligand will achieve its guidance in 2018 or thereafter or that third party research summarized herein is correct or complete.
The forward-looking statements made in the presentation are subject to several risk factors, including, statements regarding intent, belief, or current expectations of the Ligand, its internal and partnered programs, including Promacta™, Kyprolis® and EVOMELA®, Ligand’s reliance on collaborative partners for milestone and royalty payments, royalty and other revenue projections based on third party research, regulatory hurdles facing Ligand's and partners’ product candidates, uncertainty regarding Ligand's and partners’ product development costs, the possibility that Ligand's and partners’ drug candidates mightnot be proved to be safe and efficacious and commercial performance of Ligand's and/or its partners’ products, risks related to Ligand’s internal controls, its compliance with regulations, accounting principles and public disclosure, and other risks anduncertainties described in its public filings with the Securities and Exchange Commission, available at www.sec.gov. Additional risks may apply to forward-looking statements made in this presentation. Information regarding partnered products and programs comes from information publicly released by our partners. This presentation describes the typical roles and responsibilities of Ligand and our partners, and is not intended to be a complete description in all cases. Our trademarks, trade names and service marks referenced herein include Ligand and Captisol. Each other trademark, trade name or service mark appearing in this presentation belongs to its owner. The process for reconciliation between adjusted financial numbers presented on slide 43, and the corresponding GAAP figures is shown on slide 45.
Readers are cautioned not to place undue reliance on these forward-looking statements, which reflect our good faith beliefs (or those of the indicated third parties) and speak only as of the date hereof. All forward-looking statements are qualified in their entirety by this cautionary statement, and Ligand undertakes no obligation to revise or update this presentation to reflect events or circumstances or update third party research numbers after the date hereof. This caution is made under the safe harbor provisions of Section 21E of the Securities Exchange Act of 1934.
Safe Harbor Statement
2

• Realities of the pharmaceutical industry
– Most drug research programs fail, but not all
– Programs are not all of equal value – different time to market, risk, economics
• BUT, the more quality programs you have, the higher likelihood of success
– Diversified across a full range of industry partners
– Diversified across a broad spectrum of therapeutic indications
• A shot-on-goal for Ligand is a fully funded partnership
– Backed by license to Ligand’s patents, know-how and/or data
– Sharing of future economics based on partner’s success
3
Shots-on-Goal Business ModelThe “LIGAND MODEL”
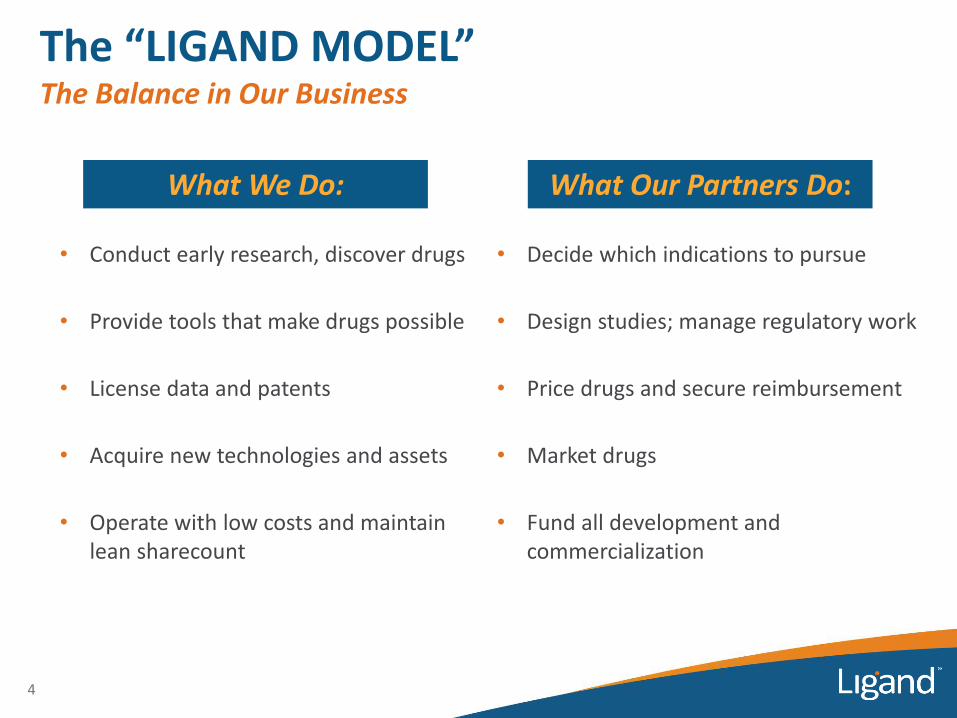
The “LIGAND MODEL”The Balance in Our Business
• Conduct early research, discover drugs • Decide which indications to pursue
• Provide tools that make drugs possible • Design studies; manage regulatory work
• License data and patents • Price drugs and secure reimbursement
• Acquire new technologies and assets • Market drugs
• Operate with low costs and maintain lean sharecount
• Fund all development and commercialization
4
What We Do: What Our Partners Do:
0
15
30
45
60
75
90
105
120
135
150
165
2008 2017
9
0
2
4
6
8
10
12
14
16
18
2008 2017
Fully
-Fu
nd
ed P
rogr
ams
(“Sh
ots
-on
-Go
al”)
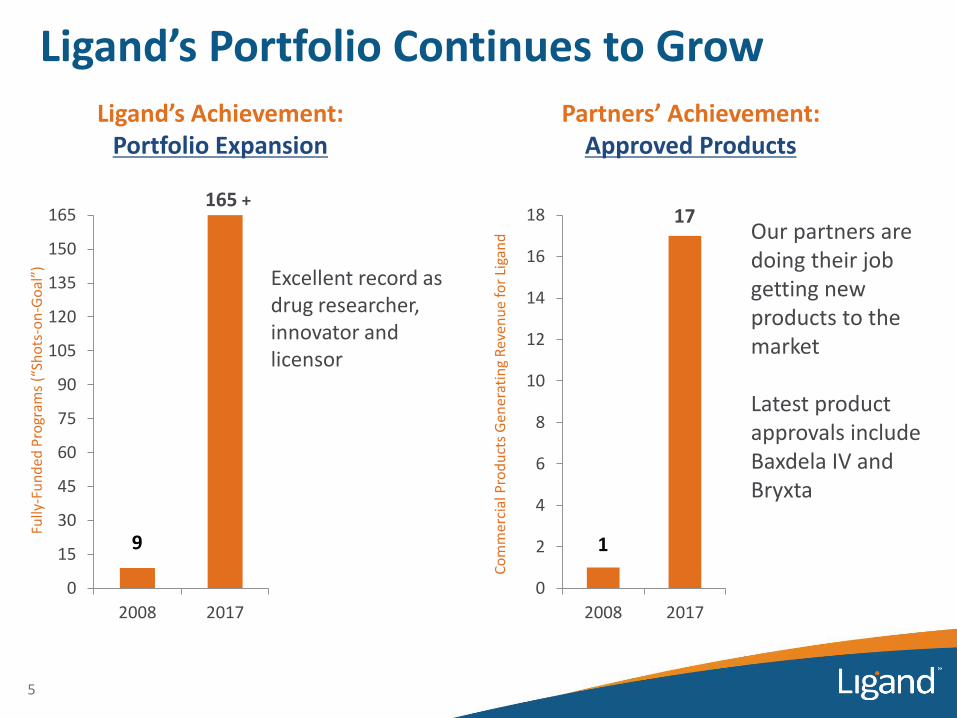
Ligand’s Portfolio Continues to Grow
165 +
Ligand’s Achievement:Portfolio Expansion
Partners’ Achievement:Approved Products
Excellent record as drug researcher, innovator and licensor
Our partners are doing their job getting new products to the market
Latest product approvals include Baxdela IV and Bryxta
1
17
Co
mm
erci
al P
rod
uct
s G
ener
atin
g R
even
ue
for
Liga
nd
5

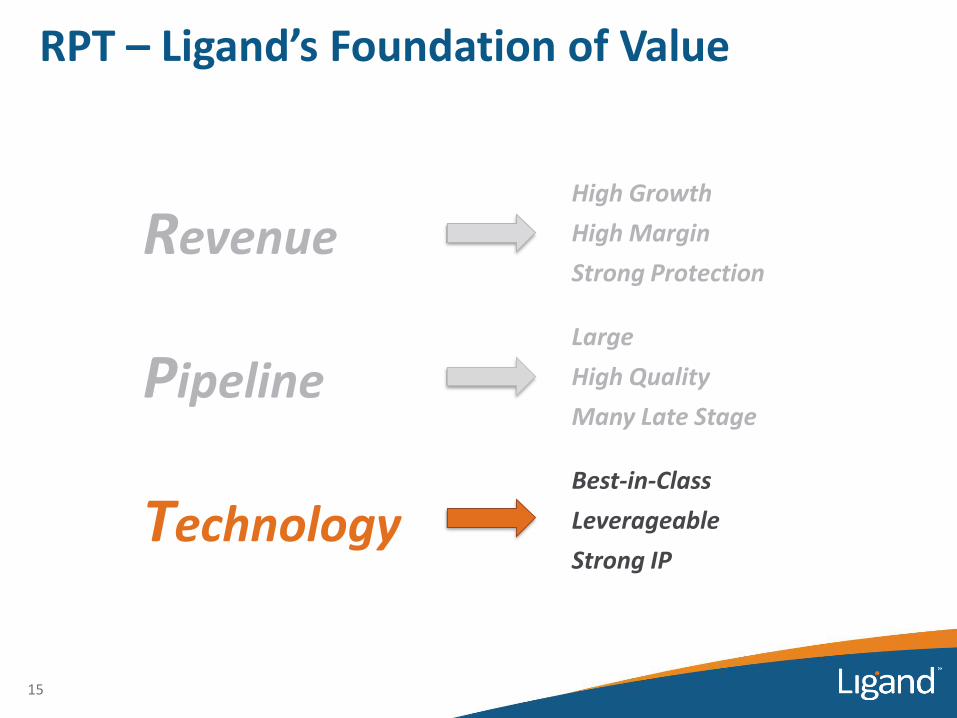
RPT – Ligand’s Foundation of Value
6
Revenue
Pipeline
Technology

RevenueHigh Growth
High Margin
Strong Protection
PipelineLarge and Growing
High Quality
Many Late Stage
TechnologyBest-in-Class
Leverageable
Strong IP
RPT – Ligand’s Foundation of Value
7

Underlying Revenue & Effective Royalty Rate
2.0%
2.5%
3.0%
3.5%
4.0%
4.5%
5.0%
5.5%
6.0%
$0.0
$0.2
$0.4
$0.6
$0.8
$1.0
$1.2
$1.4
$1.6
$1.8
$2.0
$2.2
$2.4
2012 2013 2014 2015 2016 2017 2018
Revenue $Billions
8 Projected
• New approvals and increasing sales of existing partnered products are major drivers for underlying revenue growth
• Average royalty rate increasing due to mix of sales and royalty tiering
• 2018 Corporate gross margins projected to be 96%
Current 2018 outlook, underlying revenue will exceed $2.2 billion and average royalty will exceed 5%
Royalty Rate

RPT – Ligand’s Foundation of Value
RevenueHigh Growth
High Margin
Strong Protection
PipelineLarge and Growing
High Quality
Many Late Stage
TechnologyBest-in-Class
Leverageable
Strong IP
9
Pipeline
• In pharmaceuticals, most programs fail; but not ALL programs
• Ligand’s pipeline is:
— Large and growing
— Highly diversified
— Many programs have top-tier sponsorship
• Unique economic structure of Ligand’s pipeline:
— Our deals are fully funded
— Ligand is not generating big annual losses OR diluting shareholders to finance its pipeline
• Many of Ligand’s major assets are still development-stage
10
Why is Ligand’s Pipeline Valuable?

Ligand’s Portfolio Continues to GrowOver 165 Partnered Programs
• Portfolio remains diversified across development stages
• Over 95 different partners
• Nearly 55% of programs in clinical development or later
• 11% marketed or NDA stage
11
Preclinical
Phase 1
Phase 2Phase 3NDA
Marketed
45%
9%
22%
18%4%2%

Ligand Portfolio Highlights
• We estimate our partners will conduct over 200 studies and spend over $2 billion in 2018 on R&D to advance our programs
• Total potential payments under existing contracts for our more than 165 partnerships exceed $2.5 billion
• Ligand is partnered with major companies for some of the industry’s most important potential medicines
• Ligand-based programs are major assets for partners
Foundational for mega-acquisitions
– e.g., Novartis with GSK-Oncology (Promacta), Amgen with Onyx (Kyprolis), BMS with Cardioxyl
Foundational for IPO, reverse mergers or important financings
– e.g., Melinta, Viking, Aldeyra, Retrophin, Sermonix, others
12
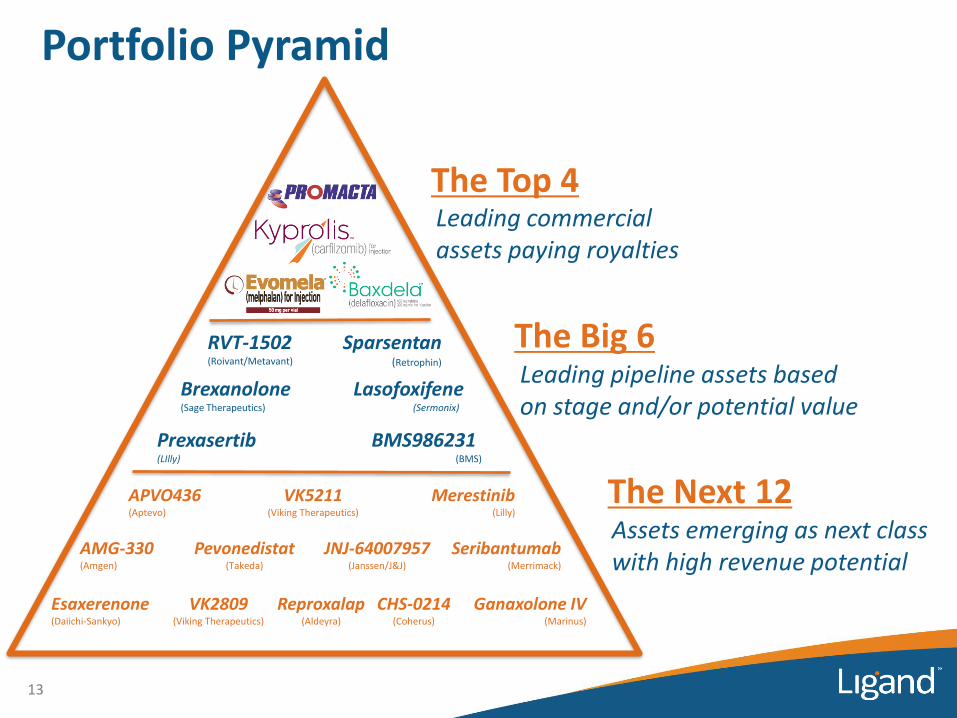
Portfolio Pyramid
13
Leading commercial assets paying royalties
Prexasertib(LIlly)
Lasofoxifene(Sermonix)
Brexanolone(Sage Therapeutics)
Sparsentan(Retrophin)
RVT-1502(Roivant/Metavant)
BMS986231 (BMS)
APVO436(Aptevo)
VK5211(Viking Therapeutics)
VK2809(Viking Therapeutics)
Merestinib(Lilly)
AMG-330(Amgen)
Pevonedistat(Takeda)
JNJ-64007957(Janssen/J&J)
Seribantumab(Merrimack)
Reproxalap(Aldeyra)
CHS-0214(Coherus)
Esaxerenone(Daiichi-Sankyo)
Ganaxolone IV(Marinus)
The Top 4
The Big 6Leading pipeline assets based on stage and/or potential value
The Next 12Assets emerging as next class with high revenue potential

Portfolio PyramidPower of our Pipeline
• 19 companies with over 100 trials conducted and in-progress
• Estimated >$500 million spent in the last year funding programs partnered with Ligand
• Leading assets for Ligand Leading assets for partners
— Discussed on most quarterly conference calls
— For many partners, Ligand program is the leading/main program
— Highly diversified indications and drug types
• Ligand typically contributed drug and technology inventions, and shares in meaningful program economics
14
What the Pyramid Represents
RPT – Ligand’s Foundation of Value
RevenueHigh Growth
High Margin
Strong Protection
PipelineLarge
High Quality
Many Late Stage
TechnologyBest-in-Class
Leverageable
Strong IP
15

Highly-pure, pharmaceutical grade ingredient with reliable supply
Broad, global patent protection
Large Drug Master Files
Now with most pharma partners, most approved products
Only antibody discovery platform with three species
Platform with the most partners
Strong market protection and long patent coverage for products
Fast-growing number of drug candidates moving to the clinic
Two Major Technology PlatformsMarket Leading, Best-in-Class
16
In 2016, Ligand made a MAJOR strategic investment into antibody discovery by acquiring OMT, Inc. for ~$178 million
Ligand’s continued investment has solidified its position with the Best-in-Class antibody discovery platform
17
Antibody TechnologiesLike with Captisol, Ligand has made a “right time” investment into a major technology platform to deliver significant returns for the next 20 years
Antibodies: Major Opportunities

0
100
200
300
400
500
600
2008 2017
150
An
tib
od
ies
in c
linic
al d
evel
op
men
t557
• The number of antibodies in clinical development has more than tripled since 2008
Antibodies: Major R&D and Sales Growth
18Nelson et al., Nature Reviews, 2010 Reichert Antibody Society, 2017BioPharm Insight, March 2016
$0
$50
$100
$150
2011 2020
Sale
s o
f A
nti
bo
dy-
Bas
ed T
her
apeu
tics
(B
illio
ns
$)
Projected
• Global sales of antibodies in 2020 estimated to approach $150 billion in 2020
Antibody treatments are the fastest-growing segment of the pharmaceutical industry
19
Antibodies: Major Opportunities
WHY?
• “Because they work”1
• Many of the largest drugs on the market are antibodies
• Significant allocation of R&D resources toward antibodies
1 Janice Reichert, PhD - President, The Antibody Society, 2017
Success rates for antibody drug candidates have been nearly DOUBLE the rate for small-molecule drug candidates…
20
WHY?
Antibodies: Major Opportunities
Clinical Development success rates 2006-2015 (Bio, Biomedtracker and Amplion)
Antibodies can be highly-targeted and bind very selectively to specific molecules

Ligand is at the right place and right time with a highly-valuable technology platform
21
There is a large and growing demand for antibody research tools
More companies, more dollars than ever
No signs of slowing, given research investments
Industry is shifting to biological-based research
Antibodies: Major Opportunities

22
The OmniAb Platform
“Three Species – One License”
By 2025, platform projected to generate: • >$300 million of aggregate contract revenue• > 40 clinical-stage programs• > 150 research-stage candidates• OmniAb products on the market

OmniAb: Future Outlook
• Growing list of partners following acquisition by Ligand
— 9 new partners since 2017, 5 OmniAb antibodies in clinical phase
• >300 antibody discovery projects have been initiated by partners
• OmniChicken™ further established OmniAb’s leadership position
— Expanded epitope coverage
23
Today
Tomorrow
Parameter 2020 2025
Number of OmniAb Partners 45 60
Clinical-stage OmniAb Antibodies 25 >40
Approved Drugs - 1-3
• The global leader in antibody discovery space, estimating:
Promacta®

• Oral medicine that boosts platelets in patients with thrombocytopenia, or low-platelets
• Partnered with Novartis worldwide
Promacta®: Blockbuster Commercial Potential
25
• Sales trending to ~$1 billion+ for 2018; Consensus third-party analyst estimates project $1.4 billion in 2021
• Approved for numerous indications involving low platelets, and multiple trials underway to support label expansion
Sources: Third party analyst reports, Novartis public disclosures, www.promacta.com

$ m
illio
ns
GSK/NOVN (post Q1’14) reported quarterly sales.GSK figures converted from GBP to USD at then current exchange rates
2012
$0
$20
$40
$60
$80
$100
$120
$140
$160
$180
$200
$220
$240
$260
Q1 Q2 Q3 Q4Q1 Q2 Q3 Q4Q1 Q2 Q3 Q4Q1 Q2 Q3 Q4 Q1 Q2 Q3 Q4 Q1 Q2 Q3 Q4 Q1 Q2 Q3 Q4
2013 2014 2015
• Q4’17 revenue was $255 million, a $77 million increase (43%) over Q4’16
• Sales now annualize to over $1 billion
• Considered by Novartis as one of their global “key growth drivers”
2016
First full quarter for Promacta at Novartis
Promacta: Quarterly Revenue
2011
26
2017

Kyprolis®

• Kyprolis viewed as best-in-class proteasome inhibitor for multiple myeloma (MM)
• Developed and marketed by Amgen
— Utilizes Ligand’s Captisol technology
Kyprolis
28
1 KYPROLIS is also approved in Argentina, Australia, Bahrain, Canada, Hong Kong, Israel, Kuwait, Lebanon, Macao, Mexico, Thailand, Colombia, S. Korea, Qatar, Switzerland, Singapore, Taiwan, Jordan, Egypt, Saudi Arabia, United Arab Emirates, Turkey, Russia, Brazil, India and Oman. Additional regulatory applications for KYPROLIS are underway and have been submitted to health authorities worldwide.
Sources: Amgen public disclosures, www.kyprolis.comww.kyprolis.com
• Approved for relapsed or refractory MM in the US, EU and Japan (Ono)1
— As single agent, or in combination with dexamethasone or Revlimid and dexamethasone
• Kyprolis has demonstrated overall survival improvement in both the Phase 3 ENDEAVOR and Phase 3 ASPIRE studies, bolstering the value proposition for the drug in a competitive space
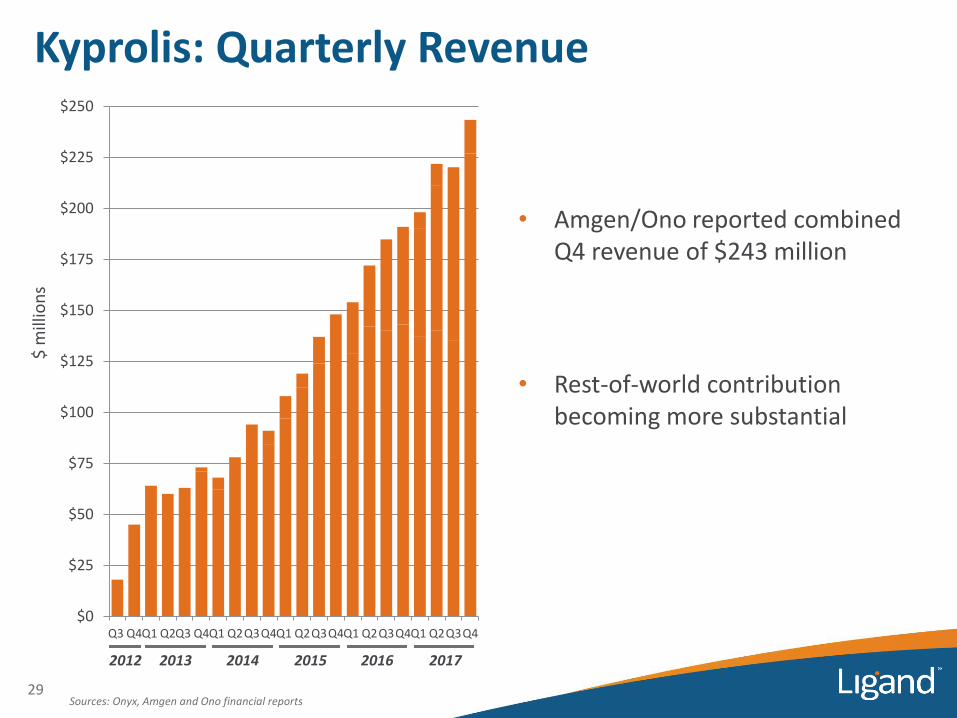
Sources: Onyx, Amgen and Ono financial reports
$ m
illio
ns
2012
$0
$25
$50
$75
$100
$125
$150
$175
$200
$225
$250
Q3 Q4Q1 Q2Q3 Q4Q1 Q2Q3Q4Q1 Q2Q3Q4Q1 Q2Q3Q4Q1 Q2Q3Q4
2013 2014
• Amgen/Ono reported combined Q4 revenue of $243 million
• Rest-of-world contribution becoming more substantial
Kyprolis: Quarterly Revenue
2015 2016
29
2017

KyprolisStatus and Plans
30
Source: Amgen public disclosures dated July 25, 2017 , October 25, 2017, February 1, 2018, www.clinicaltrials.gov – www.kyprolis.comKyprolis is developed and marketed by Amgen
• Amgen is very active with clinical and regulatory activities for Kyprolis
― In January, U.S. label updated with overall survival (OS) data from the Phase 3 head-to-head ENDEAVOR study
▪ Also received CHMP positive opinion to add updated OS data from the ENDEAVORstudy to the Kyprolis EU label
― In December, submitted applications in the U.S. and EU to include OS data from the Phase 3 ASPIRE study in the product labeling
― Phase 3 trial in combination with Janssen’s Darzalex® in relapsed/refractory multiple myeloma began in Q2 2017
― Several Phase 2 studies underway in combination with Darzalex®, Pomalyst®, or Empliciti™ in relapsed/refractory and/or newly diagnosed multiple myeloma

Ono Pharmaceutical Co., Ltd.Exclusively Markets Kyprolis in Japan
• Received approval in Japan in July 2016 and launched August 2016
— Exclusive license agreement with Onyx/Amgen in September 2010
— Royalties pass through to Ligand
• Since launch, Ono has reported increasing sales of Kyprolis
— Ono’s forecast for fiscal year ending March 31, 2018 is >$50 M USD
• Other MM drugs approved in Japan include Pomalyst (March 2015), Ninlaro (May 2017) and Darzalex (Sept. 2017)
31
-
2.0
4.0
6.0
8.0
10.0
12.0
14.0
16.0
18.0
3Q16 4Q16 1Q17 2Q17 3Q17
Rev
enu
e ($
M U
SD)
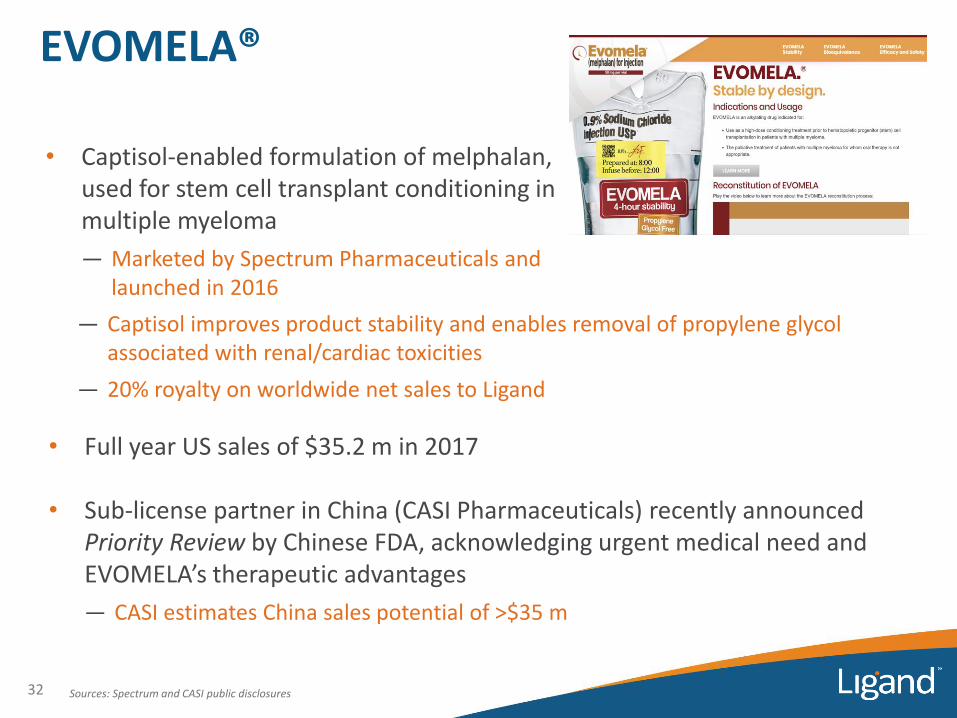
• Full year US sales of $35.2 m in 2017
• Sub-license partner in China (CASI Pharmaceuticals) recently announced Priority Review by Chinese FDA, acknowledging urgent medical need and EVOMELA’s therapeutic advantages
― CASI estimates China sales potential of >$35 m
32
EVOMELA®
• Captisol-enabled formulation of melphalan, used for stem cell transplant conditioning in multiple myeloma
― Marketed by Spectrum Pharmaceuticals and launched in 2016
Sources: Spectrum and CASI public disclosures
― Captisol improves product stability and enables removal of propylene glycol associated with renal/cardiac toxicities
― 20% royalty on worldwide net sales to Ligand
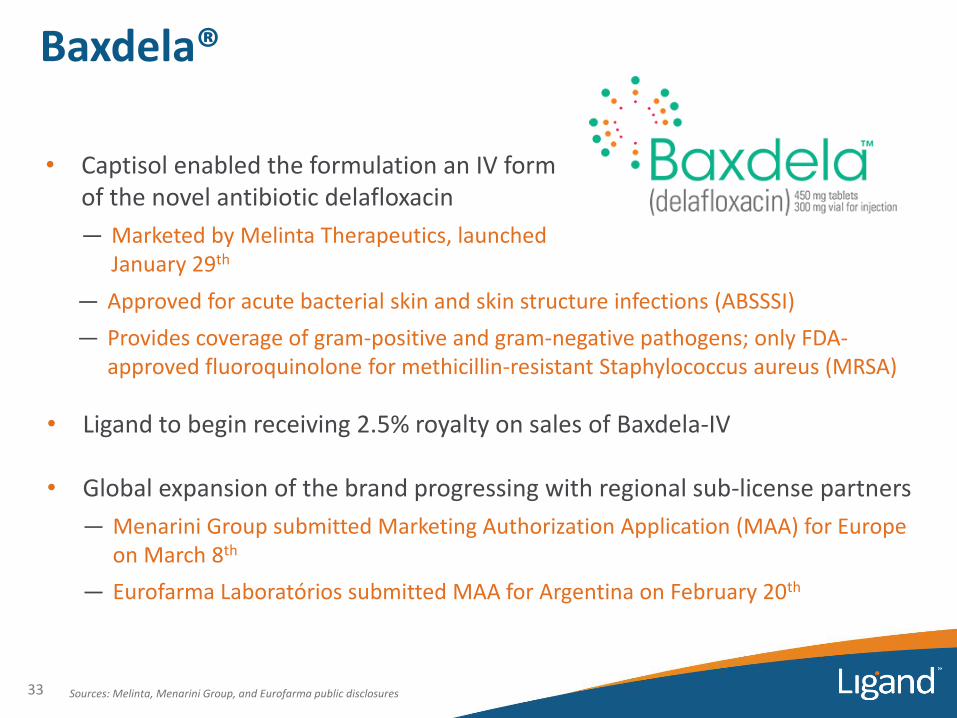
• Ligand to begin receiving 2.5% royalty on sales of Baxdela-IV
• Global expansion of the brand progressing with regional sub-license partners
― Menarini Group submitted Marketing Authorization Application (MAA) for Europe on March 8th
― Eurofarma Laboratórios submitted MAA for Argentina on February 20th
33
Baxdela®
• Captisol enabled the formulation an IV form of the novel antibiotic delafloxacin
― Marketed by Melinta Therapeutics, launched January 29th
Sources: Melinta, Menarini Group, and Eurofarma public disclosures
― Approved for acute bacterial skin and skin structure infections (ABSSSI)
― Provides coverage of gram-positive and gram-negative pathogens; only FDA-approved fluoroquinolone for methicillin-resistant Staphylococcus aureus (MRSA)
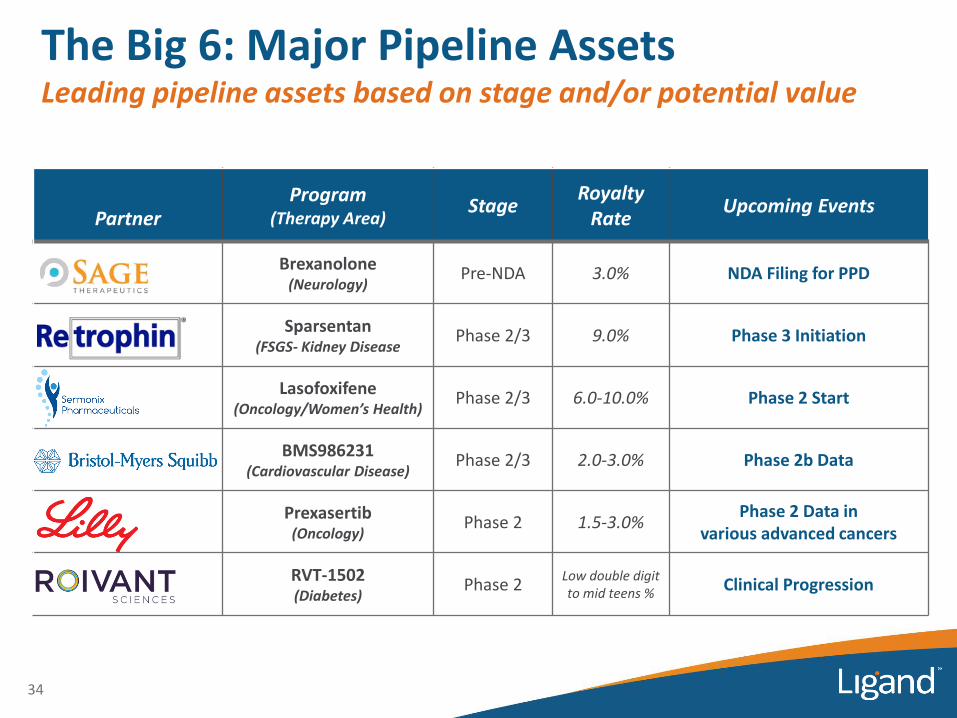
PartnerProgram
(Therapy Area)Stage
RoyaltyRate
Upcoming Events
Brexanolone(Neurology)
Pre-NDA 3.0% NDA Filing for PPD
Sparsentan(FSGS- Kidney Disease
Phase 2/3 9.0% Phase 3 Initiation
Lasofoxifene(Oncology/Women’s Health)
Phase 2/3 6.0-10.0% Phase 2 Start
BMS986231(Cardiovascular Disease)
Phase 2/3 2.0-3.0% Phase 2b Data
Prexasertib(Oncology)
Phase 2 1.5-3.0%Phase 2 Data in
various advanced cancers
RVT-1502(Diabetes)
Phase 2Low double digit to mid teens %
Clinical Progression
The Big 6: Major Pipeline AssetsLeading pipeline assets based on stage and/or potential value
34

• Glucagon is a hormone that stimulates the liver to produce glucose
— GRAs are designed to lower glucose levels
• Ligand discovered and initially developed a novel oral small molecule that potently binds to the glucagon receptor and competitively antagonizes the actions of glucagon
— Glucose reduction demonstrated by Ligand in animal models of both type 1 and type 2 diabetes
— Phase 1 and Phase 2 clinical trials managed by Ligand demonstrated favorable efficacy and safety profiles in patients with type 2 diabetes
• Global patents covering various forms of LGD-6972, if granted, would not be expected to expire until 2039
Glucagon Receptor Antagonist (GRA)Background
35 Reference WO 2015/191900

• Ligand and Roivant announced global licensing deal for Ligand’s GRA (now called RVT-1502) on March 6th
Glucagon Receptor Antagonist (GRA)Roivant/Metavant Partnership – RVT-1502
36
• Roivant is a privately-held company that has successfully established multiple subsidiary companies focused on distinct disease areas
— Raised >$2.7 Billion to fund clinical programs
• Roivant recently formed Metavant Sciences, focused on addressing significant unmet medical needs of patients with cardiometabolic disorders
• RVT-1502 to be a foundational program for Metavant
• Ligand received $20 m at signing, and is eligible to receive $528 m in milestone payments, and royalties ranging from low double digits to mid-teens

Internal R&D

Captisol-enabled IohexolLeveraging Captisol® Technology to Make Drugs Safer
38
• Captisol-enabled Iohexol has successfully completed preclinical studies and Ligand plans to progress into clinical development
• Patented uses of Captisol to reduce acute kidney injury (AKI) during medical interventions, including:
– Iodinated contrast agents: iohexol, iopamidol, iodixanol
– Anticancer agents: cisplatin, doxorubicin, methotrexate
– Aminoglycosides: gentamicin
• Recently established new program to develop Captisol-enabled, next generation contrast agents for diagnostic imaging

Iodinated Contrast AgentsMarket and Needs
39
The Global Imaging Agents Market (Report MCP-3336)Global Industry Analysts, Inc., September 2016
• Iohexol (OMNIPAQUE™, GE Healthcare) is the most widely-used injectable diagnostic contrast agent for X-ray imaging procedures
– Global sales >$500 M
– $250 M+ in US, ~30% market share
– No generic competition
– Reported incidence of contrast-medium induced nephropathy reported at 26% for Iohexal1
• 30 million imaging procedures/yr in the US
– Iodinated contrast agents represent >60% of all X-ray imaging agents sold (~$1.5 B market)
1 Aspelin, et al. New England Journal of Medicine 2003;348:491-9
“Acute Kidney Injury remains a concern for patients undergoing cardiac interventional procedures utilizing intravascular iodinated contrast”McCullough, J Am College of Cardiology 2016;68:1465-73
OMNIPAQUEVisipaque
Ultravist
Optitray
Hexabrix
$565 m
$96 m
$347 m
$341 m
$219 m
Iodinated Contrast Agents - US SalesSelected Agents

Captisol-enabled IohexolLeveraging Captisol Technology to Make Drugs Safer
40
• Potential for high Captisol use
– Estimated up to 10-15 metric tons annually
Rowe ES, et al. Journal of Neuroimaging 2016; 26(5):511-8
• Captisol-enabled Iohexol reduces renal pathologies in animal models
– Mean scores show >50% prevention of Iohexol-induced pathologies
• Selected as next product for internal development, based on:
1. Large number of patients affected globally
2. Lack of alternatives3. Established IP portfolio4. Potential for abbreviated
development and approval process
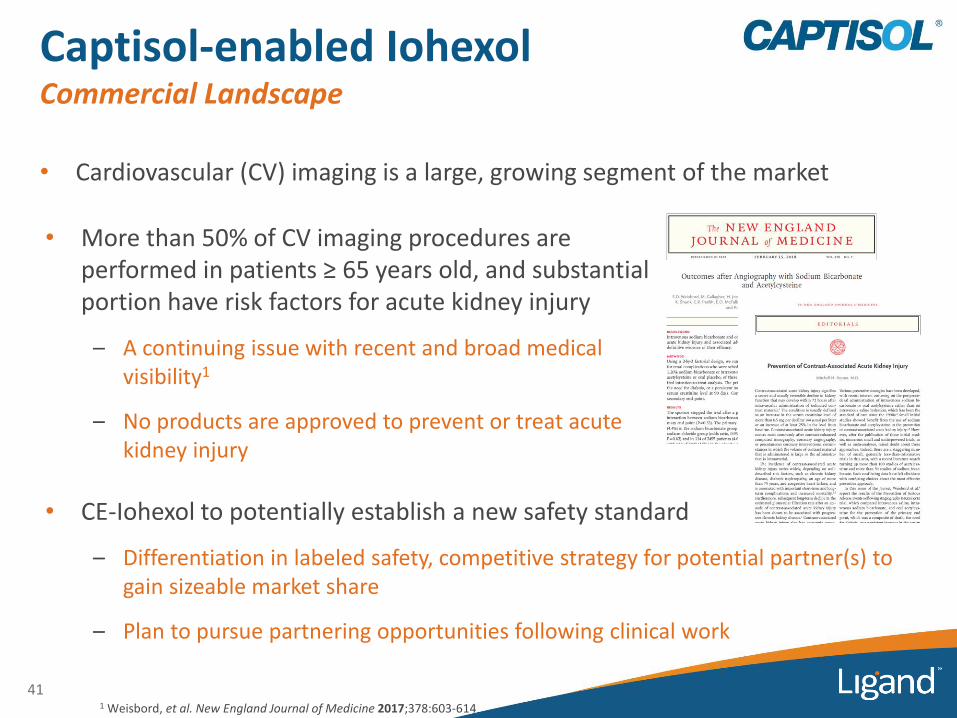
• Cardiovascular (CV) imaging is a large, growing segment of the market
41
Captisol-enabled IohexolCommercial Landscape
• More than 50% of CV imaging procedures are performed in patients ≥ 65 years old, and substantial portion have risk factors for acute kidney injury
– A continuing issue with recent and broad medical visibility1
– No products are approved to prevent or treat acute kidney injury
1 Weisbord, et al. New England Journal of Medicine 2017;378:603-614
• CE-Iohexol to potentially establish a new safety standard
– Differentiation in labeled safety, competitive strategy for potential partner(s) to gain sizeable market share
– Plan to pursue partnering opportunities following clinical work
Financial Overview and Outlook

$0
$30
$60
$90
$120
$150
$180
2012 2013 2014 2015 2016 2017 2018
Royalty Materials Milestone/License
Sustained Revenue Growth
$49
$65$72
$ M
illio
ns $109
43
• Consistent, strong annual revenue growth driven by:
— High royalty growth
— Increasing contribution from milestones
— Consistent contribution from material sales
• 2018 adjusted EPS would be approximately $4.85 with total revenue of $184 million
• Potential for additional $20 million of 2018 milestones
$31
$184+
Projected
$141
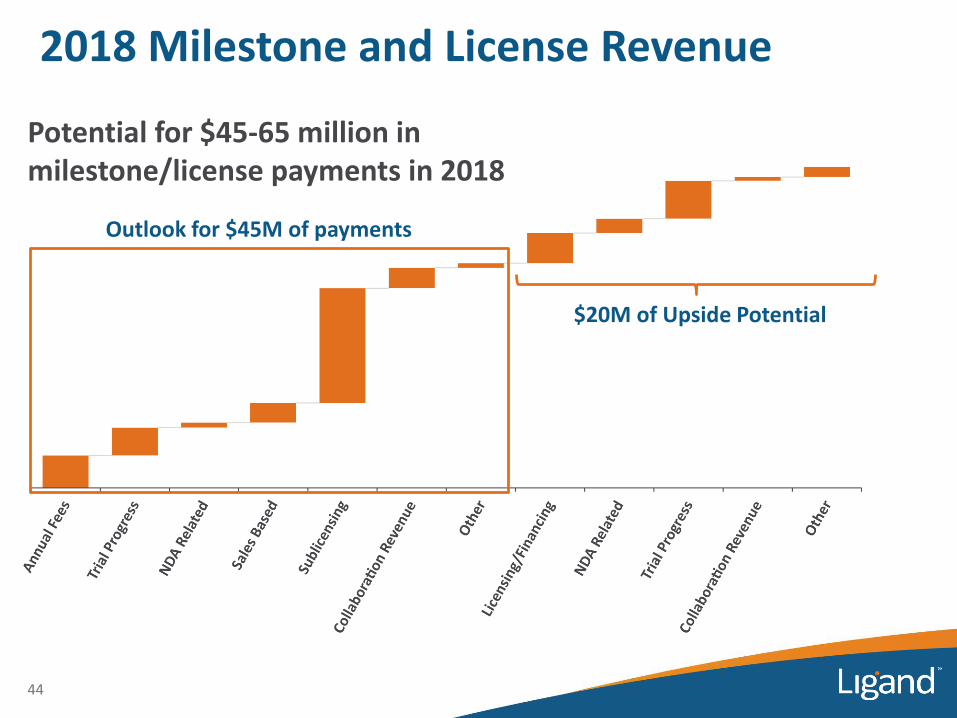
2018 Milestone and License Revenue
44
Outlook for $45M of payments
$20M of Upside Potential
Potential for $45-65 million in milestone/license payments in 2018

Reconciliation of GAAP EPS to Adjusted EPS
45
2017 GAAP Earnings Per Share $0.53
Stock-based compensation expense 1.06
Non-cash interest expense 0.49
Amortization related to acquisitions 0.78
Increase in contingent liabilities 0.11
Loss from Viking 0.09
Other (0.16)
Income tax effect of adjusted reconciling items (0.83)
Deferred tax asset adjustment 1.40
Excess tax benefit from stock-based compensation (0.20)
Valuation allowance release (0.18)
2019 Senior Convertible Notes share count adjustment 0.17
2017 Adjusted Earnings Per Share $3.26
GAAP Shares 23.48
Dilutive potential common shares issuable of redeemable convertible notes (1.21)
Adjusted Shares 22.27
Adjusted EPS guidance excludes stock-based compensation expense, non-cash debt-related costs, changes in contingent liabilities, transaction-related amortization, pro-rata net losses of Viking Therapeutics as well as fair value adjustments to our holdings in their common stock, convertible note receivable and warrants, mark-to-market adjustments for amounts owed to licensors, changes in contingent liabilities related to our CVRs, the excess convert shares covered by bond hedge and certain one-time non-recurring items
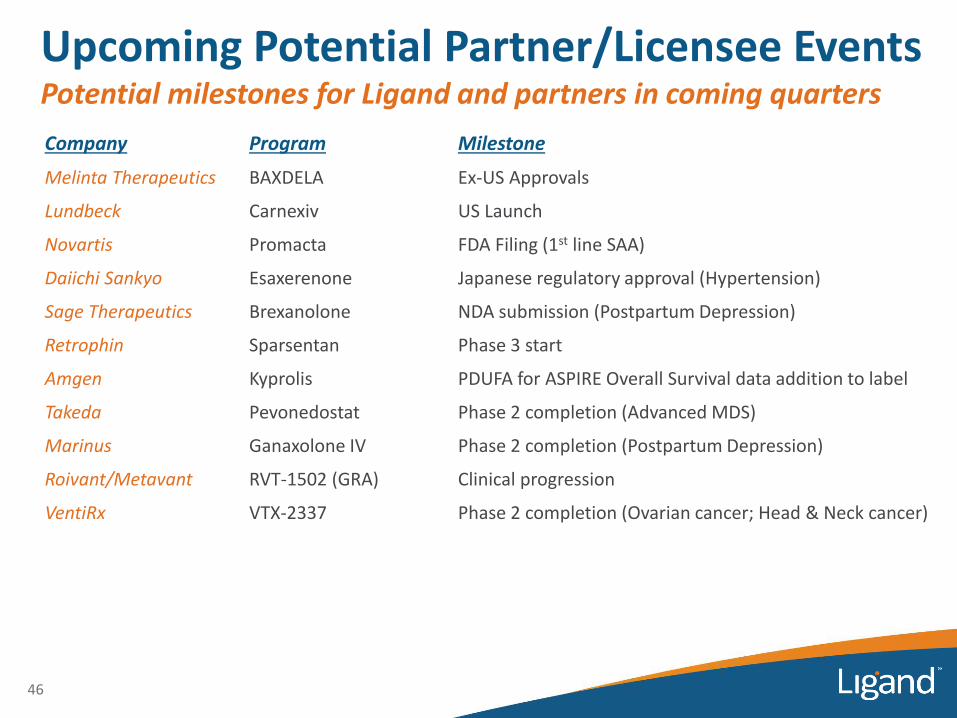
Upcoming Potential Partner/Licensee EventsPotential milestones for Ligand and partners in coming quarters
Company Program Milestone
Melinta Therapeutics BAXDELA Ex-US Approvals
Lundbeck Carnexiv US Launch
Novartis Promacta FDA Filing (1st line SAA)
Daiichi Sankyo Esaxerenone Japanese regulatory approval (Hypertension)
Sage Therapeutics Brexanolone NDA submission (Postpartum Depression)
Retrophin Sparsentan Phase 3 start
Amgen Kyprolis PDUFA for ASPIRE Overall Survival data addition to label
Takeda Pevonedostat Phase 2 completion (Advanced MDS)
Marinus Ganaxolone IV Phase 2 completion (Postpartum Depression)
Roivant/Metavant RVT-1502 (GRA) Clinical progression
VentiRx VTX-2337 Phase 2 completion (Ovarian cancer; Head & Neck cancer)
46

Upcoming Potential Partner/Licensee EventsPotential milestones for Ligand and partners in coming quarters
Company Program Milestone
Lilly Merestinib Phase 2 completion (Biliary Tract Cancer)
Lilly Prexasertib Phase 2 completion (Small Cell Lung Cancer)
Viking Therapeutics VK2809 Phase 2 completion (Hypercholesterolemia/NASH)
Viking Therapeutics VK2809 Phase 1 start (Glycogen Storage Disease Type Ia)
Aldeyra Therapeutics Reproxalap Phase 2 completion (Allergic Conjunctivitis)
CURx Pharma IV-Topiramate Phase 2 start (Epilepsy)
Sermonix Lasofoxifene Phase 2 start (Breast Cancer)
Bristol Meyers Squibb BMS-986231 Phase 2 completion (Heart Failure)
Precision Biologics NPC-1C Phase 1/2 completion (Pancreatic Cancer)
Aptevo Therapeutics APVO436 Phase 1 start (AML)
Vireo Health Cannabinoids IND for Captisol-enabled Formulations
47

Corporate Presentation
March, 2018
NASDAQ: LGND