corporate presentation - cdn.tcil.incdn.tcil.in/.../investors-presentation-fy-2014-15.pdf ·...
TRANSCRIPT

11
CORPORATE PRESENTATION

Cautionary Statement
Statements in this “Presentation” describing the Company’s objectives, estimates, expectations or
predictions may be “forward looking statements” within the meaning of applicable securities laws and
regulations. Actual results could differ materially from those expressed or implied. Important factors that
could make a difference to the Company’s operations include global and Indian demand supply conditions,
cyclical demand and pricing in the Company’s principal markets, changes in Government regulations, tax
regimes, economic developments within India and other factors. The Company assumes no responsibility to
publicly amend, modify or revise any forward looking statement, on the basis of any subsequent
development, information or events, or otherwise.

3
• Started as a ‘one man, one office, one truck’ company in 1958• India’s leading integrated supply chain and logistics solutions provider• Customer focused strategic diversification in value added areas of logistics and
transportation
Leadership Market Position
Best-in-Class Operations
Pan India Network
Strong IT Backbone
• Fleet of 9,000 owned and managed trucks/trailers/reefer vehicles• 10.5 MN sq. ft of warehousing space• Skilled work force of 6,500 personnel and 20,000 outsourced positions
• Strong distribution network provides access to large and growing aftermarket• 1,400 company owned branches nationwide, covering 99.5% of the GDP area and 17,000
locations within India and abroad.• Transporting 2.5% by value of India’s GDP
• In-house ERP: EDI Capable• Web-based “Track and Trace” through GPS
Heritage and Market Positioning

4
Listed Entity Rated and Certified
Corporate Social Responsibility
Engaged in areas of education, women & child health, disability alleviation and rural sports growth.
Non Discrimination Policy
• Regular conference calls and annual meet with shareholders and analysts• Timely and transparent disclosures through comprehensive annual reports and corporate presentations
(readily available on the Company’s website)
Corporate Governance
On-going Investor Outreach programs
5
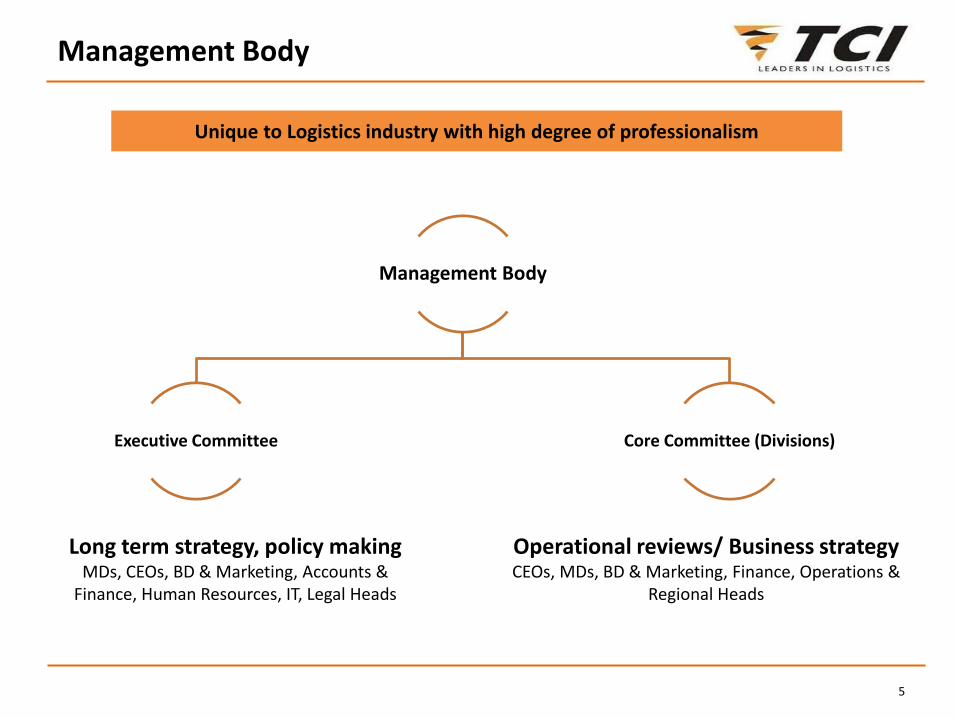
Management Body
Executive Committee Core Committee (Divisions)
Long term strategy, policy makingMDs, CEOs, BD & Marketing, Accounts &
Finance, Human Resources, IT, Legal Heads
Operational reviews/ Business strategyCEOs, MDs, BD & Marketing, Finance, Operations &
Regional Heads
Unique to Logistics industry with high degree of professionalism
Management Body

6
Name Designation
Mr. S M Datta Chairman (Non-executive independent director)
Mr. D P Agarwal Vice Chairman & Managing Director
Mr. S N Agarwal Non-executive director
Mr. O S Reddy Non-executive independent director
Mr. K S Mehta Non-executive independent director
Mr. Ashish Bharat Ram Non-executive independent director
Mrs. Urmila Agarwal Non-executive director
Mr. M P Sarawagi Non-executive director
Mr. Vineet Agarwal Managing Director
Mr. Chander Agarwal Jt. Managing Director
Board of Directors

7
DFC/Diamond
Quadrilateral
• Creation of additional dedicated rail freight capacity, • Will reduce unit cost of Transportation by speeding up freight train operations.• Increased bulk multi modal movement for improved productivity & efficiency• Will result in development of logistic Warehouses in the vicinity of Freight Corridor.
GST • Rationalizing the impact of taxes on Production, Distribution and Inventory management • Consolidation of warehouses and moving towards Hub-and-spoke model• Multi modal movement between Hubs
• With increased per capita disposable income, consumption driven sectors will grow• Sectors like Food services, e-commerce, consumable durables etc. will get a boost .
E-commerce driven growth
in consumption
• Growth in trend towards outsourcing of logistics in non traditional industries • Larger scope of outsourcing e.g. order processing, packaging, kitting etc. will go up
Increased outsourcing of
Logistics
Impact of Macro-economic changes on Logistics

8
GST-Key Implications on Warehouse & Transport Industry
Transportation
• Larger Warehouses and borderless movement of goods would leads to increased transportation lot sizes, multimodal movement
• Lesser border checks/paper work would lead to faster movement of trucks. Transit times and hence cost may shrink by 20-30%
Warehouse
• Network to be determined based on the ambit of Additional Tax.
• Network optimization efforts to commence
• Consolidation of warehousing to commerce.
• Emergence of hub and Spoke model
• Larger sizes of warehouses (hubs)
• Warehouses closer to manufacturing and/ or consumption areas.
GST
•Rationalizing the impact of taxes on Production, Distribution& Inventorymanagement•Consolidation of warehouses•Multi modal movement between Hubs
9
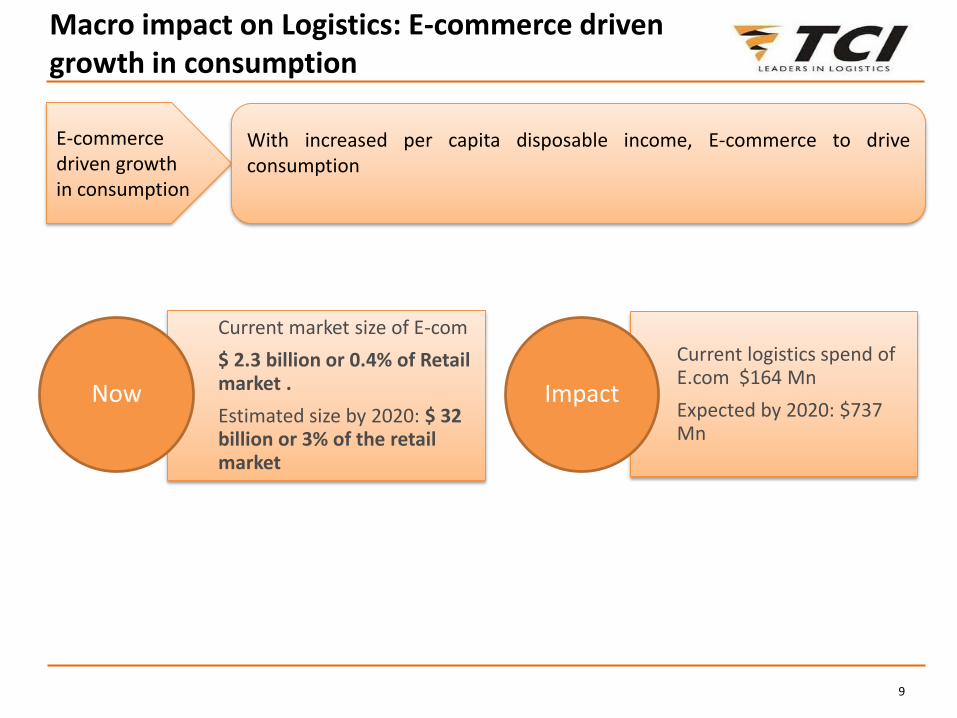
Macro impact on Logistics: E-commerce driven growth in consumption
E-commerce driven growth in consumption
With increased per capita disposable income, E-commerce to driveconsumption
Current market size of E-com
$ 2.3 billion or 0.4% of Retail market .
Estimated size by 2020: $ 32 billion or 3% of the retail market
Now
Current logistics spend of E.com $164 Mn
Expected by 2020: $737 Mn
Impact

10
TCI : Serving the Complete Ecommerce Chain
Customers
Companies
Consolidation
center
Warehouses
Dedicate &
SharedSuppliers
1. Marketplace
2. Inventory Based
1. At Supplier
i Supplier Coordination
ii Scheduling
iii Route optimization
2. Inventory / Marketplace / Cross Dock- FC
i Receipts and Bar Coding
ii Put away and Storage
iii Order processing on SLA
iv Sortation and Ship
v Return Shipment Management
Vi Return To Vendor
3. At Customer place
i Doorstep delivery
ii FOD
iii Reverse logistics
~ 200,000
units / day
~ 100,000
Orders / day~ 20,000
Deliveries / day

11
Industry Scenario
Mature, Fragmented, Low barriers to entry,
low cost
Growth, niche, high entry barriers, cost
efficiency
Nascent, knowledge based, very high
barriers, single window
Growth, high entry barriers, low cost
Industry Growth
5-8% 8-12% 15-20% 10-15%
% of Total Revenues
(FY 14-15)
37%
(811 cr.)
30%
(659 cr.)
28%
(612 cr.)
5%
(113 cr.)
TCI EBIDTA Margins
3-5% 8-10% 10-12% 25-30%
Rev. Growth CAGR 5 Yrs.
- 9.4% 11.7% 12.9%
ROCE (5-yr Average)
11% 46% 25% 17%
ROCE (10-yr Average)
15% 40% 23% 19%
Industry Dynamics and SBU Snapshot

12
• One of India’s premier organized freight services provider with pan India presence
• Around 2400 trucks and trailers, both owned and leased, provide freight movement services on a daily basis
Over Dimensional Cargo
Provides logistics solutions for over dimensional, bulk and heavy cargo
Project management
Own hydraulic axles and trailers
Rail
Provides different types of services such as containers, wagons and special automotive wagons
Road
Provides full truck load (FTL), less than truck load (LTL) and parcel services
600 owned offices
Large client base with a strong Key Account Management system
TCI Freight Division

13
51% equity stake
Container Corporation of India Ltd
49% equity stake Potential Benefits
• Integration of rail and road cargo movement• Establishing synergy between two rail and road giants• JV company provides end to end multi modal solutions• Providing ideal mix of cost & speed• Total Paid up Equity- Rs 7 Cr • FY 2014-15 Net Revenues- RS. 77.7 Cr. and Net Profit of RS.
0.5 Cr.
Multi-modal Logistics JV

14
Revenues 810.6 4.8 773.5
EBDITA 21.4 58.3 13.5
EBITDA Margin % 2.6 1.7
PBIT 12.6 142.3 5.2
Capital Employed 194.7 5.9 183.8
2014-15
(Audited)
% increase over
last year
2013-14
(Audited)
Division’s share in overall business consistently reducing
Share in total Revenue
46% 43% 40% 38% 37%
FY 2010-11 FY 2011-12 FY 2012-13 FY 2013-14 FY 2014-15
Outlook:
• Projected growth of around 5-10% with better economic conditions
• Focusing on high margin sundry and LTL business and better capacity utilization
Rs. In Crores
TCI Freight Division: Financials

15
• The division provides express door-to-door service for time sensitive and high value documents and parcels
• Operates through dedicated vendors
• 10% business is through air cargo
• Growing in both B2B and B2C part of e-commerce business
Domestic & International
13000 locations in India & 200 countries
Air (chartered space from Airlines)
Surface: Road & Rail
Value Added Services
Diplomat (non service location) Delivery
Holiday Service
Freight on Delivery
Money back guarantee scheme
USP
Packages: 5-50 KGs.
Air cargo: all dimensions
Well positioned hubs
Key Account Management system
TCI XPS Division

16
Revenues 658.9 9.8 600.2
EBDITA 51.9 7.6 48.3
EBITDA Margin % 7.9 8.0
PBIT 45.9 4.6 43.9
Capital Employed 105.0 14.0 92.1
2014-15
(Audited)
% increase over
last year
2013-14
(Audited)Rs. In Crores
Outlook
• Business growth projected at 15%-20% with increased focus on ecommerce, high consumption driven sectors
• Focusing on improvements in operating margins by better capacity utilization and services automation
TCI XPS Division: Financials
17
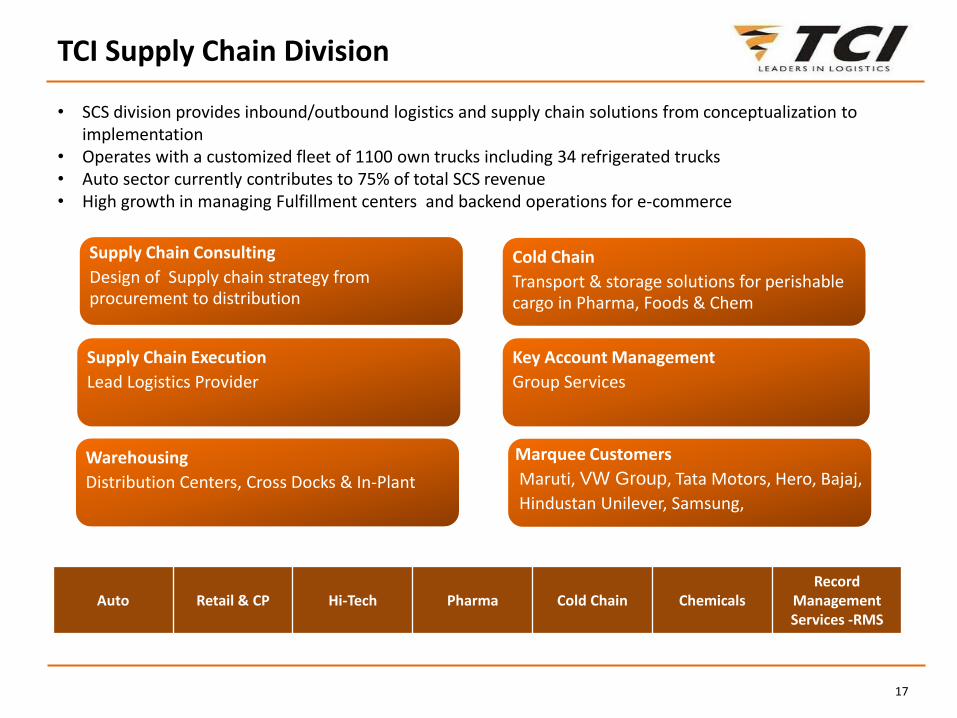
Auto Retail & CP Hi-Tech Pharma Cold Chain ChemicalsRecord
ManagementServices -RMS
Supply Chain Consulting
Design of Supply chain strategy from procurement to distribution
Supply Chain Execution
Lead Logistics Provider
Warehousing
Distribution Centers, Cross Docks & In-Plant
Cold Chain
Transport & storage solutions for perishable cargo in Pharma, Foods & Chem
Key Account Management
Group Services
Marquee Customers
Maruti, VW Group, Tata Motors, Hero, Bajaj,
Hindustan Unilever, Samsung,
• SCS division provides inbound/outbound logistics and supply chain solutions from conceptualization to implementation
• Operates with a customized fleet of 1100 own trucks including 34 refrigerated trucks• Auto sector currently contributes to 75% of total SCS revenue • High growth in managing Fulfillment centers and backend operations for e-commerce
TCI Supply Chain Division

18
49% equity stake
Mitsui & Co. Ltd
51% equity stake
Synergy with TCI
• Lead logistics partner for Toyota Kirloskar Motors Ltd. and for other Japanese auto companies in India
• Complete logistics solutions from inbound to outbound transportation across India and abroad
Automotive Logistics JV

19
Revenues 611.8 13.2 540.4
EBDITA 64.8 19.8 54.1
EBITDA Margin % 10.6 10.0
PBIT 37.4 18.0 31.7
Capital Employed 163.6 0.4 162.8
2014-15
(Audited)
% increase over
last year
2013-14
(Audited)Rs. In Crores
Outlook
• Planned growth of 20+% with improvement in auto retail and economy in general
• Aims to be significant player in warehousing in Apparel, Retail, FMCG and E-commerce
• Significant pipeline of potential contracts in all verticals
TCI Supply Chain Division: Financials
20
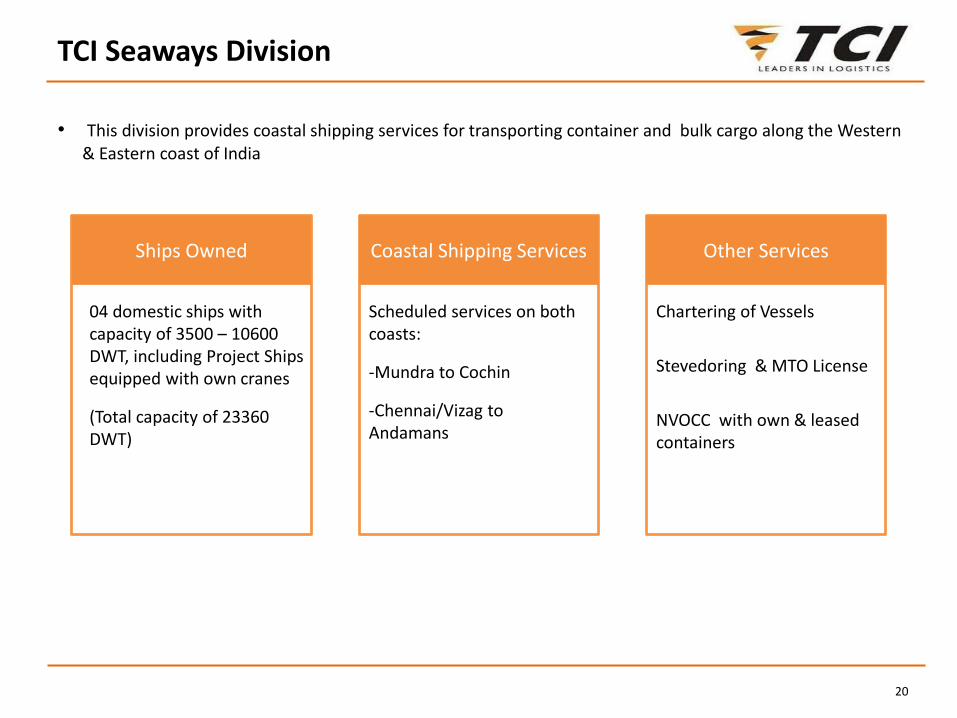
Ships Owned
04 domestic ships with capacity of 3500 – 10600 DWT, including Project Ships equipped with own cranes
(Total capacity of 23360 DWT)
Coastal Shipping Services
Scheduled services on both coasts:
-Mundra to Cochin
-Chennai/Vizag to Andamans
Other Services
Chartering of Vessels
Stevedoring & MTO License
NVOCC with own & leased containers
• This division provides coastal shipping services for transporting container and bulk cargo along the Western & Eastern coast of India
TCI Seaways Division

21
Revenues 112.9 5.3 107.2
EBDITA 33.7 16.1 29.0
EBITDA Margin % 29.9 27.1
PBIT 28.6 16.7 24.5
Capital Employed 156.0 88.6 82.7
2014-15
(Audited)
%increase over
last year
2013-14
(Audited)Rs. In Crores
• 1 Dry-dock in H-1 took place in Q1/FY 15.• Two ships were added in the year 2014-15 with a DWT of 15362.
Outlook
• West coast service to stabilize and grow• Increasing awareness of coastal service as a multi modal option
TCI Seaways Division: Financials

22
Cumulative capacity 11.50 MW 11.50 MW 11.50 MW 11.50 MW 11.50 MW
Capital Employed 39.9 37.4 34.6 31.1 29.6
EBIDTA 5.2 6.0 6.3 5.8 5.0
Rs. In Lacs2010-11
(Audited)
2011-12
(Audited)
2012-13
(Audited)
2013-14
(Audited)
2014-15
(Audited)
Energy division
Global division
• TCI Global’s new initiative to target international business through subsidiaries • Two Operating International JVs in Indonesia and Nigeria. • Activities undertaken: Local Distribution and Mining Logistics.
Other Divisions
Rs. In Crores

23
Standalone Revenue Mix : Share of XPS & SCS is rising
Divisional Performance
50% 46% 43% 40% 38% 37%
27%26%
27%28% 30% 30%
17% 22% 25% 27% 27%28%
4% 4% 5% 5% 5% 5%2% 2% 1% 1% 1% 1%
7.7%
7.8%
8.1%
7.7%7.6%
8.3%
7.0%
7.5%
8.0%
8.5%
0%
20%
40%
60%
80%
100%
FY10 FY11 FY12 FY 13 FY14 FY15
Freight XPS SCS Seaways Others EBIDTA Margin

24
Income Statement
Notes: Increase in share capital includes 24 lacs equity share issued to IDFC Premier Equity Fund at price of 249/- for Rs. 5976 lacs
Standalone & Consolidated results
Particulars (Rs in Cr.) 2013-14 2014-152014-15(Cons)
Freight 1907.62 2050.01 2265.19
Other Sales & Services 119.65 146.74 151.53
Other Income 5.72 12.38 9.06
Total Income 2032.99 2209.13 2425.78
Revenue growth % 3.90% 8.66% 8.51%
Operating expenses 1641.19 1764.78 1947.74
Other expenses 236.75 261.61 275.83
Total Expenses 1877.93 2026.39 2223.57
EBITDA 155.05 182.74 202.21
EBITDA Margin % 7.63% 8.27% 8.33%
Interest Expense 29.67 31.91 33.32
Depreciation 42.43 49.46 54.51
Exceptional Item 0.00 0.17 0.18
PBT 82.95 101.20 114.20
PBT Margin % 4.08% 4.58% 4.70%
Taxes 20.93 25.25 32.58
PAT 62.02 75.95 81.62
PAT Margin % 3.05% 3.44% 3.36%
Particulars (Rs in Cr.) 2013-14 2014-152014-15(Cons)
1. Shareholders FundsShare Capital 14.59 15.13 15.13Reserves & Surplus(Excl. Rev. res) 427.49 559.84 601.77
Minority Interest 0.00 0.00 3.452. Non Current Liabilities
Long term Borrowings 35.64 73.45 77.84Deferred tax Liabilities (net) 32.70 28.48 29.26Other long term liabilities & Provisions 0.00 0.00 0.20
3. Current LiabilitiesShort term borrowings 222.87 197.53 205.80
Trade payables 63.19 69.30 86.96Other current liabilities 60.68 53.31 54.28Short term provisions 35.87 48.29 50.92
TOTAL 893.03 1045.33 1125.611. Non current Assets
Fixed Assets 387.38 470.66 513.71
Goodwill on consolidation 0.00 0.00 0.22Exchange fluctuation on consolidation 2.43Non current Investments 45.17 44.40 7.21Long term loans and advances 35.40 40.71 40.71
Other non current assets 0.75 2.64 2.64
2. Current AssetsInventories 1.70 2.28 2.28Trade Receivables 346.08 393.84 434.56Cash & cash equivalents 17.25 16.51 42.12
Short term loans and advances 58.85 73.02 78.46Other current assets 0.45 1.27 1.27
TOTAL 893.03 1045.33 1125.61
Balance Sheet

25
Owing to Top ratings from Credit Agencies, good financial discipline and high creditworthiness, TCI’s average interest cost is below 10.00%
Debt – Equity Ratio Earnings per Share (in Rs)
Financial Performance
0.860.88
1.00
0.930.85
0.690.54
0
0.2
0.4
0.6
0.8
1
1.2
3.915.93
7.07 7.137.13
8.5110.50
Debt Service Coverage Ratio Times 1.80 2.31
Return on Capital Employed % 14.62 15.71
UOM 2013-14 2014-15

26
Hub Centers & Small warehouses 55.6 41.6 260.2 166.8
Wind power 0.0 0.0 9.0 0.0
Ships & Containers 0.6 77.6 151.5 2.2
Trucks 22.5 20.7 240.7 80.0
Others (W/H Equp., IT etc.)
6.1 12.6 77.1 26.0
Total 84.8 152.5 738.5 275.0
2013-14
Actual
2014-15
Actual
Total Actual
(FY 2006-07 to 2014-15)
2015-16
Proposed
Rs. In Crores
Funding Pattern:
Sources of finance for the Capex in FY 2015-16
Rs. In Crores
FY 2015-16 200 75 275
Debt Internal Accrual Total
Capital Expenditure Plan

27
Market Summary
Market Summary (Rs In Crore)
Market Cap as on 31st Mar`15 1972
Debt 307
Enterprise Value 2262
P/E 25.2
EV/EBITDA 12.4
52 Week High 290.6
52 Week Low 106.0
Consistent Dividend track trend
67%16%
5% 4%
5%
3%
Shareholding Pattern as on 31st Mar 2015
PROMOTORS
INDIAN PUBLIC
FOREIGN HOLDINGS
BODY CORPORATE
MUTUAL FUND
OTHERS
30%
40%45%
50% 50%
65%
75%
18% 16% 15% 16% 16% 18% 18%
-10%
5%
20%
35%
50%
65%
80%
FY09 FY10 FY11 FY12 FY 13 FY14 FY15
Dividend Ratio Dividend Payout Ratio

28
Growth Drivers • TCI XPS & TCI SCS continue to be main growth drivers.
Cost Drivers
• Economies of scale• Operational efficiency key to maintain cost control• Receivables management
Macro Drivers
• Economic reforms, Implementation of GST and infrastructure investment: Logistics sector to be in higher trajectory.
• Ambitious Capex and expansion plans in current fiscal
Future Outlook

THANK YOU