corporate presentation - fy19 - idfc first bank...with the capital adequacy norms prescribed by the...
TRANSCRIPT

Corporate Presentation - FY19
This presentation has been prepared by and is the sole responsibility of IDFC FIRST Bank (together with its subsidiaries, referred to as the “Company”). By accessing this presentation, you are agreeing to be bound by the trailing restrictions. This presentation does not constitute or form part of any offer or invitation or inducement to sell or issue, or any solicitation of any offer or recommendation to purchase or subscribe for, any securities of the Company, nor shall it or any part of it or the fact of its distribution form the basis of, or be relied on in connection with, any contractor commitment therefore. In particular, this presentation is not intended to be a prospectus or offer document under the applicable laws of any jurisdiction, including India. No representation or warranty, express or implied, is made as to, and no reliance should be placed on, the fairness, accuracy, completeness or correctness of the information or opinions contained in this presentation. Such information and opinions are in all events not current after the date of this presentation. There is no obligation to update, modify or amend this communication or to otherwise notify the recipient if information, opinion, projection, forecast or estimate set forth herein, changes or subsequently becomes inaccurate. Certain statements contained in this presentation that are not statements of historical fact constitute “forward-looking statements.” You can generally identify forward-looking statements by terminology such as “aim”, “anticipate”, “believe”, “continue”, “could”, “estimate”, “expect”, “intend”, “may”, “objective”, “goal”, “plan”, “potential”, “project”, “pursue”, “shall”, “should”, “will”, “would”, or other words or phrases of similar import. These forward-looking statements involve known and unknown risks, uncertainties, assumptions and other factors that may cause the Company’s actual results, performance or achievements to be materially different from any future results, performance or achievements expressed or implied by such forward-looking statements or other projections. Important factors that could cause actual results, performance or achievements to differ materially include, among others: (a) material changes in the regulations governing our businesses; (b) the Company's inability to comply with the capital adequacy norms prescribed by the RBI; (c) decrease in the value of the Company's collateral or delays in enforcing the Company's collateral upon default by borrowers on their obligations to the Company; (d) the Company's inability to control the level of NPAs in the Company's portfolio effectively; (e) certain failures, including internal or external fraud, operational errors, systems malfunctions, or cyber security incidents; (f) volatility in interest rates and other market conditions; and(g) any adverse changes to the Indian economy. This presentation is for general information purposes only, without regard to any specific objectives, financial situations or informational needs of any particular person. The Company may alter, modify, regroup figures wherever necessary or otherwise change in any manner the content of this presentation, without obligation to notify any person of such change or changes.
Disclaimer
2

Table of Contents
12
18
28
32
21
SECTION 2: PATH AHEAD
SECTION 5: LIABILITIES
SECTION 4: ASSETS
SECTION 6: FINANCIALS
SECTION 3: PERFORMANCE HIGHLIGHTS
35 SECTION 7: DIRECTORS & SHAREHOLDERS
4 SECTION 1: FOUNDING OF IDFC FIRST BANK
SECTION 1: The Founding
of IDFC FIRST Bank

The Founding of IDFC FIRST Bank.. SECTION 1: FOUNDING OF IDFC FIRST BANK
5
IDFC FIRST Bank is founded by the merger of Erstwhile IDFC Bank and Erstwhile Capital First on December 18, 2018.

The Founding of IDFC FIRST Bank..
IDFC Limited was set up in 1997 to finance infrastructure focusing primarily on project finance and mobilization of capital for private sector infrastructure development. Whether it is financial intermediation for infrastructure projects and services, whether adding value through innovative products to the infrastructure value chain or asset maintenance of existing infrastructure projects, the company focused on supporting companies to get the best return on investments. The Company’s ability to tap global as well as Indian financial resources made it the acknowledged experts in infrastructure finance.
Dr. Rajiv Lall joined the company in 2005 and successfully expanded the business to Asset Management, Institutional Broking and Infrastructure Debt Fund. He applied for a commercial banking license to the RBI in 2013. Owing to his efforts, in 2014, the Reserve Bank of India (RBI) granted an in-principle approval to IDFC Limited to set up a new bank in the private sector. Thus Erstwhile IDFC Bank was created by demerger of the infrastructure lending business of IDFC to IDFC Bank in 2015. The parent entity, IDFC Limited, retained businesses of AMC, Institutional Broking and Infrastructure Debt Fund business through IDFC Financial Holding Company Limited (NOFHC).
The shares of Erstwhile IDFC Bank Limited were listed in the exchanges in November 2015. During the subsequent three years, the bank developed a strong and robust framework including strong IT capabilities and infrastructure for scaling up the banking operations. The Bank designed efficient treasury management system for its own proprietary trading, as well as for managing client operations. The bank diversified from being a predominantly infrastructure financier to wholesale banking operations. Since a large portion (90%) of the bank was wholesale (infrastructure and corporate loans) as a legacy from IDFC Limited until 2017, the company swiftly put together a strategy to retailise its loan book. Retail required specialised skills for the marketplace, seasoning, and scale for profitability, the Bank was looking for a retail lending partner who already had scale, profitability and specialized skills, to merge with.
6
As part of its strategy to diversify its loan book from infrastructure, the bank was looking for a merger with a retail finance institution with adequate scale, profitability and specialized skills.
EVENTS LEADING TO THE MERGER in January 2018- At IDFC Bank side.
SECTION 1: FOUNDING OF IDFC FIRST BANK

The Founding of IDFC FIRST Bank.. Contd.
Around the same time (2010-2017), while these events were playing out at IDFC Group, certain events were playing out in parallel at Capital First. Mr Vaidyanathan who had built ICICI Bank’s Retail Banking business from 2000-2009 and was the MD and CEO of ICICI Prudential Life Insurance Company in 2009-10, quit the group for an entrepreneurial foray.
During 2010-11, he acquired a significant stake in a listed real-estate financing diversified NBFC and then prepared the ground for a Leveraged Management Buyout of the firm by launching retail financial businesses for small entrepreneurs and consumers. He built a technology-driven retail loan book of Rs. 770 Cr by March 2011, and presented this as proof of concept to global private equity players for a management Buyout. Meanwhile, he exited non-core businesses like retail equity broking, Foreign Exchange Business, and other unrelated business.
In 2012, he concluded India’s largest Management Buyout by securing equity backing of Rs. 810 Crores from Warburg Pincus, got fresh equity into the company and founded Capital First as a new entity with new shareholders, new Board, new business lines, and fresh equity infusion.
Between March 31, 2010 to March 31, 2018, the Company’s Retail Assets under Management increased from Rs. 94 crores to Rs. 25,243 Cr. The company financed seven million customers through new age technology models. The credit rating increased from A+ to AAA. The Gross and Net NPA reduced from 5.28% and 3.78% respectively to 2% and 1% respectively and the asset quality remained consistently high. Further, the company turned around from losses of Rs. 30 crores and Rs. 32 crores in FY 09 and FY 10 respectively, to Rs. 327 crores by 2018, representing a 5 year CAGR increase of 39.5%. The loan assets grew at a 5 year CAGR of 29%. The ROE steadily rose from 2.5% in 2013 to near 15%. The market cap of the company increased ten-fold from Rs. 780 crores on in March 2012 at the time of the LBO to over Rs. 7800 crores in January 2018 at the time of announcement of the merger. Funding could be a constraining factor, so the company was looking out for a banking license.
7
Capital First, in the meanwhile, was on the lookout for a commercial banking license in order to access large pool of funds for growth and to access low cost of funds.
EVENTS LEADING TO THE MERGER in January 2018- At Capital First side
SECTION 1: FOUNDING OF IDFC FIRST BANK

The Founding of IDFC FIRST Bank
The Competition Commission of India approved the transaction in March 2018. The Reserve bank approved the transaction in June 2018.
Shareholders of IDFC Bank approved the merger with an overwhelming 99.98% votes in favour. Capital First shareholders too approved the merger with an equally overwhelming approval rate of 99.9%. Such overwhelming approval rates for a merger were unprecedented for merger of listed companies in India.
This was also the first merger between an NBFC and a commercial Bank. Mr. Vaidyanathan, who was the Chairman of Capital First prior to the merger, was appointed the first Managing Director and CEO of the new combined Bank, IDFC FIRST Bank.
8
Thus, IDFC FIRST Bank was founded as a new entity by the merger of IDFC Bank and Capital First on December 18 2018.
In January 2018, IDFC FIRST Bank and Capital First announced that they had reached an understanding to merge with each other and shareholders of Capital First were to be issued 139 shares of the merged entity for every 10 shares of Capital First.
SECTION 1: FOUNDING OF IDFC FIRST BANK

IDFC Bank – Financial Trends leading to the merger
445
2,094
5,710 6,426
Mar-16 Mar-17 Mar-18 Sep-18
CASA Deposits (Rs Cr)
2.0% 2.1%
1.7% 1.9%
FY16 FY17 FY18 H1FY19
Net Interest Margin (%)
13,633
14,678
15,257
14,776
Mar-16 Mar-17 Mar-18 Sep-18
Networth (Rs Cr)
*The bank took one-time provisions relating to stressed infrastructure loans. Without such one-time charge off, the PAT for H1 FY19 would be Rs. 81 Cr
9% 26% 20% 15%
90%
70% 69% 72% 1%
4% 11% 13%
53,903
70,248 73,055
75,337
Mar-16 Mar-17 Mar-18 Sep-18
Loan Assets (Rs Cr)
Others Wholesale Retail
407
1,020 859
(167)*
FY16 FY17 FY18 H1FY19
Profit After Tax (Rs Cr)
6.0%
7.2%
5.7%
(2.2%)*
FY16 FY17 FY18 H1FY19
RoE %
9
SECTION 1: FOUNDING OF IDFC FIRST BANK

Capital First – Financial Trends leading to the merger
26% 19% 16% 14% 7% 6% 9%
74% 81% 84% 86%
93%
94%
91%
7,510 9,679
11,975
16,041
19,824
26,997
32,622
Mar 13 Mar-14 Mar-15 Mar-16 Mar-17 Mar-18 Sep-18
Assets Under Management (Rs Cr)
Retail
Wholesale
961 1,172
1,574 1,704
2,304
2,618 2,928
Mar 13 Mar-14 Mar-15 Mar-16 Mar-17 Mar-18 Sep-18
Net Worth (Rs Cr)
4.86% 5.35%
6.57%
7.63%
9.02% 9.60%
8.01%
FY13 FY14 FY15 FY16 FY17 FY18 H1 FY19
NIM (%)
358 422 659
992
1,640
2,430
1,297
FY13 FY14 FY15 FY16 FY17 FY18 H1 FY19
Total Income (Rs Cr)
63 53
114
166
239
327
206
FY13 FY14 FY15 FY16 FY17 FY18 H1 FY19
Profit After Tax (Rs Cr)
7.04%
4.93%
8.33%
10.14%
11.93% 13.31%
14.87%
FY13 FY14 FY15 FY16 FY17 FY18 H1 FY19
RoE (%)
10
SECTION 1: FOUNDING OF IDFC FIRST BANK
Note: Figures for Sep 18 and H1FY19 are under Ind-AS and for prior periods, it is under previous Indian GAAP

SECTION 2: PATH AHEAD

Disclaimer
Certain statements contained in this presentation that are not statements of historical fact constitute “forward-looking statements.” You can generally identify forward-looking statements by terminology such as “aim”, “anticipate”, “believe”, “continue”, “could”, “estimate”, “expect”, “intend”, “may”, “objective”, “goal”, “plan”, “potential”, “project”, “pursue”, “shall”, “should”, “will”, “would”, or other words or phrases of similar import. These forward-looking statements involve known and unknown risks, uncertainties, assumptions and other factors that may cause the Company’s actual results, performance or achievements to be materially different from any future results, performance or achievements expressed or implied by such forward-looking statements or other projections. (for Full text of disclaimer please refer to page 2)
SECTION 2: PATH AHEAD
12

IDFC FIRST BANK - Path Ahead
• Strong Systems and Processes
• Launched retail liability operations. Opened 200 bank branches (Dec 18), raised retail CASA of Rs. 2,800 crores (Dec 18).
• Built efficient Treasury Management Systems
• Strong presence in Corporate and Infrastructure financing
• Launched contemporary payment systems, internet and mobile banking
• Launched retail lending businesses successfully
• Strong Retail Franchise in niche segments with strong credit skills
• Track record of continuous growth
• Expanded to more than 220 locations across India supported by 102 branches
• Consistently increasing Profitability (5 year CAGR 39%) and high ROE (15%)
• High Asset quality across cycles including increasing interest rate, Demonetisation and GST
• Customer base of over seven million and 4 million live customers
• Strong Loan assets of more than Rs. 104660 Cr
• 34.62% of loans in retail segment
• Margins increased from 1.7% on standalone to 3.3% post merger
• Diversified asset profile
• Strong platform to grow retail deposits and CASA
• A large retail customer base of more than 70 lacs live customers including 30 lacs rural customers
SECTION 2: PATH AHEAD
13

Asset Strategy
• Growth of Assets:
• The Bank plans to grow the retail asset book from Rs. 36,236 Cr (December 31, 2018) to over Rs. 100,000 Cr in the next 5-6 years
• The Bank plans to reduce the loans to infrastructure segments ( Rs. 22,710 as of 31 December 2018) as they mature.
• For the Non-Infra Corporate Loans, the bank will continue to grow the loan book, based on opportunities available in the marketplace. The bank does not intend to have a specific target on this count.
• Diversification of Assets: The loan book of the bank needs to be well diversified across sectors and a large number of consumers. As of December 31, 2018, the retail book contributes to 34.62% of the total funded assets. The Bank plans to increase the retail book composition to more than 70% in the next 5-6 years
• Gross Yield Expansion: As a result of the growth of the retail loan assets (at a relatively higher yield compared to the wholesale loans), the gross yield of the Bank’s Loan Book is planned to increase from 9.2% (as per Q2-FY19 published financials, before the merger) to ~ 12% in the next 5-6 years. The bank will expand Housing loan portfolio as one of its important product lines.
1 SECTION 2: PATH AHEAD
14

Liability Strategy
• CASA Growth: The key focus of the Bank would be to increase the CASA Ratio from 10.3% as of December 31, 2018 on a continuous basis year on year and strive to reach 30% CASA ratio with in the next 5-6 years, as well as set a trajectory to reach a CASA ratio of 40-50% there on. Array of digital savings & current accounts are to be offered to the customer base (more than 7 million customers) of Erstwhile Capital First.
• Diversification of Liability: Diversification of Liabilities in favour of the retail deposit (including CASA and Retail Term Deposits) is essential for the bank. As a percentage of the total borrowings, the Retail Term Deposits and CASA is proposed to increase from 10.5% as of December 31, 2018, to over 50% in the next 5-6 years and set up a trajectory to reach 75% thereafter.
• Branch Expansion: In order to grow Retail Deposits and CASA, the bank plans to set up 600-700 more bank branches in the next 5-6 years from the current branch count of 206. This would be suitably supported by the attractive product propositions and other associated services as well as cross selling opportunities.
2 SECTION 2: PATH AHEAD
15

Profitability
• Net Interest Margin: As the retail asset contribution moves towards 70% of the total fund assets, it is planned that the gross yield will continuously increase. Coupled with lower cost of funds (From improved CASA ratio), it is planned to expand NIM to about 5.0% - 5.5% in the next 5-6 years.
• Cost to Income: The Bank plans to improve C:I ratio to ~50-55% over the next 5-6 years, down from ~80% (post merger results, Quarter ended December 31, 2018)
• ROA and ROE: With the improvement in the NIM and cost to income ratio, the bank aims to reach the following benchmarks in the next 5-6 years.
• ROA of 1.4%-1.6%
• ROE of 13%-15%
3 SECTION 2: PATH AHEAD
16

SECTION 3: PERFORMANCE
HIGHLIGHTS

Snapshot of Key Parameters (As of 31 March 2019)
SECTION 3: PERFORMANCE HIGHLIGHTS
Rs. 1,10,400 Cr
Funded Assets
37%
Retail Assets/Total Funded Assets
Rs. 140,462 Cr
Borrowing & Deposits
12.9%, 6.5%
CASA Ratio (as % of Total Deposit, as % of Total
Borrowing & Deposits)
Rs. 18,159 Cr
Net Worth-Standalone
2.4%, 1.3%
GNPA, NNPA
242
No. of Bank Branches
15.5%
Capital Adequacy ratio
18

Snapshot of Financial Performance for the Quarter (For Q4 2019)
• The Net Interest Income for the quarter ended on 31 March 2019 was Rs. 1,113 Cr which stood at Rs. 1,145 Cr for the quarter ended on 31 December 2018.
• The Total Operating Income (net of Interest Cost) for the quarter ended on 31 March 2019 was Rs. 1,429 Cr whereas it was Rs. 1,449 Cr for the quarter ended on 31 December 2018.
• The Net Interest Margin* for the quarter ended on 31 March 2019 was at 3.03% which was at 2.89% for the quarter ended on 31 December 2018.
• The Cost to Income ratio for the quarter ended on 31 March 2019 was at 80.30% in comparison to 78.75% for the quarter ended on 31 December 2018.
• The Profit Before Tax for the quarter ended on 31 March 2019 was Rs. (417) Cr which was Rs. 95 Cr (without considering the exceptional item due to goodwill accounted for in Q3 FY19) for the quarter ended on 31 December 2018.
• The Profit After Tax for the quarter ended on 31 March 2019 was Rs. (218) Cr, including tax rebate of Rs. 199 Cr
SECTION 3: PERFORMANCE HIGHLIGHTS
19
* NIMs are calculated on average daily balances of assets

Snapshot of Financial Performance for the Year (For FY 2019)
IDFC FIRST Bank is practically a new entity formed by the merger of Capital First and IDFC Bank. Hence the results for the Financial Year 2019 are not comparable either with IDFC Bank or with Capital First prior Financial Year results. The results for the Financial Year ended March 31, 2019 for IDFC FIRST Bank are as follows:
• The Net Interest Income for the year ended on 31 March 2019 was Rs. 3,199 Cr
• The Total Operating Income (net of Interest Cost) for the year ended on 31 March 2019 was Rs. 4,138 Cr.
• The Net Interest Margin* for the year ended on 31 March 2019 was at 2.37%
• The Cost to Income ratio for the year ended on 31 March 2019 was at 79.45%
• The Profit/(Loss) Before Tax (without considering the exceptional item) for the year ended on 31 March 2019 was Rs. (696) Cr
• The Book Value of the Share (Net worth considering as of 31 March 2019 and total number of shares adjusted for shares issued pursuant to merger on 5th January 2019) was at Rs. 37.98 per share
• `
SECTION 3: PERFORMANCE HIGHLIGHTS
20
* NIMs are calculated on average daily balances of assets

SECTION 4: ASSETS

Breakup of Loan Assets SECTION 4: ASSETS
22
Funded Assets (In INR Cr)
Mar-18 Jun-18 Sep-18 Dec-18 Mar-19
(Erstwhile IDFC Bank)
(Erstwhile IDFC Bank)
(Erstwhile IDFC Bank)
(Merged new entity IDFC FIRST Bank)
(Merged new entity IDFC FIRST Bank)
Retail Funded Assets 7,038 8,208 9,916 36,236 40,812
Rural 3,218 3,616 4,242 4,705 5,185
SME 1,794 2,153 2,772 13,574 15,767
Consumer 2,026 2,439 2,902 17,957 19,860
Wholesale Funded Assets 53,871 55,414 54,084 56,809 53,649
Corporates 27,039 28,861 30,447 34,098 32,190
Emerging Large Corporates 6,829 7,174 7,960 7,886 7,845
Large Corporates 5,617 5,473 6,073 5,852 2,951
Domestic Financial Institutional Group 4,668 6,484 6,330 10,645 12,436
Others 9,925 9,730 10,085 9,715 8,958
Infrastructure 26,832 26,553 23,637 22,710 21,459
PSL Inorganic 8,980 8,466 8,256 8,575 12,924
Stressed Equity and SRs 3,162 3,102 3,081 3,040 3,016
Total Funded Assets 73,051 75,190 75,337 1,04,660 1,10,400

Retail Assets as a % of the total Funded Assets has improved from 35% to 37% in the last Quarter
Others Stressed Equity/ SRs Wholesale Funded Assets Retail Funded Assets
* Post merger with Capital First. Figures of prior quarters pertain to erstwhile IDFC Bank.
SECTION 4: ASSETS
23
12% 11% 11% 8% 12% 4% 4% 4% 3%
3%
74% 74% 72% 54% 49%
10% 11% 13%
35% 37%
73,051 75,190 75,337
104,660* 110,400*
Mar-18 Jun-18 Sep-18 Dec-18 Mar-19
All figures are in INR Crores unless specified

Spreads have increased from 3.6% to 3.7% from Q3FY19 to Q4FY19
Note: The numbers for Q3-FY19 & Q4-FY19 are not comparable with numbers of earlier quarters.
SECTION 4: ASSETS
24
1.7% 1.7%
3.6%
3.7%
Jun-18 Sep-18 Dec-18 Mar-19

Spreads have increased from 3.6% to 3.7% from Q3FY19 to Q4FY19
#The numbers for Q3-FY19 & Q4-FY19 are not comparable with numbers of earlier quarters *Excluding one off recovery from stressed case of Rs. 81 Crore.
SECTION 4: ASSETS
25
Particulars Jun-18 Sep-18 Dec-18 Mar-19
Yields 9.1% 9.4% 11.5% 11.7%
Retail 15.7% 15.7% 16.6% 16.4%
Wholesale Bank 9.1% 9.2% 9.5% 9.5%
Corporate Banking 8.9% 9.0% 9.5% 9.9%
Infrastructure 9.4% 9.4% 9.6% 9.0%
PSL Buyout 6.7% 6.5% 6.4% 6.5%
Stressed Assets 2.5% 3.8% 5.7%* 5.6%
Average Cost of Funds 7.4% 7.6% 8.0% 7.9%
CASA 3.5% 3.3% 3.7% 4.7%
Retail TD 7.5% 7.6% 7.9% 8.0%
Corporate Deposits 7.0% 7.2% 7.4% 7.5%
Long Term Bonds & Infra Bonds 8.8% 8.8% 9.0% 9.1%
Other Borrowings (FCY, ECB, Refinance, Term & CP, Bonds) 6.1% 6.8% 8.4% 8.2%
Spreads 1.7% 1.7% 3.6% 3.7%
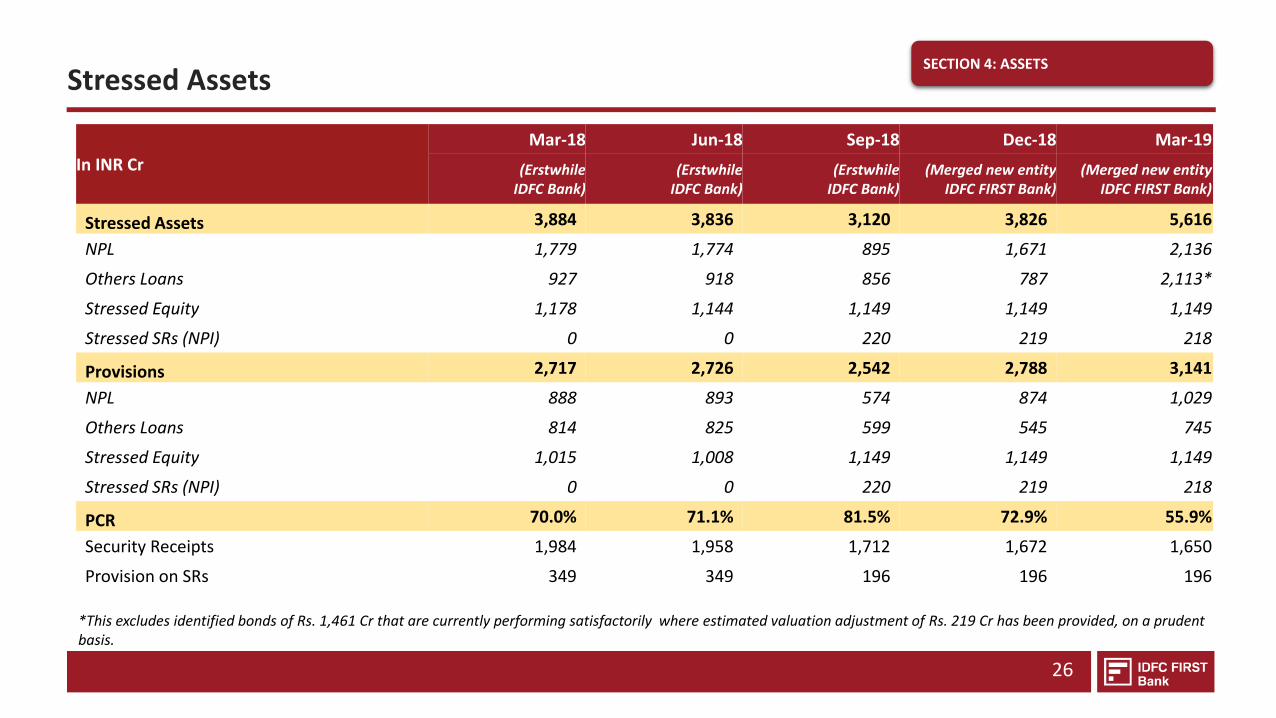
Stressed Assets SECTION 4: ASSETS
26
In INR Cr
Mar-18 Jun-18 Sep-18 Dec-18 Mar-19
(Erstwhile IDFC Bank)
(Erstwhile IDFC Bank)
(Erstwhile IDFC Bank)
(Merged new entity IDFC FIRST Bank)
(Merged new entity IDFC FIRST Bank)
Stressed Assets 3,884 3,836 3,120 3,826 5,616
NPL 1,779 1,774 895 1,671 2,136
Others Loans 927 918 856 787 2,113*
Stressed Equity 1,178 1,144 1,149 1,149 1,149
Stressed SRs (NPI) 0 0 220 219 218
Provisions 2,717 2,726 2,542 2,788 3,141
NPL 888 893 574 874 1,029
Others Loans 814 825 599 545 745
Stressed Equity 1,015 1,008 1,149 1,149 1,149
Stressed SRs (NPI) 0 0 220 219 218
PCR 70.0% 71.1% 81.5% 72.9% 55.9%
Security Receipts 1,984 1,958 1,712 1,672 1,650
Provision on SRs 349 349 196 196 196
*This excludes identified bonds of Rs. 1,461 Cr that are currently performing satisfactorily where estimated valuation adjustment of Rs. 219 Cr has been provided, on a prudent basis.
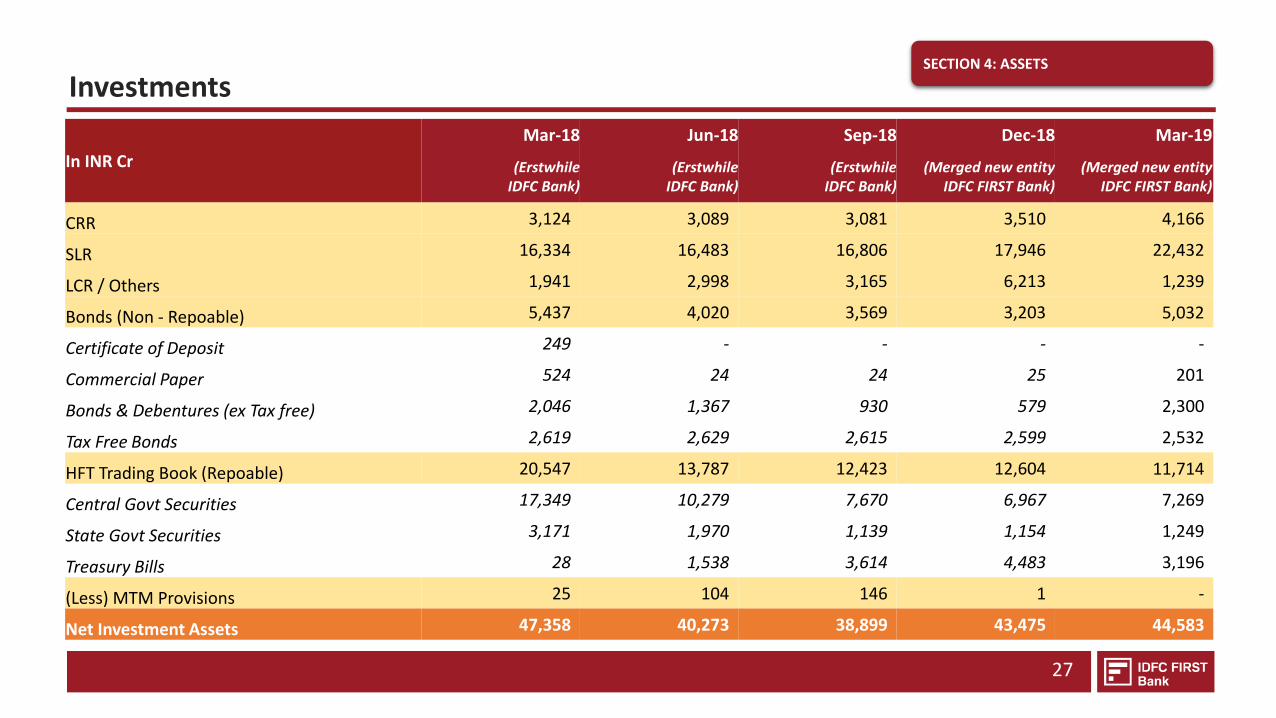
Investments SECTION 4: ASSETS
27
In INR Cr
Mar-18 Jun-18 Sep-18 Dec-18 Mar-19
(Erstwhile IDFC Bank)
(Erstwhile IDFC Bank)
(Erstwhile IDFC Bank)
(Merged new entity IDFC FIRST Bank)
(Merged new entity IDFC FIRST Bank)
CRR 3,124 3,089 3,081 3,510 4,166
SLR 16,334 16,483 16,806 17,946 22,432
LCR / Others 1,941 2,998 3,165 6,213 1,239
Bonds (Non - Repoable) 5,437 4,020 3,569 3,203 5,032
Certificate of Deposit 249 - - - -
Commercial Paper 524 24 24 25 201
Bonds & Debentures (ex Tax free) 2,046 1,367 930 579 2,300
Tax Free Bonds 2,619 2,629 2,615 2,599 2,532
HFT Trading Book (Repoable) 20,547 13,787 12,423 12,604 11,714
Central Govt Securities 17,349 10,279 7,670 6,967 7,269
State Govt Securities 3,171 1,970 1,139 1,154 1,249
Treasury Bills 28 1,538 3,614 4,483 3,196
(Less) MTM Provisions 25 104 146 1 -
Net Investment Assets 47,358 40,273 38,899 43,475 44,583

SECTION 5: LIABILITIES

Borrowings and Deposits
As of 31 March 2019
SECTION 5: LIABILITY
29
In INR Cr Mar-18 Jun-18 Sep-18 Dec-18 Mar-19
Borrowings 36,483 34,671 37,844 57,403 53,440
Legacy Long Term Bonds 21,405 18,909 18,632 16,385 15,752
Infra Bonds 10,434 10,434 10,434 10,434 10,434
Other Borrowings 4,644 5,328 8,778 30,584 27,254
CASA 5,710 6,083 6,426 6,421 9,114
Current Account 2,177 2,971 3,334 2,022 2,364
Saving Account 3,533 3,112 3,092 4,398 6,750
Term Deposits 22,826 26,888 29,943 33,181 32,611
Retail 4,107 4,970 6,453 7,605 8,769
Wholesale 18,719 21,918 23,490 25,577 23,842
Certificate of Deposits 19,662 21,086 11,988 22,312 28,754
Borrowings + Deposits 84,681 88,728 86,200 1,19,317 1,23,919
Money Market Borrowings 20,804 12,921 15,031 11,212 16,543
Total Borrowings & Deposits 1,05,485 1,01,649 1,01,231 1,30,529 1,40,462 Rs. 1,40,462 Cr
CASA, 6%
Term Deposits,
23%
Certificate of
Deposits, 20%
Money Market,
12%
Legacy, Infra
Bonds & CP, 26%
Other Short
Term, 12%

Trend of Retail Deposits (Retail CASA & Retail Term Deposits)
522 738 891 778 1,008 1,064
1,296 1,664 2,017
3,437
4,107
4,970
6,453
7,605
8,769
5,693
7,004
9,008
10,400
13,214
31 Mar 18 30 Jun 18 30 Sep 18 31 Dec 18 31 Mar 19
CA Retail SA Retail Retail Term Deposits
Retail CASA & Retail Deposits As a % of Total Borrowings & Deposits
5.40%
6.89%
8.90%
7.97%
9.41%
30
All figures are in INR Crores unless specified
SECTION 5: LIABILITY

The combined entity has presence across the length and breadth of the country, expanding its branch network to 242
SECTION 5: DISTRIBUTION
31
133 Urban Bank Branches
141 ATMs
102 Asset Service Branches (Erstwhile Capital First Branches)
354 Rural BC Branches (IFBL)
100 Other BC Branches
109 Rural Bank Branches

SECTION 6: FINANCIAL
STATEMENTS

Income Statement SECTION 6: FINANCIAL STATEMENTS
33
In INR Cr Jun-18 Sep-18 Dec-18 Mar-19 FY19
Interest Income 2,321 2,334 3,664 3,629 11,948
Interest Expense 1,831 1,883 2,519 2,516 8,749
Net Interest Income 490 451 1,145 1,113 3,199
Fee & Other Income 103 118 301 334 856
Core Operating Income 593 569 1,446 1,447 4,055
Operating Expense 446 552 1,142 1,148 3,287
Core Operating Profit 146 17 305 299 768
Add: Trading Gain/(Loss) 96 1 3 (18) 82
Less: Credit Provisions 14 539 338 680 1,571
Less: Treasury MTM provision Loss/(Write-back) 20 62 (125) 19 (25)
Profit Before Tax & Exceptional Item 208 (583) 95 (417) (696)
Add: Exceptional Item - - 2,599 - 2,599
Profit Before Tax 208 (583) (2,504) (417) (3,295)
Tax 27 (213) (966) (199) (1,351)
Profit After Tax 182 (370) (1,538) (218) (1,944)

Balance Sheet SECTION 6: FINANCIAL STATEMENTS
34
In INR Cr Mar-18 Jun-18 Sep-18 Dec-18 Mar-19
Shareholders' Funds 15,257 15,438 14,776 18,376 18,159
Deposits 48,198 54,057 48,356 61,914 70,479
Borrowings 57,287 47,591 52,875 68,614 69,983
Other liabilities and provisions 5,778 5,934 7,248 8,012 8,563
Total Liabilities 1,26,520 1,23,021 1,23,255 1,56,916 1,67,185
Cash and Bank Balances 1,768 2,545 2,409 1,636 5,401
Net Retail and Wholesale Assets 70,099 72,240 72,619 1,01,694 1,06,865
Statutory Investments 19,458 19,572 19,887 21,456 26,598
Trading Investments 27,899 20,701 19,012 22,018 17,984
Fixed and Other Assets 7,296 7,962 9,327 10,112 10,336
Total Assets 1,26,520 1,23,021 1,23,255 1,56,916 1,67,185

SECTION 7: DIRECTORS
& SHAREHOLDERS

V Vaidyanathan, Managing Director & CEO SECTION 7: BOARD & SHAREHOLDERS
36
Mr. V. Vaidyanathan is the first Managing Director and CEO of IDFC FIRST Bank, a bank founded by the merger of Capital First and IDFC Bank in December 2018. He holds shares and options totalling 3.60% of the equity of the company on a fully diluted basis.
Prior to this role, he founded Capital First Limited by first acquiring an equity stake in an existing NBFC, and then executing a Management Buyout (MBO) by securing an equity backing of Rs. 810 crores in 2012 from PE Warburg Pincus. The MBO included (a) buyout of majority and minority shareholders through Open Offer to public; (b) Fresh capital raise of Rs. 100 crores into the company; (c) Reconstitution of the Board of Directors (d) Change of business from wholesale to retail lending; (e) Creation of a new brand "Capital First".
As part of his entrepreneurial journey, he left ICICI Group in 2010 and acquired a stake in a small start-up NBFC. He then exited legacy businesses of Real estate financing, Foreign Exchange, Broking, Investment management businesses and instead transformed the company into a large retail financing institution with operations in more than 225 locations across India. Between March 2010 to September 2018, he has grown the retail financing book from Rs. 94 crores ($14 million) to Rs. 29,625 crores ($4.06 billion), has grown the Equity Capital from Rs. 690 crores ($106 million) to Rs. 2,928 crores ($401.1 million) and reduced the Gross NPA and Net NPA from 5.36% & 3.78% to 1.94% & 1.00%. Under his leadership, Company's long term credit rating was upgraded four notches to AAA.
He joined ICICI Limited in early 2000 when it was a Domestic Financial Institution (DFI) and the retail businesses he built helped the transition of ICICI from a DFI to a Universal Bank. He built the Retail Banking Business for ICICI Limited since its inception, and grew ICICI Bank (post merger in 2002) to 1411 Bank branches in 800 cities, 25 million customers, a vast CASA and retail deposit base, branch, internet and digital banking, built a retail loan book of over Rs. 1,35,000 crores ($20 billion) in Mortgages, Auto loans, Commercial Vehicles, Credit Cards, Personal Loans. In addition, he also built the SME business and managed the Rural Banking Business for the bank. These businesses helped the conversion of the institution to a universal bank renowned for retail banking.
He was appointed the Executive Director on the Board of ICICI Bank in 2006 and later became the Managing Director on the Board of ICICI Prudential Life Insurance Company in 2009. He was also the Chairman of ICICI Home Finance Co. Ltd (2006), and served on the Board of CIBIL- India's first Credit Bureau (2005), and SMERA- SIDBI's Credit Rating Agency (2005). He started his career with Citibank India in 1990 and worked there till 2000, where he learnt the ropes in Consumer Banking.
During his career, he and his organization have received a large number of domestic and international awards including the prestigious, "Transformational Leader 2018" by CFI Awards UK, "Most Inspirational Leveraged Management Buyout, India 2018" by CFI Awards, "Financial Services Company of the Year, 2018 - VC Circle", "Entrepreneur of the Year" Award at APEA 2017, CNBC Asia "Innovative company of the year" IBLA-2017, "Outstanding contribution to Financial Inclusion, India, 2017" from Capital Finance International, London, "Economic Times Most Promising Business Leaders of Asia" 2016, 'Outstanding Entrepreneur Award' in Asia Pacific Entrepreneurship Awards 2016, Greatest Corporate Leaders of India- 2014, Business Today - India's Most Valuable Companies 2016 & 2015, Economic Times 500 India's Future Ready Companies 2016, Fortune India's Next 500 Companies 2016, Dun & Bradstreet India's Top 500 Companies & Corporates 2016 & 2015. During his prior stint, awards included "Best Retail bank in Asia 2001", "Excellence in Retail Banking Award" 2002, "Best Retail Bank in India 2003, 2004, and 2005" from the Asian Banker, "Most Innovative Bank" 2007, "Leaders under 40" from Business Today in 2009, and was nominated "Retail Banker of the Year" by EFMA Europe for 2008. He is an alumnus of Birla Institute of Technology and Harvard Business School and is a regular contributor on Financial and Banking matters in India and international forums.
He is a regular marathoner and has run 22 half-marathons and 8 full marathons.

DR. RAJIV B. LALL - PART-TIME NON-EXECUTIVE CHAIRMAN
Dr. Rajiv Lall is the Non-Executive Chairman of IDFC Bank. He was the Founder MD & CEO of IDFC Bank from October 1, 2015 till December 18, 2018. Previously, he was the
Executive Chairman of IDFC Limited. A veteran economist for 30 years, Dr. Lall has been an active part of the finance and policy landscape, both in India and internationally. In
his diverse career, he has also held leadership roles in global investment banks and multilateral agencies.
Board of Directors
MR. SUNIL KAKAR - NON-EXECUTIVE NON INDEPENDENT DIRECTOR (REPRESENTING IDFC LIMITED)
Mr. Sunil Kakar is the Managing Director & CEO of IDFC Limited. He started his career at Bank of America where he worked in various roles, covering Business Planning &
Financial Control, Branch Administration and Operations, Project Management and Internal Controls. After Bank of America, Mr. Kakar was the CFO at Max New York Life
Insurance. He led numerous initiatives including Planning, Investments / Treasury, Finance and Accounting, Budgeting and MIS, Regulatory Reporting and Taxation.
MS. ANINDITA SINHARAY – NON-EXECUTIVE NON INDEPENDENT DIRECTOR (REPRESENTING THE GOVT. OF INDIA)
Ms. Anindita Sinharay is an Indian Statistical Service (2000) officer working as a Director in the Department of Financial Services, Ministry of Finance. She holds a post graduate
degree in Statistics from the University of Calcutta. She has vast working experience of more than one decade in National Accounts Statistics in Central Statistics Office (CSO)
and analysis of data of large scale sample surveys conducted by National Sample Survey Office (NSSO).
SECTION 7: BOARD & SHAREHOLDERS
37
MR. ANAND SINHA - INDEPENDENT DIRECTOR
Mr. Anand Sinha joined the Reserve Bank of India in July 1976 and rose to become Deputy Governor in January 2011. He was Adviser in RBI up to April 2014 after demitting
the office of Deputy Governor in RBI on 18th January 2014. As Deputy Governor, he was in-charge of regulation of commercial banks, Non-Banking Financial Companies,
Urban Cooperative Banks and Information Technology, among others.
MR. HEMANG RAJA - INDEPENDENT DIRECTOR
Mr. Hemang Raja, is an MBA from Abeline Christian University, Texas, with a major emphasis on finance. Mr. Raja has also been the head of Capital Market activities in the
Institutional and Retail Segments when he started and became the Managing Director and CEO of the then newly formed initiative by IL&FS, namely IL&FS Investsmart Ltd.
His last assignment from the year 2006 onwards was in the area of Private Equity and Fund Management business with Credit Suisse and Asia Growth Capital Advisers in India
as MD and Head - India.

MR. SANJEEB CHAUDHURI - INDEPENDENT DIRECTOR
Mr. Sanjeeb Chaudhuri is a Board member and Advisor to global organizations across Europe, the US and Asia. He has most recently been Regional Business Head for India
and South Asia for Retail, Commercial and Private Banking and also Global Head of Brand and Chief Marketing Officer at Standard Chartered Bank. Prior to this, he was CEO
for Retail and Commercial Banking for Citigroup, Europe, Middle East and Africa. He has an MBA in Marketing and has completed an Advanced Management Program.
Board of Directors SECTION 7: BOARD & SHAREHOLDERS
38
DR.(MRS.) BRINDA JAGIRDAR - INDEPENDENT DIRECTOR
Dr. (Mrs.) Brinda Jagirdar, is an independent consulting economist with specialization in areas relating to the Indian economy and financial intermediation. She is on the
Governing Council of Treasury Elite, a knowledge sharing platform for finance and treasury professionals. She retired as General Manager and Chief Economist, State Bank of
India, based at its Corporate Office in Mumbai. She has a brilliant academic record, with a Ph.D. in Economics from the Department of Economics, University of Mumbai, M.S.
in Economics from the University of California at Davis, USA, M.A. in Economics from Gokhale Institute of Politics and Economics, Pune and B.A. in Economics from Fergusson
College, Pune. She has attended an Executive Programme at the Kennedy School of Government, Harvard University, USA and a leadership programme at IIM Lucknow.
MR. PRAVIR VOHRA - INDEPENDENT DIRECTOR
Mr. Pravir Vohra is a postgraduate in Economics from St. Stephen's College, University of Delhi & a Certified Associate of the Indian Institute of Bankers. He began his career in
banking with State Bank of India where he worked for over 23 years. He held various senior level positions in business as well as technology within the bank, both in India &
abroad. The late 1990s saw Mr. Vohra as Vice President in charge of the Corporate Services group at Times Bank Ltd. In January 2000, he moved to the ICICI Bank group where
he headed a number of functions like the Retail Technology Group & Technology Management Group. From 2005 till 2012 he was the President and Group CTO at ICICI Bank.
MR. AASHISH KAMAT - INDEPENDENT DIRECTOR
Mr. Aashish Kamat has over 30 years of experience in the corporate world, with 24 years being in banking & financial services & 6 years in public accounting. Mr. Kamat was
the Country Head for UBS India, from 2012 until his retirement in January 2018. Prior to that he was the Regional COO/CFO for Asia Pacific at JP Morgan based out of Hong
Kong. Before moving to Hong Kong, Mr. Kamat was in New York, where is was the Global Controller for the Investment Bank (IB) at JP Morgan in New York; & at Bank of
America as the Global CFO for the IB, and, Consumer and Mortgage Products. Mr. Kamat started his career with Coopers & Lybrand, a public accounting firm, in 1988 before
he joined JP Morgan in 1994.
MR. VISHAL MAHADEVIA – NON-EXECUTIVE NON INDEPENDENT DIRECTOR
Mr. Vishal Mahadevia joined Warburg Pincus in 2006 & is a member of the firm’s executive management group. Previously, he was a Principal at Greenbriar Equity Group, a
fund focused on private equity investments in the transportation sector. Prior to that, Mr. Mahadevia worked at Three Cities Research, a New York-based PE fund, & as a
consultant with McKinsey & Company. He received a B.S. in economics with a concentration in finance & B.S. in electrical engineering from the University of Pennsylvania

Current Shareholding Pattern
Total # of shares as of 31th March 2019 : 478,16,76,412 Book Value per Share as of 31st March 2019: Rs. 37.98
Scrip Name : IDFC FIRST Bank (BSE: 5394437, NSE:IDFCFIRSTB) Key shareholders % Holding
IDFC Financial Holding Company Limited 40.00
Warburg Pincus through its affiliated entities 9.99
President of India 5.47
GIC Singapore 4.03
Platinum Asset Management 1.90
Aditya Birla Asset Management 1.88
Vanguard 1.59
V Vaidyanathan* 1.19
Wellington 0.84
Dimensional Fund Advisors 0.80
iShares 0.72
SECTION 7: BOARD & SHAREHOLDERS
39
*Including shares amounting to 0.14% of the Bank transferred by him to a Social Welfare Trust where he is a Trustee. On a fully diluted basis, including shares and options, Mr. Vaidyanathan holds 3.60% equity of the Bank.
Promoters, 40.0%
FII/FPI/Foreign Corporate,
24.8%
MF/Insurance/AIF/Bank/FI,
4.1%
Public (incl NRIs), 22.1%
PRESIDENT OF INDIA,
5.5%
Other Body Corporate,
3.3%
Trusts and Clearing
Members, 0.3%

Since Capital First business model and profitability trends will form an important part of the new business trajectory, we present to you the business model and financial trends of Capital First Limited. These slides are essentially an extract of the last official investor presentation of Capital First prior to the merger (Period ending Q2 FY18.)
History of Capital First Limited
41
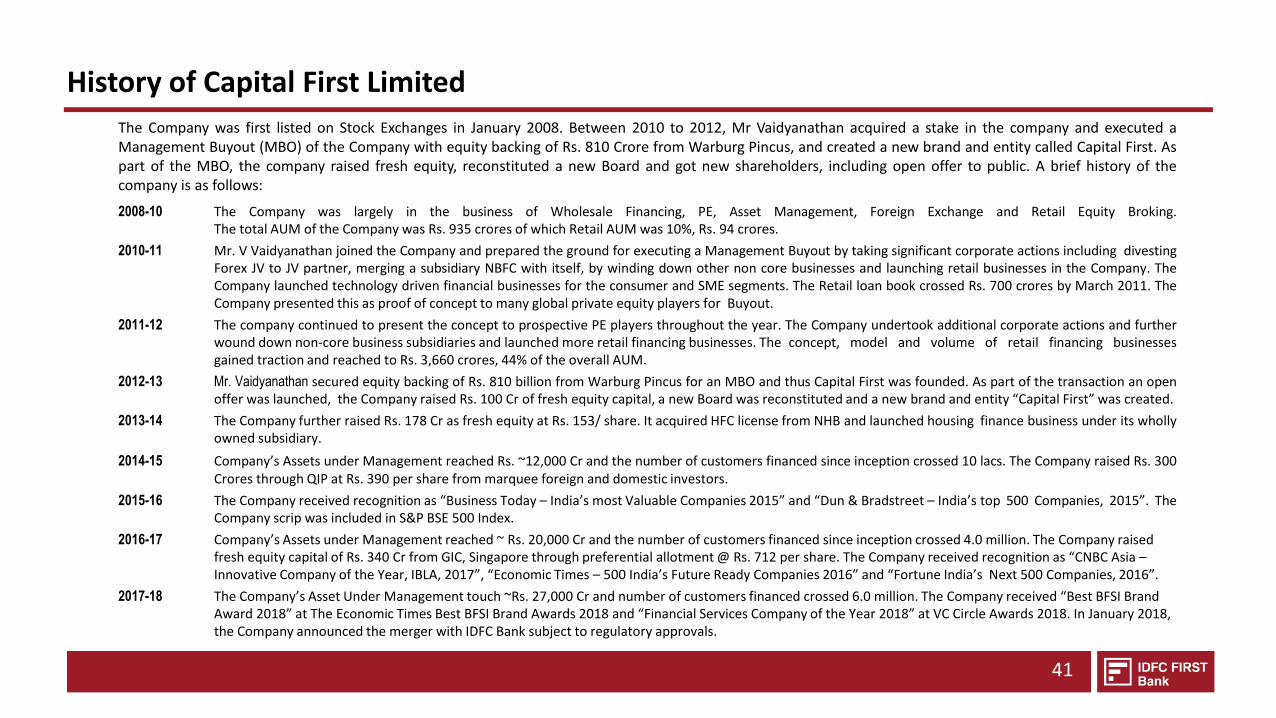
The Company was first listed on Stock Exchanges in January 2008. Between 2010 to 2012, Mr Vaidyanathan acquired a stake in the company and executed a Management Buyout (MBO) of the Company with equity backing of Rs. 810 Crore from Warburg Pincus, and created a new brand and entity called Capital First. As part of the MBO, the company raised fresh equity, reconstituted a new Board and got new shareholders, including open offer to public. A brief history of the company is as follows:
2008-10 The Company was largely in the business of Wholesale Financing, PE, Asset Management, Foreign Exchange and Retail Equity Broking. The total AUM of the Company was Rs. 935 crores of which Retail AUM was 10%, Rs. 94 crores.
2010-11 Mr. V Vaidyanathan joined the Company and prepared the ground for executing a Management Buyout by taking significant corporate actions including divesting Forex JV to JV partner, merging a subsidiary NBFC with itself, by winding down other non core businesses and launching retail businesses in the Company. The Company launched technology driven financial businesses for the consumer and SME segments. The Retail loan book crossed Rs. 700 crores by March 2011. The Company presented this as proof of concept to many global private equity players for Buyout.
2011-12 The company continued to present the concept to prospective PE players throughout the year. The Company undertook additional corporate actions and further wound down non-core business subsidiaries and launched more retail financing businesses. The concept, model and volume of retail financing businesses gained traction and reached to Rs. 3,660 crores, 44% of the overall AUM.
2012-13 Mr. Vaidyanathan secured equity backing of Rs. 810 billion from Warburg Pincus for an MBO and thus Capital First was founded. As part of the transaction an open offer was launched, the Company raised Rs. 100 Cr of fresh equity capital, a new Board was reconstituted and a new brand and entity “Capital First” was created.
2013-14 The Company further raised Rs. 178 Cr as fresh equity at Rs. 153/ share. It acquired HFC license from NHB and launched housing finance business under its wholly owned subsidiary.
2014-15 Company’s Assets under Management reached Rs. ~12,000 Cr and the number of customers financed since inception crossed 10 lacs. The Company raised Rs. 300 Crores through QIP at Rs. 390 per share from marquee foreign and domestic investors.
2015-16 The Company received recognition as “Business Today – India’s most Valuable Companies 2015” and “Dun & Bradstreet – India’s top 500 Companies, 2015”. The Company scrip was included in S&P BSE 500 Index.
2016-17 Company’s Assets under Management reached ~ Rs. 20,000 Cr and the number of customers financed since inception crossed 4.0 million. The Company raised fresh equity capital of Rs. 340 Cr from GIC, Singapore through preferential allotment @ Rs. 712 per share. The Company received recognition as “CNBC Asia – Innovative Company of the Year, IBLA, 2017”, “Economic Times – 500 India’s Future Ready Companies 2016” and “Fortune India’s Next 500 Companies, 2016”.
2017-18 The Company’s Asset Under Management touch ~Rs. 27,000 Cr and number of customers financed crossed 6.0 million. The Company received “Best BFSI Brand Award 2018” at The Economic Times Best BFSI Brand Awards 2018 and “Financial Services Company of the Year 2018” at VC Circle Awards 2018. In January 2018, the Company announced the merger with IDFC Bank subject to regulatory approvals.

History of Capital First Limited
42
The growth of the key parameters are as follows:
o Total Asset Under Management has grown at a CAGR (FY13-FY18) of 29% from Rs. 7,510 Cr (FY13) to Rs. 26,997 Cr (FY18)
o Total Income has grown at a CAGR (FY13-FY18) of 47% from Rs. 357.5 Cr (FY13) to Rs. 2429.6 Cr (FY18)
o Profit After Tax has grown at a CAGR (FY13-FY18) of 39% from Rs. 63.1 Cr (FY13) to Rs. 327.4 Cr (FY18)
o Earning Per Share has grown at a CAGR (FY13-FY18) of 30% from Rs. 9 (FY13) to Rs. 33 (FY18)
From 31-March-2010 to 31-Mar-2018, the company has transformed across all key parameters including:
• The total Capital has grown from Rs. 691 Cr to Rs. 3,993 Cr
• The Assets under Management increased from Rs. 935 Cr to Rs. 26,997 Cr
• The retail Assets Under Management increased from Rs. 94 Cr to Rs. 25,243 Cr
• The long term credit rating has upgraded from A+ to AAA
• The number of lenders increased from 5 to 297
• The Gross NPA reduced from 5.28% (180 DPD) to 1.62% (90 DPD)
• The Net NPA reduced from 3.78% (180 DPD) to 1.00% (90 DPD)
• Cumulative customers financed reached over 60 lacs

Over the last Eight years the company has consistently stayed with the founding theme of financing self-employed entrepreneurs, MSMEs and consumers through the platform of technology & has grown the retail franchise
43
Rs. 2,751 Cr
$ 0.42 bn
Rs. 6,186 Cr
$ 0.95 bn
Rs. 7,510 Cr
$ 1.16 bn
Rs. 9,679 Cr
$ 1.49 bn
Rs. 11,975 Cr
$ 1.84 bn
Rs. 16,041 Cr
$ 2.47 bn
Rs. 19,824 Cr
$ 3.05 bn
28%
72%
74%
26% 81%
19% 84%
16% 86%
14%
56% 44%
93%
7%
Rs. 26,997 Cr
$ 4,15 bn
Total AUM
A highly diversified portfolio across 600 industries and over 70 lakh customers
Retail Loan Assets becoming 91% of the Overall Loan Assets
This transformation & diversification has resulted in high asset quality, consistency of growth, and sustained increase in profits.
Retails loans
As a result, the growth in the net profit of the Company has outpaced the growth of the loan book
demonstrating increased efficiency in use of capital. The company plans to continue to build in this strategic
direction and aims to grow the loan book at a CAGR of 25% over the next three years.
Real Estate & Corporate Loans
FY10 FY12 FY13 FY14 FY15 FY16 FY17 FY18
94%
6%
Rs. 32,622 Cr*
$ 4.47 bn
Q2 FY19
* As per Ind - AS
10%
Rs. 935 Cr
$ 0.14 bn
FY11
91%
9%
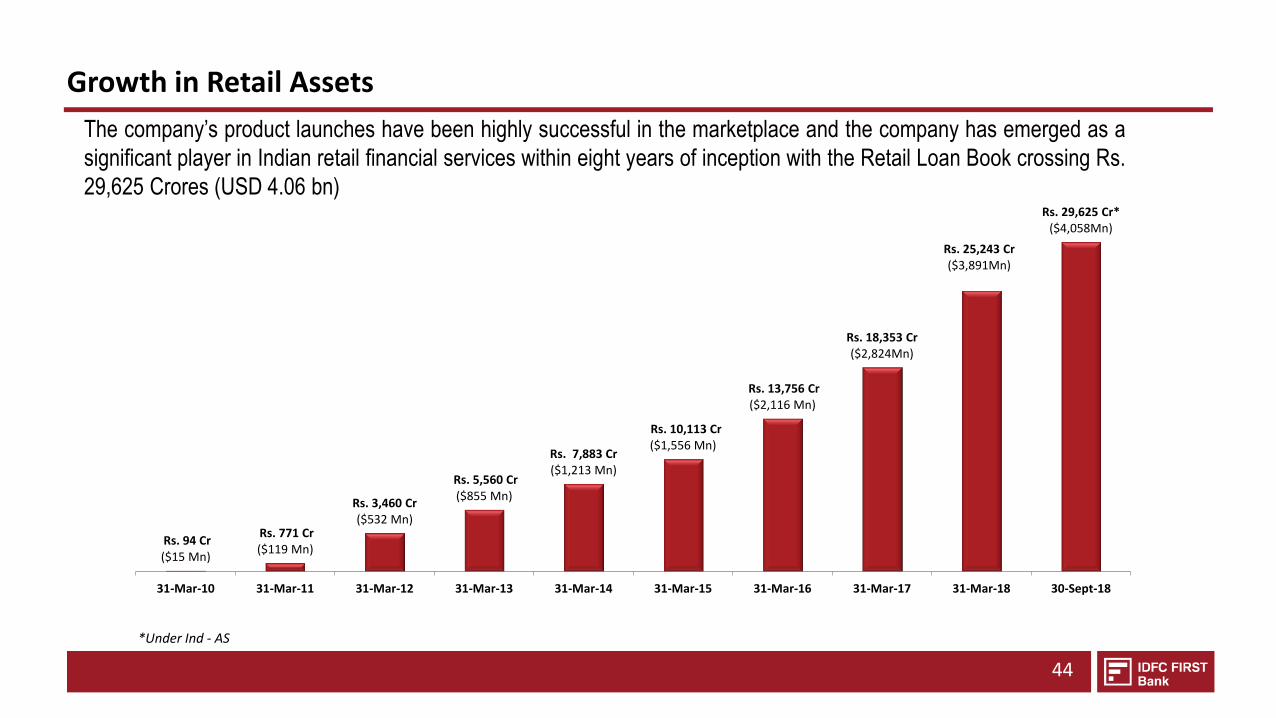
Growth in Retail Assets
44
The company’s product launches have been highly successful in the marketplace and the company has emerged as a
significant player in Indian retail financial services within eight years of inception with the Retail Loan Book crossing Rs.
29,625 Crores (USD 4.06 bn)
Rs. 94 Cr ($15 Mn)
Rs. 771 Cr ($119 Mn)
Rs. 3,460 Cr ($532 Mn)
Rs. 5,560 Cr ($855 Mn)
Rs. 7,883 Cr ($1,213 Mn)
Rs. 10,113 Cr ($1,556 Mn)
Rs. 13,756 Cr ($2,116 Mn)
Rs. 18,353 Cr ($2,824Mn)
Rs. 25,243 Cr ($3,891Mn)
Rs. 29,625 Cr* ($4,058Mn)
31-Mar-10 31-Mar-11 31-Mar-12 31-Mar-13 31-Mar-14 31-Mar-15 31-Mar-16 31-Mar-17 31-Mar-18 30-Sept-18
*Under Ind - AS

Capital First provided financing to select segments that are traditionally underserved by the existing financing system
45
Traditionally these end uses are underserved by the financial system as ticket sizes are small, credit evaluation is
difficult, collections is difficult, and business is often unviable owing to huge operating and credit costs.
MSMEs --------------- Consumers
Loans for Business Expansion
Short Term Business funding
Loans for Two Wheeler purchase
Loans for Office Furniture
Loans for Office Automation – PCs, Laptops, Printers
Loans for Plant & Machinery
Loans for office display panels
Loans for Air-Conditioners

MSME Financing – A key area of Focus
46
Capital First has emerged as a Specialized Player in financing MSMEs by offering different products
for their various financing needs
Typical Loan Ticket Size From CFL
Rs. 15k - Rs. 1 lakh To Micro business owners and consumers for purchase of office PC, office furniture, Tablets, Two-
Wheeler, etc.
Rs. 1 lakh - Rs. 10 lacs To Small Entrepreneurs/ partnership firms in need of immediate funds, for say, purchase of
additional inventory for an unexpected large order.
Rs. 10 lacs - Rs. 2 crores To Small and Medium Entrepreneurs financing based on customised cash flow analysis and
references from the SME’s customers, vendors, suppliers.
Typical Customer Profile

Key Product Offerings
47
MS
ME
Lo
ans
Tw
o W
hee
ler
Lo
ans
Co
nsu
mer
Du
rab
le
Lo
ans
Products Key Features Average Loan
Ticket Size
(Rs.)
Average
Loan Tenor
(Months)
Average Loan
to Value Ratio
(%)
Challenges
CFL provides long term loans to MSMEs after proper evaluation of cash flows. Backed by collateral of residential or commercial property. Monthly amortizing products with no moratorium. CFL also provides unsecured short tenure working capital loans to MSMEs.
CFL provides financing to salaried segment as well as self employed individuals like small traders, shop keepers for purchase of new two-wheelers.
CFL provides financing to salaried and self-employed customers for purchasing of LCD/LED panels, Laptops, Air-conditioners and other such white good products. They are also availed by small entrepreneurs for official purposes.
7,400,000 ($ 114,000)
53,000 ($815)
60*
24
12
45%
72%
77%
Evaluation of cash flows is a key challenge for credit appraisal of MSMEs. Businesses may undergo reverses over lifetime of the loan that may affect repayments
High collection effort and costs as the collection efforts required are significant due to small ticket size and large number of customers running into millions. Operating expenditure is also very high.
High collection efforts and cost as the collection efforts required are significant due to small ticket size and large number of customers running into millions. Operating expenditure is also very high.
Note: All the loan product related figures are for the period FY18 * On actuarial basis
22,000 ($338)

Rigorous Credit Underwriting Process helps in maintaining high asset quality
48
In the Mortgages business at Capital First, about 38% of the total
applications are disbursed after passing through several levels of
scrutiny and checks, mainly centred around cash flow evaluation,
credit bureau and reference checks. Most rejections are because of
the lack of visibility or inadequate cash flows to service the loan.
100
2-3 38-40
2-4 5-7 10-12
38
Application Logged in CIBIL / Credit BureauRejection
Rejection Due toInsufficient Cashflow
/ Documentation
Rejection afterPersonal Interview
Rejection due toLegal & Technical
Reasons
Rejection for OtherReasons
Net Disbursals
✘ ✘
✘
✘ ✘

The Company’s asset quality has consistently remained stable..
49
1.74% 1.71%
1.52% 1.59%
1.65% 1.72%
1.63% 1.59% 1.62% 1.57%
1.21% 1.13%
0.97% 1.00% 1.00% 1.04% 1.00% 0.97% 1.00% 1.00%
31-Mar-16 30-Jun-16 30-Sep-16 31-Dec-16 31-Mar-17 30-Jun-17 30-Sep-17 31-Dec-17 31-Mar-18 30-Jun-18
CFL-GNPA CFL-NNPA
The Company reported NPA at 180 DPD till 2015, 150 DPD till FY16 at 120 DPD till FY17, and at 90 DPD since FY 18 as per extant RBI norms. In order to enable easy comparability of NPA as a common scale, the NPA chart below has been compiled at 90 DPD basis for the last 10 quarters as per Indian GAAP.
Demonetization Nov 8th 2016
GST Launched July 1st 2017

Reputed marquee FIIs and DIIs have invested in CFL
50
35.52%
24.75%
10.51%
3.50%
25.72%
Warburg Pincus Affiliated Companies FII & FPI
Financial Institution/Bank/MF/ Insurance Bodies Corporate
Individuals & Others
Total # of shares as of 30 September, 2018: 9,90,52,644 Book Value per Share as per Ind AS : Rs. 296 (US$4.05)
Warburg Pincus, through its affiliate entities
Birla Asset Management, India
HDFC Mutual Fund, India
Vanguard, USA
Jupiter Asset Management, UK
TIAA, USA
DSP Blackrock, India
MV SCIF, Mauritius
Dimensions Group, USA
Key Shareholders of Capital First Limited (as of 30 September 2018)
V. Vaidyanathan
GIC, Sovereign Wealth Fund, Singapore
Government Pension Fund Global, Norway
Kotak Mutual fund, India
ICICI Prudential Mutual Fund, India
JOM Silkkitie, Finland

The Asset Under Management has consistently grown at a 5 year CAGR of 29%.
51
8,0
24
8,2
44
9,0
71
9,6
79
10
,60
3
11
,04
5
11
,69
5
11
,97
5
12
,64
4
13
,60
4
14
,97
3
16
,04
1
17
,21
2
17
,93
7
18
,78
4
19
,82
4
21
,41
0
22
,97
4
24
,75
5
26
,99
7
29
,70
3
32
,62
2
-
5,000
10,000
15,000
20,000
25,000
30,000
35,000Q
1-F
Y14
Q2
-FY1
4
Q3
-FY1
4
Q4
-FY1
4
Q1
-FY1
5
Q2
-FY1
5
Q3-
FY15
Q4
-FY1
5
Q1
-FY1
6
Q2
-FY1
6
Q3
-FY1
6
Q4
-FY1
6
Q1
-FY1
7
Q2
-FY1
7
Q3
-FY1
7
Q4
-FY1
7
Q1
-FY1
8
Q2
-FY1
8
Q3
-FY1
8
Q4
-FY1
8
Q1
-FY1
9*
Q2
-FY1
9*
AUM (In Rs. Cr)-LHS
AUM (In Rs. Cr)-LHS
*Highlighted figures are based on Indian AS in comparison to quarterly figures for earlier periods based on Indian GAAP.

The Profit After Tax has grown steadily with improvement in Cost to Income ratio
52
5.5 7.2 10.1
29.8
20.8
27.0 29.9
36.5 33.1
41.0 44.5
47.5 49.2
57.6 61.4
70.8 67.0
78.3
87.0
95.3
101.5* 104.6*
0%
10%
20%
30%
40%
50%
60%
70%
80%
90%
-
20.0
40.0
60.0
80.0
100.0
120.0
Q1FY14
Q2FY14
Q3FY14
Q4FY14
Q1FY15
Q2FY15
Q3FY15
Q4FY15
Q1FY16
Q2FY16
Q3FY16
Q4FY16
Q1FY17
Q2FY17
Q3FY17
Q4FY17
Q1FY18
Q2FY18
Q3FY18
Q4FY18
Q1FY19
Q2FY19
PAT (In Cr) (LHS) OPEX to Income
*Figures for Q1 FY19 and Q2 FY19 are based on Ind AS and earlier periods are under Indian GAAP

Yearly Profit Growth Trend..
53
*Figures for H1-FY19 are based on Ind AS and earlier periods are under Indian GAAP
53
114
166
239
327
206*
FY14 FY15 FY16 FY17 FY18 H1 FY19
Yearly Net Profit (Rs Cr)

With enhanced business operations, the Return on Equity has continuously improved over the quarters…
54
2.28% 2.96%
4.15%
11.09%
7.02%
8.89% 9.58%
10.29%
8.32%
10.08% 10.68%
11.20% 11.39%
12.87%
12.10% 12.49%
11.46%
13.06%
14.08% 14.82%
14.47% 14.46%
Q1
FY
14
Q2
FY
14
Q3
FY
14
Q4
FY
14
Q1
FY
15
Q2
FY
15
Q3
FY
15
Q4
FY
15
Q1
FY
16
Q2
FY
16
Q3
FY
16
Q4
FY
16
Q1
FY
17
Q2
FY
17
Q3
FY
17
Q4
FY
17
Q1
FY
18
Q2
FY
18
Q3
FY
18
Q4
FY
18
Q1
FY
19
*
Q2
FY
19
*
All figures are annualised
4.93% 8.33%
10.14% 11.93%
13.31%
FY15
FY16 FY17
FY18
14.51%
H1-FY18
FY14
*Highlighted figures are based on Indian AS in comparison to quarterly figures for earlier periods based on Indian GAAP.

The Market Cap of the Company grew more than 10X in the last 6 years..
55
Rs. 781Cr* ($ 120 Mn)
Rs. 1,152Cr ($ 177 Mn)
Rs. 1,478 Cr ($ 227 Mn)
Rs. 3,634 Cr ($ 559 Mn)
Rs. 3,937 Cr ($ 606 Mn)
Rs. 7,628 Cr ($ 1,174 Mn)
Rs. 8,282 Cr#
($ 1,274 Mn)
Rs. 6,096 Cr ($ 938 Mn)
31-Mar-12 31-Mar-13 31-Mar-14 31-Mar-15 31-Mar-16 31-Mar-17 12-Jan-18 31-Mar-18
Market Capitalization
* Last date of Financial Year immediately preceding the Management Buyout # Market Cap on the day before the announcement of merger with IDFC Bank (Jan 13, 2018).

The Company has been steadily increasing dividend pay-out every year..
56
Dividend (as % of face value per share)
18%
20%
22%
24%
26%
28%
31-Mar-13 31-Mar-14 31-Mar-15 31-Mar-16 31-Mar-17 31-Mar-18

With the increasing assets size, returns have shown a consistent growth over the last six years…
57
9,679
422.2
52.6
6.37
FY14
Total Income (Rs. Cr)
PAT (Rs. Cr)
AUM (Rs. Cr)
Earning per Share (Rs.)
FY15
11,975
658.8
114.3
12.56
FY17
19,824
1,640.3
238.9
24.53
7,510
357.3
63.1
9.00
FY13 FY16
16,041
991.8
166.2
18.24
CAGR
29%
47%
39%
30%
1,478 Market Cap (Rs. Cr)
3,634 7,628 1,152 3,937 40%
FY18
26,997
2,429.6
327.4
33.34
6,096

THANK YOU