corporate procurement in practice; a case study at vanderlande
TRANSCRIPT

Veghel , January 2010
Student identity number 0561034
in partial fulfillment of the requirements for the degree of
Master of Science
in Operations Management and Logistics
Corporate procurement in practice; A case study at
Vanderlande Industries
By Durand J. Rekko

By Durand Rekko ii
Supervisors:
Dr. M. Slikker, Technical University Eindhoven
Dr. J.A. Keizer, Technical University Eindhoven
Ing. E. Beers, Corporate Procurement and Logistics, Vanderlande Industries, Veghel

By Durand Rekko iii
TUE Department Technology Management
Series Master Thesis Operations Management and Logistics
Subject headings: Procurement, Purchasing, Centralizing, Project Organization.

By Durand Rekko iv
Abstract This master thesis investigates possible causes which influence the degree in which departments
within Vanderlande Industries use the services of the Corporate procurement department. Within
the company there are several decentralized Customer centers which can choose to make use of the
services of the Corporate procurement department, however although this can improve their
performance significantly, some of the customer centers do not do this. Therefore in this research
three possible causes for this behavior are investigated. This is done by conducting a case study on
three Customer centers. Based on the gathered information possible causes are tested whether they
are plausible to be a cause or not.

By Durand Rekko v
Preface This report is the result of my master thesis project for the Master Operations Management &
Logistics at the Technical University of Eindhoven. With this project an end has come to a period of
six and a half years of studying. In the last 8 months I conducted research within the corporate
procurement department of Vanderlande Industries.
First of all I want to thank my first supervisor from the University, Marco Slikker. During the entire
project his criticism on my work has challenged me time after time. The professional and
constructive discussions greatly contributed to the end result as presented here. Thanks to this I am
sure that an upmost result has been achieved. Further I would like to thank my second supervisor
from the university, Jimme Keizer, whose years of experience resulted in feedback which was of
great help.
Furthermore I would like to thank my supervisor from the company, Edgar Beers. Thanks to his
support I really enjoyed working on my project. I am thankful for the freedom and confidence which
was put in me to conduct my research at the company within the Netherlands and also abroad.
Besides I would like to thank Jan Hulsmann and René Slootweg for their suggestions and feedback.
Obviously I also want to thank my colleagues from the CRP team and the other colleagues from the
procurement department. Thanks to them I had fun coming to the office everyday and especially the
Friday afternoons I will not forget quickly!
Finally I want to thank my parents for their support during my studies and my friends for all the fun I
had during the last years.
Durand Rekko
January 2010
By Durand Rekko vi
Executive Summary Vanderlande Industries (VI) is a Dutch company which provides material handling solutions to
customers all over the world. Within VI around 70% of the turnover is spent on procurement
activities and VI can best be described as a system integrator. VI buys products from different
suppliers and integrates these parts into one system which meets the customers demand.
The procurement department is split up in two parts, namely: Operational Procurement and
Corporate Resale Procurement (CRP). The first department handles products which need an
operation before they can be used and the latter buys products which are directly integrated into the
end system. This research is conducted within the CRP-department.
During the last three years CRP expanded their activities and from an administrative function they
evolved to a department with strategic involvement within the supply chain. During these years they
showed that they can help the decentralized Customer Centers (CC) with their procurement process
of Resale products. Although CRP have booked successes, some CC’s do not yet use the services of
CRP and therefore the following research question is stated for this research.
What cause(s) influence(s) whether CC’s use the services of CRP?
In total there exist 11 CC’s within VI and the scope of this research was set to three of these CC’s. The
research started with an explorative phase in which possible causes were looked for by interviewing
different employees. This resulted in a list of three possible causes which could answer the research
question. These are:
1) The CC’s and CRP have different perceptions of what the consequences of using CRP are (C1).
2) Using CRP does not help CC’s improve their performance (C2)
3) Using CRP conflicts with personal incentives of the CC’s (C3)
To test whether these possible causes are plausible to be a cause, for each possible cause a
proposition is formulated which is tested in the research. Each of the CC’s within the scope is
considered to use CRP to a different level. This fact is used for the formulation of the propositions.
Each proposition investigates whether there is a correlation between the existence of the possible
cause and the degree in which a CC uses CRP. Next to this test, other arguments are gathered during
the execution of the research.
The outcome of the research is that, of the three possible causes, in total there are two which are
plausible to be a cause and one is not. A conclusion is based on two parts. First of all the outcomes of
testing the propositions are used. Secondly the results are discussed by checking the robustness of
the outcomes and by gathering rival theories. Then based on all information available it is concluded
whether a possible cause is considered to really influence the degree in which CC’s use CRP.
First the outcomes of the propositions are discussed. The first proposition is considered to be true
since that the test showed that within the data a correlation between C1 and the degree in which the
CC use CRP exists. The second proposition is tested to be false and also the third proposition was
tested to be false.

By Durand Rekko vii
With respect to the first proposition the results are considered to be robust for the assumptions
made. Besides, no rival theories against this possible cause were identified during the research and
therefore C1 is considered to influence the degree in which a CC’s uses CRP.
Proposition 2 is tested to be false, however the results of this test are not completely robust.
Furthermore there is one rival theory which pleas against C2 and that is that performance is not
explicitly measured within VI. Based on these findings it is concluded that C2 is not plausible to be a
cause.
Finally, proposition 3 is tested to be false. However, this outcome is mainly caused by differences in
reliability within the data. Despite of that the results do show that using CRP is conflicting with the
personal incentives of CC. This is also confirmed by the discussion around the limitations. So based
on the research outcome it is very plausible to assume that using CRP is conflicts with using CRP. The
question whether this influences whether a CC uses CRP or not can not be supported directly by the
research. But since that this seems logic and no evidence for the fact that this would not be the case
exists, it is concluded that C3 is plausible to be a cause.
The research concludes with recommendations for both, the company and further research. The
company is advised to use the findings from this research to improve the situation. With respect to
the scientific field it is suggested to further develop the framework which was developed in this
research. With some improvements to the framework it can also be used within other companies.

By Durand Rekko viii
Contents
ABSTRACT ....................................................................................................................................................... IV
PREFACE ........................................................................................................................................................... V
EXECUTIVE SUMMARY .................................................................................................................................... VI
CONTENTS ..................................................................................................................................................... VIII
1 INTRODUCTION........................................................................................................................................ 1
2 THE COMPANY ......................................................................................................................................... 2
2.1 VANDERLANDE INDUSTRIES ........................................................................................................................... 2
3 RESEARCH DESIGN ................................................................................................................................... 7
3.1 PROBLEM DEFINITION AND RESEARCH QUESTION ............................................................................................... 7
3.2 RESEARCH CHARACTERISTICS & SCOPE ............................................................................................................ 8
3.3 RESEARCH STEPS ......................................................................................................................................... 9
4 IDENTIFY POSSIBLE CAUSES ................................................................................................................... 11
4.1 POSSIBLE CAUSES ...................................................................................................................................... 11
4.2 CAUSAL RELATIONSHIP ............................................................................................................................... 12
5 FORMULATION OF PROPOSITIONS ........................................................................................................ 15
5.1 PROPOSITION 1 ........................................................................................................................................ 15
5.2 PROPOSITION 2 ........................................................................................................................................ 16
5.3 PROPOSITION 3 ........................................................................................................................................ 20
6 METHOD ................................................................................................................................................ 21
6.1 PROPOSITION 1: EFFECTS ........................................................................................................................... 21
6.2 PROPOSITION 2: PERFORMANCE INDICATORS ................................................................................................. 25
6.3 PROPOSITION 3: PERSONAL INCENTIVES ........................................................................................................ 26
7 DATA GATHERING: INTERVIEW TEMPLATES ........................................................................................... 28
7.1 REQUIRED INFORMATION ........................................................................................................................... 28
7.2 PROBLEMS .............................................................................................................................................. 29
7.3 INTERVIEW TEMPLATE ................................................................................................................................ 30
7.4 CRP RANKING .......................................................................................................................................... 31
8 RESULTS ................................................................................................................................................. 32
8.1 RESPONDENTS ......................................................................................................................................... 32
8.2 PROPOSITION 1 ........................................................................................................................................ 32
8.3 PROPOSITION 2 ....................................................................................................................................... 33
8.4 PROPOSITION 3 ........................................................................................................................................ 34
9 DISCUSSION ........................................................................................................................................... 35
9.1 POSSIBLE CAUSE 1 .................................................................................................................................... 35
9.2 POSSIBLE CAUSE 2 .................................................................................................................................... 37
9.3 POSSIBLE CAUSE 3 .................................................................................................................................... 40
9.4 OTHER POSSIBLE CAUSES ............................................................................................................................ 43
10 CONCLUSIONS AND RECOMMENDATIONS ............................................................................................. 45

By Durand Rekko ix
10.1 CONCLUSIONS .......................................................................................................................................... 45
10.2 RECOMMENDATIONS ................................................................................................................................. 47
11 BIBLIOGRAPHY ....................................................................................................................................... 49
12 LIST OF ABBREVIATIONS ........................................................................................................................ 51
13 APPENDIXES ........................................................................................................................................... 52
APPENDIX A: WORKING METHOD CRP ...................................................................................................................... 52
APPENDIX B: PROPOSITION 2 ................................................................................................................................... 54
APPENDIX C : SUPPORTING ACTIVITIES CRP ................................................................................................................ 56
APPENDIX D: LIST OF EFFECTS .................................................................................................................................. 57
APPENDIX E: PERFORMANCE INDICATORS AND PERSONAL INCENTIVES ............................................................................. 58
APPENDIX F: TEMPLATE INTERVIEWS ......................................................................................................................... 60
APPENDIX G: AGREEMENT MATRIX DP&P.................................................................................................................. 61
APPENDIX H: CORRELATION MATRIX PERFORMANCE INDICATORS .................................................................................... 62
APPENDIX I: MERGING FACTORS ............................................................................................................................... 63
APPENDIX J: TABLE WITH VECTORS ............................................................................................................................ 64
APPENDIX K: RELIABILITY GRAPHS ............................................................................................................................. 65
APPENDIX L: CORRELATION MATRIX PERSONAL INCENTIVES ............................................................................................ 67
APPENDIX M: VECTORS OF PERSONAL INCENTIVES........................................................................................................ 68
APPENDIX N: POSTER ............................................................................................................................................. 69

1 Introduction This research investigates which causes are plausible to influence whether CC’s make use of the
services of CRP. This report explains how the research is executed, what conclusions are drawn and
why.
First of all, in the next chapter, a description of the company is given and here all relevant
background information for the conduction of the research is given. Also the current situation of the
CRP department is discussed. In chapter three the research design is discussed after that the problem
definition is stated. From this a research question is formulated and choices regarding the type of
research are made. Finally the scope is set and the different research steps to come to a conclusion
are presented.
The following chapters discuss each time one of the steps which resulted from the research design.
First chapter four identifies causes which possibly might be an answer to the research question. In
chapter five for each of the possible causes identified a proposition is formulated which is tested in
the research. Chapter six discusses by which method these propositions are tested and chapter seven
explains how the data required for testing the propositions is gathered.
Once the data is collected the propositions can be tested and this is done in chapter eight. Here all
propositions are tested to be true or false. Then in chapter nine these outcomes are discussed by
looking at the robustness and reliability of the outcomes. Here also possible rival theories against the
causes are discussed. Finally in chapter ten it is concluded which possible causes are considered to be
an answer to the research question and here also further recommendations are given.
By Durand Rekko 2
2 The company The Master Thesis is conducted at the company named Vanderlande Industries (VI). This chapter
starts with some background information on the company and after that the department from which
the research is conducted is discussed.
2.1 Vanderlande Industries
Vanderlande Industries provides automated material handling systems and related services. The
company was founded in 1949 by E. van der Lande. Over the last 60 years, Vanderlande Industries
has evolved from a machine factory towards what it is now. Nowadays VI is a profitable, fast growing
and international company. Its mission is to support their customers worldwide in significantly
improving the competitive position of their customers by designing, implementing and servicing
automated material handling systems.
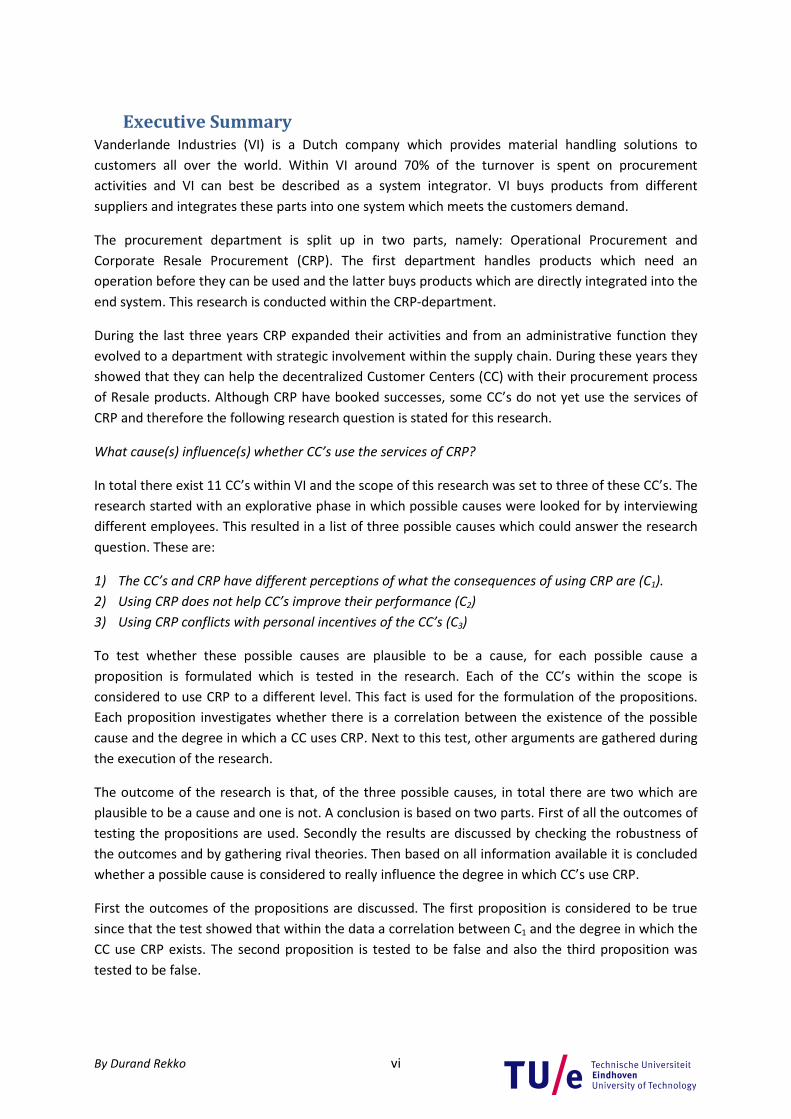
Currently there are 1900 employees enrolled by Vanderlande Industries which is the result of a rapid
growth during the last five years. During the financial year of 2009 VI realized a turnover of over €600
million, the trend of the turnover over the last few years is represented in Figure 1.
Figure 1: Netto sales Vanderlande Industries (Vanderlande Industries, 2008)
Within VI two types of sales are distinguished, namely: Major projects and normal contracts. Once in
a while VI attracts a major project which results in very high sales volumes for the following years.
The baggage handling system in Heathrow Londen (T5) is a good example of this. This project alone
caused all of the ‘red’ sales in Figure 1 in the years 2003 to 2007. It can be concluded that without
these major projects, sales grow rather stable and including the major projects the development
fairly fluctuates, but increases.
2.1.1 Business units and organization structure
VI consists of four different Business Units namely Distribution, Baggage handling, Express parcel and
Service. Each of these is briefly discussed to get an idea of the market in which VI operates.
• Baggage Handling Systems: VI designs and builds baggage handling systems (BHS) for
Airports. The range of products varies in sizes and technologies to be able to fulfill demand
varying from small airports to hubs like Schiphol Airport and London Heathrow. Worldwide VI
0
100
200
300
400
500
600
700
19
99
20
00
20
01
20
02
20
03
20
04
20
05
20
06
20
07
20
08
20
09Ne
t S
ale
s (m
illi
on
s o
f e
uro
)
Year
Major projects
Normal projects

By Durand Rekko 3
implemented more than 350 BHS using a wide range of technologies to create customer-
specific systems.
• Distribution: This business unit focuses on offering customized systems for order fulfillment
and sortation in distribution centers. The VI systems are designed based on the ‘goods to
man’ concept to eliminate walking distances and optimize the used space.
• Express Parcel: VI offers the market’s widest range of management information and
automated sortation systems for parcels and documents. Solutions differ from depots with
throughput of some thousands of parcels per day to the world’s largest automated sorting
hub with a capacity of over 200.000 parcels per hour. In this area VI is leading systems
partner.
• Service: VI offers preventive and corrective services to ensure the required performance is
achieved. Service ranges from supply spare parts to a 24/7 on-site presence. The demand for
good service is increasing rapidly which is represented in a massive grow of this BU in the last
couple of years.
The distribution of the turnovers of the four BU’s is represented in Figure 2.
Figure 2: Order intake VI during 2004-2008 based on turnover
As shown by Figure 2, BHS is the biggest BU. The service BU is the smallest, but this BU is rather new.
Until 5 years ago VI did not do any services and although this BU is still rather small, this BU grows
the fastest and has the largest contribution margin to the profit of VI.
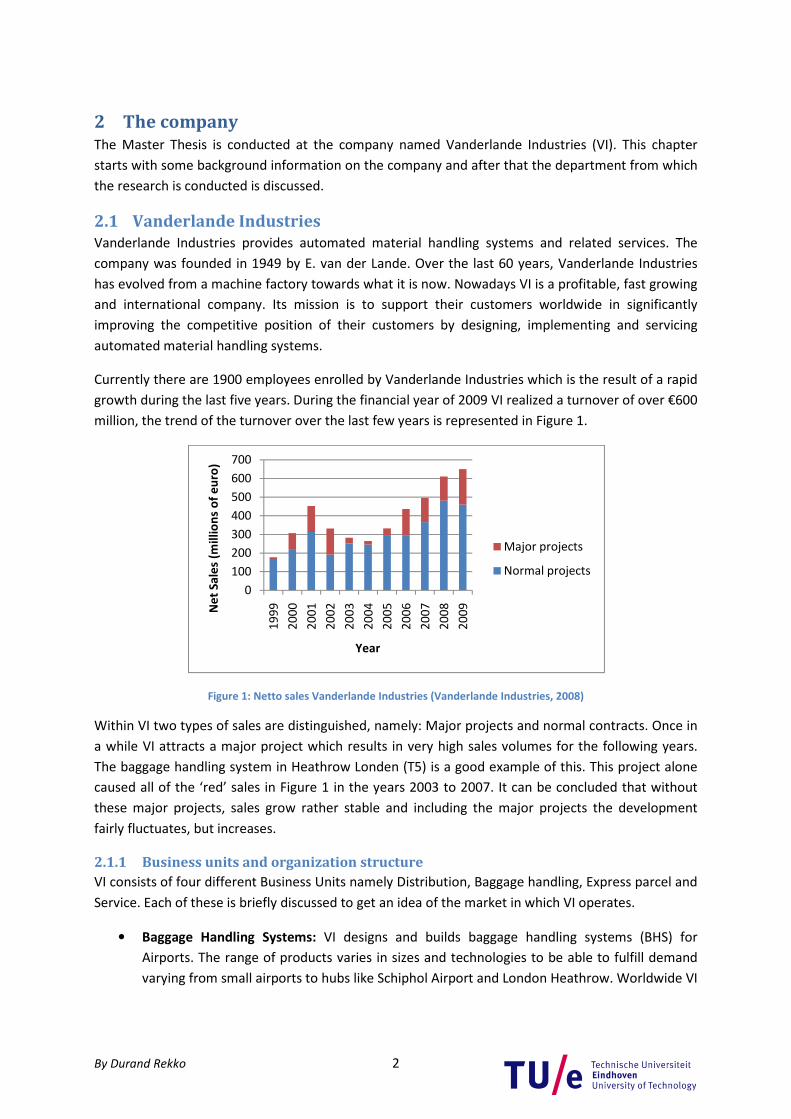
2.1.2 Organization structure and business process
Within VI two types of departments can be distinguished, namely Customer centers and Supply
centers. Customer centers (CC) are the departments in which projects are sold and performed. The
projects conducted within a CC change over time which makes the CC rather dynamic of nature. The
Supply centers are the supporting departments which are rather static. Each Customer center and
Supply center falls directly under the responsibility of one of the board members, as represented in
Figure 3.
41%
20%
26%
13%BHS
Distribution
Express parcel
Service
By Durand Rekko 4
Figure 3: Organization structure VI
First the organization structure of the Customer centers is discussed, and after that the Supply
centers are discussed.
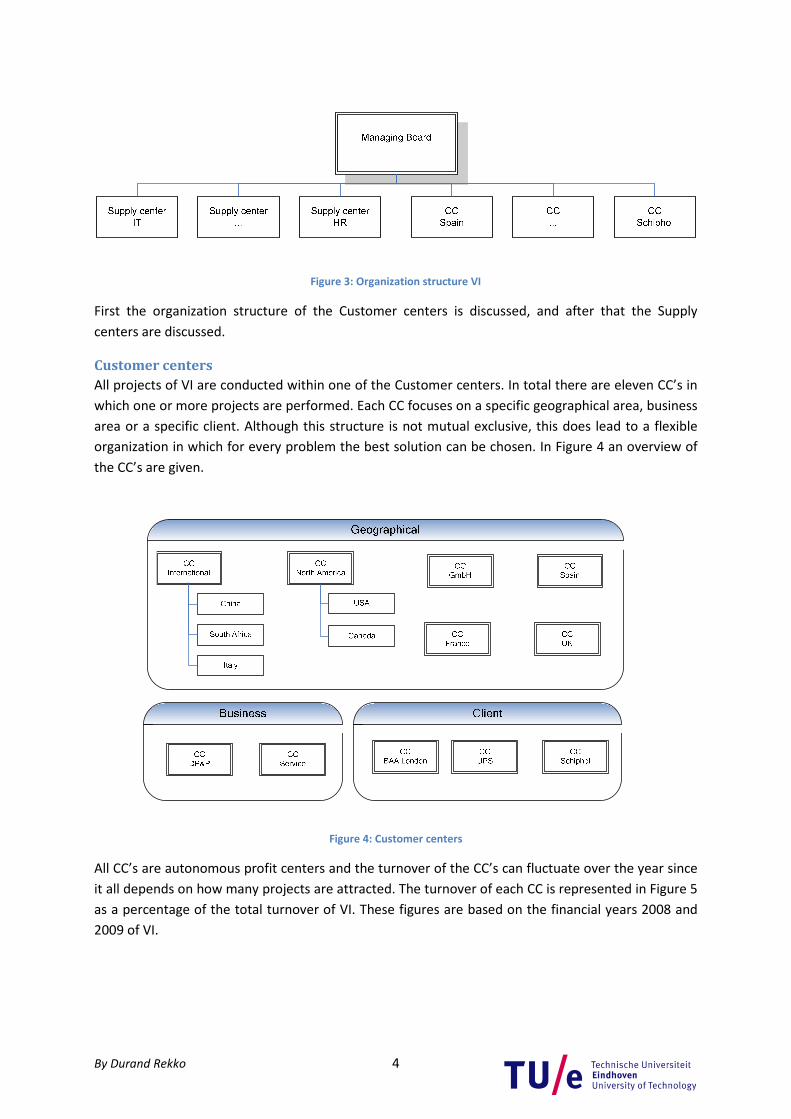
Customer centers
All projects of VI are conducted within one of the Customer centers. In total there are eleven CC’s in
which one or more projects are performed. Each CC focuses on a specific geographical area, business
area or a specific client. Although this structure is not mutual exclusive, this does lead to a flexible
organization in which for every problem the best solution can be chosen. In Figure 4 an overview of
the CC’s are given.
Figure 4: Customer centers
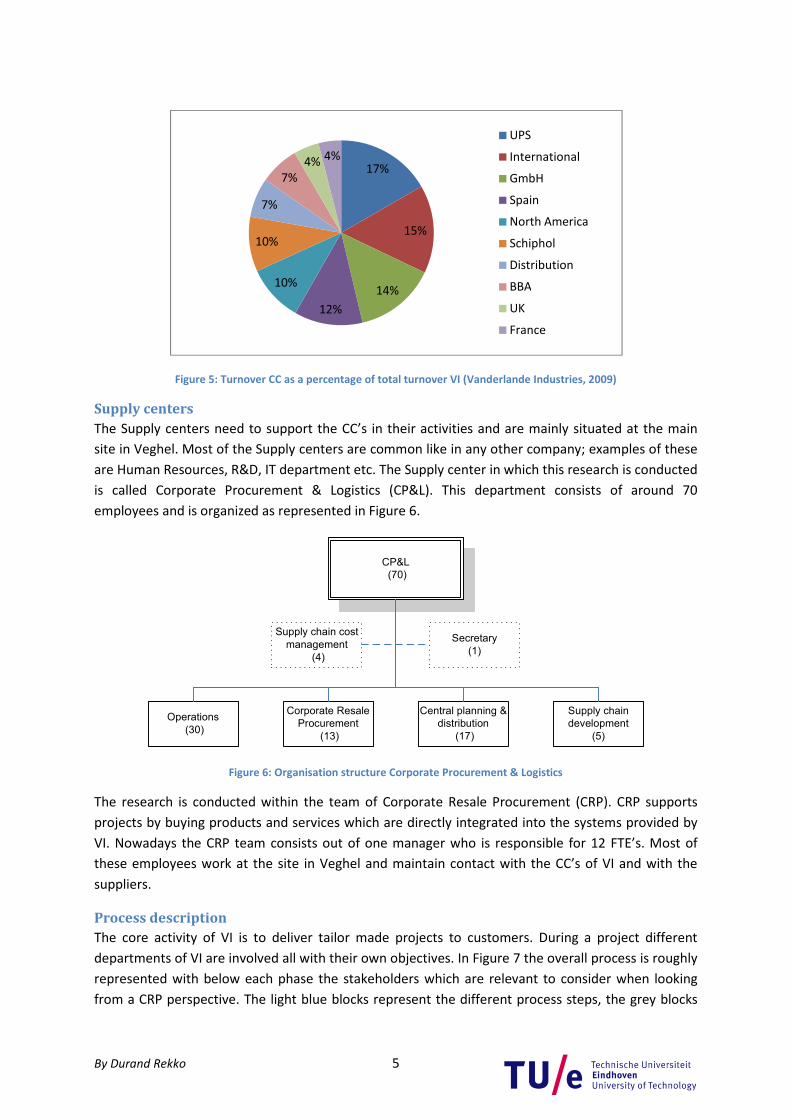
All CC’s are autonomous profit centers and the turnover of the CC’s can fluctuate over the year since
it all depends on how many projects are attracted. The turnover of each CC is represented in Figure 5
as a percentage of the total turnover of VI. These figures are based on the financial years 2008 and
2009 of VI.
By Durand Rekko 5
Figure 5: Turnover CC as a percentage of total turnover VI (Vanderlande Industries, 2009)
Supply centers
The Supply centers need to support the CC’s in their activities and are mainly situated at the main
site in Veghel. Most of the Supply centers are common like in any other company; examples of these
are Human Resources, R&D, IT department etc. The Supply center in which this research is conducted
is called Corporate Procurement & Logistics (CP&L). This department consists of around 70
employees and is organized as represented in Figure 6.
CP&L
(70)
Operations
(30)
Corporate Resale
Procurement
(13)
Central planning &
distribution
(17)
Supply chain
development
(5)
Supply chain cost
management
(4)
Secretary
(1)
Figure 6: Organisation structure Corporate Procurement & Logistics
The research is conducted within the team of Corporate Resale Procurement (CRP). CRP supports
projects by buying products and services which are directly integrated into the systems provided by
VI. Nowadays the CRP team consists out of one manager who is responsible for 12 FTE’s. Most of
these employees work at the site in Veghel and maintain contact with the CC’s of VI and with the
suppliers.
Process description
The core activity of VI is to deliver tailor made projects to customers. During a project different
departments of VI are involved all with their own objectives. In Figure 7 the overall process is roughly
represented with below each phase the stakeholders which are relevant to consider when looking
from a CRP perspective. The light blue blocks represent the different process steps, the grey blocks
17%
15%
14%
12%
10%
10%
7%
7%
4% 4%
UPS
International
GmbH
Spain
North America
Schiphol
Distribution
BBA
UK
France

By Durand Rekko 6
represent stakeholders from a CC and the dark blue blocks represent stakeholders from a Supply
center.
Figure 7: Business process of VI
Identify market
The Business Development Manager (BDM) is responsible for attracting new projects and constantly
this person is looking for new possibilities to sell a project. The first phase goes over into the
tendering phase once the BDM has made the desires of the customer explicit.
Tendering
Here the desires of the customer are converted into a concrete proposal with a corresponding design
plan. The Sales Engineer (SE) is the one who works out the tender in detail to ensure that, later on,
the proposed plan can actually be executed within the proposed budget. In this phase CRP is
involved to realize a competitive price. The tendering phase is finished once the project has been
won or lost by VI.
Realization
When the project is won by VI, the project is handed over to a Project Manager (PM). The PM is
responsible for the actual realization of the project. His objective is to deliver the project within time,
meeting the quality requirements and at minimal costs. The PM needs to coordinate all required
actions between involved parties. In this phase CRP can support the PM with the buying process of
Resale products and services.
Service
Once the customer has accepted the end product delivered by VI, the product is officially handed
over to the customer and usually the Service department of VI becomes the service partner of the
customer.
With this background information it is now possible to take a closer look at the problem within VI
which will be done in the next chapter.
By Durand Rekko 7
3 Research design The aim of this chapter is to present the research design for the conducted research. It starts with
the formulation of the problem definition and research question. Then the research it characteristics
are made explicit and finally research steps for the execution of the research are given.
3.1 Problem definition and research question
Three years ago CRP consisted out of 3 employees and their main activity was to handle the
purchasing orders (PO) from the customer centers. This was primarily only an administrative function
and the Customer centers did most of the purchasing work themselves. This situation resulted in
several negative outcomes such as the fact that VI-projects became competitors of each other when
buying at the same supplier. Three years ago the board became conscious about the fact that resale
products form a significant part of the turnover, for example, during the financial year 2009 around
35% to 40% of the total turnover of VI was spent on resale products (Vanderlande Industries, 2009).
Next to that the board realized that room for improvement existed in this area which could be
realized by centralizing certain procurement activities. Therefore, three years ago, CRP received the
assignment to improve the situation by expanding their activities.
This was done by implementing a new way of working as explained in appendix A. After a few years,
the experience is that the new work method can lead to significant improvements for the customer
centers and currently some of the CC’s adapted the working method. However, there are also some
CC’s which do not yet use the services of CRP effectively. Furthermore, VI pretends to be a company
in which entrepreneurship is seen as an important factor. A drive to win, doing better every day and
being innovative are part of the core values carried out by the company. However, this attitude can
not be recognized when looking at the relation between CC’s and CRP. The Customer Centers can be
described as autonomous and profit focused departments. CRP is a supply center which supports the
CC’s in their activities and several examples of the last few years illustrated that CRP can help CC’s
improve their performance by assisting them with the buying process of resale products. Thus, one
might expect a situation in which CC’s search for better solutions and that the successful work
method of CRP is sold by it self. However, in reality this is not yet the case and differences between
the CC’s in the degree in which they use CRP exist. Therefore the following problem definition is
formulated:
Some CC’s do not yet use the services offered by CRP which help improve the company its
performance.
This problem is identified and CRP wants to know how this situation can be improved. To be able to
improve the situation it must be clear which causes influence whether a CC uses CRP. However,
before continuing it is mentioned that the research definition contains one important assumption.
This is that using CRP actually helps improving the company performance. Investigating this
assumption would be a study on it self and therefore this assumption is made. So the purpose of this
research is to find out what the causes are for not using CRP and therefore the following research
question is formulated:
What cause(s) influence(s) whether CC’s use the services of CRP?
By Durand Rekko 8
3.2 Research characteristics & Scope
Before formulating the research steps by which the research question is answered, the research its
characteristics and scope are defined.
3.2.1 Research characteristics
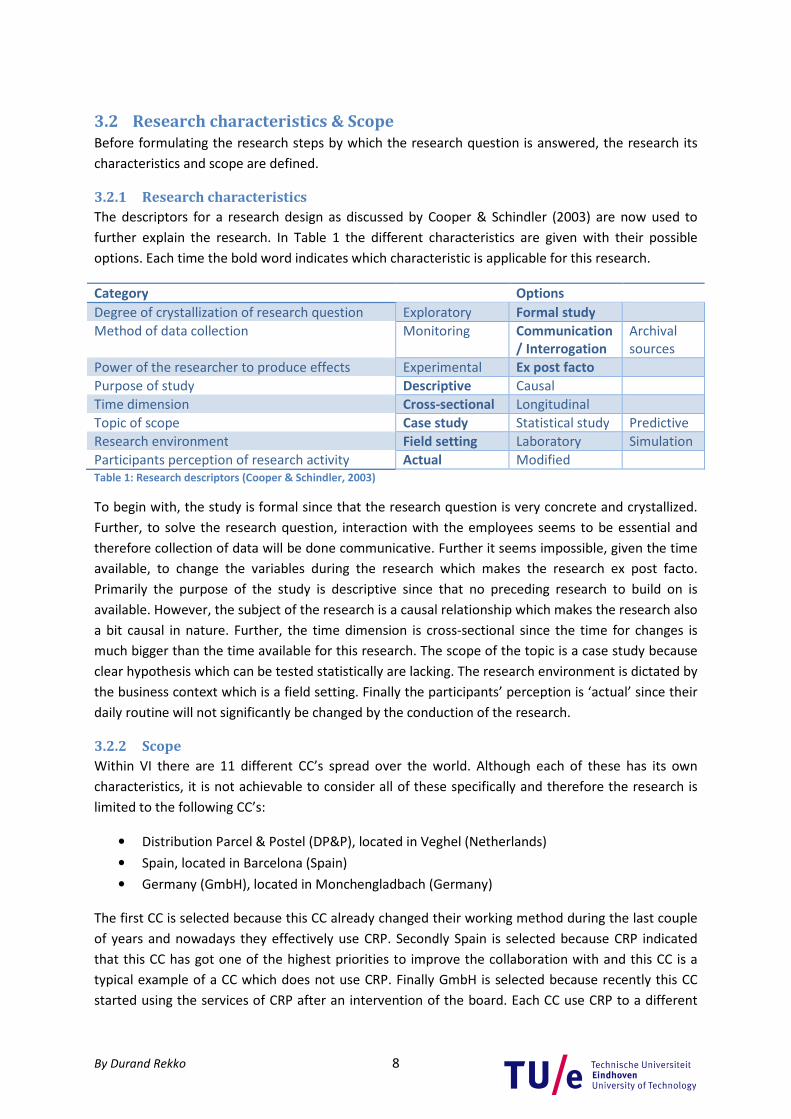
The descriptors for a research design as discussed by Cooper & Schindler (2003) are now used to
further explain the research. In Table 1 the different characteristics are given with their possible
options. Each time the bold word indicates which characteristic is applicable for this research.
Category Options
Degree of crystallization of research question Exploratory Formal study
Method of data collection Monitoring Communication
/ Interrogation
Archival
sources
Power of the researcher to produce effects Experimental Ex post facto
Purpose of study Descriptive Causal
Time dimension Cross-sectional Longitudinal
Topic of scope Case study Statistical study Predictive
Research environment Field setting Laboratory Simulation
Participants perception of research activity Actual Modified
Table 1: Research descriptors (Cooper & Schindler, 2003)
To begin with, the study is formal since that the research question is very concrete and crystallized.
Further, to solve the research question, interaction with the employees seems to be essential and
therefore collection of data will be done communicative. Further it seems impossible, given the time
available, to change the variables during the research which makes the research ex post facto.
Primarily the purpose of the study is descriptive since that no preceding research to build on is
available. However, the subject of the research is a causal relationship which makes the research also
a bit causal in nature. Further, the time dimension is cross-sectional since the time for changes is
much bigger than the time available for this research. The scope of the topic is a case study because
clear hypothesis which can be tested statistically are lacking. The research environment is dictated by
the business context which is a field setting. Finally the participants’ perception is ‘actual’ since their
daily routine will not significantly be changed by the conduction of the research.
3.2.2 Scope
Within VI there are 11 different CC’s spread over the world. Although each of these has its own
characteristics, it is not achievable to consider all of these specifically and therefore the research is
limited to the following CC’s:
• Distribution Parcel & Postel (DP&P), located in Veghel (Netherlands)
• Spain, located in Barcelona (Spain)
• Germany (GmbH), located in Monchengladbach (Germany)
The first CC is selected because this CC already changed their working method during the last couple
of years and nowadays they effectively use CRP. Secondly Spain is selected because CRP indicated
that this CC has got one of the highest priorities to improve the collaboration with and this CC is a
typical example of a CC which does not use CRP. Finally GmbH is selected because recently this CC
started using the services of CRP after an intervention of the board. Each CC use CRP to a different

By Durand Rekko 9
degree. The degree in which the three CC’s use CRP effectively, as considered by CRP, is described as:
DP&P > GmbH > Spain.
As shown in the process description, there are two phases in which CRP is involved, namely tendering
and realization. Therefore the research is limited to these two parts of the business process. Within
the CC’s there are several parties which are involved with the projects. However, as discussed in
paragraph 2.1.2 the main stakeholders are the Sales Engineers and the Project Manager and
therefore only these two stakeholders are considered. Besides these two also the management of
the CC’s is interviewed to be able to place the answers from the SE and PM within the right
management perspective.
3.3 Research steps
Based on the properties of the research and the defined scope, steps to answer the research
question are now formulated. Each of the steps is briefly explained and in the rest of the report each
chapters discusses one of these steps.
Step 1: Identify possible causes
First of all possible causes need to be gathered. Therefore step one consists of gathering possible
causes which then can be tested. Next to that this chapter discusses how the possible causes can be
tested to find out whether they are actually a cause.
Step 2: Formulation of propositions
For each possible cause identified in step 1 a proposition is formulated which will be tested to be
false or true. Step 2 results in a list of propositions with can be tested.
Step 3: Method
In Step 3 the method for testing the propositions is developed. It is explained how the required data
for testing is gathered and after step 3 it should be clear how the propositions are tested.
Step 4: Data gathering
Step 4 explains how the data, required for testing the propositions, is gathered. This steps results in
an interview template which is used for the interviews by which the data is gathered.
Step 5: Analyze results
In Step 5 the retrieved data is analyzed and the propositions are tested. For each proposition it is
stated whether this proposition is true or not.
Step 6: Discussion
This step takes the outcomes from step 5 as a base and discusses the outcomes. The underlying
assumptions are considered and the robustness of the outcomes is determined. Also other facts
retrieved during the research are discussed.
Step 7: Conclusions and Recommendations
Based on the outcomes of the tests and the discussion it is concluded which possible causes actually
are causes. Next to that recommendations are given for further research and possible actions within
VI.
By Durand Rekko 10
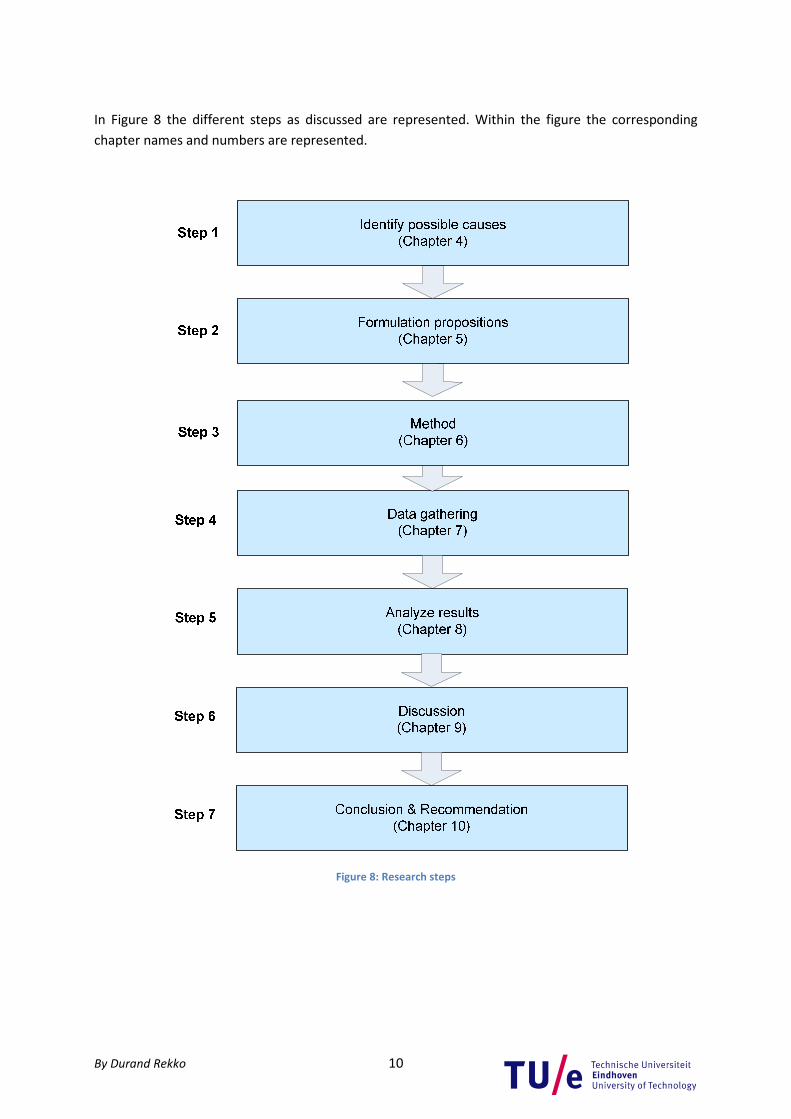
In Figure 8 the different steps as discussed are represented. Within the figure the corresponding
chapter names and numbers are represented.
Figure 8: Research steps
By Durand Rekko 11
4 Identify possible causes This chapter aims to find possible causes which might be an answer to the research question. This
results in a list of possible causes and further it is also explained how a causal relationship can be
tested.
4.1 Possible causes
Preceding to this research a research proposal was written (Rekko, 2009). In this research proposal
the problem definition, as stated in the previous chapter, was formulated. To establish the problem
definition, the researcher interviewed 25 employees from VI. In total 13 of these were employees
from the CP&L department and the other 12 were employees within different CC’s. Functions varied
from buyers of CRP, to project managers of the CC in Spain to a member from the management
board of VI. Based on the interviews a wide range of problem signals were identified and all signals
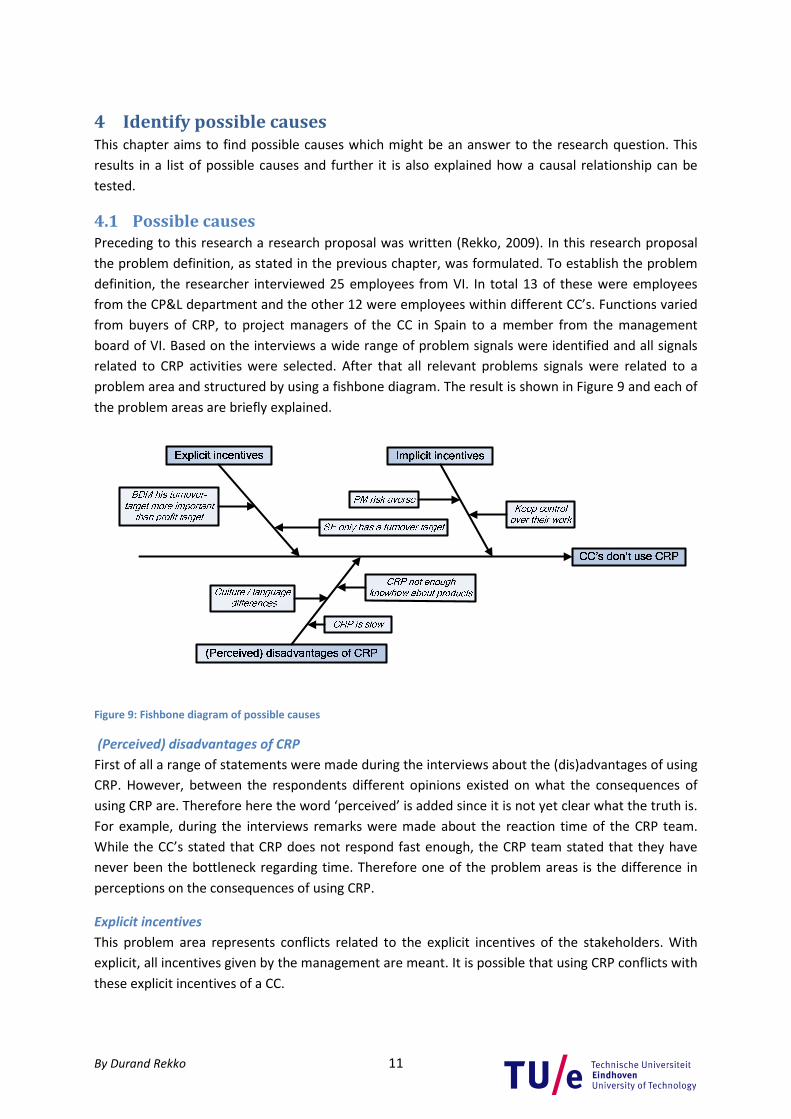
related to CRP activities were selected. After that all relevant problems signals were related to a
problem area and structured by using a fishbone diagram. The result is shown in Figure 9 and each of
the problem areas are briefly explained.
Figure 9: Fishbone diagram of possible causes
(Perceived) disadvantages of CRP
First of all a range of statements were made during the interviews about the (dis)advantages of using
CRP. However, between the respondents different opinions existed on what the consequences of
using CRP are. Therefore here the word ‘perceived’ is added since it is not yet clear what the truth is.
For example, during the interviews remarks were made about the reaction time of the CRP team.
While the CC’s stated that CRP does not respond fast enough, the CRP team stated that they have
never been the bottleneck regarding time. Therefore one of the problem areas is the difference in
perceptions on the consequences of using CRP.
Explicit incentives
This problem area represents conflicts related to the explicit incentives of the stakeholders. With
explicit, all incentives given by the management are meant. It is possible that using CRP conflicts with
these explicit incentives of a CC.
By Durand Rekko 12
Implicit incentives
Besides explicit incentives, all people have their own implicit incentives. It can be the case, for
example, that the CC’s want to keep control over their work. Outsourcing the procurement activities
might then conflict with these personal incentives.
Based on this analyses and the iterative process during the research that took place after this
analysis, three possible causes are formulated. These are now given and each of these is further
clarified.
1) The CC’s and CRP have different perceptions of what the consequences of using CRP are (C1).
2) Using CRP does not help CC’s improve their performance (C2)
3) Using CRP conflicts with personal incentives of the CC’s (C3)
4.1.1 Possible cause 1 (C1)
C1 supposes that differences in perceptions of the consequences between CC and CRP are a cause.
The assumption behind this is the following. The consequences of using CRP, seen by CRP, would
improve the performance of CC. So the more a CC thinks similar about the consequences, the more a
CC would see that using CRP will improve their performance, the more they would use CRP.
However, if a CC thinks the contrary of the consequences, this could lead to the behavior of not using
CRP. Therefore a symmetrical / positive relationship (Cooper & Schindler, 2003) between ‘the level of
agreement between a CC and CRP’ and ‘the degree in which a CC uses CRP’ is expected.
4.1.2 Possible cause 2 (C2)
While C1 focuses on the perception of the effects, C2 looks at how using CRP affects the performance
of a CC. The idea behind C2 is that agreement on the consequences can exist but that for one CC
using CRP is bad for their performance while for another CC using CRP improves their performance.
Therefore a symmetric relationship is expected between ‘the degree in which CRP helps to improve
the performance of a CC’ and ‘the degree in which a CC uses CRP’.
4.1.3 Possible cause 3 (C3)
The third possible cause, C3, suggests that using CRP conflicts with the personal incentives of CC’s.
Imagine for example that the work for CC’s becomes more difficult when CRP is used but that the
CC’s their personal incentive is that the work needs to be easy. Then this situation will probably leads
to a situation in which a CC does not use CRP. Here also a symmetrical relation between the ‘degree
in which the consequences of using do not conflict’ and ‘the degree in which a CC uses CRP’ is
expected.
These three are the possible causes that are investigated by this research. For each of these it will be
investigated whether it is likely that a possible cause actually is a cause for the research question.
Here each time the possible cause is the independent variable and the dependent variable is ‘the
degree in which a CC uses CRP’. But to be able to test these relationships it must become clear how a
causal relationship can be tested.
4.2 Causal relationship
Within the literature two types of answers to the question how causality can be made plausible,
exist. One group focuses on hypothesis and statistics while the other focuses on internal logic. Each
By Durand Rekko 13
of these methods is now explained in more detail and it is also discussed to what extent these
methods can be used for this research.
4.2.1 Internal logic
On one hand there is a group which plea for more use of case studies instead of formal research. For
instance Johnson et al. (1999) and Hillebrand et al. (2001) suggest that a causal relation can be tested
based on internal logic. By intensively investigating one case it must become clear how the
mechanisms really result in a causal relationship. They state that by using this method real causal
relationship is investigated instead of statistical correlations.
Yin (2003) discusses three strategies how conclusions can be drawn when conducting a case study.
These are:
1. Rely on theoretical propositions
2. Think about rival explanations
3. Develop a case description
The first strategy suggest to state propositions at the beginning of the research which at the end are
judged to be true or false. The second method suggests that it is valuable to think of other possible
explanations for the founded results. So once the results are obtained, which other possible causes
exist? Finally, option three is the less preferable according to Yin (2003) and it is suggested that this
strategy should only be used if the first two are impossible. For this research this is not the case and
therefore this strategy is left aside. So in this research only the first two strategies are used.
4.2.2 Statistical method
On the other hand there is the statically oriented method supported by, for instance, Cooper &
Schindler (2003). In their book they give three types of evidence which should be looked for when
testing a causal relationship between A and B, namely:
1. Co-variation between A and B;
2. Time order of events moving in the hypothesized direction;
3. No other possible causes.
The statistical method suggests that clear hypotheses, which are developed by theory, must be
formulated. This method is formal and causal in nature. Furthermore it is necessary that research is
longitudinal to provide the second type of evidence. Supporters of the statistical method pretend
that the statistical method is the only way to realize results which can be generalized.
As stated in paragraph 3.2.1, this research is cross-sectional and conducted in a field setting. This
makes it impossible to provide the second and third type of evidence of the list of Cooper & Schindler
(2003). Therefore this research can only look for existence of correlations. This is done by defining
and testing propositions which presume correlations between the dependent and independent
variables.
So literature provides two methods for testing a causal relationship. Within this research a
combination is used. First of all propositions are formulated and tested which look for correlation
between the dependent and independent variable. This is a combination of both methods. Once

By Durand Rekko 14
these are tested, possible rival theories are discussed as suggested by the internal logic method.
Finally, based on the test of the propositions and the rival theories a conclusion is drawn on whether
a plausible cause is considered to be an answer to the research question or not.
Finally one important remark must be made regarding causal relationships. As said by Cooper and
Schindler (2003): ‘No one can ever be certain that variable A causes variable B, one can gather some
evidence that increases the belief that A leads to B’. So a real ‘proof’ can never be given, but the
research aims to find evidence to make it as plausible as possible that a possible cause is actually a
cause.
By Durand Rekko 15
5 Formulation of propositions This chapter formulates the propositions that are tested in this research. For each possible cause, as
identified in the previous chapter, one proposition is defined. The propositions focus on finding
correlations between the dependent en independent variables.
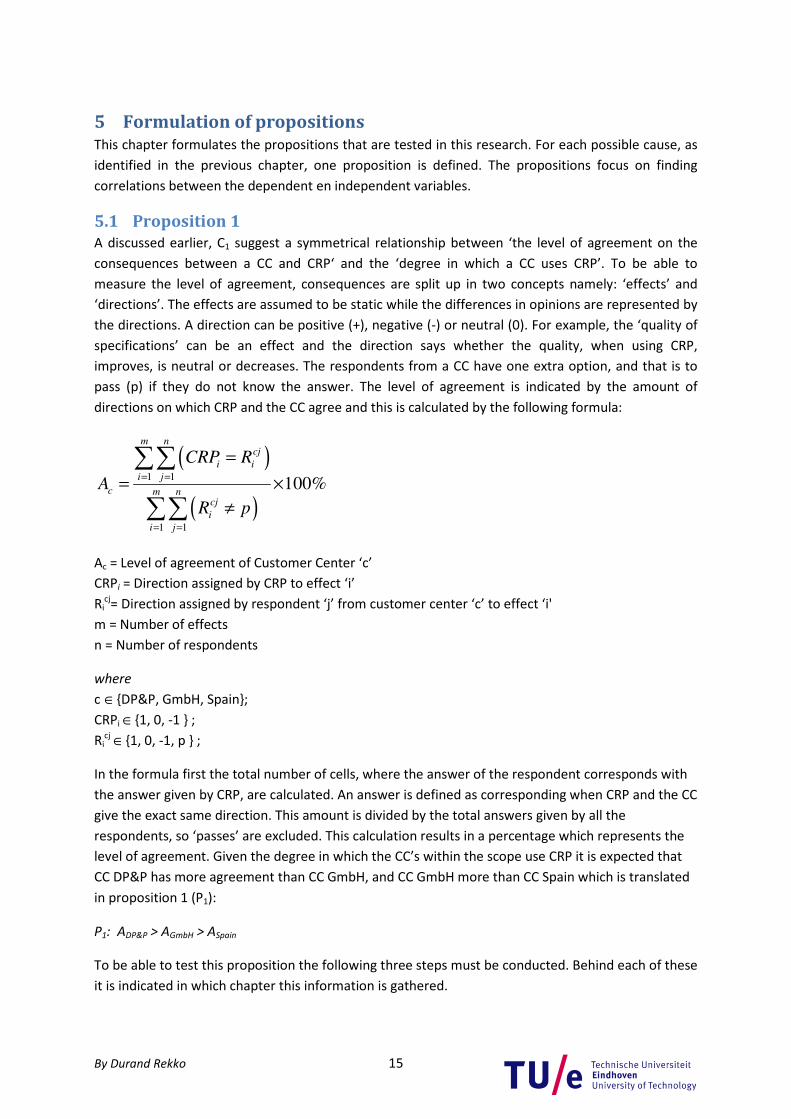
5.1 Proposition 1
A discussed earlier, C1 suggest a symmetrical relationship between ‘the level of agreement on the
consequences between a CC and CRP‘ and the ‘degree in which a CC uses CRP’. To be able to
measure the level of agreement, consequences are split up in two concepts namely: ‘effects’ and
‘directions’. The effects are assumed to be static while the differences in opinions are represented by
the directions. A direction can be positive (+), negative (-) or neutral (0). For example, the ‘quality of
specifications’ can be an effect and the direction says whether the quality, when using CRP,
improves, is neutral or decreases. The respondents from a CC have one extra option, and that is to
pass (p) if they do not know the answer. The level of agreement is indicated by the amount of
directions on which CRP and the CC agree and this is calculated by the following formula:
( )
( )
1 1
1 1
100%
m ncj
i i
i j
c m ncj
i
i j
CRP R
A
R p
= =
= =
=
= ×
≠
∑∑
∑∑
Ac = Level of agreement of Customer Center ‘c’
CRPi = Direction assigned by CRP to effect ‘i’
Ricj= Direction assigned by respondent ‘j’ from customer center ‘c’ to effect ‘i'
m = Number of effects
n = Number of respondents
where
c ∈{DP&P, GmbH, Spain};
CRPi ∈{1, 0, -1 } ;
Ricj
∈{1, 0, -1, p } ;
In the formula first the total number of cells, where the answer of the respondent corresponds with
the answer given by CRP, are calculated. An answer is defined as corresponding when CRP and the CC
give the exact same direction. This amount is divided by the total answers given by all the
respondents, so ‘passes’ are excluded. This calculation results in a percentage which represents the
level of agreement. Given the degree in which the CC’s within the scope use CRP it is expected that
CC DP&P has more agreement than CC GmbH, and CC GmbH more than CC Spain which is translated
in proposition 1 (P1):
P1: ADP&P > AGmbH > ASpain
To be able to test this proposition the following three steps must be conducted. Behind each of these
it is indicated in which chapter this information is gathered.

By Durand Rekko 16
1 Define effects (chapter 6)
2 CRP assigning direction to effects (chapter 7)
3 CC’s assigning direction to effects (chapter 7)
Steps 1 to 3 will result in a matrix as represented in Figure 10. If this matrix is used as an example the
level of agreement could be calculated, which would be 60%1. Finally one important remark must be
made regarding this method and that is that this method implicitly assumes that the difference
between a + and – is equally important as a + and 0 since both are interpreted as a disagreement.
When discussing the outcomes, the robustness of this assumption will be tested.
Figure 10: Example matrix of proposition 1
5.2 Proposition 2
This proposition tries to find out whether there is a correlation between ‘the level in which the
consequences affect the performance of a CC positively’ and ‘the degree in which a CC uses CRP’.
Therefore two aspects should be investigated, namely the ‘consequences’ and the ‘performance of a
CC’.
For the first of these two aspects, the consequences, simply the consequences as gathered for
propositions 1 are used. However if the level of agreement within proposition 1 is not 100%, a
problem arises, namely the question which directions should be selected; those of the CC’s or those
seen by CRP? Which directions should be used depends on who is more likely to change their
opinion; CRP or CC? It is decided to select CRP their opinion since that CC’s are more likely to change
their opinion regarding the directions. This has already happened with two CC’s in the past. Each
time at the end the CC adapted the opinion of CRP. Besides, this choice is in line with the principal
purpose of the research; finding out how CRP can improve the situation which implicitly assumes
that CRP’s directions are correct. Finally it is remarked that because of this, proposition 2 is a
conditional test under the assumption that agreement exists.
The second aspect is harder to model since that VI is a project organization which is very dynamic
and therefore it is unclear how performance can be measured. Each project is different in nature and
no explicit performance measures within VI to measure ‘performance’ exist. So it cannot be
determined how the performance actually is affected and therefore this aspect is measured on a
more abstract level. The CC’s are asked to indicate to what extent certain performance indicators are
relevant when measuring their performance and which are not. How this exactly will be done, is
6100% 60%
10exampleA = × =
SE1 agrees on 3 effects, the other respondents each agree on 1 effect and together this results in a 6.
Effe
ct 1
Effe
ct 2
Effe
ct 3
Effe
ct 4
Effe
ct 5
CRP 1 -1 1 1 1
SE1 1 -1 1
SE2 1 0 -1
PM1 1 -1
PM2 1 -1

By Durand Rekko 17
discussed later. For now it is important to notice that for testing proposition 2 not the performance
itself is used for the model, but that this aspect is modeled by the relative importance of
performance indicators.
Since we are looking to the effect of one aspect on the other, the two aspects are combined in a
matrix as represented in Figure 11. Both aspects are used to form one of the axes.
Figure 11: Initial matrix
In this matrix, Area III then shows how the consequences affect the Performance indicators. Finally,
when it is clear how area III can be transformed into one value, which indicates the degree in which
the Area II affects Area I positively, the correlation with the degree in which CC’s use CRP can be
tested. Now it is explained how Area I and III are filled to come to one value which represents how
the consequences affect positively the Performance indicators. Finally the proposition which is tested
is formulated.
Area I: The performance indicators
As stated before, area I is represented by a list of performance indicators so first of all this list should
be gathered. Once a complete list is obtained the question is how this list of Performance indicators
is used for area I. Cooper & Schindler (2003) suggest two possible approaches, namely: Rating scales
and ranking scales. Within both methods different variants exist and for this research the ‘forced
ranking method’ is used. In this method respondents are forced to rank all items from most
important to least important. The term ‘forced’ indicates that items cannot be on the same rank. This
method is selected because it results in unambiguous results and prevents that respondents can
avoid answering the question. On top of that this also results in outcomes for each CC which can
easily be compared. The forced ranking method results in a ranking for each respondent. If, for
example, there are 10 items then the highest item gets 10 points, the second highest gets 9 points
etc. In Figure 12 an example is given where two Sales Engineers were asked to rank 5 Performance
indicators.
Figure 12: example of a ranking
Here SE 1 ranked Time as most important and Profit as least important. SE 2 thought that Costs is the
most important performance indicator and that Learning is the least important. This way for each
SE 1 SE 2
Profit 1 3
Time 5 4
Costs 4 5
Learning 3 1
satisfaction 2 2
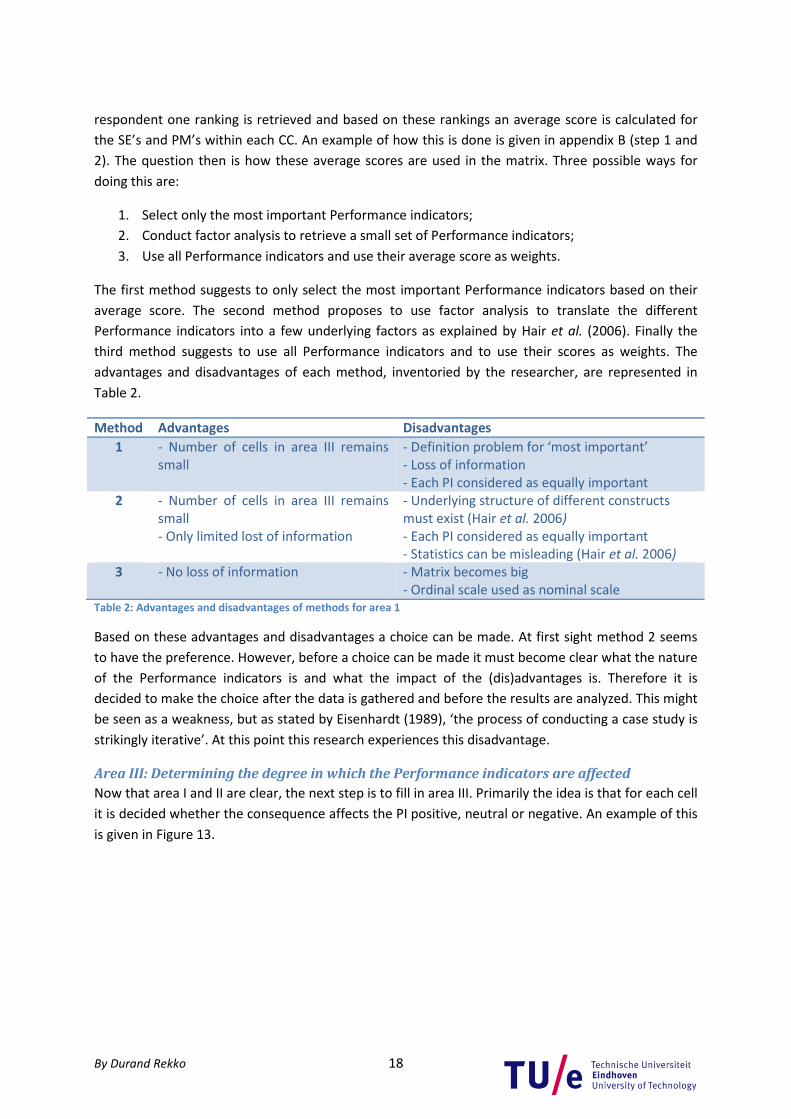
By Durand Rekko 18
respondent one ranking is retrieved and based on these rankings an average score is calculated for
the SE’s and PM’s within each CC. An example of how this is done is given in appendix B (step 1 and
2). The question then is how these average scores are used in the matrix. Three possible ways for
doing this are:
1. Select only the most important Performance indicators;
2. Conduct factor analysis to retrieve a small set of Performance indicators;
3. Use all Performance indicators and use their average score as weights.
The first method suggests to only select the most important Performance indicators based on their
average score. The second method proposes to use factor analysis to translate the different
Performance indicators into a few underlying factors as explained by Hair et al. (2006). Finally the
third method suggests to use all Performance indicators and to use their scores as weights. The
advantages and disadvantages of each method, inventoried by the researcher, are represented in
Table 2.
Method Advantages Disadvantages
1 - Number of cells in area III remains
small
- Definition problem for ‘most important’
- Loss of information
- Each PI considered as equally important
2 - Number of cells in area III remains
small
- Only limited lost of information
- Underlying structure of different constructs
must exist (Hair et al. 2006)
- Each PI considered as equally important
- Statistics can be misleading (Hair et al. 2006)
3 - No loss of information
- Matrix becomes big
- Ordinal scale used as nominal scale
Table 2: Advantages and disadvantages of methods for area 1
Based on these advantages and disadvantages a choice can be made. At first sight method 2 seems
to have the preference. However, before a choice can be made it must become clear what the nature
of the Performance indicators is and what the impact of the (dis)advantages is. Therefore it is
decided to make the choice after the data is gathered and before the results are analyzed. This might
be seen as a weakness, but as stated by Eisenhardt (1989), ‘the process of conducting a case study is
strikingly iterative’. At this point this research experiences this disadvantage.
Area III: Determining the degree in which the Performance indicators are affected
Now that area I and II are clear, the next step is to fill in area III. Primarily the idea is that for each cell
it is decided whether the consequence affects the PI positive, neutral or negative. An example of this
is given in Figure 13.

By Durand Rekko 19
Figure 13: Example of filling in area III
In this example the first PI conflicts in total with 4 consequences and two consequences affect the PI
positively. So in this example the first PI has got a total effect of -2. This is done for all cells which
finally results in totals for each PI. Finally the sum of these totals indicates how the performance of
the CC is affected by the consequences. However, there are some problems with this approach. First
of all, in this approach all the cells are considered to be equally important and it seems incorrect to
assume this. Secondly this method depends a lot on the quality of the list of consequences. If in this
list a factor is represented more than once, this influences the outcome. Thirdly the question is who
should fill in the matrix (CC, CRP, the researcher?). Because of these shortcomings this option is not
considered and again the two methods provided by Cooper & Schindler (2003) are considered:
1. Rating: CRP estimates the total values (vector A) directly;
2. Ranking: CRP ranks the Performance indicators based on the degree they are affected, this
ranking replaces vector A.
Method 1 proposes that CRP directly give the totals (as represented at the right side of the matrix in
Figure 12). This solves the weight problem since the respondents will take this into account implicitly.
However, here the problem is that the scale is unknown and that therefore the weights assigned by
CRP will be groundless. Method 2 proposes that CRP is asked to rank the different Performance
indicators from most positive affected to most negative affected. This is done after that they have to
fill in 2 or 3 rows of area III which is done to create a ‘feeling’ of what is measured. The advantage is
that the cells are weighted and that implicitly also arguments which are not included in the list of
effects are taken into account. Besides that, when method 2 for area I is used, two similar axes are
compared with each other which eliminates the risk of ending up with incomparable dimensions.
Given the advantages and disadvantages of both methods it is decided to select method 2 with the
remark that it is important to keep in mind that this method treats ordinal data as if it is nominal. So
the result will be a vector with average scores based on CRP their rankings. Depending on the choice
for Table 2 only some of these values are summed (option 1 and 2), or this vector is multiplied with
another vector (option 3). In appendix B based on an example it is explained how for each option the
end value is calculated. All three options result in one final value and this value is defined as Vx where
x stands for the CC. Given the differences in the degree in which CC’s use CRP the following
proposition is defined:
P2: VDP&P > VGmbH > V Spain
By Durand Rekko 20
So to test this proposition the following information is necessary with between brackets the chapter
in which this information is obtained:
• Retrieve list of relevant Performance indicators (chapter 6)
• Rankings of PI made by CC’s based on their importance (Chapter 7)
• Rankings of PI made by CRP based on the level in which they are affected (Chapter 7)
• Decide which method is used to fill in area I (Chapter 8)
Once this information is retrieved the values for each CC’s can be determined and with these values
proposition 2 can be tested.
5.3 Proposition 3
Proposition 3 tests whether there is a correlation between ‘the degree in which using CRP does not
conflict with personal incentives’ and ‘the degree in which CC’s use CRP’. This is done in exactly the
same way as with proposition 2 but instead of looking at performance indicators, the consequences
are compared with personal incentives. CRP is asked to rank the personal incentives where the least
conflicting personal incentives receives the highest point and the most conflicting one point. This
way, the same scale is retrieved as with proposition 2. The degree in which using CRP conflicts with
the personal incentives is defined as Wx where x stands for the different CC’s. A low value of W
indicates a conflicting relationship and a high value indicates that using CRP positively affects the
personal incentives. To test whether there is a correlation which supports C3 the following
proposition is formulated:
P3: WDP&P > WGmbH > W Spain
This proposition is tested in the same way as is done with proposition 2. For testing this proposition
the following information must be gathered.
• Retrieve list of relevant Personal incentives (chapter 6)
• Rankings of Personal incentives made by CC’s based on their importance (Chapter 7)
• Rankings of Personal incentives made by CRP based on the level in which they are affected
(Chapter 7)
• Decide which method is used to fill in area I (Chapter 8)
Once this information is obtained, proposition 3 can be tested.

By Durand Rekko 21
6 Method The aim of this chapter is to discuss how the propositions are tested and each proposition is
discussed separately.
6.1 Proposition 1: Effects
The previous chapter stated three elements which are necessary for testing proposition 1. One of
these is gathering the effects. In this paragraph it is explained how the effects required for testing
proposition 1 are gathered. First existing literature on centralizing procurement activities is
discussed. After that the process steps for buying a Resale item are defined and finally this process
design is used to make an inventory of the effects.
6.1.1 Literature
Before discussing the situation of VI specifically, available literature on this topic is discussed. This
starts with Corey (1978), who was one of the firsts who discussed whether purchasing in companies
should be centralized or not. The decennia following several developments occurred in this area and
during the nineties Monczka & Trent (1995) observed a trend within companies of centralizing
purchasing activities. A short overview of these trends is given to create a feeling of why centralizing
can improve business performance and what the effects could be.
Last decades performance improvement requirements increased a lot and companies must be able
to deliver better products within shorter time. Besides that, companies become more and more
dependent on their supplier and nowadays the pressure to innovate makes supplier contribution
increasingly important. Also the company structure is important and as stated by Monczka & Trent
(1998); ‘a good organization structure is essential for implementing leading-edge procurement
strategies’. Cross-functional teams seem to be the answer to the newest developments and here the
greatest challenge is to get non purchasing members and functions to support this team task. Finally
also a trend related to the responsibilities and activities of purchasing can be observed. There has
been an increase in strategically and externally-focused responsibilities and purchasing has become a
global activity.
Based on these trends, a look is taken on the effects of centralizing procurement activities. As
starting point the findings of Van Weele (2008) are taken. This author gives a summary of advantages
and disadvantages of decentralized procurement as experienced by researchers. This summary is
represented in Table 3.
Advantages Disadvantages
Direct responsibilities and accountabilities Divided buying strengths � No economy of scales
Highly customer oriented for internal users No uniform attitude towards suppliers
Shorter procurement procedures Scattered market research
Less internal coordination required Less standardization
Direct contact with suppliers Less opportunity to develop procurement specific
knowledge and product know-how
Table 3: Advantages and disadvantages of decentralized procurement(Van Weele, 2008)

By Durand Rekko
All terms in the table are rather obvious and
statements are still rather general
requires an alternative approach then just observing literature. Therefore
of the situation within VI is created. Once the process is clear, the effects of
other effects are assigned to the different process steps
6.1.2 Process description
To ensure that all effects are taken into account, a process description of the buying process is
defined. Without a process description
account. The process description is created by combining the designs available i
available process descriptions within the company
was finally verified with the CRP manager to ensure that the process description is correct.
On an abstract level the procurement process is rather similar
standard description for this process
Figure 14
This general model consists out of two parts. The
each product. The last three steps occur each time
products, the first three steps are conducted on
reordered by conducting the last three steps
situation which differs from this situation
Resale products are only ordered once
each product is unique because of its spec
conducted. The advantage of involving CRP is that steps 1 to 3 are performed
better end result. Next to that it is
the most complex step for Resale
interviews, the following process description
Ch
ec
k
Sp
ec
ifica
tion
s
Te
nd
er R
FQ
Ch
ase
&E
va
luate
q
uo
tatio
n
Sp
lit up
Figure 15
In the model the black arrows
represents the moment that a proje
conducted and so the procurement process ends. All
• Split up : Every project starts with
different products which are assigned to each department
mechanical products etc.)
22
All terms in the table are rather obvious and are not further explained here
general and are not yet concrete enough to function as effects
requires an alternative approach then just observing literature. Therefore first a
is created. Once the process is clear, the effects of Table
to the different process steps. The result of this is a list
ffects are taken into account, a process description of the buying process is
defined. Without a process description it is impossible to ensure that all effects are taken into
account. The process description is created by combining the designs available i
available process descriptions within the company (Vanderlande Industries C11, 2009)
was finally verified with the CRP manager to ensure that the process description is correct.
curement process is rather similar for each procurement
standard description for this process as proposed by Van Weele (2008) is given in
14: Procurement process description (Van Weele, 2008)
out of two parts. The first three steps are conducted only one time for
three steps occur each time a product is ordered. So, for example with routine
the first three steps are conducted once and from then on the products can simply be
by conducting the last three steps. However, within the Resale departmen
situation which differs from this situation because it is a project organization. Therefore normal
Resale products are only ordered once since that the specifications always differ
each product is unique because of its specification, before ordering a product always
he advantage of involving CRP is that steps 1 to 3 are performed better
Next to that it is observed that step 1 must be split up in different steps since this is
Resale products. Based on the model from the literature and
the following process description for ordering resale products within VI
Tra
ns
latio
n in
to
ne
w s
pe
cs
RF
Q
Ne
go
tiate
Ch
oic
e
Co
ntra
ct &
O
rde
r
WIN
Ex
pe
ditin
g
15: Procurement process for resale products within VI
arrows above the steps indicate a possible loop. The diamond called ‘win’
represents the moment that a project is won by VI or not. If the project is lost
the procurement process ends. All the steps are now explained in detailed.
Every project starts with a kick-off meeting in which the project
products which are assigned to each department (such as Resale products,
mechanical products etc.). Depending on the CC’s, sometimes CRP is involved in this phase
here. However, these
function as effects. This
a process description
Table 3 together with
list with effects.
ffects are taken into account, a process description of the buying process is
it is impossible to ensure that all effects are taken into
account. The process description is created by combining the designs available in literature with the
(Vanderlande Industries C11, 2009). The result
was finally verified with the CRP manager to ensure that the process description is correct.
procurement situation. A
is given in Figure 14.
first three steps are conducted only one time for
, for example with routine
and from then on the products can simply be
. However, within the Resale department there is a
it is a project organization. Therefore normally
since that the specifications always differ. Thus, since that
ification, before ordering a product always steps 1 to 3 are
better which leads to a
observed that step 1 must be split up in different steps since this is
the model from the literature and conducted
for ordering resale products within VI is defined.
Es
ca
latio
n
Eva
lua
tion
Ex
pe
ditin
g
indicate a possible loop. The diamond called ‘win’
ct is won by VI or not. If the project is lost, no more steps are
the steps are now explained in detailed.
off meeting in which the project is split up into
(such as Resale products,
CRP is involved in this phase
By Durand Rekko 23
but for the CC’s within scope this is not the case and therefore this step is indicated as
optional.
• Check specifications: In this step the specifications for the different Resale products are sent
to CRP and a lead buyer within CRP is assigned to the project. For all the resale items a
functional or detailed technical specification is given. The role of CRP is to check this
specifications or to work out the specification into more detail.
• Tender RFQ: In this phase a RFQ (Request for quotation) must be made and sent to different
suppliers. The role of CRP in this phase is twofold. First of all in a strategic way; which
suppliers are available and which ones are suitable for the job? Secondly in an operational
way; setting up and sending out the RFQ.
• Chase and evaluate quotation: Once the RFQ’s have been sent out the quotations must be
chased and collected. The task of CRP can be to ensure that VI receives the requested
quotation and to help CC’s with evaluating the different RFQ. This can be rather though since
normally the quotations differ a lot. Therefore the knowhow of commodity managers can be
very useful.
• Translation into new specifications: Once the project is won by VI, the contract conditions
between VI and the customer are translated into adjusted specifications. In both technical
and commercial conditions, the agreements with the customer must be in line with what VI’s
suppliers offer. In general this step is similar to the ‘check specification’ phase but than with
more information.
• RFQ: This phase is similar to the ‘tender RFQ’ phase with the difference that in this phase VI
can use the argument towards suppliers that VI has already won the project. Next to that,
the specifications are clearer which can lead to savings.
• Negotiate: In this phase the ultimate negotiation with suppliers take place. CRP can help
because of their negotiating skills and the fact that they have more know how about the
products. Next to that it is possible to lever by combining orders.
• Choice: When all negotiations with the different suppliers have been conducted, for each
item one supplier is selected. The choice is made on different aspects such as Quality,
Logistics, Time and Costs. Next to that some strategic arguments can play a role.
• Contract & Order: After the supplier has been selected, the agreements must be translated
into a contract. This requires legal skills to ensure that the contract actually is a good
representation of what was agreed on. The contract also is the purchase order.
• Expediting: During the expediting phase it is checked whether products are delivered on
time and in the agreed quantity.

By Durand Rekko 24
• Escalation: If something goes wrong during the execution of the project, for instance the
supplier breaks any of the agreements made, there can be an escalation. It must be decided
how to treat the current situation. Here CRP has the role to judge what the best is for VI as a
whole by looking at all relevant project with the concerning supplier.
• Evaluation: Once the project is finished the project needs to be evaluated. For CRP this
means evaluating the used suppliers. A good evaluation can help improve the processes.
Within VI the first 3 (4 including split up) steps the Sales Engineers are involved. During steps 4 to 10
the Project Managers are most crucial for the process. Step 11, the evaluation, is conducted by both
functions.
6.1.3 Effects
The process description from the previous paragraph explained the situation within VI. Now the
effects are inventoried and assigned to each step. This is done by making use of the methodology
called Focus Groups. ‘A focus group is a panel of people, led by a moderator, who meet for 90
minutes to 2 hours to discuss a specific topic’ (Liamputtong & Ezzy, 2005). The advantages and
limitations of this method are represented in Table 4.
Advantages Limitations
Obtain in-depth knowledge Generate a large quantity of data
Provide valuable insights into complex thoughts
and behavior
Focus groups are driven by the research, they
reflect the researchers interests
Reduce the chance of misunderstandings and
mistakes
Information gathered only represent the
perspective of the participants
Table 4: Advantages and limitations of focus groups (Liamputtong & Ezzy, 2005)
This method is selected since the advantages are applicable to the purpose of this step while the
limitations are not very problematic. The used focus group for inventorying the effects consisted out
of a two hour session with ten team members from the CRP. The session started with explaining the
procurement process as discussed in the previous paragraph. Once agreement on the process
description was reached, different supporting process activities were discussed (as represented in
appendix C). By making use of these supporting activities, for each process step the different effects
were inventoried. Next to the 11 process steps one extra category was added called ‘general’. This
group contains effects which can not directly be assigned to a process step but which do exist. Once
all the effects were inventoried, the group was asked to assign directions to the different effects. This
way, directly the directions assigned by CRP were inventoried during the workshop. Finally the
results of the focus group were analyzed by the researcher and validated by the Chief Procurement
Officer (CPO) of VI.
The list of effects and the directions assigned by CRP are the result of this step and can be found in
appendix D. This is a list of 37 effects which implicitly includes the effects suggested by Van Weele
(2008). The appendix also contains a column with the directions assigned by CRP. By this, the
purpose of this chapter is fulfilled and it is possible to continue with gathering the rest of the
information that is required for testing the propositions.
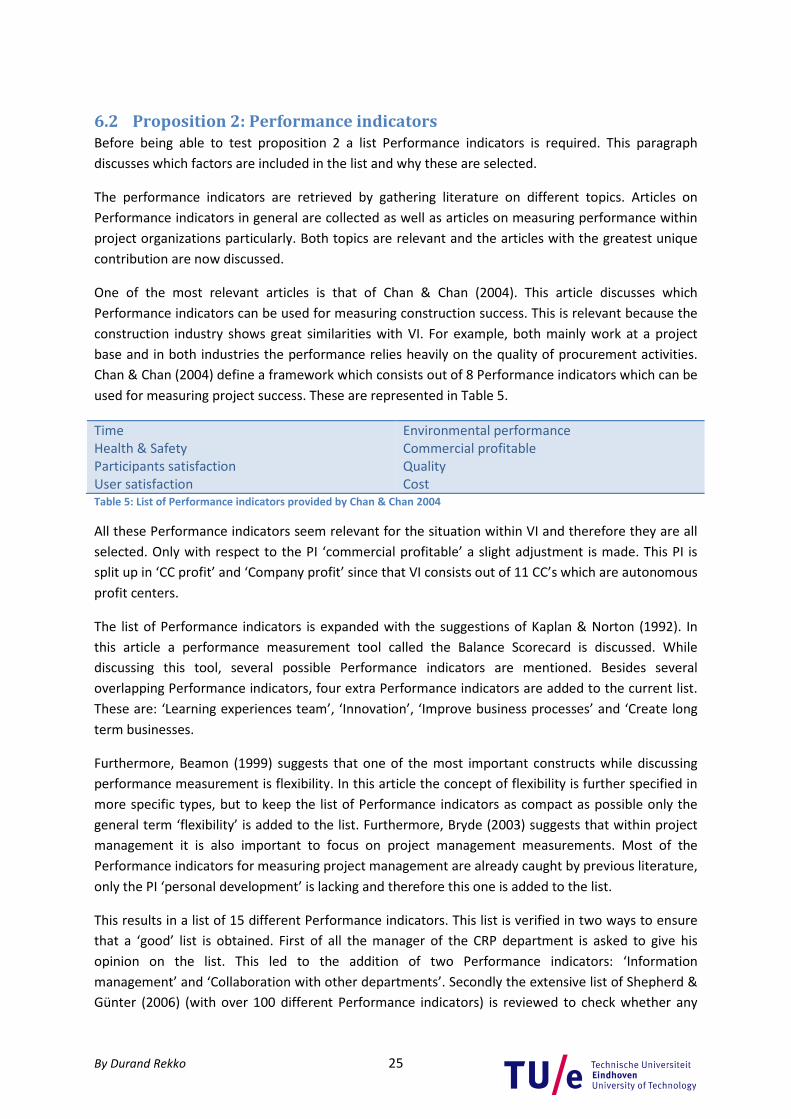
By Durand Rekko 25
6.2 Proposition 2: Performance indicators
Before being able to test proposition 2 a list Performance indicators is required. This paragraph
discusses which factors are included in the list and why these are selected.
The performance indicators are retrieved by gathering literature on different topics. Articles on
Performance indicators in general are collected as well as articles on measuring performance within
project organizations particularly. Both topics are relevant and the articles with the greatest unique
contribution are now discussed.
One of the most relevant articles is that of Chan & Chan (2004). This article discusses which
Performance indicators can be used for measuring construction success. This is relevant because the
construction industry shows great similarities with VI. For example, both mainly work at a project
base and in both industries the performance relies heavily on the quality of procurement activities.
Chan & Chan (2004) define a framework which consists out of 8 Performance indicators which can be
used for measuring project success. These are represented in Table 5.
Time
Health & Safety
Participants satisfaction
User satisfaction
Environmental performance
Commercial profitable
Quality
Cost
Table 5: List of Performance indicators provided by Chan & Chan 2004
All these Performance indicators seem relevant for the situation within VI and therefore they are all
selected. Only with respect to the PI ‘commercial profitable’ a slight adjustment is made. This PI is
split up in ‘CC profit’ and ‘Company profit’ since that VI consists out of 11 CC’s which are autonomous
profit centers.
The list of Performance indicators is expanded with the suggestions of Kaplan & Norton (1992). In
this article a performance measurement tool called the Balance Scorecard is discussed. While
discussing this tool, several possible Performance indicators are mentioned. Besides several
overlapping Performance indicators, four extra Performance indicators are added to the current list.
These are: ‘Learning experiences team’, ‘Innovation’, ‘Improve business processes’ and ‘Create long
term businesses.
Furthermore, Beamon (1999) suggests that one of the most important constructs while discussing
performance measurement is flexibility. In this article the concept of flexibility is further specified in
more specific types, but to keep the list of Performance indicators as compact as possible only the
general term ‘flexibility’ is added to the list. Furthermore, Bryde (2003) suggests that within project
management it is also important to focus on project management measurements. Most of the
Performance indicators for measuring project management are already caught by previous literature,
only the PI ‘personal development’ is lacking and therefore this one is added to the list.
This results in a list of 15 different Performance indicators. This list is verified in two ways to ensure
that a ‘good’ list is obtained. First of all the manager of the CRP department is asked to give his
opinion on the list. This led to the addition of two Performance indicators: ‘Information
management’ and ‘Collaboration with other departments’. Secondly the extensive list of Shepherd &
Günter (2006) (with over 100 different Performance indicators) is reviewed to check whether any

By Durand Rekko 26
Performance indicators are lacking. This resulted to the conclusion that only the concept ‘sales’ was
lacking and therefore this PI is added. The final list is represented in Table 6.
Process Time
Health & Safety
Participants satisfaction
Customer satisfaction
Innovation
Create long term business
Learning experiences team
Improve business process
Collaboration with other departments
Environmental performance
CC profit
Company profit
Quality
Costs
Flexibility
People development
Sales
Information management
Table 6: List of performance indicators
Three critical questions should be asked regarding the retrieved list. The first question is whether the
list contains all relevant Performance indicators. This seems to be ensured by verifying the list with
the management of the CRP department and by the judgment of the researcher. Besides, the five
articles which were discussed here, 12 other articles as reviewed by Rekko (2009) were considered as
well. Secondly the question is whether any PI is represented twice. Although several concepts do
seem rather similar, every concept is different. Finally it must be asked whether the length of the list
is appropriate for its purpose. When discussing the topic of forced ranking, Cooper & Schindler
(2003) state that the danger of a list longer than 10 variable is that people become ‘careless’. More
information regarding the size is not discussed. When looking at the q-methodology, which is a
similar method to the forced ranking method, a larger number of variables are accepted. The q-
methodology was invented by Stephenson (1953) and a brief overview of the method is given by Exel
& Graaf (2005). They suggest that up to 40 items can be used, however here the difference is that
statements instead of concepts are used for the ranking. Given these differences it is concluded that
18 Performance indicators probably is a rather big number. But since that each PI does represent
something unique, it is difficult to eliminate certain Performance indicators from the list. Therefore it
is decided to remain the list of 18 Performance indicators and that the researcher must be aware of
this problem while conducting the interviews.
6.3 Proposition 3: Personal incentives
Just as with the performance indicators, the personal incentives are selected based on literature and
insights on the situation within VI. With Personal incentives factors are meant which depend on
personal interest and culture, which can play a role in decision making.
The first personal incentives are based on the job characteristics, which influence job satisfaction,
discussed by Kinicki et al. (2002). In total they discuss 6 job characteristics and four of these are
selected because of their relevance for this research. These are ‘Variety / Diversity of work’,
‘Identity’, ‘Autonomy’ and ‘Feedback’. This list is expanded based on the research of Mercer (2009) .
In this research it is investigated which factors determine the level of engagement of employees. This
article is used since the concept of engagement seems to be related to what this possible cause
investigates. Mercer (2009) suggests that in total there are 12 dimensions which determine the level
of engagement. From this list the following concepts seem to be relevant when discussing personal
incentives: ‘Work processes’, ‘Job security’, ‘Rewards’ and ‘Career possibilities’. This brings the total
of personal incentives to 8 and these are represented in Table 7.
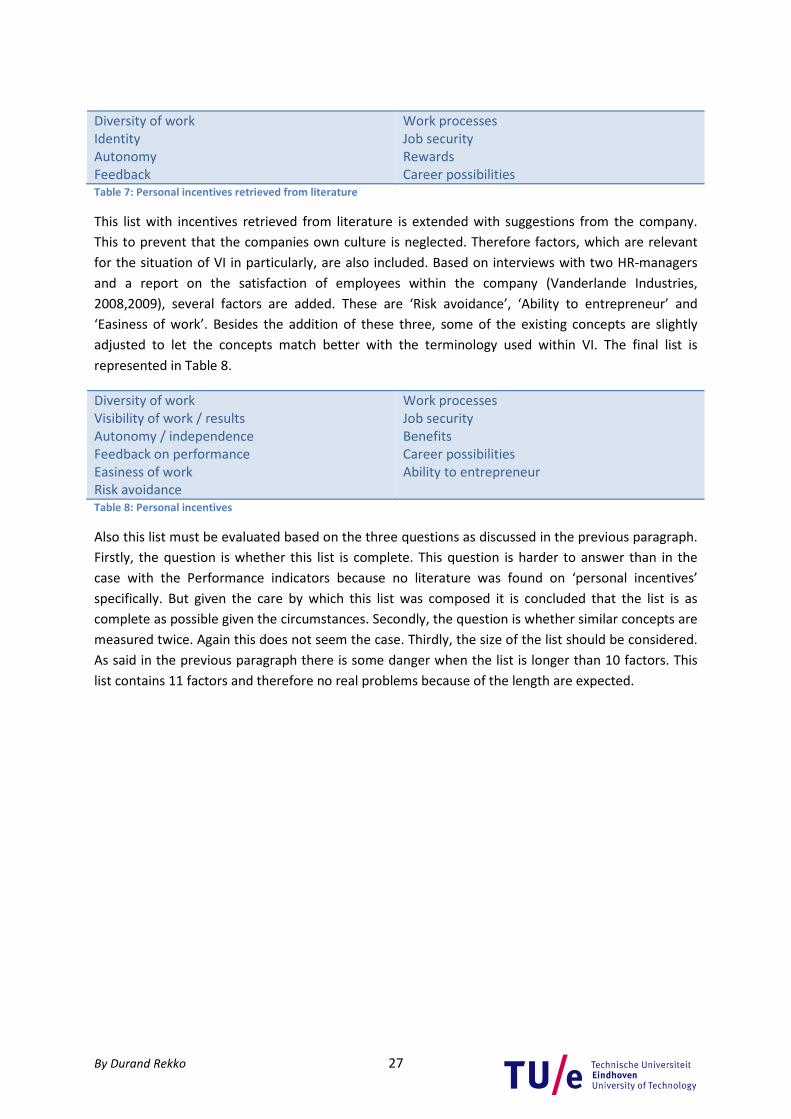
By Durand Rekko 27
Diversity of work
Identity
Autonomy
Feedback
Work processes
Job security
Rewards
Career possibilities
Table 7: Personal incentives retrieved from literature
This list with incentives retrieved from literature is extended with suggestions from the company.
This to prevent that the companies own culture is neglected. Therefore factors, which are relevant
for the situation of VI in particularly, are also included. Based on interviews with two HR-managers
and a report on the satisfaction of employees within the company (Vanderlande Industries,
2008,2009), several factors are added. These are ‘Risk avoidance’, ‘Ability to entrepreneur’ and
‘Easiness of work’. Besides the addition of these three, some of the existing concepts are slightly
adjusted to let the concepts match better with the terminology used within VI. The final list is
represented in Table 8.
Diversity of work
Visibility of work / results
Autonomy / independence
Feedback on performance
Easiness of work
Risk avoidance
Work processes
Job security
Benefits
Career possibilities
Ability to entrepreneur
Table 8: Personal incentives
Also this list must be evaluated based on the three questions as discussed in the previous paragraph.
Firstly, the question is whether this list is complete. This question is harder to answer than in the
case with the Performance indicators because no literature was found on ‘personal incentives’
specifically. But given the care by which this list was composed it is concluded that the list is as
complete as possible given the circumstances. Secondly, the question is whether similar concepts are
measured twice. Again this does not seem the case. Thirdly, the size of the list should be considered.
As said in the previous paragraph there is some danger when the list is longer than 10 factors. This
list contains 11 factors and therefore no real problems because of the length are expected.

By Durand Rekko 28
7 Data gathering: Interview templates In this chapter it is explained how the information is gathered which is required for testing the
propositions. The methods as described in the previous chapter are used and processed in this
template. First it is summarized which information exactly is still required and then it is discussed
how this information is gathered.
7.1 Required information
The following information is required to be able to test the propositions and to formulate rival
theories:
• Directions on effects assigned by CC’s (P1)
• Rankings of Performance indicators made by CC’s based on their importance (P2)
• Rankings of personal incentives made by CC’s based on their importance (P3)
• Ranking of Performance indicators and personal incentives by CRP based on the level in
which they are affected (P2 and P3)
• Supporting background information
Now that it is clear what information must be gathered, the question is how this information is
collected. It is decided that the setting in which the answers are gathered will be in-depth interviews.
The advantages and disadvantages of this method are discussed by Liamputtong & Ezzy (2005) and
represented in Table 9.
Advantages Limitations
Excellent to discover subject meanings Interviewing takes a great deal of time and
money
Participants may be more prepared to discuss
sensitive matters
No interaction between the reactions of different
respondents
Allow for new understandings It can be difficult to do it well
Table 9: Advantages and disadvantages of in-depth interviews (Liamputtong & Ezzy 2005)
For the purpose of this research the advantages of in-depth interviews seem to be applicable while
the disadvantages are only partly applicable to this situation; both the time and money are not an
issue for this research which only leaves one disadvantage.
Then the question is how the different elements of the list above can be obtained. The first one, the
directions, is retrieved by simply asking the respondents to assign directions to the effects with which
there are familiar with. When they do not know what the effect is they can pass. The last point,
supporting background information, is retrieved by including ‘open-questions’ in which the
respondents can freely tell about related topics. The 2nd
to 4th
points in the list are retrieved by using
the forced ranking method as explained in (paragraph 5.2).
Finally the question is how many and how the respondents are selected. The CC’s and functions are
already defined by the scope, but the amount of employees is unclear. For the research the more
respondents the more reliable the results will be, however given the limited time for the research a
sample is used. It is decided to interview around 4 Sales Engineers since this will be possible within
each CC. Regarding the project managers the amount is set to 3, since there are less Project
Managers than Sales Engineers in each CC. Finally it is tried to speak to 1 or 2 managers of each CC.

By Durand Rekko 29
The selection of employees is made by the managers which were asked to form a combination of
employees which is a good representation of the CC.
7.2 Problems
Before making a template for the interviews, the possible problems that might be encountered are
gathered. Each of these problems is discussed and possible solutions for these are suggested so that
an interview template can be made which solves these problems.
7.2.1 Language differences
The interviews are conducted in the Netherlands, Spain and in Germany. This involves the problem of
differences in languages. Of course it is important that the respondents can express themselves easy
and that the miscommunication because of language differences is limited to an absolute minimum.
This problem is solved by conducting the interviews in the native language of the respondents2.
Besides that, all terms used for the rankings are translated from English into the native language.
Except for the Netherlands since that here no language differences are expected when using the
English terms. To ensure the validity of the translations in the other CC’s, the German translations
were checked by a native German person working at the CRP team and the Spanish concepts were
check by a native Mexican, Spanish speaking person. The resulting translations are given in Appendix
E and this way this problem is considered to be tackled.
7.2.2 Cultural differences
Besides language differences, cultural difference must be considered. The approach for taking of the
interviews in each CC requires for adjustments because of cultural differences. For instance in one
country it might be necessary to explicitly communicate the support of the management to the
research while in another country this will work contra productive. The knowledge from Merk (2007)
and the information from Kwintessential (2009) are used to prevent intervention of cultural
differences. The last of these two gives a sketch of the culture of a country based on the 4
dimensions of Hofstede (1983). The use of this information led to the decision to start with some
small talk before the interviews in Spain and to send an email to the management of each CC in
which the board of VI expresses their support to the research. Next to that the researcher its
experiences from living one year in Spain are implicitly used to prevent the negative influence of
cultural differences on the research.
7.2.3 Social desired behavior
Finally some of the required information, such as the personal incentives, can be considered as
delicate information. The question is whether a respondent will honestly respond when it is asked to
rank the personal incentives. The main problem here seems to be that of ‘social desirability’. The
article of Furnham (1986) provides the following list with methods to prevent social desired behavior:
1. Forced-choice items;
2. Neutral questions;
3. Randomized response technique;
4. Self-administered questionnaires;
5. Bogus Pipeline (lie detector);
2 This is possible since that the researcher speaks Dutch, German and Spanish.

By Durand Rekko 30
6. Selecting interviewers;
7. Proxy person; instead of interviewing a person directly, let someone else talk about him.
From these seven options in total 4 are used within this research. First of all the forced ranking
method applies option 1. Next to that the questions will be stated neutrally (option 2) and the
purpose of the study will be remained unclear (option 3). Finally, persons are also asked to describe
the behavior of other people as suggested by option 7.
The first method is a confirmation for the use of the forced ranking method. The other methods are
considered while formulating the template interview and in the next paragraph it is discussed how
this is done.
7.3 Interview template
Based on the required information as discussed in paragraph 7.1 and the expected problems
discussed in paragraph 7.2 the interview template as given in appendix F is formulated. This
paragraph discussed this template in more detail and explains the choices which have led to this
design.
First a very brief introduction is given in which it is made clear that the researcher is a student and
that all outcomes are treated confidentially. Further specification of the purpose of the research is
remained unclear to prevent the occurrence of social desirability when answering question 2.
In question 2 the respondent is asked to sort the personal incentives. Here cards are used which all
contain one of the personal incentives as represented by Figure 27 appendix E. Here the respondent
is free to select the context of the ranking. The aim of the research is that the respondent will give a
ranking which represents his personal opinion. If this would be asked directly, this would probably
create social desirability. However the idea is that when the respondent is free to select the context,
the majority will rank it based on their own opinion since no context is given. And when the
respondent selected the context himself, he will be less suspicious and thus respond more honest.
The risk of this approach is that the respondents give a rank based on a different context which will
result in a ‘useless’ ranking. Once the ranking is made, question 3 asks the respondent why he ranked
the cards in this way, so in which context.
Then the introduction on the research is given and the respondent gets the opportunity to ask
questions. In question 5 a free discussion is held in which information for the rival theories must be
collected. Questions about ‘group feelings’, measuring performance and personal incentives are
asked and during this discussion the respondents its interests are leading.
In question 6 the ranking of Performance indicators are retrieved. Each respondent is asked to rank
the cards based on what is important for their function within their CC. Once the ranking is made the
respondent is asked to explain why he made this choice and how he has interpreted the different
concepts. If a difference between the interpretation of the respondents and what the researcher
meant with the concept exist, the respondent gets the chance to adjust the ranking based on the
researcher its definition (see appendix E for the definitions).
Question 7 asks the respondent to rank the cards of question 2 once again, but now based on what
they think that the behavior is within their CC for their function. This question has two purposes. First

By Durand Rekko 31
it is a backup for if the respondent did not give its personal ranking in question 2. So if this is the
case, this ranking is used in stead of the (useless) ranking of question 2. Secondly this ranking is used
to check if large differences exist between the respondent his answer and what he thinks that occurs
at his department. If this is the case, the respondent is asked to further clarify these differences.
Finally in question 8 Resale is introduced as research subject. This was not done earlier to retrieve
neutral answers. First the different process steps as defined in chapter 6 are explained and then the
respondent is asked to indicate with which process steps he is familiar. Then the effects from these
steps are discussed and the respondent is asked to assign a +, 0, - or a pass if they do not have any
idea.
The output of these interviews are clear and finally it is discussed how this information is used for
testing the different propositions. For P1 all the answers given by all the respondents are used since
these are all considered to be relevant. For P2 the rankings of the Sales Engineers and Project
Managers are all used. The answers of the Managers are not used when testing the propositions, but
this information is used as background information and to find possible rival theories. Finally, for
proposition 3 it must be decided which ranking (that of question 2 or 7) is selected. For each
interview the researcher decides which ranking is most appropriate for testing P3 and this ranking is
then selected. For this proposition al the answers are used.
7.4 CRP ranking
Finally the rankings from CRP must be obtained. On one hand the Performance indicators must be
ranked based on the degree in which they are positively affected if a CC uses CRP. On the other hand
the personal incentives must be ranked to find out to what extent they match with using CRP.
Furthermore it is important that the respondents get a good ‘feeling’ of what they are doing. The
rankings are obtained as follow.
In total four CRP members are asked for a 1 hour interview. During this interview first the matrix of
Figure 11 and the three different areas are explained. After that the respondent is asked to fill in 2 or
3 rows of area III as is done in Figure 13. By doing this the respondent will create a ‘feeling’ of what
vector A is and what it stands for. Once this is the case, the matrix is put aside and they are asked to
rank the 18 Performance indicators based on the level in which they are affected. The PI which is
affected most positively is placed at the top (and gets 18 points) and the one which is affected most
negatively should be placed at the bottom (and gets 1 point). After that the same is done for the
Personal incentives. Here the personal incentives with the best fit with using CRP gets 11 points and
the one which conflicts the most gets 1 point. Finally for both categories an average score of the
rankings is calculated as explained in Appendix B.
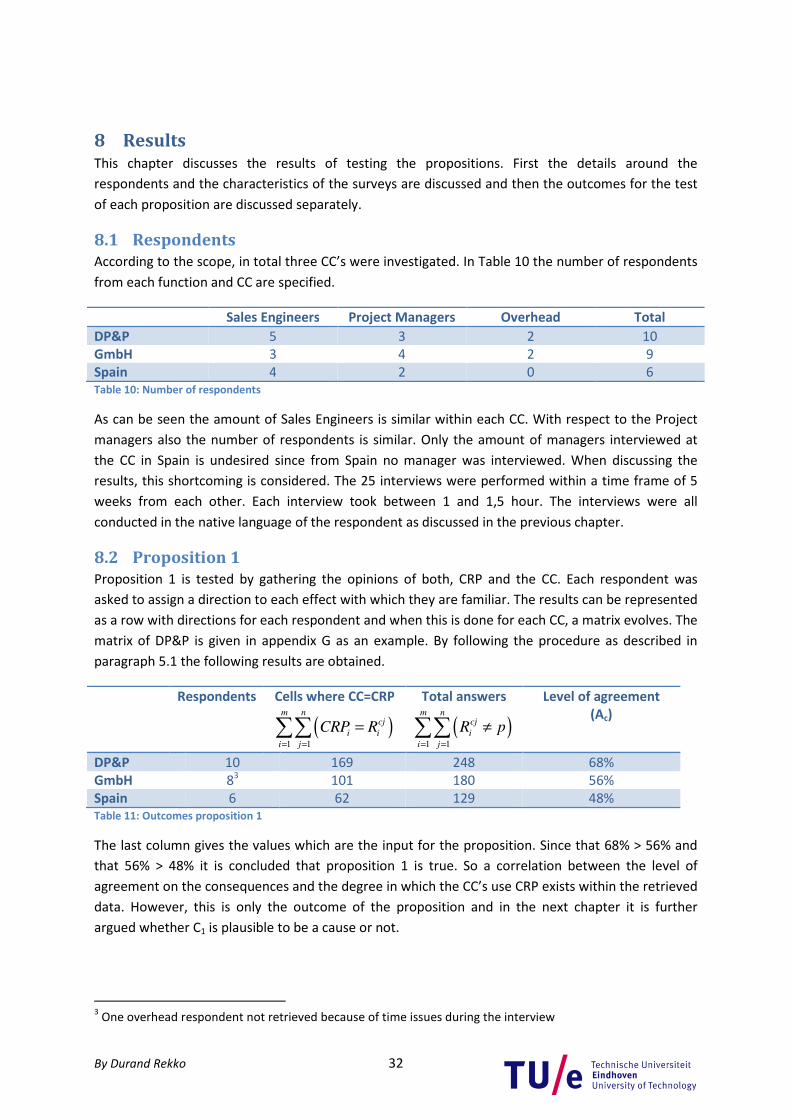
By Durand Rekko 32
8 Results This chapter discusses the results of testing the propositions. First the details around the
respondents and the characteristics of the surveys are discussed and then the outcomes for the test
of each proposition are discussed separately.
8.1 Respondents
According to the scope, in total three CC’s were investigated. In Table 10 the number of respondents
from each function and CC are specified.
Sales Engineers Project Managers Overhead Total
DP&P 5 3 2 10
GmbH 3 4 2 9
Spain 4 2 0 6
Table 10: Number of respondents
As can be seen the amount of Sales Engineers is similar within each CC. With respect to the Project
managers also the number of respondents is similar. Only the amount of managers interviewed at
the CC in Spain is undesired since from Spain no manager was interviewed. When discussing the
results, this shortcoming is considered. The 25 interviews were performed within a time frame of 5
weeks from each other. Each interview took between 1 and 1,5 hour. The interviews were all
conducted in the native language of the respondent as discussed in the previous chapter.
8.2 Proposition 1
Proposition 1 is tested by gathering the opinions of both, CRP and the CC. Each respondent was
asked to assign a direction to each effect with which they are familiar. The results can be represented
as a row with directions for each respondent and when this is done for each CC, a matrix evolves. The
matrix of DP&P is given in appendix G as an example. By following the procedure as described in
paragraph 5.1 the following results are obtained.
Respondents Cells where CC=CRP
( )1 1
m ncj
i i
i j
CRP R= =
=∑∑
Total answers
( )1 1
m ncj
i
i j
R p= =
≠∑∑
Level of agreement
(Ac)
DP&P 10 169 248 68%
GmbH 83 101 180 56%
Spain 6 62 129 48%
Table 11: Outcomes proposition 1
The last column gives the values which are the input for the proposition. Since that 68% > 56% and
that 56% > 48% it is concluded that proposition 1 is true. So a correlation between the level of
agreement on the consequences and the degree in which the CC’s use CRP exists within the retrieved
data. However, this is only the outcome of the proposition and in the next chapter it is further
argued whether C1 is plausible to be a cause or not.
3 One overhead respondent not retrieved because of time issues during the interview
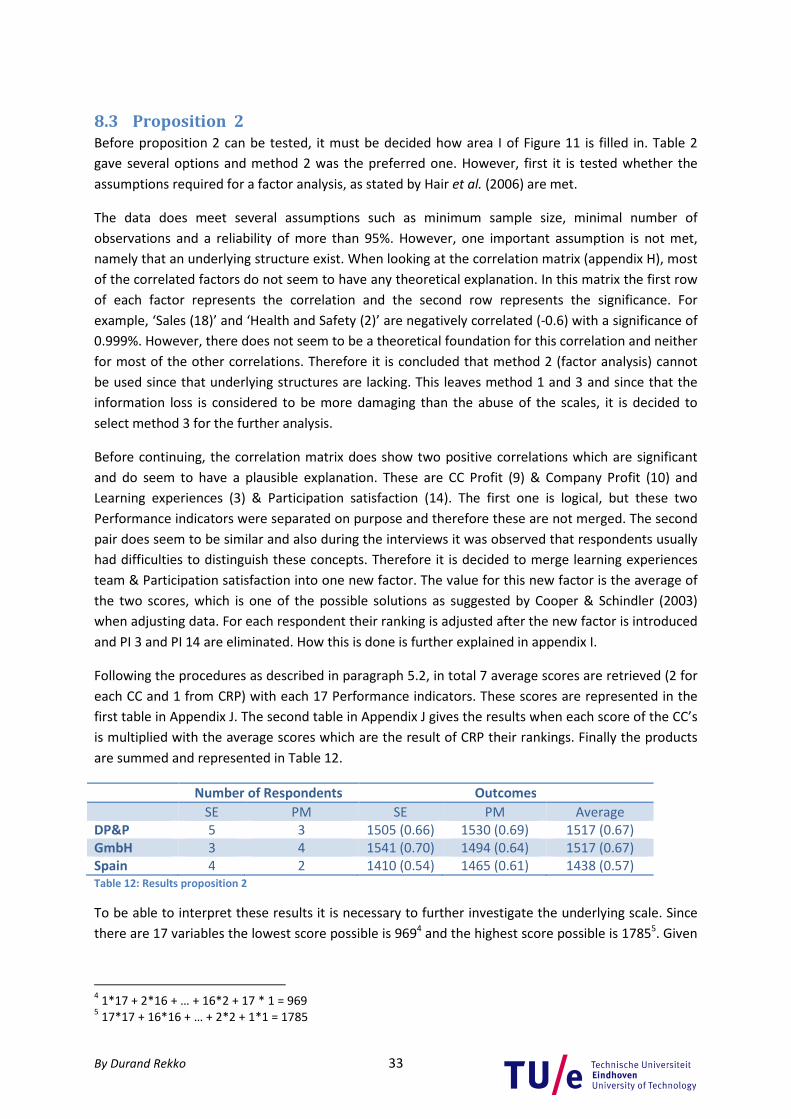
By Durand Rekko 33
8.3 Proposition 2
Before proposition 2 can be tested, it must be decided how area I of Figure 11 is filled in. Table 2
gave several options and method 2 was the preferred one. However, first it is tested whether the
assumptions required for a factor analysis, as stated by Hair et al. (2006) are met.
The data does meet several assumptions such as minimum sample size, minimal number of
observations and a reliability of more than 95%. However, one important assumption is not met,
namely that an underlying structure exist. When looking at the correlation matrix (appendix H), most
of the correlated factors do not seem to have any theoretical explanation. In this matrix the first row
of each factor represents the correlation and the second row represents the significance. For
example, ‘Sales (18)’ and ‘Health and Safety (2)’ are negatively correlated (-0.6) with a significance of
0.999%. However, there does not seem to be a theoretical foundation for this correlation and neither
for most of the other correlations. Therefore it is concluded that method 2 (factor analysis) cannot
be used since that underlying structures are lacking. This leaves method 1 and 3 and since that the
information loss is considered to be more damaging than the abuse of the scales, it is decided to
select method 3 for the further analysis.
Before continuing, the correlation matrix does show two positive correlations which are significant
and do seem to have a plausible explanation. These are CC Profit (9) & Company Profit (10) and
Learning experiences (3) & Participation satisfaction (14). The first one is logical, but these two
Performance indicators were separated on purpose and therefore these are not merged. The second
pair does seem to be similar and also during the interviews it was observed that respondents usually
had difficulties to distinguish these concepts. Therefore it is decided to merge learning experiences
team & Participation satisfaction into one new factor. The value for this new factor is the average of
the two scores, which is one of the possible solutions as suggested by Cooper & Schindler (2003)
when adjusting data. For each respondent their ranking is adjusted after the new factor is introduced
and PI 3 and PI 14 are eliminated. How this is done is further explained in appendix I.
Following the procedures as described in paragraph 5.2, in total 7 average scores are retrieved (2 for
each CC and 1 from CRP) with each 17 Performance indicators. These scores are represented in the
first table in Appendix J. The second table in Appendix J gives the results when each score of the CC’s
is multiplied with the average scores which are the result of CRP their rankings. Finally the products
are summed and represented in Table 12.
Number of Respondents Outcomes
SE PM SE PM Average
DP&P 5 3 1505 (0.66) 1530 (0.69) 1517 (0.67)
GmbH 3 4 1541 (0.70) 1494 (0.64) 1517 (0.67)
Spain 4 2 1410 (0.54) 1465 (0.61) 1438 (0.57)
Table 12: Results proposition 2
To be able to interpret these results it is necessary to further investigate the underlying scale. Since
there are 17 variables the lowest score possible is 9694 and the highest score possible is 1785
5. Given
4 1*17 + 2*16 + … + 16*2 + 17 * 1 = 969
5 17*17 + 16*16 + … + 2*2 + 1*1 = 1785

By Durand Rekko 34
this scale the results can be standardized6 and these values are also represented in the table. The
average is the unweighed average of the SE and PM result of each CC. For testing the proposition the
averages are used and strictly taken based on these outcomes proposition is considered to be false
since that VDP&P is not bigger than VGmbH.
8.4 Proposition 3
Just as with proposition 2, first it must be decided how area I of Figure 11 is filled in. Therefore the
correlation matrix is made and this is represented in Appendix L. From this matrix it is concluded that
there are not enough significant correlations to conduct factors analysis, and besides that, the
correlations which do exist do not seem to have any underlying structure. Therefore this method is
rejected and the same method for testing proposition 3 is selected as with proposition 2.
Before continuing it is determined whether there are factors which can be merged. Here only the
personal incentives ‘feedback on performance’ and ‘visibility of work’ are candidates since these
show a significant correlation. Furthermore, during the interviews several respondents asked what
exactly the difference was and after this was explained they usually put these concepts together.
Therefore it is concluded that these concepts need to be merged to prevent that one concept is
taken into account twice.
Following the procedures as described earlier, in total 7 average scores are retrieved (2 for each CC
and 1 from CRP) with each 10 personal incentives. These scores are represented in the first table in
Appendix M. The second table in Appendix M gives the results when each score of the CC’s is
multiplied with the average scores which are the result of CRP their rankings. Finally the products are
summed and represented in Table 13.
Number of Respondents Outcomes
SE PM All SE PM All
DP&P 5 3 10 260 (0.24) 253 (0.20) 258 (0.23)
GmbH 3 4 9 255 (0.21) 272 (0.32) 265 (0.27)
Spain 4 2 6 272 (0.32) 311 (0.55) 285 (0.40)
Table 13: Results proposition 2
Here again the results are standardized by using the fact that the lowest possible score is 2207 and
the highest possible score is 3858. The category ‘all’ contains all respondents together. Since that the
personal incentives are not directly related to their function it is possible to combine these. If then
proposition 3 is tested by using all respondents their rankings, it must be concluded that the
proposition is false. The proposition states that WDP&P > WGmbH > W Spain but the outcomes for ‘All’
states exactly the opposite.
6 For the SE of DP&P this would be: 1505 969
0.661785 969
−=
−
7 1*10 + 2*9 + … + 9*2 + 10 * 1 = 220
8 1*1 + 2*2 + … + 9*9 + 10 * 10 = 385
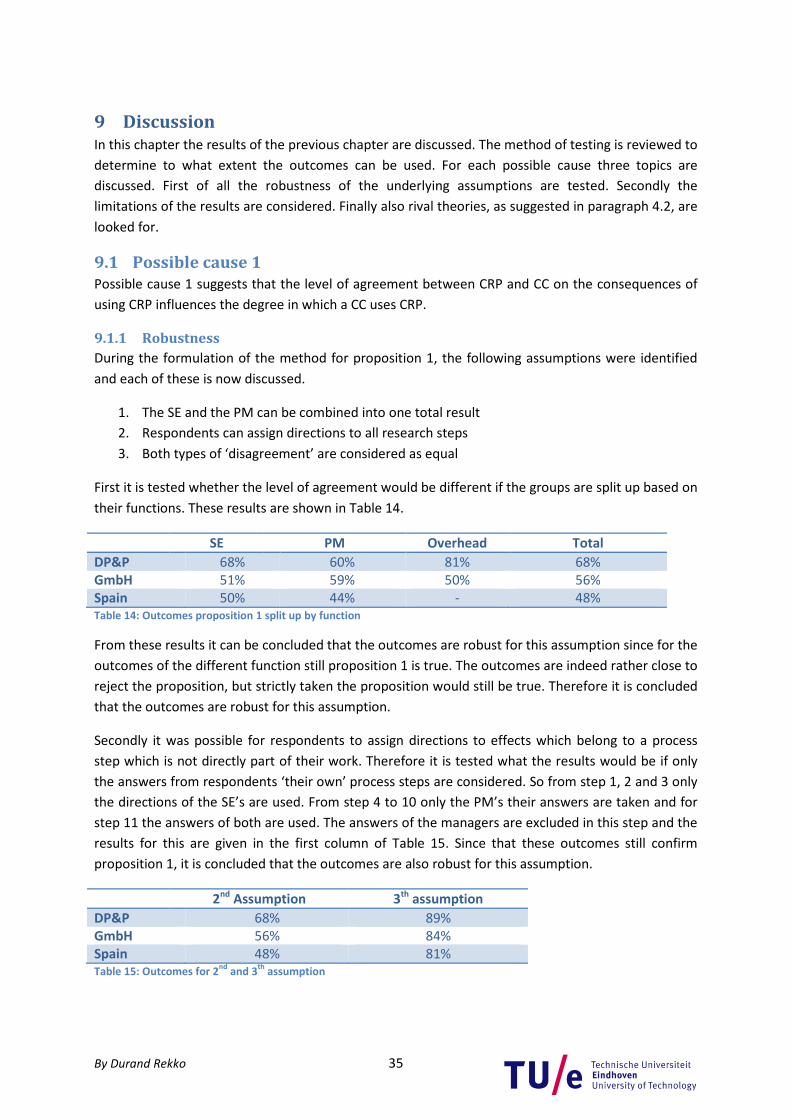
By Durand Rekko 35
9 Discussion In this chapter the results of the previous chapter are discussed. The method of testing is reviewed to
determine to what extent the outcomes can be used. For each possible cause three topics are
discussed. First of all the robustness of the underlying assumptions are tested. Secondly the
limitations of the results are considered. Finally also rival theories, as suggested in paragraph 4.2, are
looked for.
9.1 Possible cause 1
Possible cause 1 suggests that the level of agreement between CRP and CC on the consequences of
using CRP influences the degree in which a CC uses CRP.
9.1.1 Robustness
During the formulation of the method for proposition 1, the following assumptions were identified
and each of these is now discussed.
1. The SE and the PM can be combined into one total result
2. Respondents can assign directions to all research steps
3. Both types of ‘disagreement’ are considered as equal
First it is tested whether the level of agreement would be different if the groups are split up based on
their functions. These results are shown in Table 14.
SE PM Overhead Total
DP&P 68% 60% 81% 68%
GmbH 51% 59% 50% 56%
Spain 50% 44% - 48%
Table 14: Outcomes proposition 1 split up by function
From these results it can be concluded that the outcomes are robust for this assumption since for the
outcomes of the different function still proposition 1 is true. The outcomes are indeed rather close to
reject the proposition, but strictly taken the proposition would still be true. Therefore it is concluded
that the outcomes are robust for this assumption.
Secondly it was possible for respondents to assign directions to effects which belong to a process
step which is not directly part of their work. Therefore it is tested what the results would be if only
the answers from respondents ‘their own’ process steps are considered. So from step 1, 2 and 3 only
the directions of the SE’s are used. From step 4 to 10 only the PM’s their answers are taken and for
step 11 the answers of both are used. The answers of the managers are excluded in this step and the
results for this are given in the first column of Table 15. Since that these outcomes still confirm
proposition 1, it is concluded that the outcomes are also robust for this assumption.
2nd
Assumption 3th
assumption
DP&P 68% 89%
GmbH 56% 84%
Spain 48% 81%
Table 15: Outcomes for 2nd
and 3th
assumption
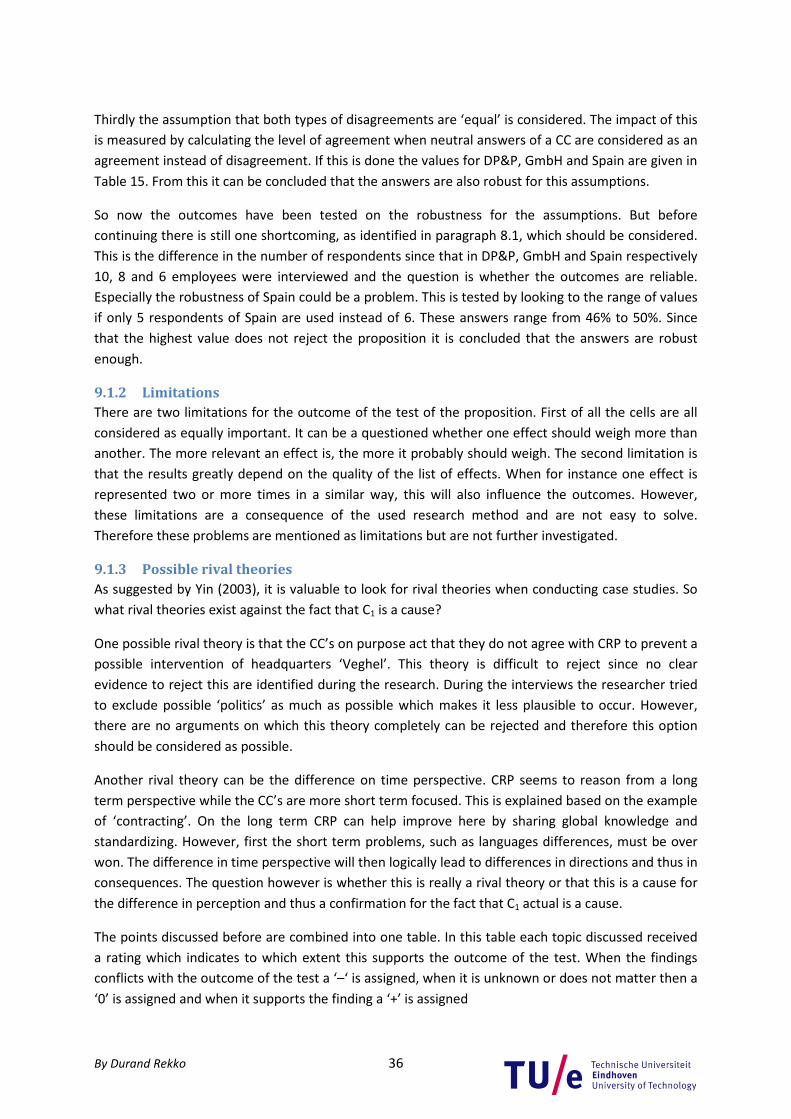
By Durand Rekko 36
Thirdly the assumption that both types of disagreements are ‘equal’ is considered. The impact of this
is measured by calculating the level of agreement when neutral answers of a CC are considered as an
agreement instead of disagreement. If this is done the values for DP&P, GmbH and Spain are given in
Table 15. From this it can be concluded that the answers are also robust for this assumptions.
So now the outcomes have been tested on the robustness for the assumptions. But before
continuing there is still one shortcoming, as identified in paragraph 8.1, which should be considered.
This is the difference in the number of respondents since that in DP&P, GmbH and Spain respectively
10, 8 and 6 employees were interviewed and the question is whether the outcomes are reliable.
Especially the robustness of Spain could be a problem. This is tested by looking to the range of values
if only 5 respondents of Spain are used instead of 6. These answers range from 46% to 50%. Since
that the highest value does not reject the proposition it is concluded that the answers are robust
enough.
9.1.2 Limitations
There are two limitations for the outcome of the test of the proposition. First of all the cells are all
considered as equally important. It can be a questioned whether one effect should weigh more than
another. The more relevant an effect is, the more it probably should weigh. The second limitation is
that the results greatly depend on the quality of the list of effects. When for instance one effect is
represented two or more times in a similar way, this will also influence the outcomes. However,
these limitations are a consequence of the used research method and are not easy to solve.
Therefore these problems are mentioned as limitations but are not further investigated.
9.1.3 Possible rival theories
As suggested by Yin (2003), it is valuable to look for rival theories when conducting case studies. So
what rival theories exist against the fact that C1 is a cause?
One possible rival theory is that the CC’s on purpose act that they do not agree with CRP to prevent a
possible intervention of headquarters ‘Veghel’. This theory is difficult to reject since no clear
evidence to reject this are identified during the research. During the interviews the researcher tried
to exclude possible ‘politics’ as much as possible which makes it less plausible to occur. However,
there are no arguments on which this theory completely can be rejected and therefore this option
should be considered as possible.
Another rival theory can be the difference on time perspective. CRP seems to reason from a long
term perspective while the CC’s are more short term focused. This is explained based on the example
of ‘contracting’. On the long term CRP can help improve here by sharing global knowledge and
standardizing. However, first the short term problems, such as languages differences, must be over
won. The difference in time perspective will then logically lead to differences in directions and thus in
consequences. The question however is whether this is really a rival theory or that this is a cause for
the difference in perception and thus a confirmation for the fact that C1 actual is a cause.
The points discussed before are combined into one table. In this table each topic discussed received
a rating which indicates to which extent this supports the outcome of the test. When the findings
conflicts with the outcome of the test a ‘–‘ is assigned, when it is unknown or does not matter then a
‘0’ is assigned and when it supports the finding a ‘+’ is assigned
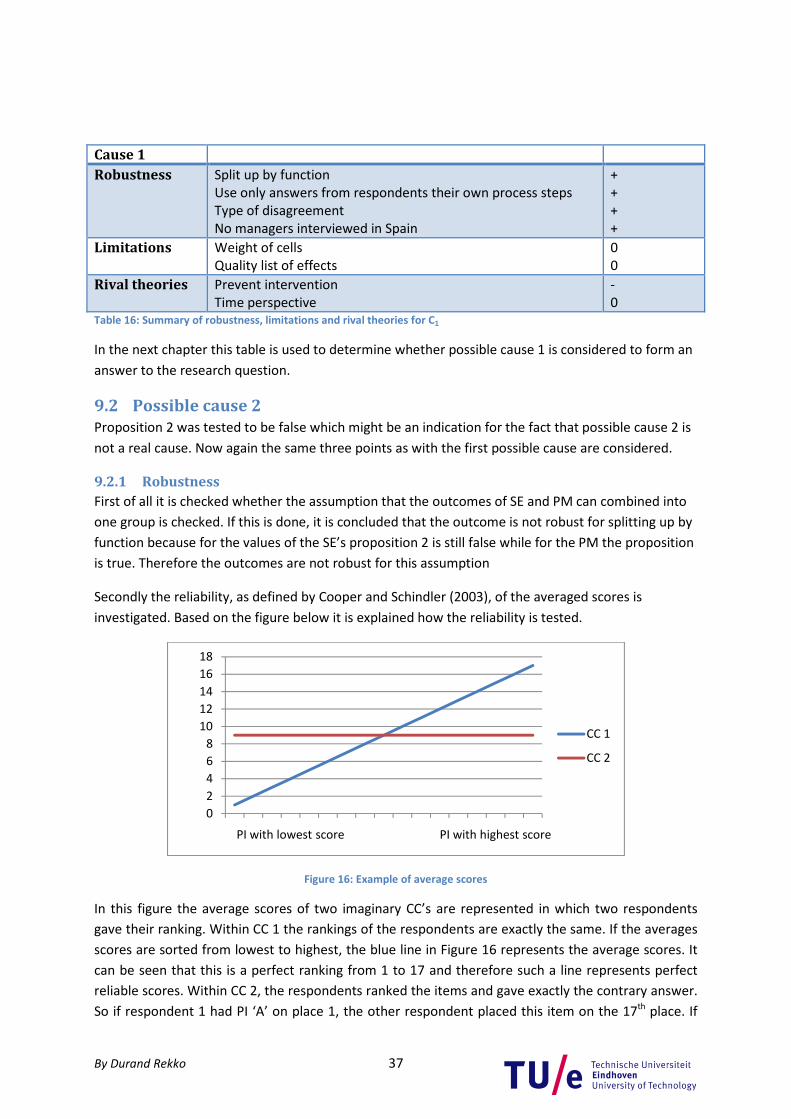
By Durand Rekko 37
Cause 1
Robustness Split up by function
Use only answers from respondents their own process steps
Type of disagreement
No managers interviewed in Spain
+
+
+
+
Limitations Weight of cells
Quality list of effects
0
0
Rival theories Prevent intervention
Time perspective
-
0
Table 16: Summary of robustness, limitations and rival theories for C1
In the next chapter this table is used to determine whether possible cause 1 is considered to form an
answer to the research question.
9.2 Possible cause 2
Proposition 2 was tested to be false which might be an indication for the fact that possible cause 2 is
not a real cause. Now again the same three points as with the first possible cause are considered.
9.2.1 Robustness
First of all it is checked whether the assumption that the outcomes of SE and PM can combined into
one group is checked. If this is done, it is concluded that the outcome is not robust for splitting up by
function because for the values of the SE’s proposition 2 is still false while for the PM the proposition
is true. Therefore the outcomes are not robust for this assumption
Secondly the reliability, as defined by Cooper and Schindler (2003), of the averaged scores is
investigated. Based on the figure below it is explained how the reliability is tested.
Figure 16: Example of average scores
In this figure the average scores of two imaginary CC’s are represented in which two respondents
gave their ranking. Within CC 1 the rankings of the respondents are exactly the same. If the averages
scores are sorted from lowest to highest, the blue line in Figure 16 represents the average scores. It
can be seen that this is a perfect ranking from 1 to 17 and therefore such a line represents perfect
reliable scores. Within CC 2, the respondents ranked the items and gave exactly the contrary answer.
So if respondent 1 had PI ‘A’ on place 1, the other respondent placed this item on the 17th
place. If
0
2
4
6
8
10
12
14
16
18
PI with lowest score PI with highest score
CC 1
CC 2

By Durand Rekko 38
then the averages are computed, all the averages are 9. This situation can be described as unreliable
because within the CC’s there is no agreement on the ranking. So a horizontal line indicates a low
level of reliability. Finally it should be remarked that the x-axis does not represent Performance
indicators but that these are the rankings if the average scores are ranked again. This is done to be
able to represent different average scores within one figure.
Now that it is clear how the reliability of the average scores is determined. In Figure 17 this is done
for the rankings of the Sales engineers. Also a ‘perfect’ ranking is added to the figure to be able to
compare the results.
Figure 17: Average rankings Sales Engineers
From this figure it is difficult to determine how good the average score of a CC ‘fits’ to the perfect
line. Therefore a method which is used for a similar problem within regression analysis is used
(Montgomery & Runger, 2003). Within regression analysis the Sum of Squares (SS) is used to indicate
how good two ‘lines’ fit. In this research this technique is used to indicate how good the average
scores of a CC fit with the perfect reliable line. In this case there are 17 data points and therefore the
minimum Sum of Squares is 0 and the maximum is 412,259. Based on these values the coefficient of
determination (R2) can be determined. The R
2 indicates how much of the total variance is explained
by the data and is calculated as follow
21
var
SSR
Total iance= −
What value for R2 is required to indicate reliable results, is unknown because the setting in which it is
used here is unique. However, based on the tests done for this research a value around 90% is
considered to indicate reliable results. In Table 17 the Sum of Squares and the R2
for the three
averages scores of Figure 17 are represented.
CC Sum of Squares R2
DP&P SE 41,8 0.89
GmbH SE 12,7 0.97
Spain SE 107,6 0.74
Table 17: Sum of Squares Sales Engineers proposition 2
9 (1-8,5)
2 + (2-8,5)
2 + … + (16-8,5)
2 + (17-8,5)
2 = 412,25
0
2
4
6
8
10
12
14
16
18
Lowest Highest
Perfect
DP&P SE
GmbH SE
Spain SE

By Durand Rekko 39
From the figure and the table it seems that the rankings of DP&P and GmbH are reliable. With
respect to the Sales Engineers in Spain it can be concluded that this is less reliable then the other two
average scores. Especially the mid / lower rankings are rather scattered. The consequence is that the
average scores of Spain, which are used for the calculation, are less ‘sensitive’ for the ranking of CRP
and thus less extreme outcomes can be expected.
The same analysis is done for the rankings of the Project Managers and at the same time also the
ranking of CRP is considered. The graphs of these analyses are represented in appendix K and in
Table 18 the corresponding sum of squares and R2
are given.
CC Sum of Squares R2
DP&P PM 25,1 0.94
GmbH PM 47,5 0.88
Spain PM 51,6 0.87
CRP 28.3 0.93
Table 18: Sum of Squares Project managers and CRP
Given the R2 and the plots, it can be seen that GmbH and Spain are similar reliable and DP&P is more
reliable. All values seem to be acceptable reliable. It is concluded that the average rankings of the
Project managers can be used for testing the proposition. Finally the same analysis is made for the
ranking of CRP. Given the R2 it can be concluded that these values are reliable and no problems are
expected when using this ranking for testing proposition 2.
All the rankings which are input for the calculation of proposition 2 have now been analyzed and it
can be concluded that almost all rankings are reliable. Only the ranking of the Sales Engineers in
Spain show a significant lower level of reliability compared with the other rankings. But overall the
reliability of the input variables is sufficient.
9.2.2 Limitations
This research method has got one main limitation as already mentioned earlier. This is that the
ordinal scale is used as a nominal scale. How big the impact of this abuse is depends on how big the
intervals between the rankings in reality are. Is one PI much more important than all others? Or are
all Performance indicators closely related? Based on how easy it was for the respondents to sort the
cards it is considered that the there were no extreme big intervals between the cards since that
during the research much respondents made remarks such as: ‘This is not easy’ and ‘do I have to rank
them or can I also place them on the same level?.’ These remarks indicate that in reality the
Performance indicators are closely related since that it was difficult to choose between the
Performance indicators. Therefore the only problem could be that the intervals are actually smaller
then supposed by the ordinal scale. For example, some Performance indicators are considered as
equally important and the respondents were forced to assign different values. This last situation
seemed to occurred in a limited way and should therefore be taken in mind when analyzing the
results.
9.2.3 Possible rival theories
During the interviews one crucial rival theory was identified. This came up during question 5 of the
interviews, namely the part where respondents could talk freely about performance measurement
within VI. Here all respondents stated that VI does not measure performance explicitly. So no clear
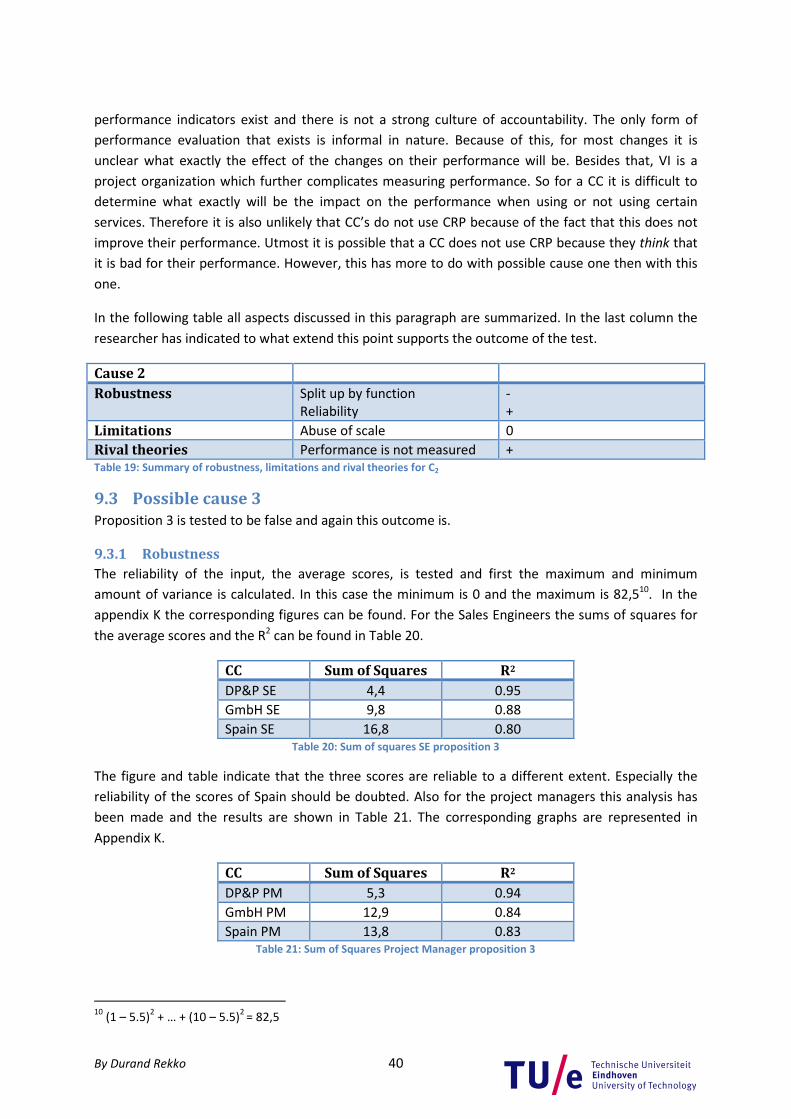
By Durand Rekko 40
performance indicators exist and there is not a strong culture of accountability. The only form of
performance evaluation that exists is informal in nature. Because of this, for most changes it is
unclear what exactly the effect of the changes on their performance will be. Besides that, VI is a
project organization which further complicates measuring performance. So for a CC it is difficult to
determine what exactly will be the impact on the performance when using or not using certain
services. Therefore it is also unlikely that CC’s do not use CRP because of the fact that this does not
improve their performance. Utmost it is possible that a CC does not use CRP because they think that
it is bad for their performance. However, this has more to do with possible cause one then with this
one.
In the following table all aspects discussed in this paragraph are summarized. In the last column the
researcher has indicated to what extend this point supports the outcome of the test.
Cause 2
Robustness Split up by function
Reliability
-
+
Limitations Abuse of scale 0
Rival theories Performance is not measured +
Table 19: Summary of robustness, limitations and rival theories for C2
9.3 Possible cause 3
Proposition 3 is tested to be false and again this outcome is.
9.3.1 Robustness
The reliability of the input, the average scores, is tested and first the maximum and minimum
amount of variance is calculated. In this case the minimum is 0 and the maximum is 82,510
. In the
appendix K the corresponding figures can be found. For the Sales Engineers the sums of squares for
the average scores and the R2 can be found in Table 20.
CC Sum of Squares R2
DP&P SE 4,4 0.95
GmbH SE 9,8 0.88
Spain SE 16,8 0.80
Table 20: Sum of squares SE proposition 3
The figure and table indicate that the three scores are reliable to a different extent. Especially the
reliability of the scores of Spain should be doubted. Also for the project managers this analysis has
been made and the results are shown in Table 21. The corresponding graphs are represented in
Appendix K.
CC Sum of Squares R2
DP&P PM 5,3 0.94
GmbH PM 12,9 0.84
Spain PM 13,8 0.83
Table 21: Sum of Squares Project Manager proposition 3
10
(1 – 5.5)2 + … + (10 – 5.5)
2 = 82,5

By Durand Rekko 41
Here again the results of DP&P are very reliable compared with the other two. The rankings of GmbH
and Spain are less reliable and when evaluating the results this should be taken in mind.
Finally the reliability of all scores together is made. So the answers of the SE, PM and overhead are
combined into one ranking since that for this proposition this category actually is relevant. The
results are given in Table 22 and further also the reliability of CRP their ranking is given in this table.
The corresponding graphs can be found in appendix K.
CC Sum of Squares R2
DP&P 6,8 0.92
GmbH 12,7 0.85
Spain 30,1 0.64
CRP 4.9 0.94
Table 22: Sum of Squares proposition 3 for all respondents
The reliability of Spain is very low. When looking at the corresponding graph in the appendix, it can
be seen that this is more a horizontal line then a diagonal one. This shortcoming should be
considered when discussing the results. Regarding CRP their ranking it is concluded that the input
scores are reliable.
Overall it is concluded that the reliability of DP&P is good. That of GmbH is critical and the reliability
of the scores of Spain are not reliable enough. The result of unreliable average scores is that that the
outcomes for the test will be ‘less extreme’. When conclusions for this proposition are made, this
problem will be taken in mind. Finally one conclusion can be made given the results and that is the
following. The more reliable the results, the more unanimous the respondents are. This might be an
indication for a stronger culture regarding personal incentives within a CC. Later on, when discussing
the rival theories, this is further discussed.
9.3.2 Limitations
Here the same limitation occurs as with the previous paragraph, the abuse of scales. So again the
question is whether the personal incentives are reasonable to follow an interval scale from 1 to 10.
Here the abuse seems to be bigger than with proposition 2. This is concluded because during the
interviews respondents usually selected 2 or 3 concepts which were most important for them. The
rest of the items were often considered as less important. So the interval between the first 3 items
and the rest might be bigger in reality than represented by the ordinal scale. The impact of this is
estimated by looking at Figure 18. In this figure the average scores of the CC’s are represented. The
items on the x-axis are sorted based on the average scores of CRP. At the left side the item which
conflicts the most when using CRP is represented, and at the right side the personal incentives which
is affected most positively is given.

By Durand Rekko 42
Figure 18: Average scores personal incentives ranked on CRP its average scores
The purpose is to find out what the impact of the abuse of scales is. So what outcome can be
expected if only the three most important personal incentives of each CC are considered? In Figure
18 it can be seen that for DP&P the three most important personal incentives are the same as the
most conflicting personal incentives. For GmbH the three most important personal incentives are
diversity of work, ability to entrepreneur and job security and two of these belong to the top three
conflicting personal incentives. For Spain also two of the three most important personal incentives
belong to the three most conflicting personal incentives. Therefore it is concluded that if only the
three most important personal incentives would be used, that this would indicate that using CRP
conflicts with the personal incentives of the CC’s.
9.3.3 Possible rival theories
What possible arguments exist for the fact that C3 is not a real cause? Based on the information
retrieved during the research it is difficult to find rival theories for the fact that C3 is not a cause.
The only rival theory which is identified is the outcome of the test of proposition 3 which states that
no clear correlation within the data exists. However, it can be seen that all CC are relatively
conflicting and the only one which is not very conflicting (Spain) does not have reliable average
scores which automatically leads to less extreme results. This brings us to one possible rival theory
which is applicable for Spain. This is that in Spain no strong culture regarding the different personal
incentives exists. The absence of this culture directly leads to the fact that there cannot be a
conflicting culture which could be a rival theory for the fact that C3 is a cause.
The test indicated that proposition 3 is false. This result has been discussed and in Table 23 it is
indicated to what extent each of the discussion points support this outcome.
Cause 3
Robustness Reliability -
Limitations Abuse of scale -
Rival theories Strength of culture +
Table 23: Summary of robustness, limitations and rival theories for C3
0,01,02,03,04,05,06,07,08,09,0
10,0
DP&P
GmbH
Spain
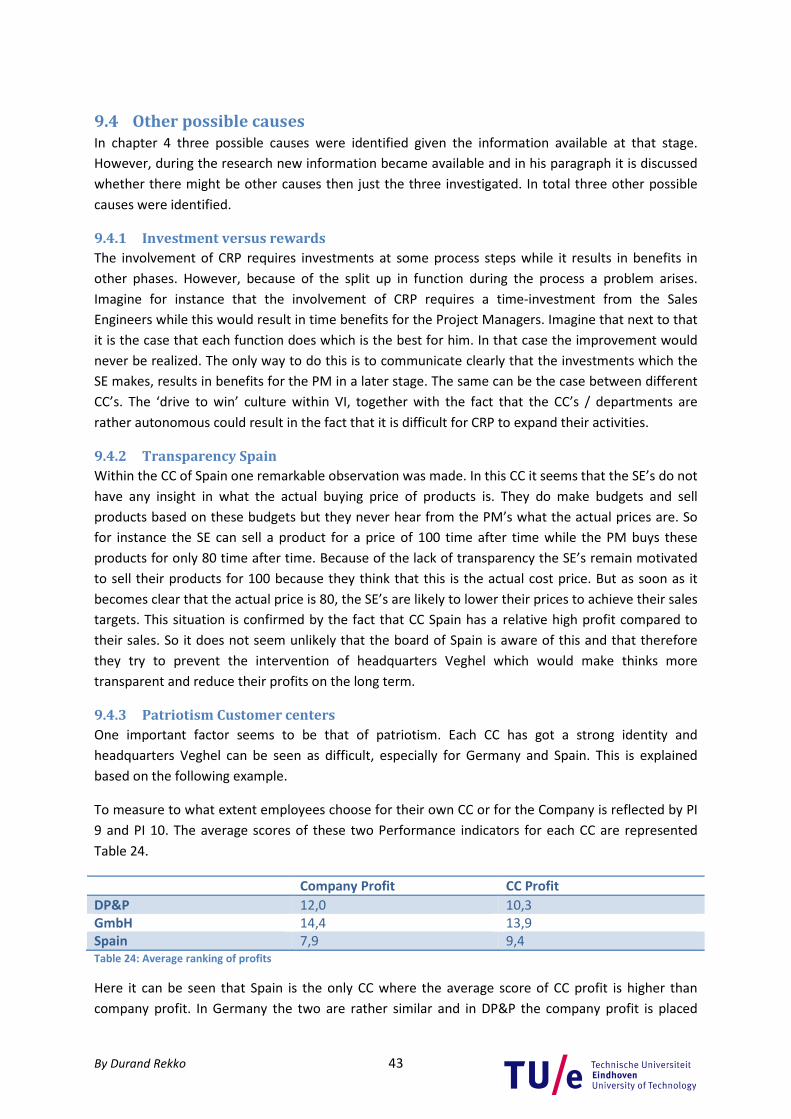
By Durand Rekko 43
9.4 Other possible causes
In chapter 4 three possible causes were identified given the information available at that stage.
However, during the research new information became available and in his paragraph it is discussed
whether there might be other causes then just the three investigated. In total three other possible
causes were identified.
9.4.1 Investment versus rewards
The involvement of CRP requires investments at some process steps while it results in benefits in
other phases. However, because of the split up in function during the process a problem arises.
Imagine for instance that the involvement of CRP requires a time-investment from the Sales
Engineers while this would result in time benefits for the Project Managers. Imagine that next to that
it is the case that each function does which is the best for him. In that case the improvement would
never be realized. The only way to do this is to communicate clearly that the investments which the
SE makes, results in benefits for the PM in a later stage. The same can be the case between different
CC’s. The ‘drive to win’ culture within VI, together with the fact that the CC’s / departments are
rather autonomous could result in the fact that it is difficult for CRP to expand their activities.
9.4.2 Transparency Spain
Within the CC of Spain one remarkable observation was made. In this CC it seems that the SE’s do not
have any insight in what the actual buying price of products is. They do make budgets and sell
products based on these budgets but they never hear from the PM’s what the actual prices are. So
for instance the SE can sell a product for a price of 100 time after time while the PM buys these
products for only 80 time after time. Because of the lack of transparency the SE’s remain motivated
to sell their products for 100 because they think that this is the actual cost price. But as soon as it
becomes clear that the actual price is 80, the SE’s are likely to lower their prices to achieve their sales
targets. This situation is confirmed by the fact that CC Spain has a relative high profit compared to
their sales. So it does not seem unlikely that the board of Spain is aware of this and that therefore
they try to prevent the intervention of headquarters Veghel which would make thinks more
transparent and reduce their profits on the long term.
9.4.3 Patriotism Customer centers
One important factor seems to be that of patriotism. Each CC has got a strong identity and
headquarters Veghel can be seen as difficult, especially for Germany and Spain. This is explained
based on the following example.
To measure to what extent employees choose for their own CC or for the Company is reflected by PI
9 and PI 10. The average scores of these two Performance indicators for each CC are represented
Table 24.
Company Profit CC Profit
DP&P 12,0 10,3
GmbH 14,4 13,9
Spain 7,9 9,4
Table 24: Average ranking of profits
Here it can be seen that Spain is the only CC where the average score of CC profit is higher than
company profit. In Germany the two are rather similar and in DP&P the company profit is placed

By Durand Rekko 44
higher compared to CC profit. These outcomes confirm the impression that especially CC Spain is
rather patriotic. They feel rather independent and they feel less like they have influence on the
profits of other CC’s. This attitude is likely to cause sub optimization and resistance against using CRP.
Whether this is a complete new cause can be discussed since this can also be modeled as an extra
personal incentive within possible cause 3.

By Durand Rekko 45
10 Conclusions and Recommendations The previous chapter described how the research was conducted. The purpose of this chapter is
twofold. First of all the conclusions are drawn and secondly recommendations are given. Before
coming to conclusion the complete report is briefly summarized.
10.1 Conclusions
The report started with background information on the company and explained the proposed
research design. The first step of the research consisted of gathering possible causes and
investigating how a causal relationship can be tested. This resulted in three possible causes namely:
1) The CC’s and CRP have different perceptions of what the consequences of using CRP are (C1).
2) Using CRP does not help CC’s improve their performance (C2)
3) Using CRP conflicts with personal incentives of the CC’s (C3)
From literature two possible ways to test the causal relationships were retrieved. These are; testing
for correlations and looking to internal logic. Within this research this concretely meant that
propositions were formulated which were tested. Chapter five defined the propositions and each
proposition supposes a statistical correlation between the possible cause and the degree in which a
CC uses CRP. In chapter six the method to test the propositions was further discussed and chapter
seven explained how the required data was obtained.
Chapter eight analyzed the results and tested the propositions. Proposition 1 was tested to be true
and proposition 2 and 3 were tested to be false. Chapter nine discussed several aspects around each
propositions and rival theories were gathered. This resulted in a summary for each possible cause to
what extent the different propositions are supported. Now for each possible cause it is concluded
whether it is an answer to the research question. The research question was:
What cause(s) influence(s) whether CC’s use the services of CRP?
Each possible cause is now discussed separately.
10.1.1 Cause 1
Proposition 1 was tested to be true and the outcomes were robust for changes in the underlying
assumptions. Furthermore several rival theories were identified of which one cannot be rejected. On
the other hand several confirming observations were done during the research. Such as that the
respondents in DP&P knew more about the practical implications and consequences of using CRP
then respondents in Spain en Germany. Next to that the levels of agreement were not close to 100%
which would indicate agreement. The highest level of agreement was only 68% whereas in Spain on
less than 50% of the effects there was agreement. Also if the alternative definition for agreement is
used, so neutral is not considered as a disagreement, the levels of agreement are still not close to
100%.
The effects given in Table 16 mainly support the outcome of the test of the proposition. Furthermore
supporting evidence was gathered and therefore it is concluded that it is very plausible that C1 causes
differences in the levels in which CC’s use CRP.

By Durand Rekko 46
10.1.2 Cause 2
From the test of proposition 2 it is concluded that C2 is not correlated with the degree in which CC’s
use CRP. This outcome is not robust for splitting up by function, because for the PM’s the proposition
is true and for the SE’s the proposition is false. The reliability of the inputs for these tests for DP&P
and GmbH are rather satisfactory, but this is not the case for all input variables of Spain. The lower
reliability of Spain probably explains partly why the values of Spain are closer to 0,5 then the others.
Furthermore, there is a strong rival theory which pleas for the fact that C2 is not an actual cause.
Namely that It is unlikely that CC’s do not use CRP because it is worse for their performance because
they cannot really know whether it is better or worse. Upmost it is possible that a CC does not use
CRP because they think that it is bad for their performance. However, as long as no agreement on the
consequences exist it is not clear how using CRP affects their performance.
All these statements are combined in Table 19 which mainly contains supporting signs for the test.
Therefore the outcome of the test is followed and it is concluded that it is not plausible that cause 2
influences the level in which CC use CRP.
10.1.3 Cause 3
Finally C3 suggest that using CRP conflicts with personal incentives of the CC’s and that this prevents
CC’s to use CRP. The corresponding proposition was tested to be false and the outcomes of the test
even demonstrated the exact opposite correlation as suggested by the proposition. The results were
discussed in chapter 9 and the reliability of some of the input variables turned out to be unreliable.
When taking a closer look at the outcomes and the corresponding reliability the following can be
seen. The R2 for DP&P, GmbH and Spain respectively are 0.23, 0.27, and 0.40 while the values for the
CC’s are respectively 0.92, 0.85 and 0.64. It is known that the lower the reliability is, the more
‘average’ the scores are. This then also leads to less extreme results and therefore most of the
differences in the W-values are considered to be caused by the differences in reliability. Therefore
the differences in W-values are not used for drawing conclusion. However, it can be seen that overall
the values are rather low which indicate a conflicting situation. Next to that the discussion regarding
the main limitation further confirms that using CRP conflicts with the personal incentives of the CC.
Therefore, given the research results, it is concluded that using CRP conflicts with the personal
incentives of the CC’s.
However, the question remains whether this situation is a reason for CC’s to use or not use CRP. The
answer to this question is yes and no. It seems that when CRP tries to convince a CC to use CRP that
this factor plays role. However, once a CC (such as DP&P) uses CRP this situation seems to be
overruled by other factors. Therefore it is concluded that C3 does influence whether a CC uses CRP
but that this mainly occurs at the time that a CC has to change their working method.
10.1.4 Other causes
Finally as described in chapter 9, three other possible causes were identified. The first one,
‘investment versus reward’ seems to be a cause which is also relevant. Unfortunately this cause was
not investigated during this research. The second suggestion, transparency Spain, seems to be more
a specific cause for the CC in Spain than something that occurs at all CC. The final one, patriotism
seems to be an element which should be added to the list of personal incentives, rather than a cause
on it self.
By Durand Rekko 47
Based on the outcomes of the research the following causes are selected to form the answer to the
research question.
• The CC’s and CRP have different perceptions of what the consequences of using CRP are (C1).
• Using CRP conflicts with personal incentives of the CC’s (C3)
Here the other possible causes identified at the end of the research are left aside because these have
not yet been investigated. One final remark with respect to the outcomes is made. That is that the
used research method was ex post facto as defined earlier and as discussed by Cooper & Schindler
(2003) there is one important warning when using this method which is the so called post hoc fallacy.
They state that ‘thorough testing, validating of multiple hypotheses and controlling for confounding
variable’ is essential to retrieve reliable results and it can not be said that this was done in this
research. However, the complexity of the situation did not allow to really exclude confounding
variables and thorough testing. Therefore the outcomes of this research must always be considered
within the right perspective.
10.2 Recommendations
Two types of recommendation for further steps are distinguished. First of all recommendations for
actions within VI are discussed and secondly suggestions for further research are given.
10.2.1 Vanderlande Industries
The research investigated three possible causes and C1 and C3 are considered to be a cause.
Therefore first the recommendations related to these two causes are discussed.
First of all agreement with the CC’s on the consequences of using CRP needs to be improved. This can
be done by discussing with the CC’s on why no agreement exists on certain points. From the research
it is clear within which process steps agreement exist and at which steps there is less agreement.
Probably this discussion will already lead to possibilities to improve the situation. Next to that it is
important to be more concrete about the work method and the corresponding consequences for the
CC’s.
Secondly it is important to be aware of the fact that the ‘culture’ of VI in general conflicts with the
idea of using CRP. However, the question is to what extent CRP can actually do something about this.
It is up to the management to decide whether VI as a whole would benefit from changing this culture
or not. So as long as this situation does not change, this will be a given for CRP with which they
should work. The fact that it became clear what the CC’s actually want can help CRP improve their
services. From the rankings of both, the Performance indicators and the personal incentives, much
can be learned of how CRP can offer their services to make them attractive to the CC’s. Finally here it
is mentioned that this off course does not only apply for the CRP department but for all supporting
departments. So also management can make use of the different average rankings to build their
communication on to ensure that their suggestions are picked up by the employees.
These first two recommendations can be realized with only limited investments. The main
investment is that the employees take the time to understand the results from this research. After
that it is only a fact of being aware of the results and to adjust their working method.

By Durand Rekko 48
A third recommendation is to consider one of the three possible causes which were identified in
paragraph 9.4. The first one suggested there, investment versus reward, actually might be a third
answer to the research question. The other two seem less relevant and therefore it is recommended
to mainly focus on the first one.
Finally it is observed that the problems experienced by CRP might also be experienced by other
departments. Therefore the findings from this research can be valuable for other departments which
experience the same problems. Discussing this research might already be a good step towards a
favorable situation for other department as well. So again this recommendation only requires a
limited amount of investment while the advantages can be very valuable.
10.2.2 Research
This research developed a framework to measure how certain services fit with the people who use
the services. This framework is not yet out developed and a recommendation is to further develop
this framework. The most important recommendation is that the list of performance indicators and
the list personal incentives could be further developed to ensure that the list contains all relevant
aspects while each factor is still mutual exclusive. If this framework is then further developed with a
set of standard factors, it can be used by other companies and departments since that the
conduction of the interviews is rather simple.
By Durand Rekko 49
11 Bibliography Beamon, B. (1999). Measuring supply chain performance. International Journal of Operations &
Production Management , 19 (3), 275-292.
Bryde, J. (2003). Modelling project management performance. The International Journal of Quality &
Reliability Management , 20 (2), 228-253.
Chan, A., & Chan, A. (2004). Key performance indicators for measuring construction succes.
Benchmarking , 11 (2), 203.
Cooper, R., & Schindler, P. (2003). Business Research Methods. New York: Mc Graw Hill.
Corey, R. (1978). Should companies centralize procurement? Harvard business review , 102-110.
Eisenhardt, K. (1989). Building theories from case study research. The academy of Management
review , 14 (4), 532-550.
Exel, J. v., & Graaf, G. d. (2005). Q-methodology: a sneak preview. Retrieved from www.jobvanexel.nl.
Furnham, A. (1986). Response bias, Social desirability and dissimulation. Personal and individual
differences , 7 (3), 358-400.
Hair, Black, Babin, Anderson, & Tatham. (2006). Multivariate data analysis. New Jersey: Pearson
Prentice Hall.
Hillebrand, B., Kok, R., & Biemans, W. (2001). Theory-Testing using case studies. Industrial Marketing
Management , 30, 651-657.
Hofstede, G. (1983). National cultures in four dimensions; A research-based theory of cultural
differences among nations. International Studies of Management & Organisations , 13 (1), 46-75.
Johnson, W., Leach, M., & Liu, A. (1999). Theory testing using case studies in business-to-business
research. Industrial Marketing Management , 28, p 201-213.
Kaplan, R., & Norton, D. (1992). The balanced scorecard - measures that drive performance. Harvard
business review , 71-79.
Kindlarski, E. (1984). Ishikawa Diagrams for Problem Solving. Quality Progress , 17 (12), 26-31.
Kinicki, A., McKee-Ryan, F., Schriesheim, C., & Carson, K. (2002). Assessing the construct validity of
the Job descriptive Index: A review and meta-analysis. Journal of Applied Psychology , 87, 14-32.
Kraljic, P. (1983). Purchasing must become supply management. Harvard Business Review , 109-117.
Kwintessential. (2009). Retrieved from www.kwintessential.co.uk
Landy, F., & Conte, J. (2004). Work in the 21st Century. New York: Mc Graw Hill.
Liamputtong, P., & Ezzy, D. (2005). Qualitative research methods. Oxford: Oxford University Press.
Mercer. (2009). Mercer. Retrieved from MERCER : www.mercer.com/whatsworking
By Durand Rekko 50
Merk, V. (2007). Course International Negotiation (1ZM45). Eindhoven: TU/e.
Monczka, R., & Trent, R. (1995). Purchasing and sourcing strategy: trends and implications. CAPS
Research Report .
Monczka, R., & Trent, R. (1998). Purchasing and supply management: Trends and changes
throughout the 1990's. International journal of purchasing and materials management , 2-11.
Montgomery, D., & Runger, G. (2003). Applied statistics and probability for engineers. John Wiley &
Sons.
Rekko, D. (2009). Literature Review; Measuring performance in project organisations. Eindhoven:
TU/e.
Rekko, D. (2009). Research proposal. Eindhoven: TU/e.
Shepherd, C., & Günter, H. (2006). Measuring supply chain performance: current research and future
directions. International Journal of Productivity and performance management , 55 (3), 242-258.
Stephenson, W. (1953). The study of behavior:Q-technique and its methodology. Chicago: University
of Chicago press.
Swierczek, F. (1988). Culture and job satisfaction: An unobtrusive approach. Management Decision ,
26 (6), 37-41.
Van Weele, A. (2008). Inkoop in strategisch perspectief. Deventer: Kluwer.
Vanderlande Industries. (2008). Annual Report. Veghel.
Vanderlande Industries C11. (2009). Procedure ; C11 Purchase resale items. Veghel.
Vanderlande Industries. (2008,2009). Klanttevredenheids onderzoek. Veghel.
Vanderlande Industries. (2009). Operations Report FY 2008 & 2009. Veghel.
Yin, R. K. (2003). Case study research; design and methods. London: SAGE publications inc.

By Durand Rekko 51
12 List of abbreviations
BDM Business Development Manager
BHS Baggage Handling System
BU Business Unit
Cn Possible cause ‘n‘
CC Customer Center
CP&L Corporate Procurement and Logistics
CPO Chief Procurement Officer
CRP Corporate Resale Procurement
DP&P Distribution, Parcel and Postal
FTE Full Time Employee
GmbH CC Germany
HR Human Resources
OPS Operations
Pn Proposition ‘n’
PM Project Manager
PO Purchasing Order
R&D Research & Development
ReD Resale Database
RFQ Request for Quotation
SE Sales Engineer
TCO Total Costs of Ownership
VI Vanderlande Industries

By Durand Rekko 52
13 Appendixes
Appendix A: Working method CRP
Three years ago the CRP department started with conducting an analysis on the product portfolio by
using the Kraljic matrix(Kraljic, 1983). With Kralijic’s matrix, products are divided based on two
dimensions, namely: Supply risk and Financial risk. Supply risk refers to the complexity of the market
like entry barriers, logistic costs, monopoly conditions etc. The financial risk indicates the impact of
the product on profitability for the company. All products types, around 30, bought by CRP were
categorized and Figure 19 represents how the total purchasing turnover is distributed over the
different categories. Financial Risk
Figure 19: Kraljic's Matrix
The following step was the implementation of the so called ‘commodity management’. The main idea
of commodity management is that a certain type of product is ordered by only one person within the
company. All demand within the company is collected and the responsible buyer for a commodity
places the order at the supplier. On the other hand, every project is linked to a ‘lead buyer’ to ensure
that each project only has one contact person. The required cross-communication takes place within
the purchasing team which consists out of all buyers. The result is that both suppliers as well internal
clients only have to deal with one person. For a better understanding this work method is
represented in the figure below.
Figure 20: Illustration Commodity management
In this figure each color represents a specific type of product. So the order information of different
products is placed at the lead buyer who redirects this to the responsible commodity managers. This

By Durand Rekko
results in the fact that one commodity manager knows
his experience from earlier projects to improve the buying process.
management is that all project teams only have to deal with one buyer, but more important: Only
one person has contact with a specific supplier which leads to a negotiation advantage. However,
there are also disadvantages such as longer strings between suppliers and the projects.
To indicate when the advantages outweigh the disadvantages, a communication matrix was set u
indicate when project teams may directly contact suppliers and when not. For instance when the
project needs technical information direct contact with the supplier is favorable. However, when a
though negotiation on price needs to be conducted the CRP
communication matrix is represented in
This matrix indicates in which phase of the project which persons should be involved. For example,
when a strategic product is in the phase of request for quotation (RFQ) the buyer of CRP should be
leading. However, with routine products the complete ordering process should be conducted by the
project teams themselves.
The last three years this way of working was implemented. All cus
communication matrix and several sessions were organized to inform participants about the new
working method. Currently some of the CC’s adapted the working method, but others didn’t. The
experience is that the CC’s which use the
with it, they always get in contact with CRP without making a consideration whether it will be
beneficial or not for this project particularly.
53
results in the fact that one commodity manager knows about every order standing out and can use
his experience from earlier projects to improve the buying process. The advantage of commodity
nagement is that all project teams only have to deal with one buyer, but more important: Only
with a specific supplier which leads to a negotiation advantage. However,
there are also disadvantages such as longer strings between suppliers and the projects.
To indicate when the advantages outweigh the disadvantages, a communication matrix was set u
indicate when project teams may directly contact suppliers and when not. For instance when the
project needs technical information direct contact with the supplier is favorable. However, when a
though negotiation on price needs to be conducted the CRP buyer should be leading. The
communication matrix is represented in Figure 21.
Figure 21: Communication Matrix
This matrix indicates in which phase of the project which persons should be involved. For example,
he phase of request for quotation (RFQ) the buyer of CRP should be
leading. However, with routine products the complete ordering process should be conducted by the
The last three years this way of working was implemented. All customer centers received the
communication matrix and several sessions were organized to inform participants about the new
working method. Currently some of the CC’s adapted the working method, but others didn’t. The
experience is that the CC’s which use the matrix use it consequently. So once a CC is used to work
with it, they always get in contact with CRP without making a consideration whether it will be
beneficial or not for this project particularly.
about every order standing out and can use
The advantage of commodity
nagement is that all project teams only have to deal with one buyer, but more important: Only
with a specific supplier which leads to a negotiation advantage. However,
there are also disadvantages such as longer strings between suppliers and the projects.
To indicate when the advantages outweigh the disadvantages, a communication matrix was set up to
indicate when project teams may directly contact suppliers and when not. For instance when the
project needs technical information direct contact with the supplier is favorable. However, when a
buyer should be leading. The
This matrix indicates in which phase of the project which persons should be involved. For example,
he phase of request for quotation (RFQ) the buyer of CRP should be
leading. However, with routine products the complete ordering process should be conducted by the
tomer centers received the
communication matrix and several sessions were organized to inform participants about the new
working method. Currently some of the CC’s adapted the working method, but others didn’t. The
matrix use it consequently. So once a CC is used to work
with it, they always get in contact with CRP without making a consideration whether it will be
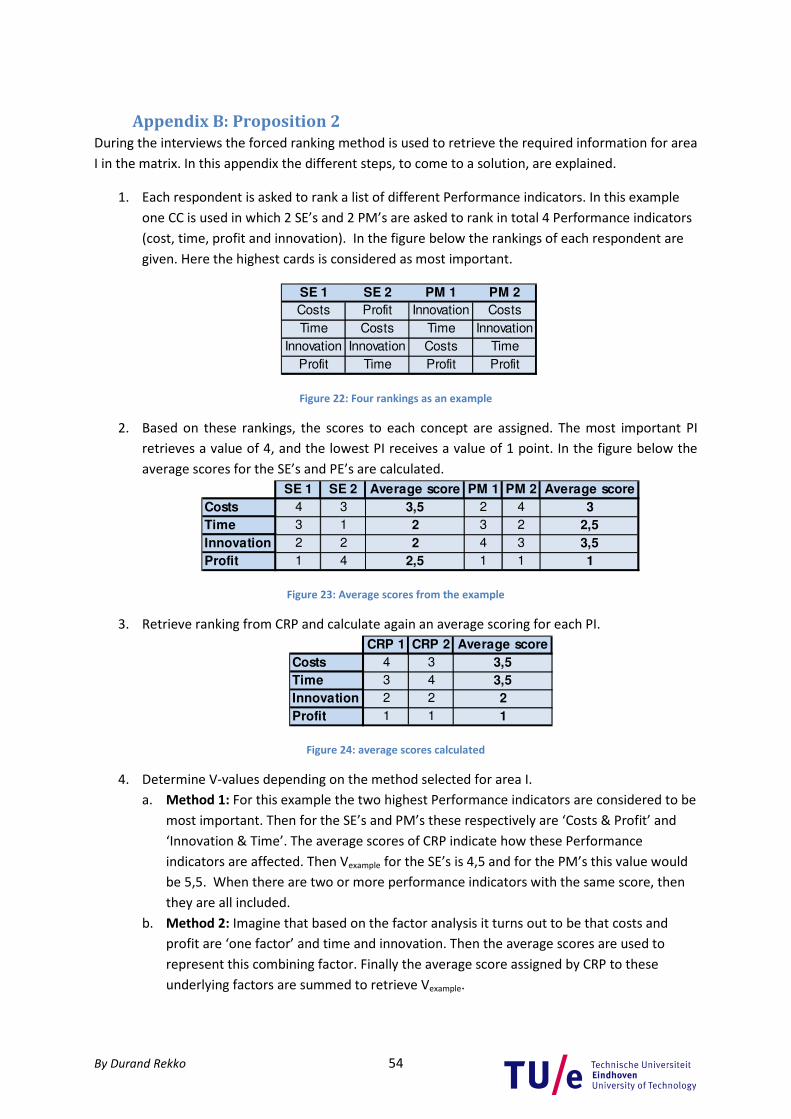
By Durand Rekko 54
Appendix B: Proposition 2
During the interviews the forced ranking method is used to retrieve the required information for area
I in the matrix. In this appendix the different steps, to come to a solution, are explained.
1. Each respondent is asked to rank a list of different Performance indicators. In this example
one CC is used in which 2 SE’s and 2 PM’s are asked to rank in total 4 Performance indicators
(cost, time, profit and innovation). In the figure below the rankings of each respondent are
given. Here the highest cards is considered as most important.
Figure 22: Four rankings as an example
2. Based on these rankings, the scores to each concept are assigned. The most important PI
retrieves a value of 4, and the lowest PI receives a value of 1 point. In the figure below the
average scores for the SE’s and PE’s are calculated.
Figure 23: Average scores from the example
3. Retrieve ranking from CRP and calculate again an average scoring for each PI.
Figure 24: average scores calculated
4. Determine V-values depending on the method selected for area I.
a. Method 1: For this example the two highest Performance indicators are considered to be
most important. Then for the SE’s and PM’s these respectively are ‘Costs & Profit’ and
‘Innovation & Time’. The average scores of CRP indicate how these Performance
indicators are affected. Then Vexample for the SE’s is 4,5 and for the PM’s this value would
be 5,5. When there are two or more performance indicators with the same score, then
they are all included.
b. Method 2: Imagine that based on the factor analysis it turns out to be that costs and
profit are ‘one factor’ and time and innovation. Then the average scores are used to
represent this combining factor. Finally the average score assigned by CRP to these
underlying factors are summed to retrieve Vexample.
SE 1 SE 2 PM 1 PM 2
Costs Profit Innovation Costs
Time Costs Time Innovation
Innovation Innovation Costs Time
Profit Time Profit Profit
SE 1 SE 2 Average score PM 1 PM 2 Average score
Costs 4 3 3,5 2 4 3
Time 3 1 2 3 2 2,5
Innovation 2 2 2 4 3 3,5
Profit 1 4 2,5 1 1 1
CRP 1 CRP 2 Average score
Costs 4 3 3,5
Time 3 4 3,5
Innovation 2 2 2
Profit 1 1 1

By Durand Rekko 55
c. Method 3: This method uses all the data and multiplies the two average score vectors
(that of the CC and of CRP). Here Vexample would be 25,8 for the SE’s and 27,3 for the
PM’s.
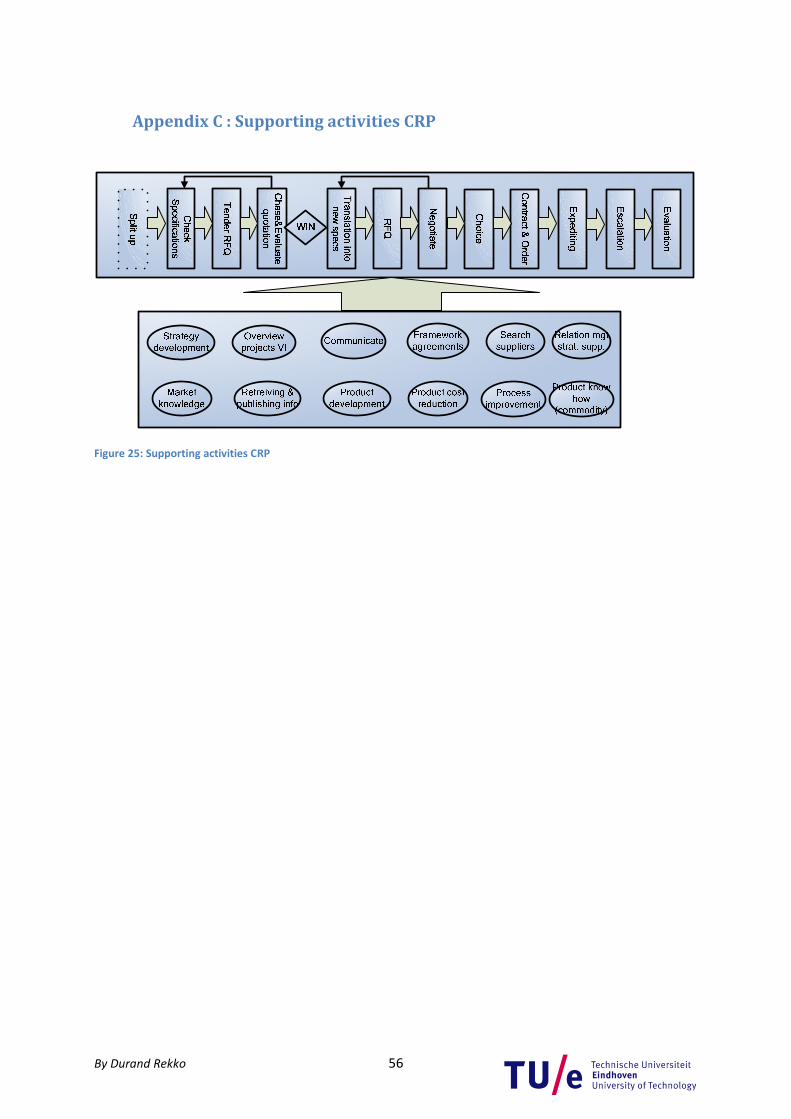
By Durand Rekko 56
Appendix C : Supporting activities CRP
Figure 25: Supporting activities CRP
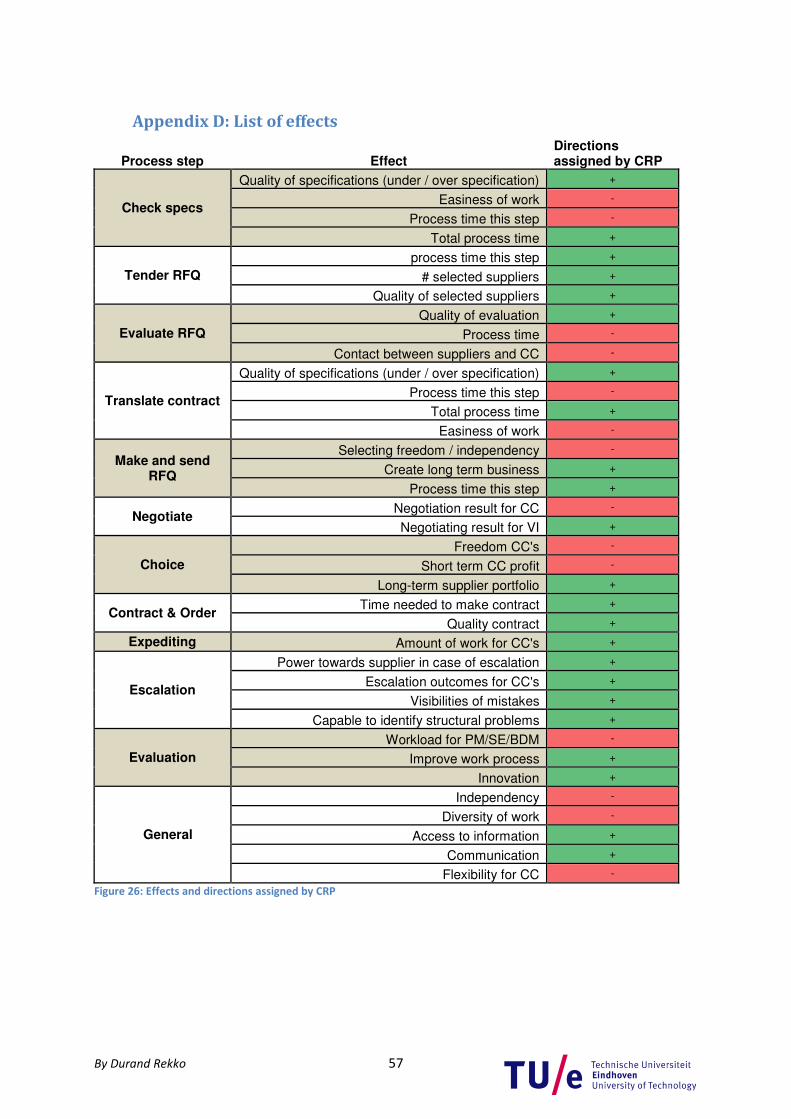
By Durand Rekko 57
Appendix D: List of effects
Process step Effect Directions assigned by CRP
Check specs
Quality of specifications (under / over specification) +
Easiness of work -
Process time this step -
Total process time +
Tender RFQ
process time this step +
# selected suppliers +
Quality of selected suppliers +
Evaluate RFQ
Quality of evaluation +
Process time -
Contact between suppliers and CC -
Translate contract
Quality of specifications (under / over specification) +
Process time this step -
Total process time +
Easiness of work -
Make and send RFQ
Selecting freedom / independency -
Create long term business +
Process time this step +
Negotiate Negotiation result for CC -
Negotiating result for VI +
Choice
Freedom CC's -
Short term CC profit -
Long-term supplier portfolio +
Contract & Order Time needed to make contract +
Quality contract +
Expediting Amount of work for CC's +
Escalation
Power towards supplier in case of escalation +
Escalation outcomes for CC's +
Visibilities of mistakes +
Capable to identify structural problems +
Evaluation
Workload for PM/SE/BDM -
Improve work process +
Innovation +
General
Independency -
Diversity of work -
Access to information +
Communication +
Flexibility for CC -
Figure 26: Effects and directions assigned by CRP

By Durand Rekko 58
Appendix E: Performance Indicators and Personal incentives
Code Translations Code Translations
1
Innovation
Innovation
Innovación
10
CC profit
Gewinn des CC
Beneficios del CC
2
Health & Safety
Sicherheits- und Gesundheitsschutz
Salud & seguridad
11
Information / knowledge
management
Informations- /
Kenntnismanagement
Organización de información
3
Learning experiences team
Lernerfahrungen Team
Aprender cómo trabajar en equipo
12
People development
Arbeitnehmerentwicklung
Desarrolló de personas
4
Create Long term business
Langfristig Business kreieren
Generar negocios a largo plazo
13
Collaboration with other
departments
Zusammenarbeit mit anderen
Abteilungen
Collaboración con otros
departamentos
5
Quality
Qualität
Calidad
14
Participation satisfaction
Zufriedenheit der Teammitglieder
Satisfacción de participantes
6
Improve business processes
Betriebsprozess verbessern
Mejorar procesos del negocio
15
Environmental performance
Umweltschutz
Medi Ambiente
7
Customer satisfaction
Kundenzufriedenheit
Satisfacción del cliente
16
Flexibility
Flexibilität
Flexibilidad
8
Costs
Kosten
Los costes
17
Planning / Process time
Planung- / Prozess zeit
Tiempo del proceso
9
Company profit
Gewinn des Unternehmens
Beneficios de empresa
18
Sales / Order intake
Vertrieb / Auftragseingang
Ventas
Table 25: List of Performance indicators

By Durand Rekko 59
Code Translation Code
A Easiness of work
Leichtigkeit der Arbeit
Facilidad de trabajo
G Career possibilities
Berufliche Entwicklungsmöglichkeiten
Posibilidad de carrera
B Work processes
Arbeitsprozesse
Procesos de trabajo
H Diversity of work
Vielfältigkeit der Arbeit
Diversidad de trabajo
C Job security
Job Sicherheit
Seguridad de empleo
I Visibility of their work / results
Sichtbarkeit der Arbeit / Ergebnisse
Visibilidad de su trabajo / resultados
D Ability to ‘entrepreneur’
Fähigkeit zum 'Unternehmer'
Posibilidad para 'emprender‘
J Feedback on performance
Feedback on Leistung
Retraaccion en trabajo
E Benefits & Rewards
Vorteile und Belohnungen
Recompensas
K Autonomy / independence
Autonomie / Unabhängigkeit
Autonomiá / independencia
F Risk avoidance
Risikovermeidung
Evitar riesgos
Table 26: List of personal incentives
Figure 27: Respondent ranking the cards during an interview

By Durand Rekko 60
Appendix F: Template interviews
1. Ik ben een student en doe een onderzoek, antwoorden blijven anoniem.
2. Sorteer kaartjes (5 min)
3. Waarop heb je deze gesorteerd? (2 min)
4. Introductie (2 min)
Onderzoek bij DP&P, GmbH en Spain. Het gesprek zal 1 uur a 1,5 uur duren en dat niets
persoonlijks geregistreerd zal worden maar dat alle SE antwoorden bij elkaar worden gevormd,
alle PM samen etc.
5. Algemeen gesprek voeren over ‘performance’ binnen VI en wanneer doe je het eigenlijk
goed binnen VI of als zijnde ‘jouw functie? Welke performance measurements zijn er? Hoe
leven deze? Hoe belangrijk zijn persoonlijk punten belangrijk? Wat voor een cultuur is er
binnen VI? (15min)
6. Performance Measurement (10 min)
Wanneer denkt de ondervraagde dat hij zijn werk goed doet? Daarna door ranking heen lopen en
controleren of ze juiste interpretatie van de begrippen hebben gebruikt. Bij een ‘verkeerde’
interpretatie mag, na uitleg, de ranking worden aangepast
7. Impliciete beweegredenen (10 min)
Welk gedrag denken ze dat er is (voor hun functie binnen hun CC)?
8. Assign directions (20 min)
a. Proces stappen uitleggen (figure 14), welke stappen zijn ze bekend mee?
b. Vragen om directions toe te wijzen aan ieder effect
9. Afsluiten
Deelnemer bedanken voor deelname.
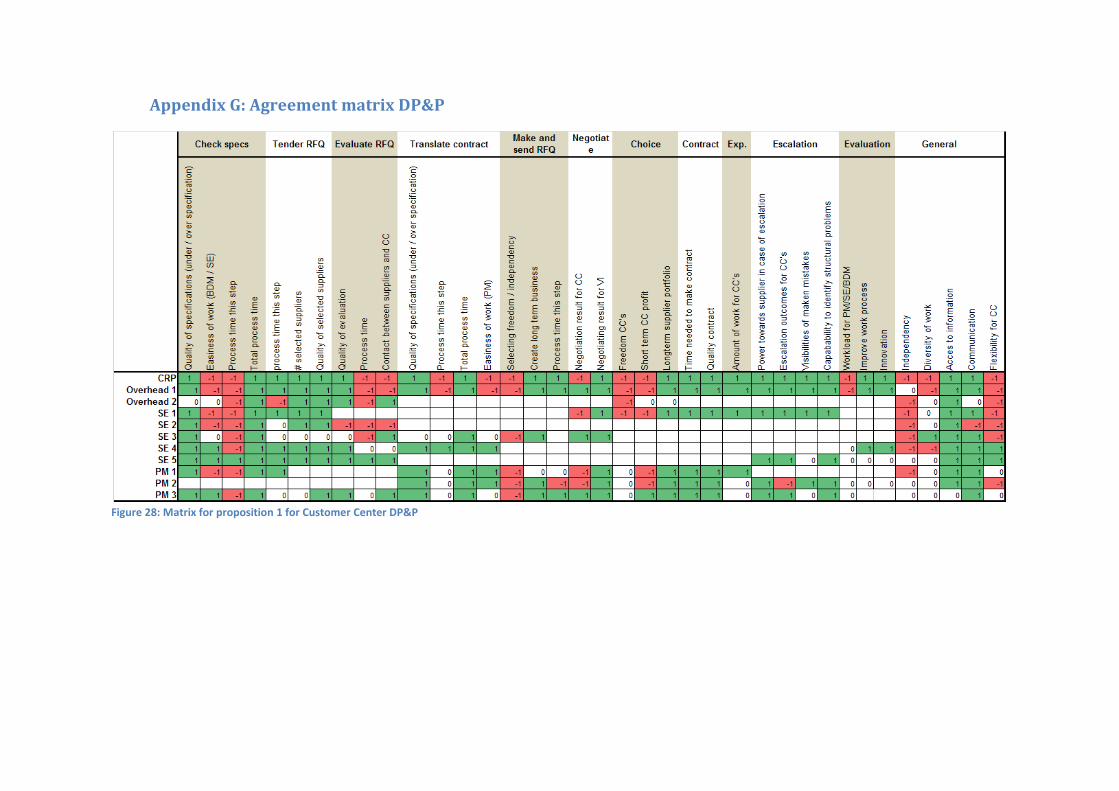
Appendix G: Agreement matrix DP&P
Figure 28: Matrix for proposition 1 for Customer Center DP&P

By Durand Rekko 62
Appendix H: Correlation matrix Performance indicators
Figure 29: Correlation matrix proposition 2
Bold values indicate significant correlations (95%). Yellow cells indicate significant correlation with a positive correlation and an underlying structure.

Appendix I: Merging factors
The merging of the Performance indicators has consequences for the data. In this appendix it is
explained how the merge of the two Performance indicators is applied to the data based on an
example.
1. Imagine the following rankings given two respondents. In total there are 5 Performance
indicators.
2. Imagine that PI ‘learning’ and ‘satisfaction’ in the example are merged. The a new factor is
introduced which retrieves the averages of the rankings.
3. When this is done the problem rises that the rankings are not a ranking from 1 to 5 anymore.
Therefore the values are ‘re-ranked’. So based on the new numbers the 4 Performance
indicators are re-ranked. In the example this would result in the following outcome.
4. This new rankings are then used to calculate the average scores for each CC (step 3 of
appendix B) and from then on everything remains the same.

By Durand Rekko 64
Appendix J: Table with vectors
DP&P SE
DP&P PM
GmbH SE
GmbH PM
Spain SE
Spain PM
CRP
Innovation (1) 9,13 6,00 12,00 7,25 9,00 11,50 6,67 Health & safety (2) 5,00 4,83 2,67 12,00 2,50 13,50 7,67
Team learning & satisfaction (3+14)
9,25 6,83 5,00 6,88 6,75 6,25 5,33
Create long term business (4) 7,25 16,67 13,33 8,00 11,00 6,50 11,00 Quality (5) 10,25 12,00 11,00 11,63 8,75 14,00 12,67
Improve business process (6) 4,50 7,00 5,67 6,25 11,00 8,50 10,33
Customer satisfaction (7) 14,25 16,33 13,67 13,50 12,25 9,00 10,00
Costs (8) 13,25 12,00 9,67 12,00 9,13 16,50 16,00
Company profit (9) 12,75 11,33 15,00 13,75 7,25 8,50 16,33
CC profit (10) 10,50 10,00 14,67 13,25 9,25 9,50 11,00
Information management (11) 5,50 6,67 6,33 9,00 8,25 9,50 10,83
People development (12 ) 6,25 2,33 3,67 2,50 8,63 4,00 3,50
Coll. with other dept. (13 ) 9,50 6,33 5,67 8,75 8,75 7,75 8,00
Environmental performance (15)
3,00 2,67 1,33 5,25 4,88 6,00 3,33
Flexibility (16) 8,75 9,33 11,00 10,00 12,25 8,50 2,67
Planning / process time (17) 7,88 12,67 8,67 9,50 8,63 11,50 6,33
Sales / order intake (18) 16,00 10,00 13,67 3,50 14,75 2,00 11,33
Table 27: Average scores for proposition 2
DP&P SE
DP&P PM
GmbH SE
GmbH PM
Spain SE
Spain PM
Innovation (1) 60,83 40,00 80,00 48,33 60,00 76,67 Health & safety (2) 38,33 37,06 20,44 92,00 19,17 103,50
Team learning & satisfaction (3+14)
49,33 36,44 26,67 36,67 36,00 33,33
Create long term business (4) 79,75 183,33 146,67 88,00 121,00 71,50 Quality (5) 129,83 152,00 139,33 147,25 110,83 177,33
Improve business process (6) 46,50 72,33 58,56 64,58 113,67 87,83
Customer satisfaction (7) 142,50 163,33 136,67 135,00 122,50 90,00
Costs (8) 212,00 192,00 154,67 192,00 146,00 264,00
Company profit (9) 208,25 185,11 245,00 224,58 118,42 138,83
CC profit (10) 115,50 110,00 161,33 145,75 101,75 104,50
Information management (11) 59,58 72,22 68,61 97,50 89,38 102,92
People development (12 ) 21,88 8,17 12,83 8,75 30,19 14,00
Coll. with other dept. (13 ) 76,00 50,67 46,33 70,00 70,00 62,00
Environmental performance (15) 10,00 8,89 4,44 17,50 16,25 20,00
Flexibility (16) 23,33 24,89 29,33 26,67 32,67 22,67
Planning / process time (17) 49,88 80,22 54,89 60,17 54,63 72,83
Sales / order intake (18) 181,33 113,33 154,89 39,67 167,17 22,67
Totals 1505 1530 1541 1494 1410 1465
Table 28: Product of average scores CC’s with averages scores CRP
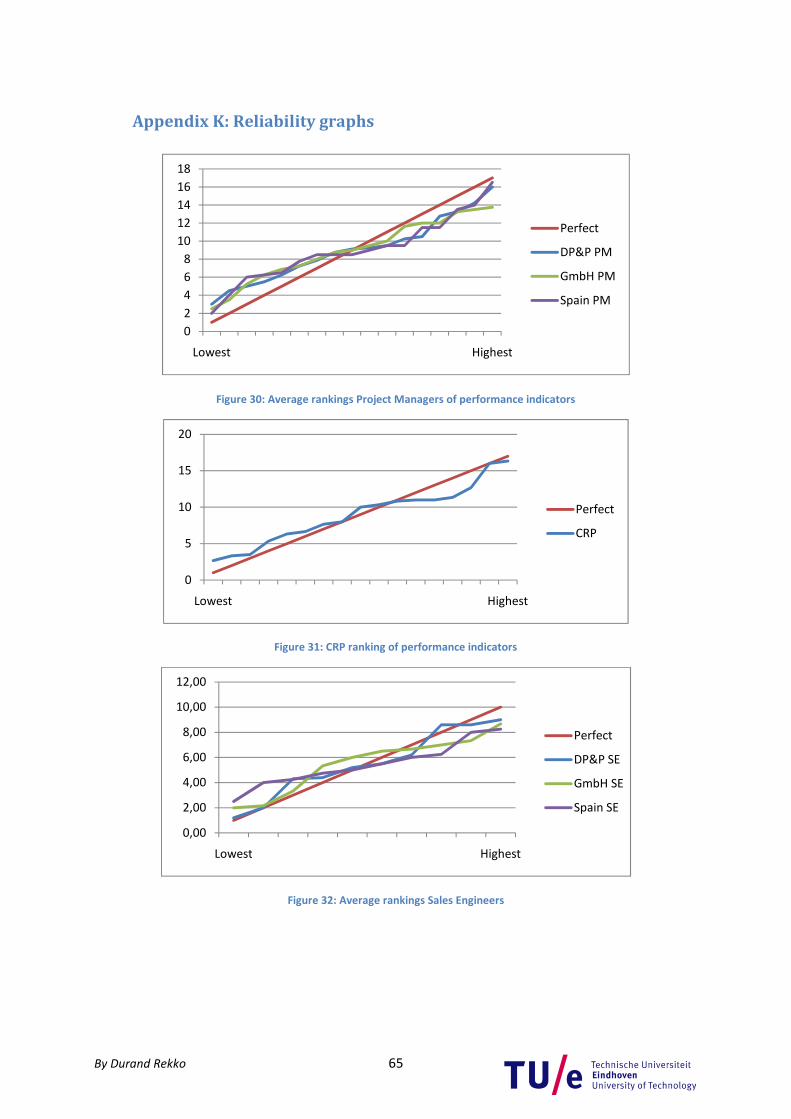
By Durand Rekko 65
Appendix K: Reliability graphs
Figure 30: Average rankings Project Managers of performance indicators
Figure 31: CRP ranking of performance indicators
Figure 32: Average rankings Sales Engineers
0
2
4
6
8
10
12
14
16
18
Lowest Highest
Perfect
DP&P PM
GmbH PM
Spain PM
0
5
10
15
20
Lowest Highest
Perfect
CRP
0,00
2,00
4,00
6,00
8,00
10,00
12,00
Lowest Highest
Perfect
DP&P SE
GmbH SE
Spain SE

By Durand Rekko 66
Figure 33: Average rankings Project Managers of personal incentives
Figure 34: Average rankings all respondents CC of personal incentives
Figure 35: CRP ranking of personal incentives
0,00
2,00
4,00
6,00
8,00
10,00
12,00
Lowest Highest
Perfect
DP&P PM
GmbH PM
Spain PM
0,00
2,00
4,00
6,00
8,00
10,00
12,00
Lowest Highest
Perfect
DP&P All
GmbH All
Spain All
0
2
4
6
8
10
12
lowest highest
Perfect
CRP

By Durand Rekko 67
Appendix L: Correlation matrix personal incentives
Figure 36: Correlation matrix personal incentives
Bold numbers indicate a significant (95%) correlation. Yellow cells are positive correlation which are
significant.

By Durand Rekko 68
Appendix M: Vectors of personal incentives
DP&P GmbH Spain CRP
SE PM All SE PM All SE PM All CRP
Easiness of work (A) 1,20 2,00 1,80 3,33 1,25 2,33 4,75 6,00 5,17 9,00
Work processes (B) 5,20 4,67 4,80 2,00 3,75 3,44 5,00 7,50 5,83 8,67
Job security (C) 2,00 4,33 2,90 7,00 7,50 7,11 4,00 5,00 4,33 5,00
Ability to enterpreneur (D) 8,60 9,33 8,70 8,67 6,75 7,44 8,00 3,50 6,50 2,50
Benefits (E) 6,20 3,00 4,90 5,33 4,50 4,78 5,50 2,50 4,50 5,00
Risk avoidance (F) 4,40 3,33 3,90 2,17 5,75 3,61 2,50 6,50 3,83 8,33
Career possibilities (G) 4,30 5,67 4,75 6,50 4,25 5,11 6,25 4,50 5,67 4,00
Diversity of work (H) 8,60 8,00 8,40 6,67 8,25 7,89 6,00 5,00 5,67 3,00
Visibility of / feedback on performance (I + J)
5,50 5,00 5,65 6,00 6,50 6,39 4,25 4,50 4,33 6,83
Autonomy / independence (K)
9,00 9,67 9,20 7,33 6,50 6,89 8,25 9,50 8,67 2,67
Table 29: Average scores for proposition 3
DP&P GmbH Spain
SE PM All SE PM All SE PM All
Easiness of work (A) 10,80 18,00 16,20 30,00 11,25 21,00 42,75 54,00 46,50
Work processes (B) 45,07 40,44 41,60 17,33 32,50 29,85 44,42 65,00 51,28
Job security (C) 10,00 21,67 14,50 35,00 37,50 35,56 20,00 26,25 22,08
Ability to enterpreneur (D) 21,50 23,33 21,75 21,67 16,88 18,61 20,00 8,75 16,25
Benefits (E) 31,00 15,00 24,50 26,67 22,50 23,89 27,50 12,50 22,50
Risk avoidance (F) 36,67 27,78 32,50 18,06 47,92 30,09 21,88 54,17 32,64
Career possibilities (G) 17,20 22,67 19,00 26,00 17,00 20,44 25,00 18,00 22,67
Diversity of work (H) 25,80 24,00 25,20 20,00 24,75 23,67 18,00 15,00 17,00
Visibility of / feedback on performance (I + J)
37,58 34,17 38,61 41,00 44,42 43,66 30,75 32,46 31,32
Autonomy / independence (K)
24,00 25,78 24,53 19,56 17,33 18,37 22,00 25,33 23,11
Total 260 253 258 255 272 265 272 311 285
Table 30: Product of average scores CC’s with averages scores CRP
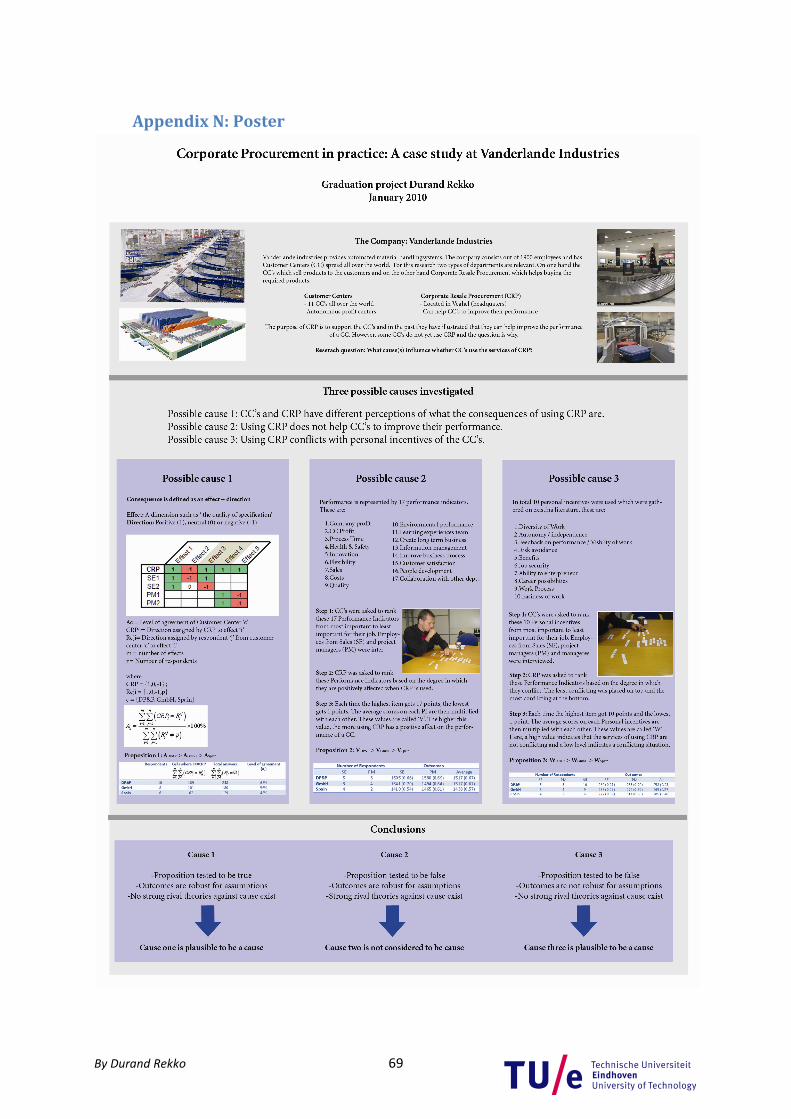
By Durand Rekko 69
Appendix N: Poster