corporate profile - union bank of colombo...4.9% 2.9% 2.6% 3.2% 5.4% 1h 14 1h 15 1h 16 1h 17 1h 18...
TRANSCRIPT
1

2
Overview
* Adjusted for excess capital and legacy non core investment
Strong foundation built over 24+ years
Robust financial and operational performance
H1 PBT up 52% YoY; Adjusted* ROE of 15%
Improved performance despite challenging operating
environment for the banking sector
Received “Best Cash Management Bank Sri Lanka” at Global
Business Outlook Awards 2019
Superior asset quality & healthy capital adequacy
Ratings upgrade received in May 2019
CAR of 17.23% as at June 2019
Strategic building blocks for delivering best in class ROE:
Above market growth
Best in class Retail & SME franchise
Digitization & Innovation
CASA growth
Stable shareholder base and experienced management team
3
Corporate profile

A strong foundation
• 67 Branches
• 121 ATMs
• Sales Force
• 24Hr Contact Center
• Digital Banking
• Competitive product
range
24 Years
Robust risk
framework
Superior
Asset quality
Strong
Capitalisation
Rating upgrade
in 2019 by Fitch
BBB -lka
Experienced board &
management team
Corporate
Governance
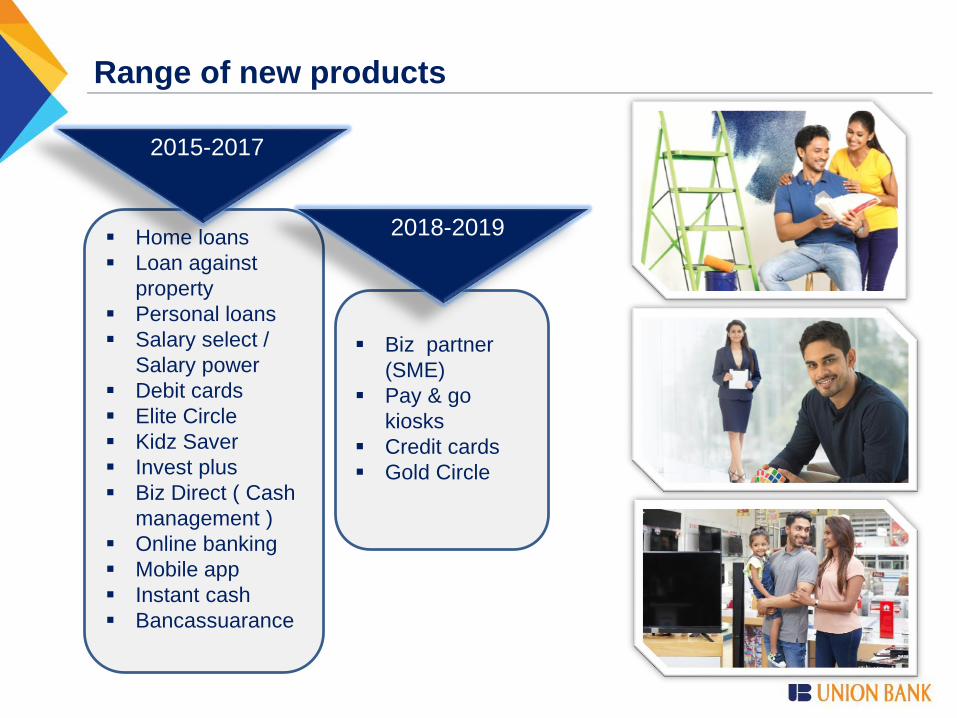
Range of new products
Home loans
Loan against
property
Personal loans
Salary select /
Salary power
Debit cards
Elite Circle
Kidz Saver
Invest plus
Biz Direct ( Cash
management )
Online banking
Mobile app
Instant cash
Bancassuarance
Biz partner
(SME)
Pay & go
kiosks
Credit cards
Gold Circle
2015-2017
2018-2019

Technology & convenience
Online
Banking
Mobile
App
24hrCall Center
4000+
ATMS
POS
Web &
Social Media
Pay &
Go
KiosksVISA
Pay Wave
Best Cash Management Bank
Sri Lanka
Global Business Outlook Awards 2019
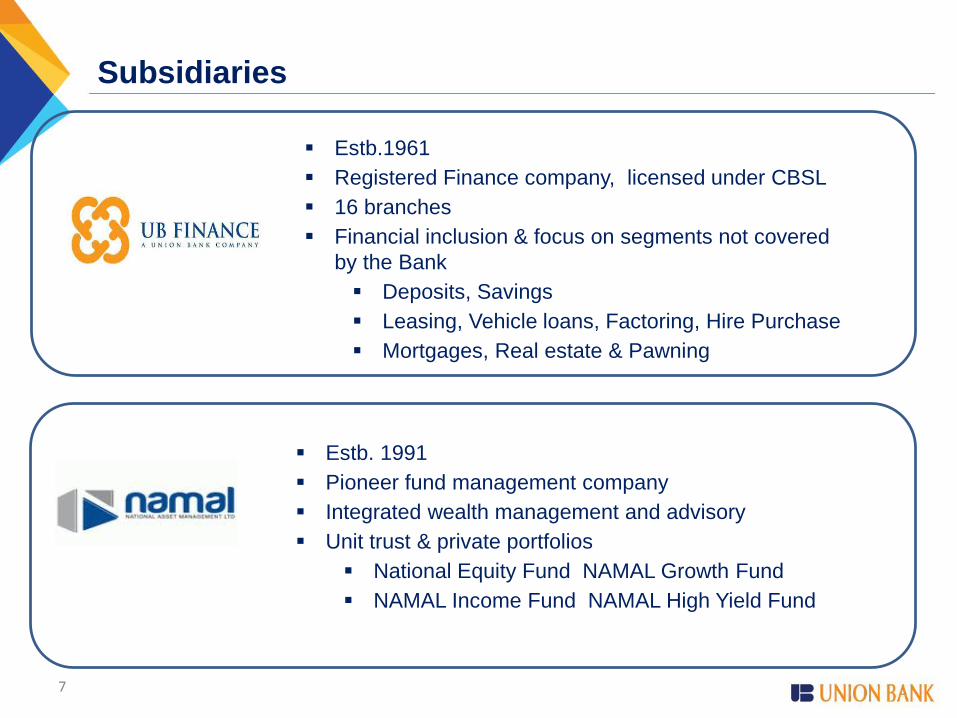
Subsidiaries
7
Estb.1961
Registered Finance company, licensed under CBSL
16 branches
Financial inclusion & focus on segments not covered
by the Bank
Deposits, Savings
Leasing, Vehicle loans, Factoring, Hire Purchase
Mortgages, Real estate & Pawning
Estb. 1991
Pioneer fund management company
Integrated wealth management and advisory
Unit trust & private portfolios
National Equity Fund NAMAL Growth Fund
NAMAL Income Fund NAMAL High Yield Fund
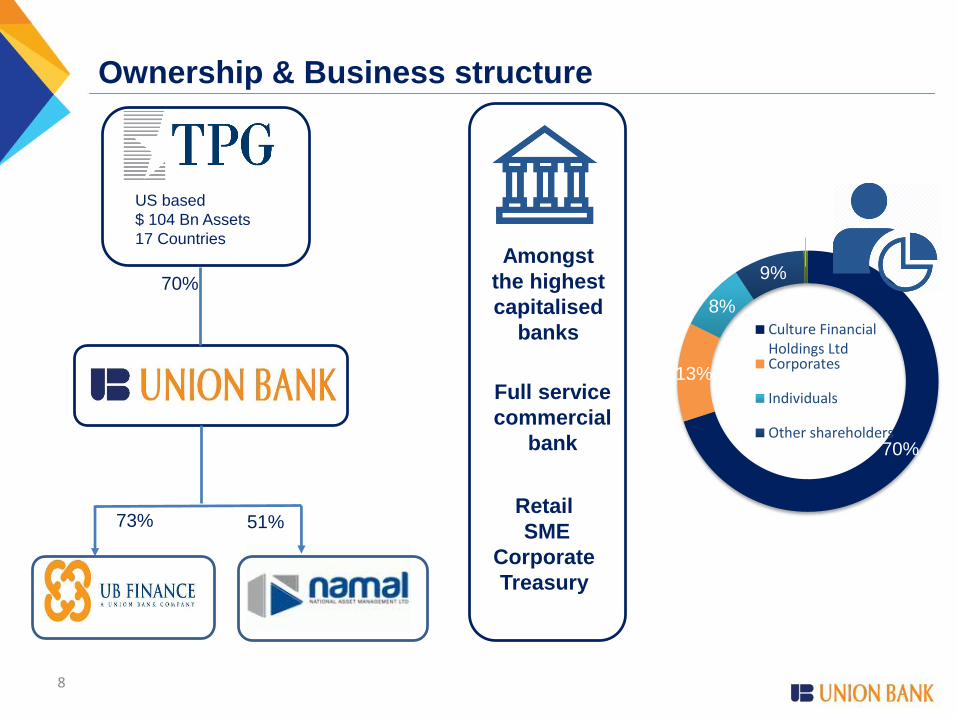
Ownership & Business structure
8
70%
70%
13%
8%
9%
1%
Culture FinancialHoldings LtdCorporates
Individuals
Other shareholders
Full service
commercial
bank
Retail
SME
Corporate
Treasury
Amongst
the highest
capitalised
banks
US based
$ 104 Bn Assets
17 Countries
73% 51%

9
Business Environment

Banking sector
Source: CBSL
13.8%
21.2%17.7%
16.2%19.4%
-0.5%-5.00%
0.00%
5.00%
10.00%
15.00%
20.00%
25.00%
3,000
4,000
5,000
6,000
7,000
8,000
2014 2015 2016 2017 2018 1Q 2019
Net Loans
Net Loans (Rs.Bn) Net loans Growth (%)
12.4%
15.3%16.5%
17.5%
14.8%
1.0%0.00%
5.00%
10.00%
15.00%
20.00%
0
2,000
4,000
6,000
8,000
2014 2015 2016 2017 2018 1Q 2019
Deposits
Deposits (Rs.Bn) Deposit Growth (%)
30.3%
18.1%
7.4% 8.2% 7.4%
0.1%0.00%
5.00%
10.00%
15.00%
20.00%
25.00%
30.00%
35.00%
0
500
1,000
1,500
2,000
2,500
3,000
2014 2015 2016 2017 2018 1Q 2019
CASA
CASA (Rs.Bn) CASA Growth (%)
Sri Lanka banking sector witnessing challenges on growth and asset quality
4.2%
3.2%
2.6% 2.5%
3.4%
4.2%
1.50%
2.00%
2.50%
3.00%
3.50%
4.00%
4.50%
50
100
150
200
250
300
350
2014 2015 2016 2017 2018 1Q 2019
Gross NPA & NPL ratio
Gross NPA (Rs.Bn) Gross NPL Ratio (%)

Source: CBSL
-4%
39%
11%
12%
18%
13%
-
20
40
60
80
100
120
1Q 2014 1Q 2015 1Q 2016 1Q 2017 1Q 2018 1Q 2019
NII
NII (Rs.Bn) NII Growth (%)
-5% -6%
8%15%
31%
-20% -
10
20
30
40
1Q 2014 1Q 2015 1Q 2016 1Q 2017 1Q 2018 1Q 2019
Non Interest Income
Non Interest Income Non Interest Income G (%)
35%
163%
-18%-5%
92%
63%
-
2
4
6
8
10
12
1Q 2014 1Q 2015 1Q 2016 1Q 2017 1Q 2018 1Q 2019
Impairment
Impairment Impairment G (%)
-16%
21%
-2%
39%
23%
-11% -
20
40
60
80
1Q 2014 1Q 2015 1Q 2016 1Q 2017 1Q 2018 1Q 2019
Profit Before all Taxes
PBT PBT G (%)
Banking sector Contd….
Banking sector challenges have resulted in muted financial
performance for banks
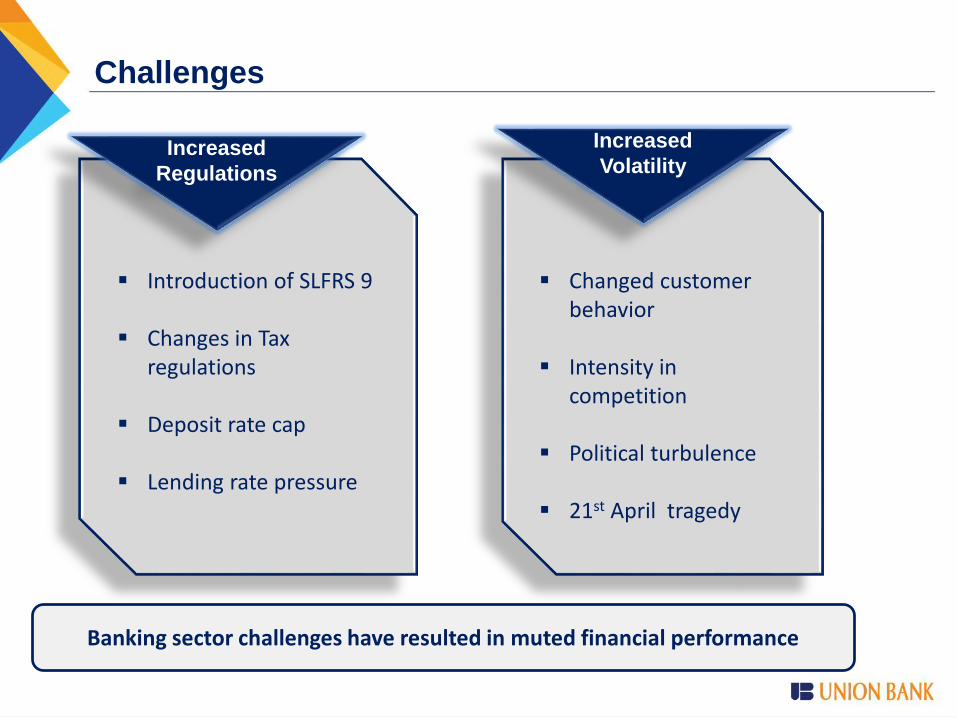
Challenges
Introduction of SLFRS 9
Changes in Tax regulations
Deposit rate cap
Lending rate pressure
Changed customer behavior
Intensity in competition
Political turbulence
21st April tragedy
Banking sector challenges have resulted in muted financial performance
Increased
VolatilityIncreased
Regulations

13
Financial Performance

Profit After
Tax
Growth YoY
17.5%
Key highlights
Total Capital
Adequacy
Ratio
17.2%
Profit Before
all Taxes
Growth YoY
52.0%
14
CASA
Growth YoY
(Avg)
23.3%
Loans
Growth YoY
(Avg)
7.5%
Deposits
Growth YoY
(Avg)
11.3%
Fitch upgrade
to BBB-
First ever
share buy
back in the
banking
sector
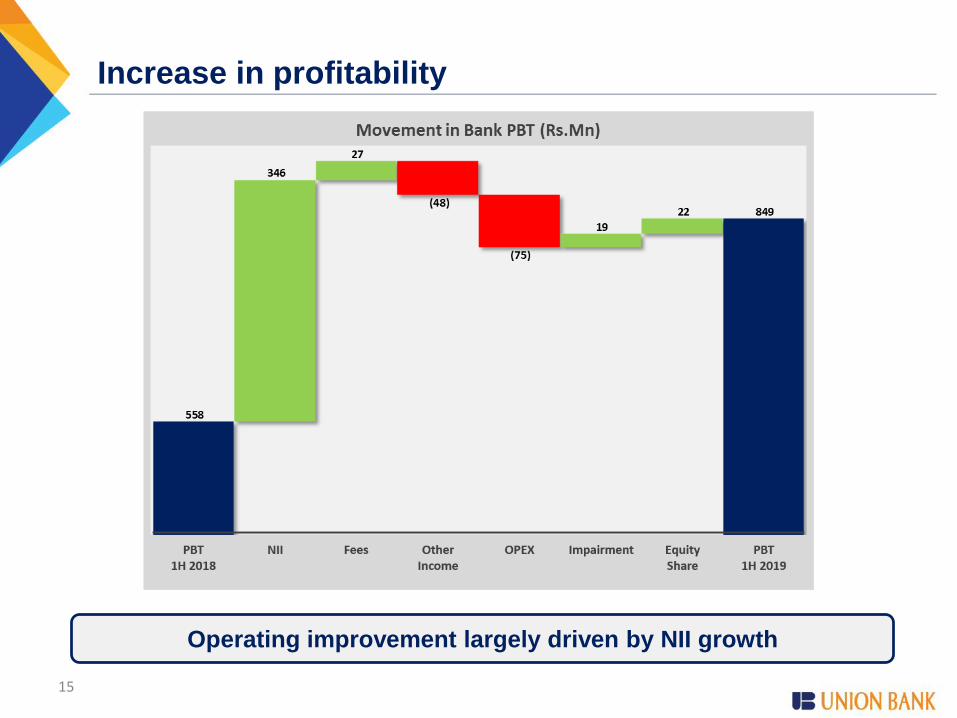
Increase in profitability
C
15
Operating improvement largely driven by NII growth

Growth in assets
16
Bank realigned its loan portfolio amidst volatility in the market
17
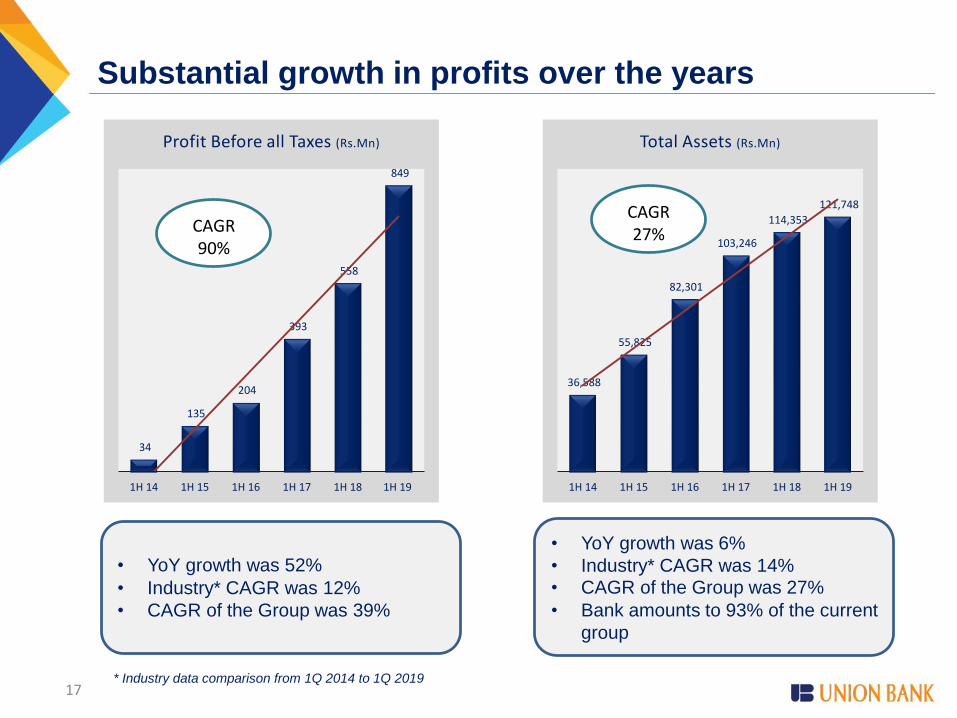
Substantial growth in profits over the years
* Industry data comparison from 1Q 2014 to 1Q 2019
• YoY growth was 52%
• Industry* CAGR was 12%
• CAGR of the Group was 39%
• YoY growth was 6%
• Industry* CAGR was 14%• CAGR of the Group was 27%
• Bank amounts to 93% of the current
group
34
135
204
393
558
849
1H 14 1H 15 1H 16 1H 17 1H 18 1H 19
Profit Before all Taxes (Rs.Mn)
CAGR90%
36,588
55,825
82,301
103,246
114,353
121,748
1H 14 1H 15 1H 16 1H 17 1H 18 1H 19
Total Assets (Rs.Mn)
CAGR27%

Increasing Operating Margin
C
18
Effective revenue and cost
management has resulted in
widening jaws
Exponential growth in revenue
Infrastructure investments were done
in the initial stages
-
100
200
300
400
500
600
700
800
900
1,000
1H 14 1H 15 1H 16 1H 17 1H 18 1H 19
Operating Margin (Rs.Mn)
985 1,350
1,655 2,115
2,575 2,900
1H 14 1H 15 1H 16 1H 17 1H 18 1H 19
Total Revenue (Rs.Mn)
763
1,108 1,432
1,618 1,899 1,974
1H 14 1H 15 1H 16 1H 17 1H 18 1H 19
Total Cost (Rs.Mn)
CAGR24%
CAGR21%
19 * Industry data comparison from 1Q 2014 to 1Q 2019
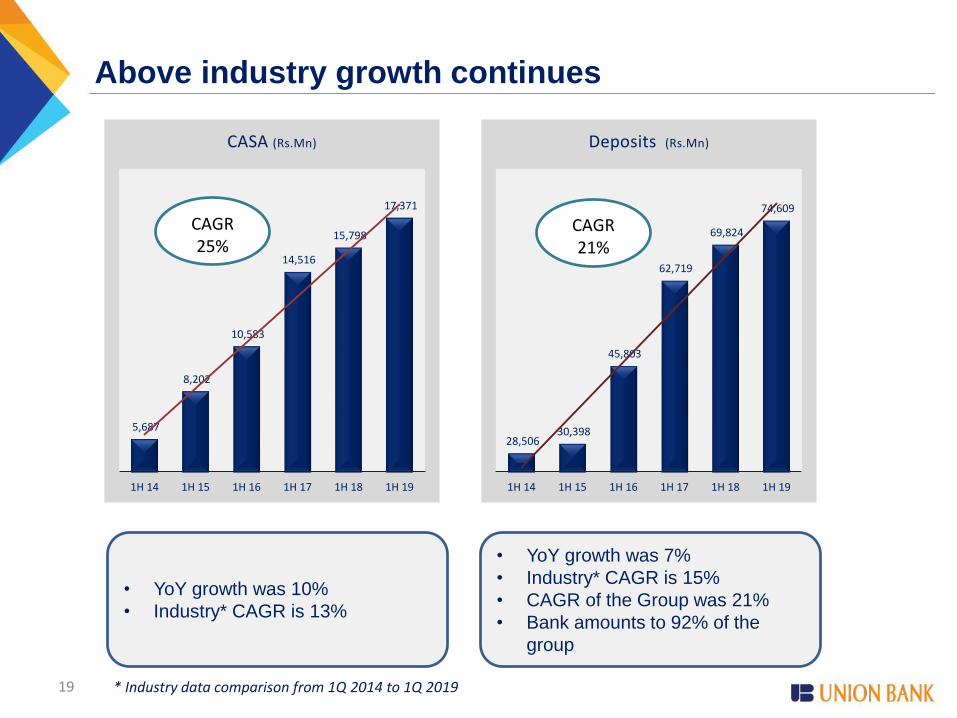
Above industry growth continues
• YoY growth was 10%
• Industry* CAGR is 13%
• YoY growth was 7%
• Industry* CAGR is 15%
• CAGR of the Group was 21%
• Bank amounts to 92% of the
group
5,687
8,202
10,583
14,516
15,798
17,371
1H 14 1H 15 1H 16 1H 17 1H 18 1H 19
CASA (Rs.Mn)
CAGR25%
28,506 30,398
45,803
62,719
69,824
74,609
1H 14 1H 15 1H 16 1H 17 1H 18 1H 19
Deposits (Rs.Mn)
CAGR21%
20
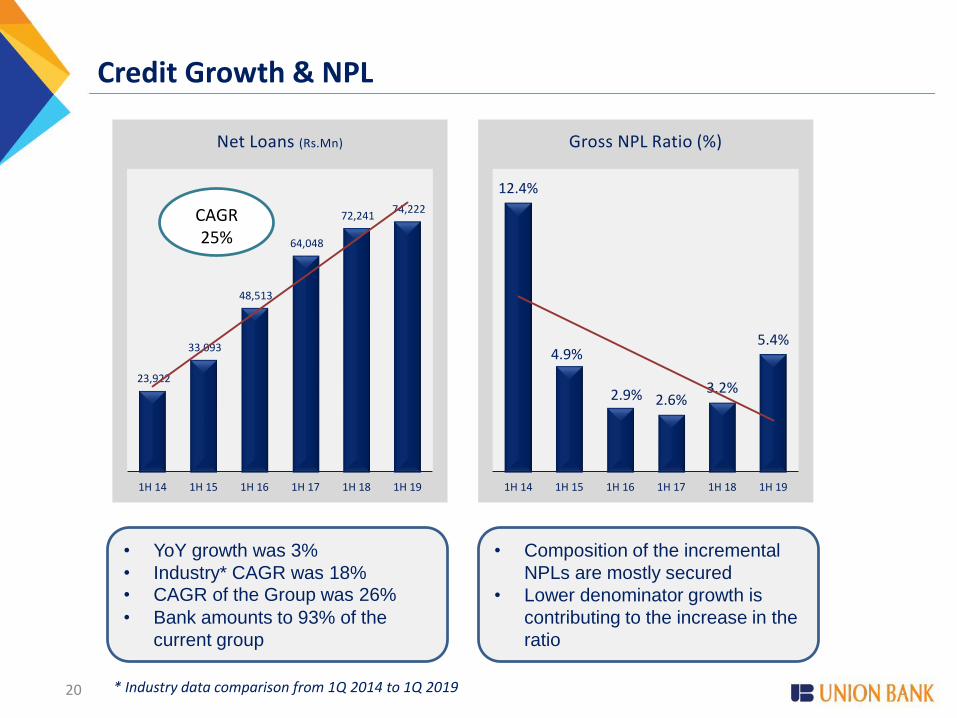
Credit Growth & NPL
12.4%
4.9%
2.9% 2.6%3.2%
5.4%
1H 14 1H 15 1H 16 1H 17 1H 18 1H 19
Gross NPL Ratio (%)
• YoY growth was 3%
• Industry* CAGR was 18%• CAGR of the Group was 26%
• Bank amounts to 93% of the
current group
• Composition of the incremental
NPLs are mostly secured
• Lower denominator growth is
contributing to the increase in the
ratio
* Industry data comparison from 1Q 2014 to 1Q 2019
23,922
33,093
48,513
64,048
72,241 74,222
1H 14 1H 15 1H 16 1H 17 1H 18 1H 19
Net Loans (Rs.Mn)
CAGR25%
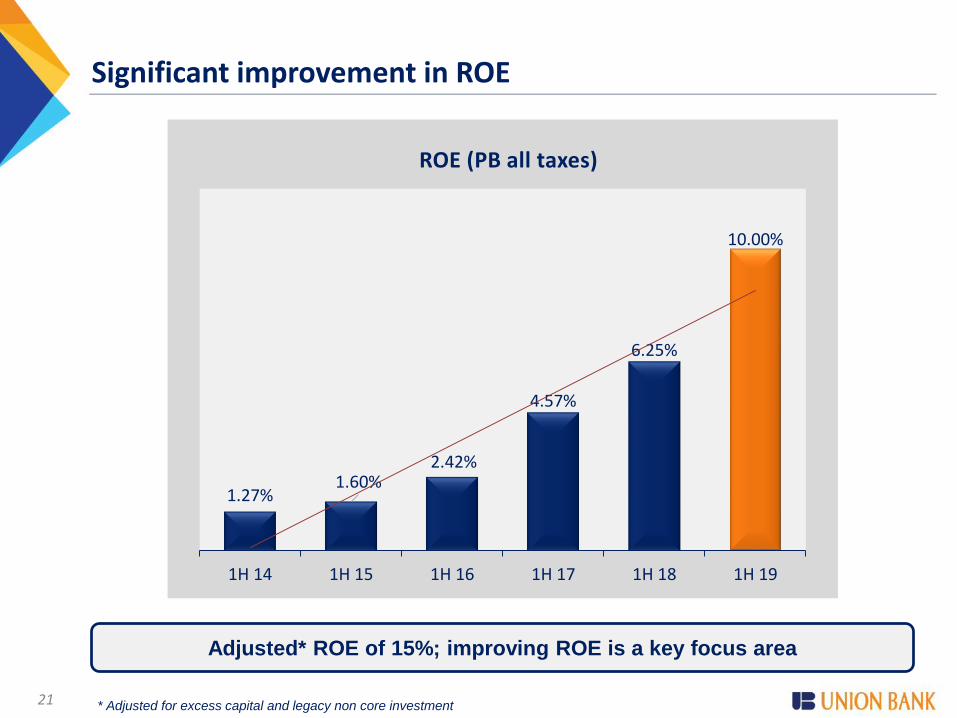
Significant improvement in ROE
21
Adjusted* ROE of 15%; improving ROE is a key focus area
1.27%1.60%
2.42%
4.57%
6.25%
10.00%
1H 14 1H 15 1H 16 1H 17 1H 18 1H 19
ROE (PB all taxes)
* Adjusted for excess capital and legacy non core investment
22
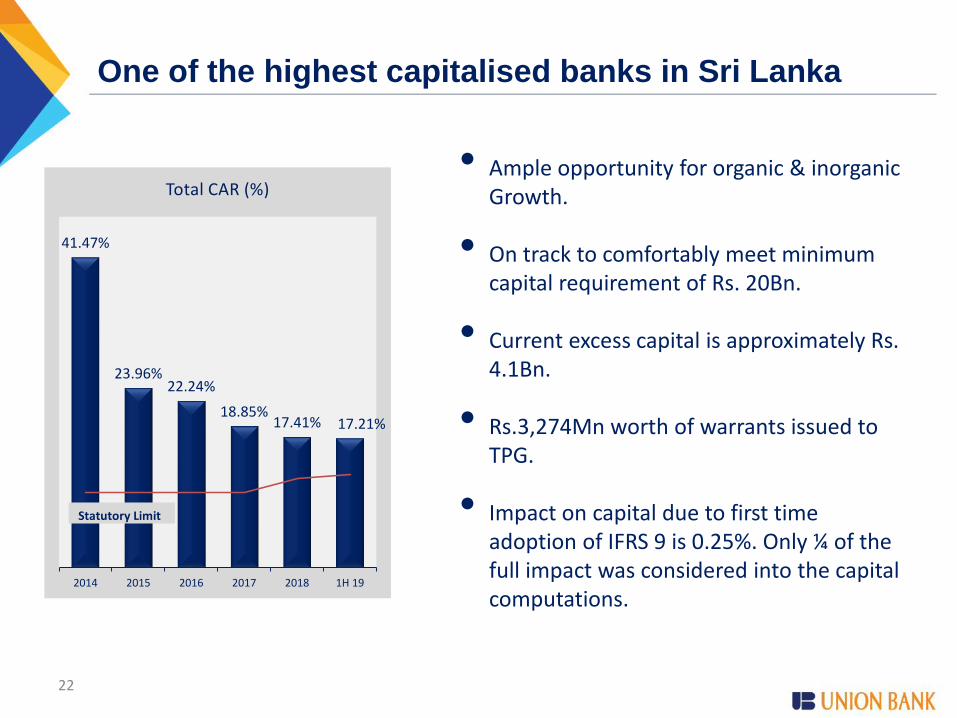
One of the highest capitalised banks in Sri Lanka
• Ample opportunity for organic & inorganic Growth.
• On track to comfortably meet minimum capital requirement of Rs. 20Bn.
• Current excess capital is approximately Rs. 4.1Bn.
• Rs.3,274Mn worth of warrants issued to TPG.
• Impact on capital due to first time adoption of IFRS 9 is 0.25%. Only ¼ of the full impact was considered into the capital computations.
41.47%
23.96%22.24%
18.85%17.41% 17.21%
2014 2015 2016 2017 2018 1H 19
Total CAR (%)
Statutory Limit

23
Strategic Direction
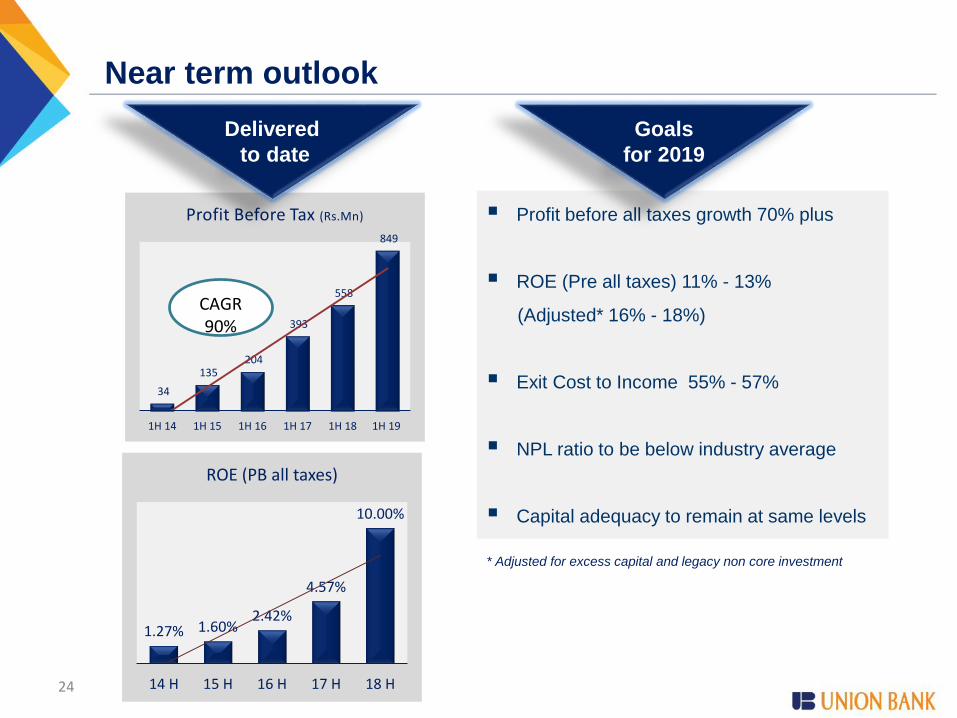
Near term outlook
24
34
135 204
393
558
849
1H 14 1H 15 1H 16 1H 17 1H 18 1H 19
Profit Before Tax (Rs.Mn)
CAGR90%
1.27% 1.60%2.42%
4.57%
10.00%
14 H 15 H 16 H 17 H 18 H
ROE (PB all taxes)
Profit before all taxes growth 70% plus
ROE (Pre all taxes) 11% - 13%
(Adjusted* 16% - 18%)
Exit Cost to Income 55% - 57%
NPL ratio to be below industry average
Capital adequacy to remain at same levels
Delivered
to date
Goals
for 2019
* Adjusted for excess capital and legacy non core investment

Robust Capital Adequacy
Rs 3.5bn worth of warrants
issued to TPG
Capital People
& ExecutionOperating
Leverage
Performance driven culture
Highest standards in ethics
and governance
Key focus on productivity
Energetic and young
workforce
Proficient team with
specialist skills
Alternate Channels
Digital Banking
Robust Analytics
Centralised Model
Flexibility
25
Internal accruals
Less Brick & Motor
Competitive advantage
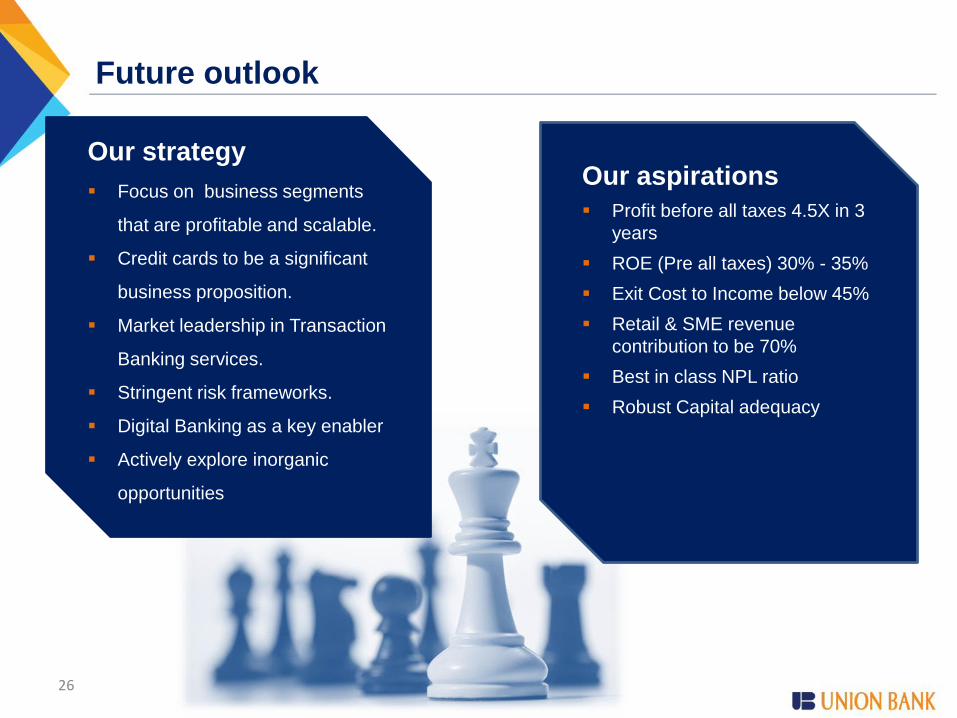
26
Our strategy
Focus on business segments
that are profitable and scalable.
Credit cards to be a significant
business proposition.
Market leadership in Transaction
Banking services.
Stringent risk frameworks.
Digital Banking as a key enabler
Actively explore inorganic
opportunities
Our aspirations
Profit before all taxes 4.5X in 3
years
ROE (Pre all taxes) 30% - 35%
Exit Cost to Income below 45%
Retail & SME revenue
contribution to be 70%
Best in class NPL ratio
Robust Capital adequacy
Future outlook
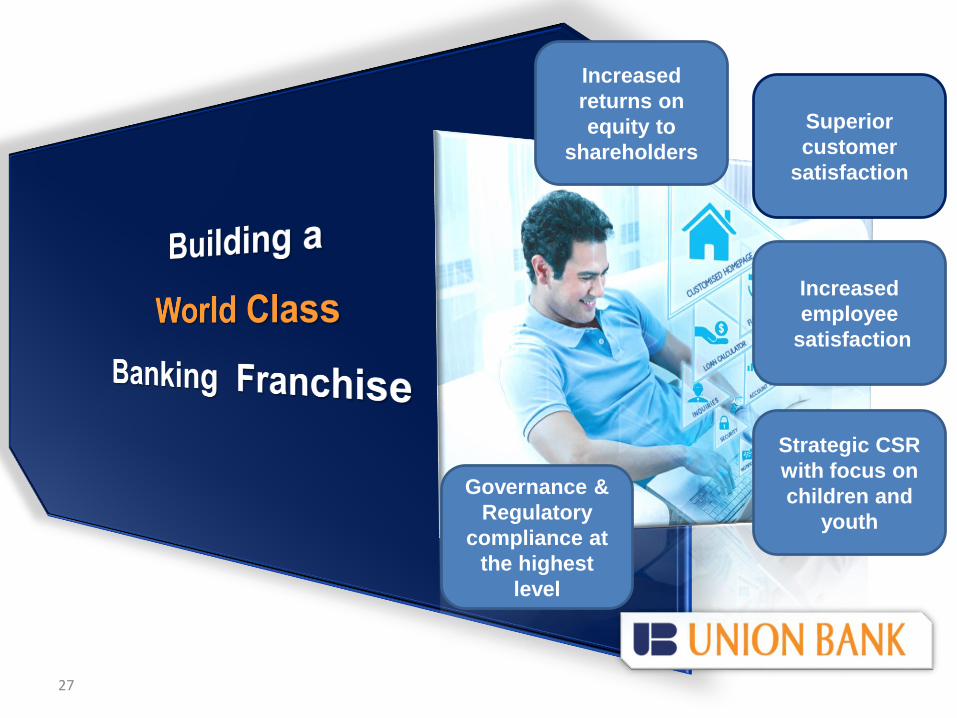
27
Increased
returns on
equity to
shareholders
Increased
employee
satisfaction
Governance &
Regulatory
compliance at
the highest
level
Superior
customer
satisfaction
Strategic CSR
with focus on
children and
youth