corporate scandals and regulation/media/17d96bde... · series of corporate (accounting) ... waymire...
TRANSCRIPT

Corporate Scandals and Regulation*
Luzi Hail The Wharton School, University of Pennsylvania
Ahmed Tahoun London Business School
Clare Wang Kellogg School of Management, Northwestern University
April 2017
Abstract Are regulatory interventions delayed reactions to market failures or can regulators proactively pre-empt corporate misbehavior? From a public interest view, we would expect “effective” regulation to ex ante mitigate agency conflicts between corporate insiders and outsiders, and prevent corporate misbehavior from occurring or quickly rectify transgressions. However, regulators are also self-interested and may be captured, uninformed, or ideological, and become less effective as a result. We develop a historical time series of corporate (accounting) scandals and (accounting) regulations for a panel of 26 countries from 1800 to 2015. An analysis of the lead-lag relations at both the global and individual country level yields the following insights: (i) Corporate scandals are an antecedent to regulation over long stretches of time, suggesting that regulators are typically less flexible and informed than firms. (ii) Regulation is positively related to the incidence of future scandals, suggesting that regulators are not fully effective, that explicit rules are required to identify scandalous corporate actions, or that new regulations have unintended consequences. (iii) There exist systematic differences in these lead-lag relations across countries and over time suggesting that the effectiveness of regulation is shaped by fundamental country characteristics like market development and legal tradition.
JEL classification: F30, G18, G38, K22, L51, M48
Key Words: Accounting fraud, Corporate scandals, Capital market regulation, Economics of regulation, Law and finance, International accounting
* We appreciate the helpful comments of Haresh Sapra (editor) and two anonymous referees. We thank Linda Aikala, Péter Aleksziev, Inês Bastos, Wilbur Chen, Joris de Kok, Manuel Engelmann, Rita Estêvão, Christos Grambovas, Seung Youb Han, Selina Hartmann, Jonathan Hori, Elisabetta Ipino, Keita Kana, Florian Klassmann, Benjamin Miller, Siladitya Mohanti, Andreea Moraru Arfire, Victor Musuku, Varun Sharma, Stefan Romeijn, Ido Spector, Josep Maria Vilà Calopa, Gabriel Voelcker, Halina Waniak, and Melody Xu for their excellent research assistance. We gratefully acknowledge financial support by Wharton’s Global Initiatives Research Program (Luzi Hail), the Institute for New Economic Thinking (Ahmed Tahoun), and the Lawrence Revsine Research Fellowship of the Kellogg School of Management at Northwestern University (Clare Wang). The appendix on the data collection that goes along with this paper is available at: http://ssrn.com/abstract=2960069.
1
“Government regulators—you can count on it—are always late to presumed ‘problems’
that are invariably fixed by market competition. Once again, if regulators could predict
markets, they surely wouldn’t be working as regulators.” Tamny (2015), p. 126
1. Introduction
Can regulators proactively pre-empt corporate wrongdoing before it occurs? And do they
detect and rectify actual misbehavior in a timely and persistent manner? To shed light on the
issue of “regulatory effectiveness,” we examine the lead-lag relations between corporate
(accounting) scandals and (accounting) regulation for a global sample of 26 countries over a
period of more than 200 years.1 This large historical panel lets us test whether corporate
scandals are related to future regulatory actions, or the relation goes the other way, and past
regulations systematically precede future corporate scandals. Such an analysis of temporal
patterns allows us to draw partial inferences about the effectiveness of regulation, and how
regulation has historically been shaped by corporate scandals (e.g., Waymire and Basu 2007;
2011). Given the high economic and social costs associated with corporate scandals, the
importance of such considerations is clear. In monetary terms, the estimated annual cost of fraud
among large U.S. corporations is US$ 380 billion or about 3 percent of the enterprise value of
each firm (Dyck, Morse, and Zingales 2014; see also Karpoff, Lee, and Martin 2008). When the
impact of lost public trust in financial markets is taken into consideration, the cost is even higher
(Giannetti and Wang 2016).
The political economy literature puts forward three main perspectives to help interpret the
observed temporal patterns between corporate scandals and regulation. First, the public interest
!!!!!!!!!!!!!!!!!!!!!!!!!!!!!!!!!!!!!!!!!!!!!!!!!!!!!!!!!!!!!1 We focus on accounting regulation and accounting scandals involving private corporations, but do so in a broad sense. Thus, we also consider regulations and voluntary conventions regarding corporate governance and investor protection and, on the scandal side, incidents of financial frauds, embezzlements, investments schemes, tax evasion, etc. We do not include cases of political scandals and corruption or general financial crises. See Section 2.1 for details. Henceforth, we interchangeably use the terms scandal, corporate scandal, and accounting scandal.

2
view argues that regulators are persons of character who seek public office to change policy and
monitor market mechanisms in the best interest of the public (e.g., Pigou 1938; Witman 1977;
Alesina 1988; Previts and Merino 1998; Diermeier, Keane, and Merlo 2005; Callander 2008).
From this point of view, we would expect “effective” regulation to ex ante mitigate agency
conflicts between corporate insiders and outsiders, and prevent corporate misbehavior from
occurring. Where corporate misbehavior is ongoing or has already occurred, effective regulators
would detect and rectify transgressions in a timely manner, and prevent such incidents from
recurring. Thus, according to this view, newly introduced regulation should reduce the incidence
of future corporate scandals and, from an ex post perspective, current corporate scandals should
increase the enactment of future regulations. At the same time, there might exist positive serial
correlation between today’s regulations and future scandals in the short run, if it requires new
rules for the regulator to become active and identify ongoing corporate actions as unlawful or in
violation of public trust.
Under the second view, legislators and regulators respond to economic incentives in their
best self-interest (see e.g., Stigler 1971, Kalt and Zupan 1984; Krueger 1974; Peltzman 1976;
Frye and Shleifer 1997; Mahoney 2003; Mian, Sufi, and Trebbi 2010; Tahoun and van Lent
2013). They react to pressure from constituents, succumb to lobbying and other rent-seeking
behaviors, and act in general to increase their personal utility. If for these reasons regulators are
captured by the regulated,2 their regulatory actions are unlikely to be effective in serving the
public’s interest (e.g., Stigler 1971; Partnoy 1999; Mahoney 2001; O’Connor 2004). It follows
!!!!!!!!!!!!!!!!!!!!!!!!!!!!!!!!!!!!!!!!!!!!!!!!!!!!!!!!!!!!!"!Regulatory capture can occur through materialistic or non-materialistic means. The former is known as financial capture and indicates that the regulator receives bribes or political donations from the regulated party that wants to maintain its government funding. The non-materialistic, cognitive capture occurs when the regulator’s mindset is in sync with the regulated party due to intense lobbying (see e.g., Engstrom 2013; Carpenter and Moss 2014). Often, a lobbying coalition of “Baptists” (moral message) and “Bootleggers” (moneyed interests) forms and adopts both strategies to achieve their common goals (e.g., Yandle 1983).!
3
that new regulatory activity is unrelated or even positively related to the incidence of future
corporate scandals, if those scandals benefit the special interests of the regulated firms (and,
hence, indirectly the self-interest of the regulators), or if managers are quick to adapt and shift
their corporate wrongdoing to areas beyond the scope of the new regulation. Similarly, corporate
scandals would not lead to an increase in the enactment of future regulations, and regulatory
capture could even lead to a negative association with respect to future rule making.3
A third perspective on regulators’ motivation is ideology (e.g., Kau and Rubin 1979, 1993;
Bernstein 1989; Poole and Rosenthal 1996, 1997; Lee, Moretti, and Butler 2004). Ideological
preferences, like a liberal versus conservative political leaning or a socialist versus capitalistic
view of markets, can be used to explain many different regulatory actions. For instance,
ideological opposition to markets might lead politicians to impose punitive legislation in the
aftermath of a big corporate scandal, inducing a positive correlation between scandals and future
regulatory interventions. Or, a Republican dominated U.S. Congress might pursue deregulation
to further its political agenda, thereby potentially affecting the incidence of future scandals. In
either case, the effectiveness of these regulations from a public interest view is unclear. Thus, on
its own, this view is not of much help for the interpretation of the temporal patterns between
corporate scandals and regulation. Yet, comparisons across countries and over time between
more and less ideologically influenced regimes can provide insights on how special interest
groups affect regulatory behavior (e.g., Rajan and Zingales 2003).
!!!!!!!!!!!!!!!!!!!!!!!!!!!!!!!!!!!!!!!!!!!!!!!!!!!!!!!!!!!!!3 Incomplete information, incompetence, or lack of funding of the regulator also might contribute to regulation being ineffective. Moreover, given the broad historical scope of this study, period-specific factors such as the non-existence of regulatory bodies and/or regulation must be taken into consideration when interpreting our results. For instance, specific and enforceable regulation for financial reporting was largely absent in Belgium before World War I (Van Overfelt, Deloof, and Vanstraelen 2010). Similarly, there did not exist a national legislation on financial reporting in Australia until the second half of the 20th century, and accounting standards were initially developed by competing professional accounting bodies without a clear enforcement structure (Dean and Clarke 2011).

4
To test these ideas, we develop a time series comprising episodes of corporate scandals and
regulation for a global sample of 26 countries over the 1800 to 2015 period. We conduct the
data collection in two steps. First, we use a coarse proxy of the underlying constructs and collect
the yearly number of incidents the terms “scandal” and “regulator” are mentioned in the leading
(business) newspaper in each country. For instance, in the United Kingdom, we search for these
two exact terms in the archive of the Financial Times from 1888 to 2015; in Italy, we search the
archive of La Stampa from 1867 onwards for a series of equivalent Italian terms (i.e., “scandalo”
together with “regolatore” and “legislatore”). The idea behind this broad search is to see whether
the general topics of scandals and regulation produce newsworthy stories without further analysis
of the newspaper content. In a second step, we refine our search and out of all the articles
identify those that cover actual accounting scandals (i.e., financial reporting behavior by firms
that is deemed morally or legally wrong and causes public uproar). This step assumes to a
certain degree that the press plays a role as a watchdog for corporate misconduct (Miller 2006),
and involves an extensive content analysis of historical newspaper articles.4 We collect data on
accounting regulation from secondary literature and (official) depositories of the laws, rules, and
voluntary conventions that cover financial reporting in a country. We use this information to
create a country panel comprising the yearly number of accounting scandals and regulations we
identified in the press and from the other sources. We also code corporate scandals and
regulations that go beyond the narrow scope of financial reporting but relate to firm value and
the protection of minority investors. This large panel of historical data allows us to examine the
lead-lag relations between corporate scandals and regulations, and from the observed correlations
!!!!!!!!!!!!!!!!!!!!!!!!!!!!!!!!!!!!!!!!!!!!!!!!!!!!!!!!!!!!!4 As the famous unravelling of Bernie Madoff’s Ponzi scheme in 2008 illustrates, the watchdog role of the media is not obvious. Both the U.S. Securities and Exchange Commission (SEC) and the media only took a critical interest in Madoff after the markets forced him to liquidate his funds, despite repeated earlier attempts by whistle-blowers to alert the SEC and the press to his questionable investment practices (Markopolos, 2010).
5
to draw inferences against the backdrop of the public interest, regulatory capture, and ideological
theories of regulation.5
We begin the analysis by providing descriptive evidence on the occurrence of corporate
scandals and regulation over time. On an aggregate level, the media mentions of the terms
“scandal” and “regulator” steadily increase from numbers in the double digits in the early 1800s
to about 5,000 just before World War II. The media mentions exponentially grow from 1946
onwards and exceed 34,000 in 2002 and 2006. The two time series are highly correlated, and
closely mirror the expansion of wealth in the global economy, measured by the average gross
domestic product (GDP) per capita of the sample countries. The media mentions also spike
during times of global financial crises (Reinhart and Rogoff 2011). Even though the numbers are
markedly smaller when we focus on the incidents of actual corporate scandals and regulations,
the general pattern we observe over time is very similar. There are, on average, 4.2 (2.4)
episodes of corporate scandals (regulation) in any given year from 1800 to 1969, and this number
increases to 32.5 (14.6) over the 1970 to 2015 period. Thus, frequent scandals and extensive
regulation are a relatively recent phenomenon. At the same time, we observe different waves of
scandals and regulation over time, for instance, around 1860 (U.K. banking crisis), 1890 and
1905 (second industrial revolution), and 1930 (Great Depression). The years 1993 (e.g.,
Metallgesellschaft, Montedison, Banco Español de Crédito) and 2002 (e.g., WorldCom, Dynegy,
ComRoad) display the highest numbers of scandals (66 and 82).6 In total, we identify 2,210
corporate scandals (875 of which are pure accounting scandals) and 1,076 regulations (608
!!!!!!!!!!!!!!!!!!!!!!!!!!!!!!!!!!!!!!!!!!!!!!!!!!!!!!!!!!!!!5 The various theories of regulation are not mutually exclusive but rather coexist in the same market and/or form intermediate cases (Shleifer 2005). Moreover, even though our empirical strategy allows us to identify the direction of the causal relation, we cannot unequivocally attribute the observed serial correlations to a specific theory. 6 See the Appendix for details on the data collection and the time-series pattern of media mentions, corporate scandals, and regulation for each of the 26 sample countries.
6
accounting regulations), or on average at least one corporate scandal (regulation) every 3.5 (4.9)
years in a country.
Going beyond a descriptive analysis, we next exploit the rich panel dimension of our data to
examine the lead-lag relations between corporate scandals and regulations. Following Reinhart
and Rogoff (2011), we test whether one time series is useful in forecasting the other after
controlling for its own lagged values (Granger causality test). We find that the media mentions
of both the terms “scandal” and “regulator” exhibit high positive autocorrelation, indicating that
past mentions in the press are related to future mentions of the same term. Except for the most
recent sample period (after 1970), the mentions of “scandal” lead the mentions of “regulator.”
At the same time, the opposite relation holds, and mentions of “regulator” lead mentions of
“scandal.” We find similar albeit statistically stronger patterns for actual episodes of corporate
scandals and regulation. Both events exhibit a strong positive serial correlation. More to the
point, corporate scandals are positively related to future regulation (except in our most restrictive
model that includes year fixed effects), suggesting that they act as an antecedent to regulatory
intervention. This correlation is consistent with regulators being less flexible and informed than
firms and, hence, taking a reactive approach to regulation. However, on its own, the relation
does not tell us whether regulation has been effective. It could represent the benevolent regulator
trying to quickly fix the problem, the captured regulator hiding behind regulatory activism, or the
ideological regulator imposing an imprint. We also find that regulation acts as an antecedent to
future scandals. This positive correlation suggests that regulators are not fully effective because,
for instance, regulations are not properly enforced (e.g., Christensen, Hail, and Leuz 2013;
2016), or firms might direct their misbehavior to areas outside the scope of the new regulation.
Maybe only the existence of explicit rules lets the regulator identify corporate actions as

7
unlawful and in violation of public trust. The results are robust to controlling for economic
development, inflation, the occurrence of financial crises, and country and year fixed effects.
They also hold, but are weaker (particularly, for the relation of scandals leading regulation),
when we limit the analyses to the subset of accounting scandals and accounting regulations.
In additional analyses, we check for differential lead-lag relations between corporate
scandals and regulation over time, across groups of countries, and for individual countries. We
find that the leading role of scandals is only present after 1946, but then again vanishes in the
early 1970s. Regulation acts as an antecedent to scandals both before and after World War II,
but loses its predictive power in the most recent period after 1970. One issue with the last five
decades is that corporate scandals and regulations become very frequent events, reducing the
power of the tests. The leading role of scandals is more pronounced in emerging markets and
countries with weak rule of law (based on the La Porta, Lopez-de-Silanes, Shleifer, and Vishny
1998 index).7 This finding is consistent with regulation being less able to curb the occurrence of
future corporate scandals in those environments, even though the regulatory response – on paper
– has been intense. We also find that the reactive role of regulation is particularly pronounced in
English common law countries and German commercial code countries, but not present in
countries with French legal tradition. German commercial code countries also exhibit the largest
positive correlation between current regulation and future scandals. In a country-by-country
comparison, the leading role of corporate scandals is significant in 14 out of 26 cases, most
strongly in Israel, Greece, South Korea, and India. In all these countries, regulation is not
significantly autocorrelated. Regulation has predictive power for future scandals in 15 countries,
most notably in Spain, Israel, Denmark, and Austria. Thus, our analyses point to systematic
!!!!!!!!!!!!!!!!!!!!!!!!!!!!!!!!!!!!!!!!!!!!!!!!!!!!!!!!!!!!!7 Partitions based on modern-day investor protection measures only reflect a snapshot, and do not capture the long-term evolution of the legal forces shaping the functioning of capital markets (e.g., Franks, Mayer, and Rossi 2009).

8
differences in the time-series pattern of corporate scandals and regulation in the cross-section
and over time, suggesting that the effectiveness of regulation is shaped by local institutional
factors and fundamental country characteristics like market development and legal tradition.
Aside from a novel dataset and descriptive evidence on the historical evolution of corporate
misbehavior and regulation of financial markets for a broad cross-section of countries around the
globe, our study contributes to the better understanding of the role and functioning of regulation.
As anecdotal evidence suggests and our data confirm, regulatory activity has a strong reactive
component.8 Yet, we find no evidence that these regulations can curb corporate misconduct.
Rather to the contrary, today’s regulations are a strong predictor of future fraudulent behavior,9
be it because firms are quick to adapt and move their activities to unregulated areas, or – from a
more benevolent perspective – because regulators rely on exactly defined rules to identify and
prosecute corporate wrongdoing. Another explanation for the positive correlation could be that
well-intended regulations “backfire” and lead to unintended consequences (Merton 1936).10
Regardless of the motive, our evidence shows that corporate scandals follow past attempts at
regulatory reform, which begs the question of how to break this “vicious cycle” of scandals
followed by bouts of regulatory activism without consideration of the long-term effects on the
economy as a whole (Waymire and Basu 2011).
!!!!!!!!!!!!!!!!!!!!!!!!!!!!!!!!!!!!!!!!!!!!!!!!!!!!!!!!!!!!!8 This pattern is sometimes referred to as the “crisis theory” of regulation. Some prominent examples of this theory are the British Joint Stock Companies Act of 1844 that followed widespread business failures and bankruptcies (Littleton 1933), the 1933/34 U.S. Securities and Exchange Acts on the heels of the Great Depression and the famous Kreuger crash, the creation of the China Securities Regulatory Commission (CSRC) in the wake of riotous protests by disgruntled investors during the infamous Shenzhen “8.10 incident” in 1992 (e.g., Wei 2009), or the U.S. Sarbanes-Oxley Act passed in 2002 in light of corporate scandals like Enron, WorldCom, etc. (e.g., Ball 2009). 9 Historically, several major (accounting) regulations preceded major corporate scandals. For example, the British Bubble Act was enacted in June 1720 before the bursting of the South Sea Bubble in September and October of the same year (e.g., Harris 1994; Waymire and Basu 2007). The U.K. Railway Regulation Act (1844) preceded the Railway Mania of 1845/47 (Arnold and McCartney 2003). Mandatory fair value reporting stipulated in the German Commercial Code of 1861 was reversed after fair values were found to contribute to a financial market bubble and crisis (“Gründerkrise”) in the early 1870s (e.g., Richard 2005; Hoffmann and Detzen 2013). 10 For examples of negative unintended consequences of recent accounting regulations, see Bushee and Leuz (2005), Leuz, Triantis, and Wang (2008), or Gao, Wu, and Zimmerman (2009).

9
In Section 2, we describe the data collection and the research design. Section 3 discusses the
sample and provides (graphical) descriptive evidence on the historical time series of corporate
scandals and regulation. We present the main results of the lead-lag regressions in Section 4.
Section 5 reports results for different sub-periods of the 215-year sample period, different sub-
sets of the 26 sample countries, and on a country-by-country basis. Section 6 concludes. We
provide further details on the data collection and the individual countries in the Appendix.
2. Data Collection and Research Design
In this section, we develop a definition of our two main theoretical constructs, corporate
(accounting) scandals and (accounting) regulation. We then describe how we operationally
apply the two definitions in the data collection procedure. We conclude by outlining the basic
research design that we use to examine the lead-lag structure between corporate scandals and
regulation in our global panel dataset.
2.1. Definitions of Corporate Scandals and Regulation
For the purposes of this study, we start with a narrow focus on corporate scandals and
regulations in the area of financial reporting and accounting, but then in the data collection
broaden the scope of our search to also include related scandals and regulations that might affect
the personal wealth and legal status of minority investors. We define an “accounting scandal” as
the alleged or actual financial reporting behavior of a firm (or multiple firms) that is publicly
condemned as morally or legally wrong and causes shock and upset among the general public.
This definition contains several key elements.11 First, for a scandal to be an accounting scandal,
!!!!!!!!!!!!!!!!!!!!!!!!!!!!!!!!!!!!!!!!!!!!!!!!!!!!!!!!!!!!!11 We derive our definition from various sources explaining the terms scandal (http://www.merriam-webster.com), accounting scandal (Jones 2011), corporate fraud (Dyck, Morse, and Zingales 2010; 2014), or financial misconduct (Karpoff, Koester, Lee, and Martin 2017).
10
it must somehow relate to management’s use of the financial reporting system in a way that
objectively misrepresents the firm’s underlying economics. Such aggressive reporting practices
include, but are not limited to, overstating corporate assets and revenues, understating or
omitting liabilities and expenses, and the use of complex accounting methods or operating
structures to obfuscate and misdirect the flow of company funds.12
Second, for the accounting practices to be scandalous, they have to be condemned as
morally or legally wrong. Going beyond the traditional statutorily-derived definition of financial
misconduct (e.g., Karpoff, Koester, Lee, and Martin 2017), the expression “morally wrong”
refers to practices that attract intense public scrutiny or criticism, irrespective of their legality or
conformity with contemporary accounting principles. An example would be the public outcry
that accompanied Enron’s mark-to-market accounting for its energy trading business that – even
though within the boundaries of GAAP – lacked quoted prices and, therefore, allowed for largely
discretionary valuations as well as its use of special purpose entities to shift legal liabilities off
the balance sheet. The term “legally wrong” refers to accounting fraud, that is, intentional acts
by individuals or management that occur outside of the regulatory framework and result in
material misrepresentations of financial statements. If not yet proven, fraud is only alleged. An
example would be the backdating of employee stock options by U.S. tech companies in the mid
2000s.
Third, for the general public to be sufficiently shocked and upset, the accounting practices
need to be economically significant and a prominent subject of the public discussion. Both
aspects are difficult to define in precise terms. The first part, economic significance, is related to
the concept of materiality in accounting, and means that the reporting misstatements must have
!!!!!!!!!!!!!!!!!!!!!!!!!!!!!!!!!!!!!!!!!!!!!!!!!!!!!!!!!!!!!12 The narrow definition of accounting scandals excludes other types of corrupt corporate behavior (e.g., insider trading, bribery, tax evasion, etc.) without an explicit financial reporting angle. However, we categorize these actions as other scandals (see Section 2.2.2) to use them in our analyses.

11
the potential to mislead corporate outsiders in their decision-making. The second part requires
the accounting practices to be a topic of discussion among, for instance, regulators, politicians,
the business press, and the broader media.
The second construct underlying our analysis is “accounting regulation.” 13 ! Generally
speaking, regulation refers to the legal imposition of formal rules with the intent to modify the
economic behavior of firms or individuals. Regulation can take on various forms (e.g., Shleifer
2005; Ball 2009; Sunder 2016); through explicit legislation, by the power of the courts like in
common law countries, or by tasking government administrative bodies and private entities with
the coordination, implementation, and monitoring of the rules. Accounting regulation is the field
of national and supranational laws, rules, and conventions that cover the preparation, content,
presentation, and dissemination of accounting information, typically in the form of published
financial statements. In a broader sense, it also encompasses regulation rendering financial
statements more useful like rules on insider trading, the protection of shareholders and creditors,
or the recovery of damages when the disclosed information is wrong or incomplete.
Accounting regulation derives from many sources, including company laws, securities laws,
stock exchange-imposed requirements, legal precedents, and generally accepted accounting
principles (GAAP). 14 We consider rules applicable to all publicly listed firms as well as
industry-specific regulations where appropriate (e.g., due to their formative influence on broader
regulations like the 1868 Regulation of Railways Act in the U.K., or because of their wide
!!!!!!!!!!!!!!!!!!!!!!!!!!!!!!!!!!!!!!!!!!!!!!!!!!!!!!!!!!!!!13 We draw our definition from several sources like the OECD (https://stats.oecd.org/glossary/detail.asp?ID=3295), La Porta et al. (1998), La Porta, Lopez-de-Silanes, and Shleifer (2006), and Leuz and Wysocki (2016). 14 We do not consider social norms or informal relations like trust that might determine accounting practices and investor protection (e.g., Sunder 2005; Franks, Mayer, and Rossi 2009) unless they were codified and available in written form. However, whenever possible, we include self-regulation like the formation of the American Institute of Certified Public Accountants or the Swiss Foundation for Reporting Recommendations. We also include important auditing regulations (e.g., U.S. Auditing Standard no. 2 on the audit of internal control over financial reporting) as well as tax laws when there is conformity between book and tax accounting (e.g., the Municipal Income Tax Act of 1928 in Sweden that implicitly linked the two sets of accounts).

12
bearing within the industry like the risk disclosure requirements under the third pillar of the
Basel II accord for financial services firms). The notion of materiality also applies to accounting
regulation. We regard the introduction of regulatory acts as material if they lead to substantive
changes in the year-to-year reported accounting numbers or to an extension (reduction) of public
filings and disclosures. The 2005 mandatory adoption of IFRS for firms traded on regulated
markets in the European Union (EU) would be a prime example of a regulatory change that had
far-reaching consequences for firms’ reporting. SFAS 2 in 1975 on the accounting for research
and development costs or SFAS 141 in 2002 on the accounting for business combinations under
U.S. GAAP would be other examples (see e.g., Balsam, Haw, and Lilien 1995).
2.2. Collection of Historical Data on Corporate Scandals and Regulation
Based on the above conceptual definitions, we develop a data collection protocol that allows
us to operationally grasp the two constructs we have in mind, and apply it to a broad cross-
section of countries over a long time series. We distinguish between the sources that we rely on
to gather the data, and the classification of the collected data. This procedure leads to the initial
sample available for the empirical analyses.
2.2.1. Data Sources
To identify the sources for the data collection, we build on the work of existing studies on
the topic (e.g., International Practice Executive Committee 1975; Waymire and Basu 2007, 2011;
Previts, Walton, and Wolnizer 2010; Jones 2011) and hand-collect extensive new materials from
diverse primary and secondary sources. We then carefully scour each source for relevant events.
Specifically, we perform the following three steps: (1) we review the related literature, (2) we

13
systematically search the leading (business) newspapers in each country, and (3) we contact local
experts for advice regarding additional materials and resources.
In the first step, we survey the academic and practitioner literature through a keyword search
of library catalogues, online databases, and the use of Internet search engines. For each source,
we conduct both a general cross-country search and a targeted search of individual countries
using a comprehensive list of terms (or their local equivalents).15 The literature review yields
numerous cross-country surveys and individual country studies in the form of books, journal
articles, and websites. The episodes of corporate scandals and regulation identified through this
review of secondary sources serve as the starting point for the coding of our database.
The second step comprises a systematic archival search of the historical editions of the local
business press and other media outlets. For each sample country, we identify one or multiple
leading daily newspapers (ideally with a business focus), and search their electronic archives
using the same keywords (or their local equivalents) as listed above. Table 1 provides an
overview of the newspaper outlets used by country, and lists their accessibility and the period
covered by each source.16 For instance, in France, our primary sources are the historical archives
of Le Figaro (1826 to 1942) and Le Monde (1945 to 2015), two of the leading newspapers over
time. We complement these general interest outlets with searches in the financial and business
centric newspapers Journal des Finances and Les Échos, when these were available. In most
cases, we hire and train research assistants at local universities to help us with this search. If
electronically searchable newspaper archives are not available, we use hardcopies, microfilm !!!!!!!!!!!!!!!!!!!!!!!!!!!!!!!!!!!!!!!!!!!!!!!!!!!!!!!!!!!!!15 Specifically, we use the following keywords: “accounting scandal,” “accounting fraud,” “corporate scandal,” “corporate fraud,” “financial misconduct,” “accounting manipulation,” “earnings management,” “earnings manipulation,” “creative accounting,” “accounting regulation,” “disclosure regulation,” “securities regulation,” and “securities law.” In addition to the direct translations of these terms, we also use country-specific keywords such as “Companies Act” in the U.K. or “Securities and Exchange Act” in South Korea. 16 We contact local academics to ensure that we use appropriate news outlets and translations of the terms in our search list of the online databases and news archives. Similarly, we investigate how the search terms might have changed over time due to the long sample period.

14
versions, or electronic copies instead, and adapt our search strategy such that we still can identify
the major corporate scandals in a country. For instance, in Portugal there are no electronically
searchable newspaper archives available for large parts of the sample period. Thus, we skimmed
every Friday edition or, when newspaper length shortened in the early years, the daily front page
and business section of the newspaper Diário de Notícias on location at the National Library of
Portugal in Lisbon for events. For each potential scandal we identified, we conducted additional
research to better understand the issues and help us with its classification. We also ensured that
at least two people of the research team independently classified each scandal (and regulation),
and then discussed and resolved the cases with disagreements.
In the third step, we contact local accounting experts, legal historians, or professional
organizations to seek help identifying additional resources and gauging the quality of the data.
That is, after we have assembled the initial dataset based on primary and secondary resources
and reviewed it for consistency, we asked a local expert to assess the completeness and
plausibility of the entries. For example, in the U.K., we contacted the financial reporting faculty
at the Institute of Chartered Accountants in England and Wales (ICAEW) to help us review the
U.K. dataset. We provide additional details on the secondary literature, the keyword search, the
data sources, and the data collection for each sample country in the Appendix.
2.2.2. Data Classification
Because of the broad search terms, the identification of source materials yields a large
number of corporate scandals and regulatory changes. This trove of data needs further vetting.
To narrow our focus on scandals that are consistent with the conceptual definition, we ask the
following four questions for each event: (1) Does the event involve one or more financial
reporting practices? (2) Are these practices either morally wrong (e.g., aggressive or creative
15
accounting) or legally wrong (i.e., alleged or actual accounting fraud) under local customs or
jurisdiction? (3) Does the event trigger material (negative) consequences for corporate outsiders
such as a drop in share prices, or subsequent bankruptcy? (4) Does the event cause a public
outcry and discussion as witnessed by prominent coverage in local newspaper outlets and
subsequent examination in secondary literature? Only if we can affirmatively answer all four
questions do we classify the event as a pure accounting scandal.17
If a corporate scandal does not directly involve financial reporting practices (or financial
reporting only plays a minor role) and fails the first criterion (but meets the other three criteria),
we classify it either as near accounting scandal or as other scandal. Near accounting scandals
are incidents which do not involve material misrepresentations of financial statements, but for
which accounting information likely played an important part in forming market participants’
expectations about the firm. An example would be the asset stripping ploy that became famous
as the “bottom of the harbor” tax avoidance scheme in Australia of the 1970s. It involved the
engineering of financial accounts, but defrauding tax authorities was the main goal. We classify
corporate scandals without an explicit or implicit accounting angle (e.g., insider trading, bribery,
theft, investment schemes, etc.) that nonetheless have the potential to affect future regulation as
other scandals. A famous historical example pre-dating our sample period would be the South
Sea Bubble in 1720 that resulted in highly inflated prices of the South Sea Company stock (e.g.,
Waymire and Basu 2007; Goetzmann, Labio, Rouwenhorst, and Young 2013). Table 2
illustrates how we apply the above criteria with examples of U.K. events that we classified into
the various categories of corporate scandals.
!!!!!!!!!!!!!!!!!!!!!!!!!!!!!!!!!!!!!!!!!!!!!!!!!!!!!!!!!!!!!17 Traditionally, financial misconduct includes actions such as the forced restatement of financial reports, securities class action lawsuits, or accounting and auditing enforcement releases by, e.g., the U.S. SEC or the China Securities Regulatory Commission. Our definition subsumes those cases but only if they are substantive enough and cause public outcry and discussion. Thus, we end up with only a small fraction of the cases shown in Karpoff et al. (2017) for the U.S. or in Hung, Wong, and Zhang (2015) for China.

16
We apply similar principles to regulatory acts. We classify all laws, standards, and
conventions dealing with the recognition and/or disclosure of corporate events in the financial
reporting system as accounting regulation in a narrow sense. To assess materiality, we rely on
accounting textbooks, legal texts, publications by the big international audit firms, local experts
as well as on the extent of coverage of the regulatory acts in the business press.
We further distinguish between national and supranational regulation. The latter category
encompasses regulatory acts that are decided upon by international governmental or private
organizations (e.g., the European Commission, or the International Accounting Standards Board
IASB), and subsequently agreed upon and adopted in the signing countries or transposed into
national law. An example is the Transparency Directive passed by the EU legislature in 2004
that addresses corporate reporting and disclosure issues for firms traded on regulated EU
markets. For these supranational regulations, the link between local economic conditions and the
enactment of the law should be less pronounced (Christensen, Hail, and Leuz 2016). Similarly,
we expect weaker links between scandals and local regulations when the regulatory activity is
heavily influenced by international events (e.g., the influence of the French Code through the
Napoleonic wars) or colonial ties (e.g., the influence of British law in Australia or Canada), but
we do not separately code these events. We classify regulatory acts that do not directly cover
financial reporting practices but still render financial statements more useful to corporate
outsiders as other regulation. An example is the Prevention of Fraud Act enacted by the U.K.
Parliament in 1939 to regulate the proliferation of newly listed companies at the time.

17
2.3. Research Design
Our basic research design follows from Reinhart and Rogoff (2009; 2011).18 The idea is to
examine the lead-lag relations between our two main variables of interest, corporate scandals and
regulation, to determine whether one time series is useful in forecasting the other after
controlling for its own lagged values (Granger causality test). That is, we model the time series
of corporate scandals as a function of its own past values and the past values of regulatory
actions, and vice versa. The observed relations tell us something about the “predictive causality”
between the two constructs. If past corporate scandals are related to future regulatory actions,
we interpret this association as suggesting that lawmakers and regulators reacted ex post to
corporate misbehavior. If past regulations are related to future corporate scandals, the
association indicates that firm managers are quick to avoid the new regulatory interventions and
move to unregulated areas, regulators engage in regulatory activism, or regulators require
explicit rules to become active, and detect and prosecute corporate misbehavior. Alternatively,
the positive relation could point to unintended consequences of regulation.
Specifically, we estimate the following two separate equations based on the modified vector
autoregression (VAR) in Reinhart and Rogoff (2011) for the analysis:
(1) SCANDALit = !10 + !11SCANDALi[t–1 to t–3] + !12REGULATIONi[t–1 to t–3]
+ " !1j Controlsjt–1 + " !1k Fixed Effectsk + u1it
(2) REGULATIONit = !20 + !21SCANDALi[t–1 to t–3] + !22REGULATIONi[t–1 to t–3]
+ " !2j Controlsjt–1 + " !2k Fixed Effectsk + u2it.
In this expression, SCANDALit stands for a binary indicator variable that takes on a value of
‘1’ if a new corporate scandal is discovered in country i and year t. We measure scandals in the
!!!!!!!!!!!!!!!!!!!!!!!!!!!!!!!!!!!!!!!!!!!!!!!!!!!!!!!!!!!!!18 Reinhart and Rogoff (2009; 2011) study the temporal patterns of debt and banking crises, stock market crashes, inflation and currency crises. Their study covers 70 countries in Africa, Asia, Europe, Latin America, North America, and Oceania and spans the period from 1800 to 2009.

18
year they are first discussed in the financial press and media, which might be different from the
year that the misbehavior took place. However, to shape public opinion and motivate regulators
to take actions (e.g., Miller 2006), markets must be aware of the wrongdoing. REGULATIONit is
a binary variable that takes on a value of ‘1’ if there is a new regulation enacted in country i and
year t, and ‘0’ otherwise. We measure regulation at the time it is enacted, which is less
subjective because we can more easily determine these dates for the historical time series.
However, the entry-into-force date might be several months or even years past the initial
discussion and the drafting of the regulation, at which time we would have expected the relation
between past scandals and the incentives of the rule makers to be most pronounced.19
In both equations, we include a single lag of the three-year backward-looking moving
average of the two dependent variables, SCANDALi[t–1 to t–3] and REGULATIONi[t–1 to t–3]. These
two lagged variables give rise to our coefficients of interest. If scandals are persistent, we expect
!11 to be positive; a negative sign is consistent with corporate scandals coming and going in
waves. !12 is a proxy for the predictive ability of regulation. A negative sign indicates that
newly introduced regulation reduces the incidence of corporate scandals, which we would
interpret as effective regulation from a public interest perspective. A positive coefficient
suggests a leading role of regulation for the incidence and detection of future corporate
misbehavior. In Eq. (2), !21 captures the nature of a regulator’s reaction; a positive sign suggests
that lawmakers and regulators react, ex post, to corporate misbehavior. That is, they did not see
it coming, for instance, because they were less informed or notoriously late. The interpretation
of a negative (or insignificant) sign is more ambiguous, but could indicate that regulators are
captured by their constituents, and, hence, do not react or even curb regulatory efforts in
!!!!!!!!!!!!!!!!!!!!!!!!!!!!!!!!!!!!!!!!!!!!!!!!!!!!!!!!!!!!!19 To allow for such a potential delay, we rerun the analysis by further lagging the moving average variables by one or two more years (not tabulated). The results are very similar and none of the inferences change.
19
response to corporate misbehavior. The coefficient !22 reveals something about the inner
workings of the regulatory process. If regulation is purely ad hoc and primarily driven by
economic conditions, we would not expect a significant association. A positive sign suggests an
increasing trend in regulatory activity, consistent with a self-interested regulator attempting to
increase his realm (Peltzman 1976). It is also consistent with prior regulation not being enough
and requiring amendments or new regulation to resolve pressing issues. A negative coefficient
indicates mean reversion in regulatory activity.
In the base specification, we include lagged values of log transformed GDP per capita and
inflation as time-varying, country-specific control variables plus country fixed effects. We
include them to control for cross-sectional differences in economic development and general
economic conditions. In some specifications, we further include a control for the occurrence of a
financial crisis in a country as well as year fixed effects. The year-fixed-effects estimation is
conservative, as the yearly dummy variables account for general trends in the data inclusive of
those related to our variables of interest. We estimate the equations with logit regressions and
report statistical significance levels based on robust standard errors clustered by country.
3. Data Description and Graphical Analyses
In this section, we discuss the sample construction and provide descriptive statistics on the
number of corporate scandals and regulations by country and year. We then analyze the data
using graphical plots to get a better understanding of the historical development of the two main
constructs under study and their interrelations over time. We conclude the section with an
illustrative description of the data structure for select sample countries.

20
3.1. Sample Construction and Description
We start with Jones (2011) for our sample selection process. In his book, he identifies and
describes accounting scandals occurring in 12 different countries, spanning Asia, Europe, North
America, and Oceania. We supplement this list with the 11 next largest countries in terms of
GDP that are part of the Organization for Economic Co-operation and Development (OECD).20
Finally, we add Brazil, Egypt, and South Africa to also include representatives from Latin
America and Africa in the sample. This procedure yields our final sample of 26 countries.
We apply our data collection protocol to the sample countries as far back as 1800 if
possible.21 For each country, we construct an input database that contains the number and types
of corporate scandals and regulations in a given year together with a short description and a
reference pointing to the original source material. For the analyses, we use the raw data to create
the two variables SCANDAL and REGULATION that we code as ‘1’ if we identified at least one
incident of corporate scandals or accounting regulations in a country and year.22
In Table 3, we provide descriptive statistics on the sample that results after our data
collection. Panel A reports the starting year, the number of country-year observations, and the
incidents of corporate scandals and regulation on a country-by-country basis. Except for Israel
(1932), Poland (1920), and South Korea (1920), all the historical time series start in the 19th
century, going back as far as 1800 for Austria, Switzerland, and the U.K. The maximum time
!!!!!!!!!!!!!!!!!!!!!!!!!!!!!!!!!!!!!!!!!!!!!!!!!!!!!!!!!!!!!20 Mexico, Norway, and Turkey also rank among the OEDC countries with high GDP, but could not be included in the sample. Similarly, Argentina, which is not a member of the OECD but has a larger GDP than some of the sample countries, is not included. Unfortunately, after multiple attempts we were unable to collect reliable newspaper data on scandals for these four countries, so that we had to drop them from our original research proposal. 21 For some countries, data on corporate scandals and regulation are available even before 1800. However, in most cases we cannot systematically gather data until the second half of the 19th century. Thus, we set the country-specific sample period to the later of 1800 or the initial year with reliable newspaper and/or secondary literature coverage. 22 We identified only 12 events in the data collection that clearly can be characterized as deregulation (i.e., a substantial loosening or repeal of existing regulation). We did not include these events in the main analyses. However, if we do and code deregulations as ‘-1’ to re-estimate the model with multinomial logistic regressions, the results are virtually unaffected (not tabulated), and none of the inferences change.
21
series per country is 216 years with a mean of 157 years. This expansive historical data is
essential for the power of the statistical tests. The total sample comprises 4,071 country years.
In terms of count, the U.S., Japan, and the U.K. exhibit the highest number of corporate scandals,
with more than 200 incidents each. At the other end of the spectrum, we have Israel and Finland
with 15 and 16 cases, respectively. The total number of corporate scandals we could identify is
2,210. On average, we count 85 cases per country (of which 34 are pure accounting scandals).
One caveat with the interpretation of these numbers is that in some cases, episodes that involve
multiple firms – sometimes in the hundreds – are lumped into a single event (e.g., the 1845 U.K.
Railway Mania, 1873 Gründerkrise in Germany, or 2014 Operação Lava Jato in Brazil). In
terms of regulatory activity, the total number is 1,076 (mean of 41 events per country) with 608
(mean of 23) having a direct impact on firms’ financial reporting. Italy is the country for which
we identified the greatest number of regulatory events (63), while Poland had the fewest (19).
In Panel B of Table 3, we report the number of country-year observations together with the
incidents of corporate scandals and regulation by decade. The number of corporate scandals is
very low in the early years, which also is a function of having fewer sample countries at the time.
It then gradually increases until the 1960s (with a peak during the Great Depression around
1930). Over that last 45 years, the number of corporate scandals surges and reaches a peak with
82 cases in 2002 (1993 with 66 cases is the second most populated year). The time-series pattern
for regulatory activity is similar. 2005 (51 events) and 2002 (32 events) are the years for which
we could identify the most regulations. On average, there are 4.2 (2.4) episodes of corporate
scandals (regulation) in any given year from 1800 to 1969, and this number increases to 32.5
(14.6) over the 1970 to 2015 period.

22
Table 4 presents descriptive statistics for the binary SCANDAL and REGULATION variables
used in the regression analyses. The variables are coded such that any incident of scandal or
regulation in a country and year set the indicator variable to ‘1’. We observe pure accounting
scandals (as indicated by the suffix _acctg) in 13 percent of the country-years. Adding near
accounting scandals (_acctg+near) raises this proportion to 20 percent; and including other
scandals (_tot) to 29 percent. The numbers for pure accounting regulation (_acctg), accounting
plus other corporate governance and/or investor protection regulation (_acctg+oth), and all
regulation including supranational agreements and laws (_tot) are 13, 20, and 21 percent,
respectively. These percentages suggest that we observe, on average, every 3.5 (4.9) years at
least one corporate scandal (regulation) in a country. The table also contains descriptive
statistics on the media mentions of scandals and regulation and the control variables for
economic development (GDP per Capita), Inflation, and Financial Crisis, which we describe in
more detail below.
3.2. Graphical Plots of Corporate Scandals and Regulation over Time
First, we use a coarse proxy of the underlying constructs and collect the yearly number of
incidents the terms “scandal” and “regulator” (or the local equivalents) are mentioned in the
leading (business) newspaper in each country. The idea behind this broad search is to see
whether the general topics of corporate scandals and regulation produce newsworthy stories
without further analysis of the specific content of the articles. For instance, in the United
Kingdom, we search for the two exact terms in the archive of the Financial Times from 1888 to
2015; in Italy, we search the archive of La Stampa from 1867 onwards for a series of equivalent
Italian terms (i.e., “scandalo” together with “regolatore” and “legislatore”); in the Netherlands,
we search the Algemeen Handelsblad beginning in 1828 using the Dutch terms for scandal and

23
supervisory body/company law (i.e., “schandaal” and “toezichthouder”, “ondernemingsrecht”,
“wet” in combination with “onderneming”, “firma”, “compagnie”, or “vennootschap”). See also
Table 1 for the newspaper resources and the Appendix for the exact keywords used.
In Figure 1, we plot the aggregate number of media mentions of the two terms over the 1800
to 2015 period. The graph is based on 24 (out of 26) countries because we have no media
mentions data for Portugal and Egypt. To provide context, we include the country-median GDP
per capita in the graph and highlight periods of global financial crises.23 The figure allows the
following insights: First, the mentions of scandal and regulator follow a distinct pattern over
time. They almost proportionately grow over many years at low rates, but start to exponentially
increase beginning after World War II. This pattern could reflect the fewer accessible newspaper
sources in the early decades, sample bias from adding more countries over time, and heightened
media attention to the two topics in recent years. However, as the strong positive correlation
between media mentions and GDP per capita (97 percent) suggests, economic development and,
hence, the growing role of capital markets over time might also contribute. Second, the media
mentions of scandal and regulator closely mirror each other. The Pearson correlation coefficient
between the two time series is close to 99 percent over the entire period and only slightly smaller
for various sub-periods. This strong comovement suggests that the two constructs are often
mentioned in the same context, supporting our notion of the press as a watchdog (Miller 2006).
Third, there exist discernible waves in the mentions of scandal and regulator by the press, and
they tend to coincide with financial crises. We observe a surge in media mentions around 1910
(various national crises like the panic of 1907 in the U.S. or the 1910 rubber stock crisis in
China), in the 1930s (Great Depression), 1973 (oil crisis), 1987 (Black Monday stock market
!!!!!!!!!!!!!!!!!!!!!!!!!!!!!!!!!!!!!!!!!!!!!!!!!!!!!!!!!!!!!23 We define global financial crises as years in which more than two-thirds of the sample countries at the time experienced at least one crisis of the following type: bank crisis, stock market crash, currency crisis, inflation crisis, or sovereign debt crisis (source: Reinhart and Rogoff 2011).

24
crash), early 2000s (burst of the dot-com bubble), etc. Thus, newspaper outlets seem to be a
timely source for our underlying constructs.
Next, we refine the analyses and focus on the episodes of actual corporate scandals and
regulation. That is, we zoom in on those events that we could identify in our extensive content
analysis of the newspaper coverage, and plot the aggregate yearly numbers for the 26 sample
countries in Figure 2. Panel A shows results for all kinds of corporate scandals and regulatory
actions; Panel B limits the plot to pure accounting scandals and regulations. The time-series
patterns closely resemble the media mentions. The incidents of corporate scandals steadily grow
but remain at substantially lower levels until about the 1970s, when the numbers start to starkly
increase. Scandals reach their highest level in 1993 (e.g., Metallgesellschaft, Montedison, Banco
Español de Crédito) and 2002 (e.g., Enron, Worldcom, Dynegy, ComRoad). The heightened
frequency of corporate scandals in recent years is highlighted by the shaded area in the graphs.
We define periods of global corporate scandals as years in which more than half of the sample
countries experienced at least one episode of scandal. Except for 1931, they all occur after 1988.
We observe several waves in corporate scandals going back as early as the 1860s (U.K. banking
crisis), 1890 and 1905 (second industrial revolution), and the 1930s (Great Depression). The
regulatory activity follows a similar path, consistent with the notion that regulation has become
much more prevalent today than it was 100 years ago (Shleifer 2005). The correlation between
the incidents of scandals and regulation is high, with 86 percent over the entire period and
between 63 to 77 percent over various sub-periods.
The time-series pattern for accounting scandals and regulation in Panel B is very similar, but
at lower levels. Notably, we could not identify many accounting scandals before 1900 (only 63
cases), and the vast majority took place after 1960 (693 cases). This finding does not come as a
25
surprise as strict and enforceable regulation regarding financial reporting often was absent before
the 1930s (e.g., in the U.S. before the 1933/34 Securities and Exchange Acts). Aside from being
unspecific and broad, early accounting regulation often came in the form of social norms,
voluntary agreements, and systems of self-regulation (e.g., Waymire and Basu 2007), which
were difficult to uniformly implement and enforce. Moreover, the increasing role of capital
markets, long boom periods of rising stock prices, market pressure on management to perform in
the short-run, executive compensation tied to stock prices, etc. has made the accounting system
more prone to fraudulent behavior in recent decades (e.g., Ball 2009). Despite the high time-
series correlations between scandals and regulation in both Figure 1 and 2, the graphical analysis
does not allow insights into the lead-lag structure between the two constructs.
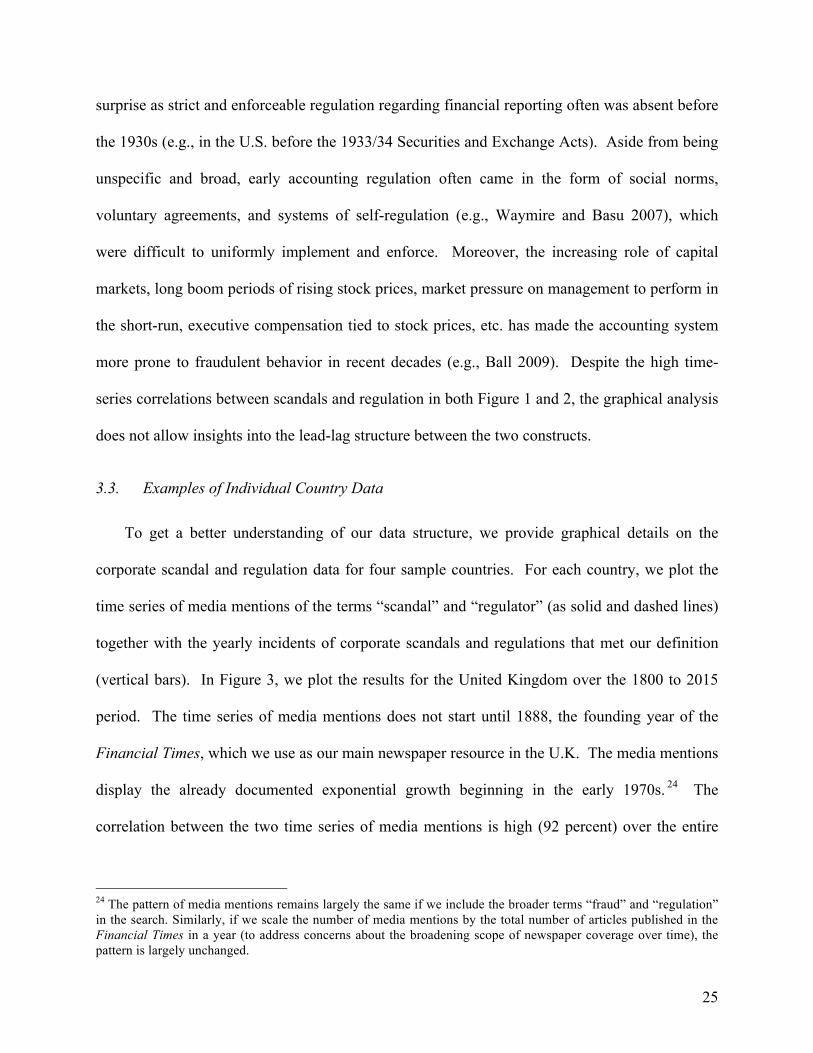
3.3. Examples of Individual Country Data
To get a better understanding of our data structure, we provide graphical details on the
corporate scandal and regulation data for four sample countries. For each country, we plot the
time series of media mentions of the terms “scandal” and “regulator” (as solid and dashed lines)
together with the yearly incidents of corporate scandals and regulations that met our definition
(vertical bars). In Figure 3, we plot the results for the United Kingdom over the 1800 to 2015
period. The time series of media mentions does not start until 1888, the founding year of the
Financial Times, which we use as our main newspaper resource in the U.K. The media mentions
display the already documented exponential growth beginning in the early 1970s. 24 The
correlation between the two time series of media mentions is high (92 percent) over the entire
!!!!!!!!!!!!!!!!!!!!!!!!!!!!!!!!!!!!!!!!!!!!!!!!!!!!!!!!!!!!!24 The pattern of media mentions remains largely the same if we include the broader terms “fraud” and “regulation” in the search. Similarly, if we scale the number of media mentions by the total number of articles published in the Financial Times in a year (to address concerns about the broadening scope of newspaper coverage over time), the pattern is largely unchanged.
26
period, but non-existent before World War II. The pattern of actual scandals and regulation is
more balanced in the U.K. than in the full sample as about half the incidents occur before 1970.
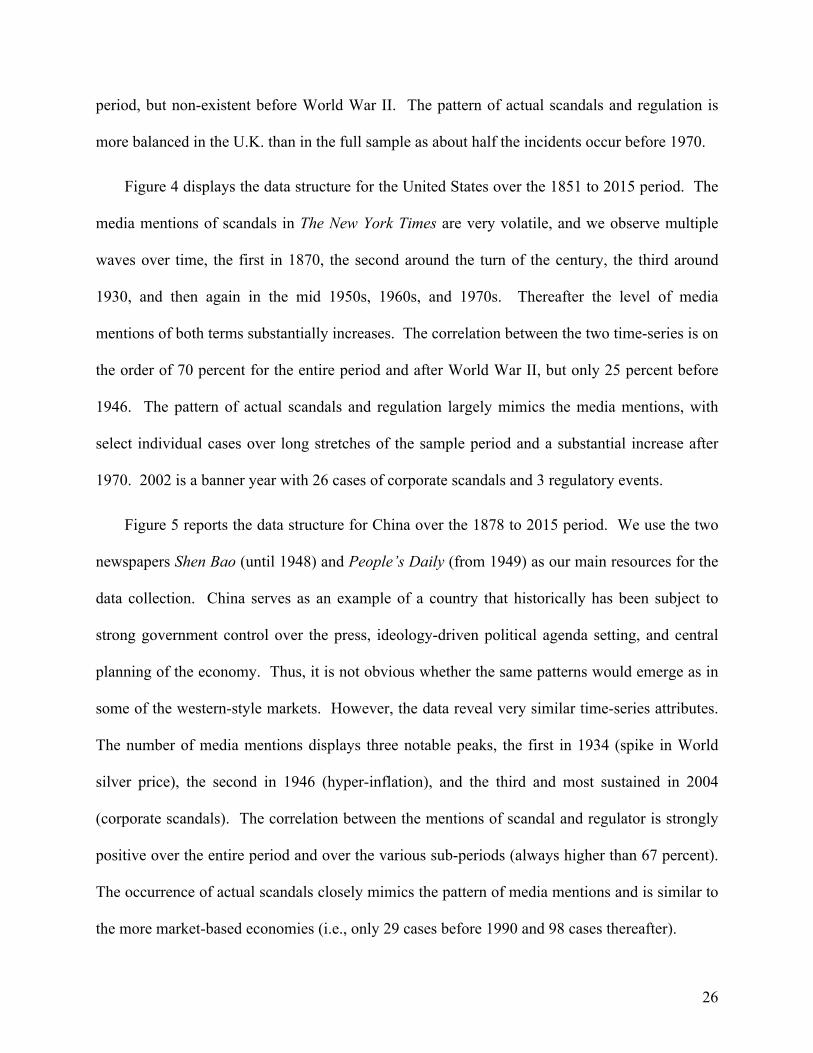
Figure 4 displays the data structure for the United States over the 1851 to 2015 period. The
media mentions of scandals in The New York Times are very volatile, and we observe multiple
waves over time, the first in 1870, the second around the turn of the century, the third around
1930, and then again in the mid 1950s, 1960s, and 1970s. Thereafter the level of media
mentions of both terms substantially increases. The correlation between the two time-series is on
the order of 70 percent for the entire period and after World War II, but only 25 percent before
1946. The pattern of actual scandals and regulation largely mimics the media mentions, with
select individual cases over long stretches of the sample period and a substantial increase after
1970. 2002 is a banner year with 26 cases of corporate scandals and 3 regulatory events.
Figure 5 reports the data structure for China over the 1878 to 2015 period. We use the two
newspapers Shen Bao (until 1948) and People’s Daily (from 1949) as our main resources for the
data collection. China serves as an example of a country that historically has been subject to
strong government control over the press, ideology-driven political agenda setting, and central
planning of the economy. Thus, it is not obvious whether the same patterns would emerge as in
some of the western-style markets. However, the data reveal very similar time-series attributes.
The number of media mentions displays three notable peaks, the first in 1934 (spike in World
silver price), the second in 1946 (hyper-inflation), and the third and most sustained in 2004
(corporate scandals). The correlation between the mentions of scandal and regulator is strongly
positive over the entire period and over the various sub-periods (always higher than 67 percent).
The occurrence of actual scandals closely mimics the pattern of media mentions and is similar to
the more market-based economies (i.e., only 29 cases before 1990 and 98 cases thereafter).

27
Figure 6 plots the data structure for Italy over the 1860 to 2015 period. La Stampa, one of
the oldest daily newspapers in Italy, serves as the primary data source. The two time series of
media mentions move closely together (correlation of 92 percent), are volatile with several peaks
over the course of the years, and generally display the familiar pattern. Notably, the incidents of
actual scandals and regulation closely follow the media mentions. There are groups of scandals
(and surges in media mentions) around 1910, 1930, and on a more persistent basis after 1950.
Both actual corporate scandals and media mentions of scandals peak in 1993 (e.g., Montedison,
Eni, Finmeccanica).25 We can use the year 1993 to illustrate our research question. The issue
becomes whether the accumulation of scandals in this year served as trigger for future regulatory
action, for instance, the two rules put in place in 1995. Alternatively, the scandals of 1993 could
be an outcome of prior regulations, like the rules enacted over the years 1990 to 1992. We will
turn to a statistical analysis of such lead-lag relations in the next section.
4. Temporal Patterns of Corporate Scandals and Regulation
4.1. Results for Mentions of “Scandal” and “Regulator” in the Business Press
We start the empirical tests with an analysis of the temporal patterns of the media mentions
of “scandal” and “regulator.” Even though these proxies are noisy and potentially biased, they
can give us an indication of the lead-lag structure of the underlying theoretical constructs. We
estimate the models in Eq. (1) and (2), but instead of using binary indicator variables we use the
log transformed numbers of the yearly media mentions in a country as the dependent variables.
Similarly, we compute the lagged moving averages from three years of media mentions and then
!!!!!!!!!!!!!!!!!!!!!!!!!!!!!!!!!!!!!!!!!!!!!!!!!!!!!!!!!!!!!25 For the U.K. in Figure 3, we eliminated the period of World War II (1940-45) from the analysis because the mentions of the two search terms in the media drop close to zero during these years. In Italy, the search during World War II also produces lower levels of newspaper hits, but the numbers remain comparable to adjacent years and far above zero so that we retain this period for the analysis.

28
log transform them for the estimation. The models control for economic development, inflation,
and country fixed effects. Annual GDP per Capita (in 1990 international dollars) is from the
Maddison-Project; yearly Inflation from the online resources to Reinhart and Rogoff (2011).26
We estimate the models with ordinary least squares (OLS) regression and assess the statistical
significance based on robust standard errors clustered by country.
Table 5 presents OLS coefficients and (in parentheses) t-statistics from estimating the two
models, first over the entire sample period (1800-2015), and then consecutively over the first half
of the sample (1800-1945), the second half of the sample (1946-2015), and the most recent
decades (1970-2015). The table allows the following insights. First, we find that the media
mentions of both the terms “scandal” and “regulator” exhibit high positive autocorrelation,
indicating that past mentions in the press are related to future mentions of the same term. The
interpretation of the log-log model is straightforward. The coefficients on the lagged moving
averages of SCANDAL_media and REGULATOR_media on the order of 0.82 to 0.93 correspond
to percentage changes. A one percentage change in past scandals (regulations) translates into a
0.82 to 0.93 percentage change in future scandals (regulations). Thus, the attention the media
pays to these two constructs is sticky over time. Second, focusing on the right-hand side of the
table, the coefficient on lagged scandals is significantly positive in the REGULATOR_media
model of column (1). The finding suggests that media coverage of scandals serves as an
antecedent to media coverage about regulation. However, the effect is small with a one
percentage change in media mentions of “scandal” leading to a 0.03 percentage change in media
!!!!!!!!!!!!!!!!!!!!!!!!!!!!!!!!!!!!!!!!!!!!!!!!!!!!!!!!!!!!!26 Data for GDP per Capita and Inflation are missing for some of the historical country-years. We linearly extrapolate missing years from adjacent observations to fill gaps in the time series. If the gaps are too long (i.e., > 10 years) or precede the available data, we backfill the missing data by using the annual percentage changes from a peer country with high observed correlations in subsequent years. For example, we backfill Germany’s GDP per Capita data before 1850 using the U.K.’s growth rates in GDP per capita for the same period. We chose the U.K. because the correlation between the two countries is 96 percent over the 1850 to 1880 period.

29
mentions of “regulator.” Third, based on the left-hand side of the table, the coefficient on lagged
regulation is significantly positive in column (1) of the SCANDAL_media model. Thus, media
coverage of regulation is followed by higher media coverage of scandals. The effect is highly
significant and the coefficient magnitude suggests that a one percentage change in media
mentions of “regulator” leads to a 0.06 percentage change in the mentions of “scandal.” The
positive and significant coefficient on GDP per Capita indicates a positive impact of economic
development on the coverage of the two topics by the press.
The results for the various sub-periods in columns (2), (3), and (4) show that the leading role
of past media mentions of “scandal” for the future press coverage of “regulation” is present in
both the first and second half of the sample period, but vanishes in the most recent years after
1970. This latter sub-period is when the leading role of past media mentions of regulator for
future scandals is statistically most pronounced. The coefficient is only marginally significant at
the 12 percent level in the period before World War II. Overall, the analysis of media mentions
displays many of the expected relations, even though mere press coverage of our broad search
terms arguably is a coarse proxy of the underlying constructs. In that sense, we see these tests as
independent validity check of our main analyses.
4.2. Results for Actual Episodes of Corporate Scandals and Regulation
We now turn to the analysis of the lead-lag structure of the actual episodes of corporate
scandals and regulation that we identified in the comprehensive data collection. Table 6 presents
results from various specifications of the models in Eq. (1) and (2), using all observations over
the 1800 to 2015 period. The models differ in terms of the control variables and fixed effects
that we include, and rank from least restrictive with only country fixed effects in column (1) to
most restrictive with controls for economic development, inflation, all sorts of financial crises
30
plus country and year fixed effects in column (4). We measure the Financial Crisis variable as a
binary indicator marking the initial year of a bank crisis, stock market crash, currency crisis,
inflation crisis, or sovereign debt crisis in a country as indicated in Reinhart and Rogoff (2011).
We include a single lag of the three-year backward-looking moving average Financial Crisis
indicator as a control in the model. Inflation and GDP per Capita are defined as above. We
estimate the models with logit regression and assess the statistical significance based on robust
standard errors clustered by country.
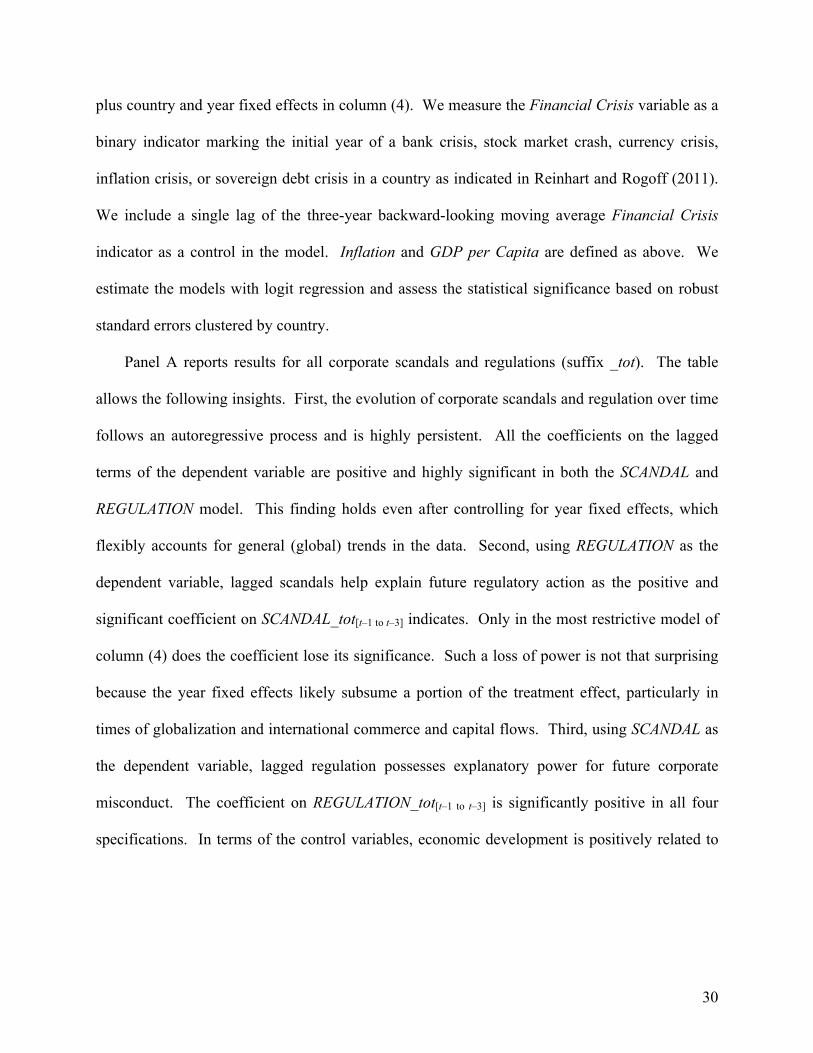
Panel A reports results for all corporate scandals and regulations (suffix _tot). The table
allows the following insights. First, the evolution of corporate scandals and regulation over time
follows an autoregressive process and is highly persistent. All the coefficients on the lagged
terms of the dependent variable are positive and highly significant in both the SCANDAL and
REGULATION model. This finding holds even after controlling for year fixed effects, which
flexibly accounts for general (global) trends in the data. Second, using REGULATION as the
dependent variable, lagged scandals help explain future regulatory action as the positive and
significant coefficient on SCANDAL_tot[t–1 to t–3] indicates. Only in the most restrictive model of
column (4) does the coefficient lose its significance. Such a loss of power is not that surprising
because the year fixed effects likely subsume a portion of the treatment effect, particularly in
times of globalization and international commerce and capital flows. Third, using SCANDAL as
the dependent variable, lagged regulation possesses explanatory power for future corporate
misconduct. The coefficient on REGULATION_tot[t–1 to t–3] is significantly positive in all four
specifications. In terms of the control variables, economic development is positively related to
31
both scandals and regulation in most models; inflation only helps explain regulation; controlling
for financial crises in a country does not add to the explanatory power.27
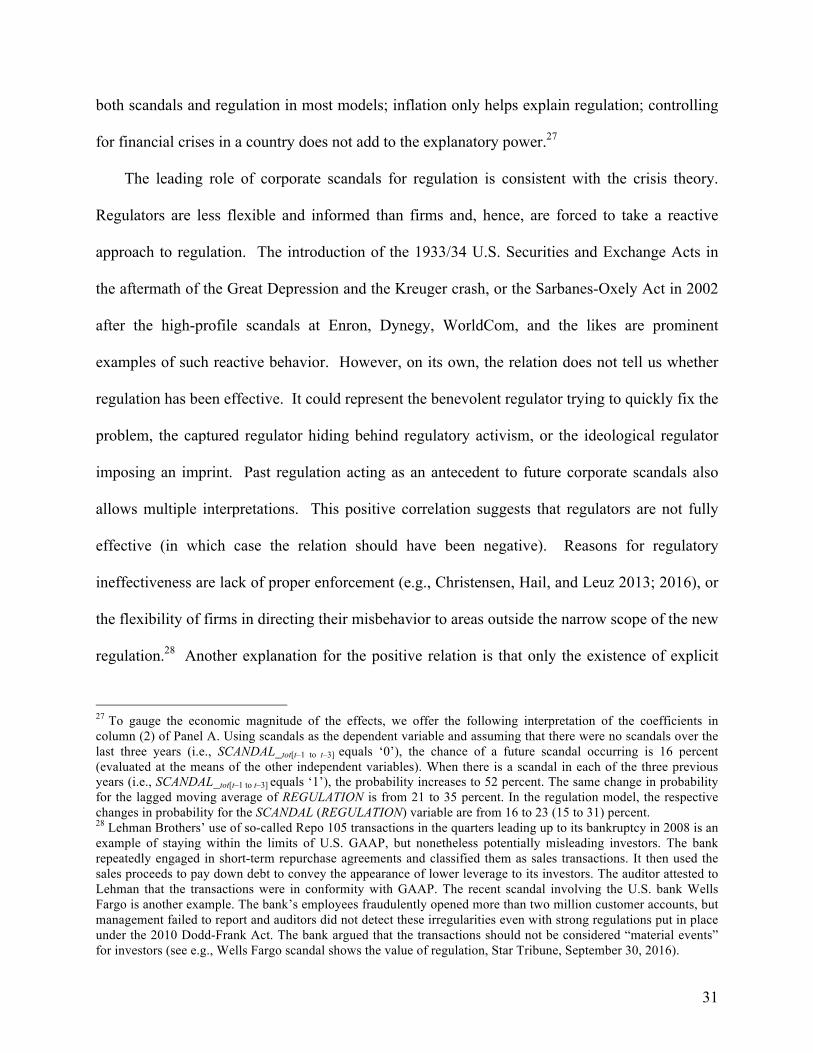
The leading role of corporate scandals for regulation is consistent with the crisis theory.
Regulators are less flexible and informed than firms and, hence, are forced to take a reactive
approach to regulation. The introduction of the 1933/34 U.S. Securities and Exchange Acts in
the aftermath of the Great Depression and the Kreuger crash, or the Sarbanes-Oxely Act in 2002
after the high-profile scandals at Enron, Dynegy, WorldCom, and the likes are prominent
examples of such reactive behavior. However, on its own, the relation does not tell us whether
regulation has been effective. It could represent the benevolent regulator trying to quickly fix the
problem, the captured regulator hiding behind regulatory activism, or the ideological regulator
imposing an imprint. Past regulation acting as an antecedent to future corporate scandals also
allows multiple interpretations. This positive correlation suggests that regulators are not fully
effective (in which case the relation should have been negative). Reasons for regulatory
ineffectiveness are lack of proper enforcement (e.g., Christensen, Hail, and Leuz 2013; 2016), or
the flexibility of firms in directing their misbehavior to areas outside the narrow scope of the new
regulation.28 Another explanation for the positive relation is that only the existence of explicit
!!!!!!!!!!!!!!!!!!!!!!!!!!!!!!!!!!!!!!!!!!!!!!!!!!!!!!!!!!!!!27 To gauge the economic magnitude of the effects, we offer the following interpretation of the coefficients in column (2) of Panel A. Using scandals as the dependent variable and assuming that there were no scandals over the last three years (i.e., SCANDAL_tot[t–1 to t–3] equals ‘0’), the chance of a future scandal occurring is 16 percent (evaluated at the means of the other independent variables). When there is a scandal in each of the three previous years (i.e., SCANDAL_tot[t–1 to t–3] equals ‘1’), the probability increases to 52 percent. The same change in probability for the lagged moving average of REGULATION is from 21 to 35 percent. In the regulation model, the respective changes in probability for the SCANDAL (REGULATION) variable are from 16 to 23 (15 to 31) percent. 28 Lehman Brothers’ use of so-called Repo 105 transactions in the quarters leading up to its bankruptcy in 2008 is an example of staying within the limits of U.S. GAAP, but nonetheless potentially misleading investors. The bank repeatedly engaged in short-term repurchase agreements and classified them as sales transactions. It then used the sales proceeds to pay down debt to convey the appearance of lower leverage to its investors. The auditor attested to Lehman that the transactions were in conformity with GAAP. The recent scandal involving the U.S. bank Wells Fargo is another example. The bank’s employees fraudulently opened more than two million customer accounts, but management failed to report and auditors did not detect these irregularities even with strong regulations put in place under the 2010 Dodd-Frank Act. The bank argued that the transactions should not be considered “material events” for investors (see e.g., Wells Fargo scandal shows the value of regulation, Star Tribune, September 30, 2016).

32
rules lets the regulator identify corporate actions as unlawful and in violation of public trust.29
Finally, the positive correlation could also indicate unintended consequences of regulatory action
in that the new rules backfire and provoke unanticipated management behavior (Merton 1936).
Except for providing anecdotal evidence for their existence, unfortunately, our data does not
allow us to disentangle these various potential explanations.
Panel B of Table 6 reports the results for the same set of regressions while limiting the
analyses to the pure accounting scandals and accounting regulations (_acctg). The results are
very similar to Panel A, albeit weaker in terms of statistical significance. Both accounting
scandals and accounting regulation display a positive serial correlation. The leading role of
scandals for future regulation is only present in the least restrictive model of column (1). The
leading role of past regulatory activity for future scandals persists across all four models, but
with lower t-statistics than in Panel A.30
Overall, we do find evidence of robust lead-lag relations between corporate scandals and
regulation in our full sample, and they behave – at least in part – as the public interest view,
theory of self-interest, or ideological view of regulation would predict. The observed relations
are in line with the analyses of media mentions in Section 4.1, but stronger, consistent with less
measurement error when focusing on actual episodes of scandals and regulations. We next turn
to analyzing whether the lead-lag relations differ in the cross-section and over time.
!!!!!!!!!!!!!!!!!!!!!!!!!!!!!!!!!!!!!!!!!!!!!!!!!!!!!!!!!!!!!29 An example would be the enactment of the U.S. Foreign Corrupt Practices Act (FCPA) in 1977 after the SEC’s investigation of questionable business practices that involved bribing foreign government officials, politicians, and political parties (e.g., Lockheed’s bribery of the Japanese prime minister in 1976 or Chiquita Brand’s bribery of the president of Honduras in 1974/75 were prominent cases). The FCPA reclassified what used to be “cost of doing business” as corporate fraud, and gave the SEC the necessary tools to successfully prosecute this behavior in future years. The SEC alone enforced 8 (more than 50) cases within 10 (20) years of the FCPA’s adoption. 30 When we re-estimate Table 6 using the log transformed count (plus one) of scandals and regulations in a year and OLS, the results are very similar to those tabulated, if not stronger, and none of the inferences change.
33
5. Additional Analyses
5.1. Results for Various Sub-Periods over the 1800 to 2015 Period
So far, we have documented the general lead-lag structure for the entire 215-year panel of
historical data. However, the relations presumably do not remain stable over such a long period,
particularly in light of the stark increase in corporate scandals after the 1970s (see Figure 2).
Thus, we re-estimate the models in Eq. (1) and (2) over various sub-periods, namely the years up
to and including World War II (1800-1945), the entire post-World War II period (1946-2015),
and the most recent years comprising the majority of scandals and regulations (1970-2015). We
present results for these sub-periods together with the overall sample results as benchmarks in
Table 7. The table only reports the coefficient estimates for the main variables of interest, but
the models include controls for economic development, inflation, and country fixed effects (i.e.,
column 2 in Table 6). Panel A reports results for all scandals and regulation (_tot), Panel B the
same for accounting scandals and regulation (_acctg).
Starting with Panel A, the strong serial correlation in SCANDAL and REGULATION is
present before and after 1945. The lagged moving averages of the dependent variables are
positive and significant over both sample halves. We only find evidence of corporate scandals
leading regulation in the years after World War II. In the period before, the coefficient is smaller
in magnitude and insignificant. One explanation for the weaker results in earlier years might be
the reduced public pressure on politicians and regulators during this period when democratically
elected governments were rare and laws often were introduced as a result of military conflict
(e.g., the French Code during the Napoleonic wars) or colonialism (e.g., the British imposing
U.K.-style laws in colonial India, South Africa, or Australia). Other potential explanations might
be that there was less media coverage of corporate scandals during this period, and/or that the

34
less extensive search capabilities available for historic news outlets led to our identification of
fewer events in the data collection process. The leading role of past regulation for future
scandals is present both before and after 1945.
The results for the most recent 46-year period stand out in that none of the SCANDAL and
REGULATION coefficients are significant. It is during this period that stock markets have
regained their importance and reached new heights (Rajan and Zingales 2003). One issue with
the later years is that scandals and regulation have become so commonplace that their frequency
in some countries potentially reduces the power of the tests. For instance, during this period we
only observe 8 years without scandal in Japan, and 6 in the U.K., substantially diminishing how
the two countries can contribute to the identification of the coefficients. The insignificant results
are also consistent with regulators becoming more timely in their reaction to events, even though
we find no signs of increased regulatory effectiveness in recent years, in that future scandals
would go down after new regulations are adopted if that were the case.
The results for accounting scandals and regulation in Panel B are similar, but generally
weaker. The serial correlation of scandals and regulation persists, but the only significant
coefficient is the leading role of regulation regarding future scandals before 1945. After 1945,
the predictive ability of accounting regulation for future scandals disappears. The coefficient on
accounting scandals leading future regulatory action is never significant.
5.2. Results for Various Sub-Samples over the 1800 to 2015 Period
We next compare the lead-lag structure of corporate scandals and regulation across various
groups of countries. We use fundamental country attributes like economic development, rule of
law, or legal tradition to form the partitions as these characteristics are likely to evolve only
slowly over time. Specifically, we split the sample countries into developed versus emerging
35
markets based on the classification in the Morgan Stanley Capital International database as of
2000. We distinguish between countries with strong and weak rule of law based on the index
scores from La Porta et al. (1998) and split by the sample median. Finally, we run the
regressions separately for English common law, French commercial code, German commercial
code, and Scandinavian civil law countries (source: La Porta et al. 1998). We report coefficients
for the main variables of interest from estimating our base specification (i.e., column 2 in Table
6) in Table 8.
The serial correlation in corporate scandals is much more pronounced in emerging markets
than in developed markets, consistent with fraudulent behavior being more of a problem in these
economies. On the other hand, the serial correlation in regulation is only present in developed
markets (but not in emerging markets). This finding suggests that ongoing regulatory activity is,
among other things, a function of economic development, consistent with the graphical evidence
in Figure 1. Past scandals help explain future regulation in emerging markets, but not in
developed economies. The coefficient on the lagged moving average of SCANDAL is more than
twice the magnitude, and significant only in the emerging market subset when explaining
regulation. The result points to a more reactive approach by regulators in these countries relative
to developed markets (maybe because less information is available). Regulation being an
antecedent to future scandals is present in both sets of countries. Thus, regardless of the market
structure, regulatory activity does not curb corporate misconduct, but rather increases the
incidence of future scandals (be it because managers are able to avoid the new regulations, or
regulators have been given the means to detect and prosecute scandals). Countries with strong
rule of law display lead-lag relations very similar to developed markets (or, alternatively, weak

36
rule of law countries behave similarly to emerging markets), which is not surprising given that
the two country attributes are highly correlated.31
When it comes to a country’s legal tradition, all four groups display a positive serial
correlation in scandals, while regulation is only positively serially correlated in French and
German commercial code countries. The leading role of scandals for future regulation is present
throughout except for countries with French legal tradition. This evidence could indicate more
regulatory capture or a less reactive regulatory approach in French countries. The coefficient on
the leading role of regulation for future scandals is similar in magnitude across the four groups,
but not significant in Scandinavian civil law countries. This latter finding might be due to lower
power, as we only have 444 observations from Scandinavian nations. In sum, we find systematic
differences across groups of countries, suggesting that the effectiveness of regulation is shaped
by fundamental characteristics like market development and legal tradition.
5.3. Individual Country Results
In our last set of analyses, we estimate the lead-lag relation on a country-by-country basis.
Due to the small number of observations, we estimate a reduced form of the models in Eq. (1)
and (2) that only includes the lagged moving averages of the two dependent variables plus an
intercept (i.e., no additional control variables and fixed effects). Table 9 presents the coefficient
estimates of these two variables together with the z-statistics (in parentheses). In the scandal
regression (left-hand side of the table), we report the countries rank ordered by the magnitude of
the lagged REGULATION coefficient. In the regulation model (right-hand side of the table), we
report the countries rank ordered by the magnitude of the lagged SCANDAL coefficient. We
assess the statistical significance based on robust standard errors (and also indicate whether the !!!!!!!!!!!!!!!!!!!!!!!!!!!!!!!!!!!!!!!!!!!!!!!!!!!!!!!!!!!!!31 The developed markets of Italy, Portugal, Spain, and the U.K. fall into the group of countries with relatively weaker rule of law, while the emerging markets China and Poland do not have an index value for rule of law.
37
coefficients remain significant after including GDP per Capita and Inflation as control variables
in the regressions).
When using SCANDAL as the dependent variable, corporate scandals are serially correlated
in 22 out of 26 cases. That is, corporate misconduct is highly persistent throughout the world.
More to the point, regulation possesses predictive power for future scandals in 15 of the sample
countries. The positive relation is most pronounced in Spain, Israel, Denmark, and Austria. The
evidence suggests that regulators are not fully effective in these countries. There is only a single
country, Finland, where the relation is negative (i.e., consistent with regulation reducing
corporate misconduct under the public interest view), but the coefficient is insignificant.
In the REGULATION model, a country’s regulatory activity is positively serially correlated
in only 12 out of 26 cases. In some instances, the coefficient is negative, but never significant.
Interestingly, whenever past regulatory activity has predictive power for future regulation,
corporate scandals typically do not, and vice versa. The coefficient on the lagged moving
average of scandals is positive and significant in 14 countries, most notably in Israel, Greece,
South Korea, and India. This finding suggests that in countries where regulatory activity can be
primarily described as reactive (under the “crisis theory”), a consistent regulatory approach that
persistently evolves over time is lacking.
6. Conclusions
Can regulators proactively pre-empt corporate wrongdoing before it occurs? And do they
detect and rectify actual misbehavior in a timely and persistent manner? To answer these
questions, we develop an extensive historical time series of corporate scandals and regulations
for 26 countries over the 1800 to 2015 period. Our analyses of the lead-lag structure for the
large panel (at both the global and individual country level) reveal several stylized facts. Both

38
regulation and corporate scandals are highly persistent. Regulatory activity has a strong reactive
component to scandals that have attracted media attention. Regulations do not curb corporate
misconduct. In fact, today’s regulations possess predictive power for future corporate scandals.
Finally, the effectiveness of regulation is changing over time and is affected by local institutional
factors like market development and a country’s legal tradition. Overall, our results cast doubt
on the effectiveness of regulation from a public interest view.
The question then becomes why regulation exists in the first place. This question is even
more pressing given the substantial (monetary) resources countries dedicate to the promulgation,
implementation, and enforcement of regulations. Of course, ideology can always serve to justify
regulation. Similarly, self-interest and regulatory capture provide strong incentives for select
parties to design and implement regulations in specific ways. Our study focuses on a single
benefit of regulation (i.e., the curbing and prevention of corporate misconduct). However, other
costs and benefits may exist. For instance, regulation might enhance minority investors’
participation in the stock market and, in turn, render capital allocation more efficient. One
insight from our findings and the theory of self-interest is that there are winners and losers of
regulation. For instance, the strong positive correlation between past regulation and future
scandals suggests that regulatory activity does not always achieve its goal, but leads to unwanted
outcomes. This evidence could be yet another example of what Hayek (1989) called the pretense
of knowledge in that regulators do not and cannot fully understand the inner workings of a
complex system, but pretend to treat it as if it were following the laws of physics.
Our panel analysis of more than 200 years of rich historical data gives rise to several
questions. For instance, what are the factors driving the change in regulatory effectiveness over
time and across countries as our empirical evidence suggests? How does transitioning from a

39
non-democratic to a democratic regime or vice versa affect this change? Are there spill-over
effects of regulation and/or corporate scandals from one country to another? How do regulations
and corporate scandals spread over time and across nations? In countries where we show that
regulators behave reactively, what types of scandals prompt them to implement and enforce new
regulation, and how long does it take? In countries where we show evidence of a leading role of
regulation, disentangling the various explanations for the future occurrence of scandals will be
crucial. Are these scandals a direct violation of existing regulations or are firms able to carefully
circumvent the new rules? We leave issues like these for future research.

40
References
Alesina, A. 1988. Credibility and policy convergence in a two-party system with rational voters. American Economic Review 78: 796–805.
Arnold, A., and S. McCartney. 2003. “It may be earlier than you think”: evidence, myths and informed debate in accounting history. Critical Perspectives on Accounting 14: 227–253.
Ball, R. 2009. Market and political/regulatory perspectives on the recent accounting scandals. Journal of Accounting Research 47: 277–323.
Balsam, S., I. Haw, and S. Lilien. 1995. Mandated accounting changes and managerial discretion. Journal of Accounting and Economics 20: 3–29.
Bernstein, R. 1989. Elections, Representation, and Congressional Voting Behavior: The Myth of Constituency Control. Prentice-Hall: Upper Saddle River NJ.
Bushee, B., and C. Leuz. 2005. Economic consequences of SEC disclosure regulation: evidence from the OTC bulletin board. Journal of Accounting and Economics 39: 233–264.
Callander, S. 2008. Political motivations. Review of Economic Studies 75: 671–697. Carpenter, D., and D. Moss. 2014. Preventing Regulatory Capture: Special Interest Influence and How to
Limit It. Cambridge University Press: Cambridge. U.K. Christensen, H., L. Hail, and C. Leuz. 2013. Mandatory IFRS reporting and changes in enforcement.
Journal of Accounting and Economics 56: 147–177. Christensen, H., L. Hail, and C. Leuz. 2016. Capital-market effects of securities regulation: prior
conditions, implementation, and enforcement. Review of Financial Studies 29: 2885–2924. Dean, G., and F. Clarke. 2011. Chapter 1: Australia. In: Previts, G., P. Walton, and P. Wolnizer (eds.). A
Global History of Accounting, Financial Reporting and Public Policy: Asia and Oceania. Emerald Group Publishing: Bingley, U.K.: 1–34.
Diermeier, D., M. Keane, and A. Merlo. 2005. A political economy model of congressional careers. American Economic Review 95: 347–373.
Dyck, A., A. Morse, and L. Zingales. 2010. Who blows the whistle on corporate fraud? The Journal of Finance 65: 2213–2253.
Dyck, A., A. Morse, and L. Zingales. 2014. How pervasive is corporate fraud? Working paper, University of Toronto, University of California at Berkeley, and University of Chicago.
Engstrom, D., 2013. Corralling capture. Harvard Journal of Law and Public Policy 36: 31–39. Franks, J., C. Mayer, and S. Rossi. 2009. Ownership: evolution and regulation. Review of Financial
Studies 22: 4009–4056. Frye, T., and A. Shleifer. 1997. The invisible hand and the grabbing hand. American Economic Review
87: 354–358. Gao, F., J. Wu, and J. Zimmerman. 2009. Unintended consequences of granting small firms exemptions
from securities regulation: evidence from the Sarbanes-Oxley Act. Journal of Accounting Research 47: 459–506.
Giannetti, M., and T. Wang. 2016. Corporate scandals and household stock market participation. Journal of Finance 71: 2591–2636.
Goetzmann, W., C. Labio, K. Rouwenhorst, and T. Young. 2013. The Great Mirror of Folly: Finance, Culture, and the Crash of 1720. Yale University Press: New Haven.
Hayek, F. 1989. The pretence of knowledge. American Economic Review 79: 3–7. Harris, R. 1994. The Bubble Act: its passage and its effects on business organization. Journal of
Economic History 54: 610–627.

41
Hoffmann, S., and D. Detzen. 2013. The regulation of asset valuation in Germany. Accounting History 18: 367–389.
Hung, M., T.J. Wong, and F. Zhang. 2015. The value of political ties versus market credibility: evidence from corporate scandals in China. Contemporary Accounting Research 32: 1641–1675.
International Practice Executive Committee. 1975. Professional Accounting in 30 Countries. American Institute of Certified Public Accountants: New York.
Jones, M. 2011. Creative Accounting, Fraud and International Accounting Scandals. John Wiley & Sons: West Sussex, U.K.
Kalt, J., and M. Zupan. 1984. Capture and ideology in the economic theory of politics. American Economic Review 74: 279–300.
Karpoff, J., A. Koester, D. Lee, and G. Martin. 2017. Proxies and databases in financial misconduct research. The Accounting Review: forthcoming.
Karpoff, J., D. Lee, and G. Martin. 2008. The cost to firms of cooking the books. Journal of Financial and Quantitative Analysis 43: 581–612.
Kau, J., and P. Rubin. 1979. Self-interest, ideology, and logrolling in congressional voting. Journal of Law and Economics 22: 365–384.
Kau, J., and P. Rubin. 1993. Ideology, voting, and shirking. Public Choice 76: 151–172. Krueger, A. 1974. The political economy of the rent-seeking society. American Economic Review 64:
291–303. La Porta, R., F. Lopez-de-Silanes, and A. Shleifer. 2006. What works in securities laws? The Journal of
Finance 61: 1–32. La Porta, R., F. Lopez-de-Silanes, A. Shleifer, and R. Vishny. 1997. Legal determinants of external
finance. The Journal of Finance 52: 1131–1150. La Porta, R., F. Lopez-de-Silanes, A. Shleifer, and R. Vishny. 1998. Law and finance. Journal of Political
Economy 106: 1113–1155. Lee, D., E. Moretti, and M. Butler. 2004. Do voters affect or elect policies? Evidence from the U.S.
House. Quarterly Journal of Economics 119: 807–859. Leuz, C., A. Triantis, and T. Wang. 2008. Why do firms go dark? Causes and economic consequences of
voluntary SEC deregistrations. Journal of Accounting and Economics 45: 181–208. Leuz, C., and P. Wysocki. 2016. The economics of disclosure and financial reporting regulation: evidence
and suggestions for future research. Journal of Accounting Research 54: 525–622. Littleton, A. 1933. Accounting Evolution to 1900. American Institute Publishing: New York, NY. Mahoney, P. 2001. The political economy of the Securities Act of 1933. Journal of Legal Studies 30: 1–
31. Mahoney, P. 2003. The origins of the Blue-Sky Laws: a test of competing hypotheses. Journal of Law
and Economics 46: 229–251. Markopolos, H. 2010. No One Would Listen: A True Financial Thriller. John Wiley & Sons: Hoboken,
NJ. Merton, R. 1936. The unanticipated consequences of purposive social action. American Sociological
Review 1: 894–904. Mian, A., A. Sufi, and F. Trebbi. 2010. The political economy of the U.S. mortgage default crisis.
American Economic Review 100: 1967–1998. O’Connor, S. 2004. Be careful what you wish for: how accountants and Congress created the problem of
auditor independence. Boston College Law Review 45: 741–827. Partnoy, F. 1999. The Siskel and Ebert of financial markets: two thumbs down for the credit rating
agencies. Washington University Law Review 77(3): 619–714.
42
Peltzman, S. 1976. Toward a more general theory of regulation. Journal of Law and Economics 19: 211–240.
Pigou, A. 1938. The Economics of Welfare. Macmillan: London, U.K. Poole, K., and H. Rosenthal. 1996. Are legislators ideologues or the agents of constituents? European
Economic Review 40: 707–717. Poole, K., and H. Rosenthal. 1997. Congress: A Political-Economic History of Roll Call Voting. Oxford
University Press: New York, NY. Previts, G., and B. Merino. 1998. A History of Accountancy in the United States: The Cultural
Significance of Accounting. Ohio State University Press: Columbus, OH. Previts, G., P. Walton, and P. Wolnizer. 2010. A Global History of Accounting, Financial Reporting and
Public Policy: Europe. Emerald Group Publishing Limited: Bingley, U.K. Rajan, R., and L. Zingales. 2003. The great reversals: the politics of financial development in the
twentieth century. Journal of Financial Economics 69: 5–50. Reinhart, C., and K. Rogoff. 2009. This Time is Different. Princeton University Press: Princeton, NJ. Reinhart, C., and K. Rogoff. 2011. From financial crash to debt crisis. American Economic Review 101:
1676–1706. Richard, J. 2005. The concept of fair value in French and German accounting regulations from 1673 to
1914 and its consequences for the interpretation of the stages of development of capitalist accounting. Critical Perspectives on Accounting 16: 825–850.
Shleifer, A. 2005. Understanding regulation. European Financial Management 11: 439–451. Stigler, G. 1971. The theory of economic regulation. The Bell Journal of Economics and Management
Science 2: 3–21. Sunder, S. 2005. Minding our manners: accounting as social norms. The British Accounting Review 37:
367–387. Sunder, S. 2016. Rethinking financial reporting: standards, norms and institutions. Foundations and
Trends in Accounting 11: 1–118. Tahoun, A., and L. van Lent. 2013. The personal wealth interests of politicians and government
intervention in the economy. Working paper, London Business School and Tilburg University. Tamny, J. 2015. Popular Economics. Regnery Publishing: Washington DC. Van Overfelt, W., M. Deloof, and A. Vanstraelen. 2010. Determinants of corporate financial disclosure in
an unregulated environment: evidence from the early 20th century. European Accounting Review 19: 7–34.
Waymire, G., and S. Basu. 2007. Accounting is an evolved economic institution. Foundations and Trends in Accounting 2: 1–174.
Waymire, G., and S. Basu. 2011. Economic crisis and accounting evolution. Accounting and Business Research 41: 207–232.
Wei, Y. 2009. Securities Markets and Corporate Governance: A Chinese Experience. Ashgate Publishing: Surrey, U.K.
Witman, D. 1977. Candidates with policy preferences: a dynamic model. Journal of Economic Theory 14: 180–189.
Yandle, B. 1983. Bootleggers and Baptists: the education of a regulatory economist. Regulation 7: 12–16.

FIGURE 1 Media Mentions of the Terms “Scandal” and “Regulator” over the 1800 to 2015 Period
The figure plots the yearly number of incidents the terms “scandal” and “regulator” are mentioned in the business press. The sample comprises 24 (out of 26) countries, for which we have electronically accessible and searchable newspaper archives available. We have no data for Portugal and Egypt. In each country, we search the historical archives of a leading (business) newspaper for the occurrence of the above two terms (or the local equivalents), and aggregate these numbers on a yearly basis (see the Appendix for details and individual country graphs). We report the contemporaneous Pearson correlation coefficients between the two time-series over the entire period as well as over various sub-periods. The graph also plots the median GDP per capita of the sample countries over time (black line; measured in 1990 International Dollars; source: The Maddison-Project, 2013 version). We further indicate periods of global financial crises (shaded in grey), and defined as years in which more than two-thirds of the sample countries experienced at least one crisis of the following type: bank crisis, stock market crash, currency crisis, inflation crisis, or sovereign debt crisis. The financial crises definitions and data are from Reinhart and Rogoff (2011).
' ' ' ' ' '
!"#$%&'()&$$"*#+,&'%-./011./023
./040
./0503026(+&(7.35304.(+&(7.35
31..(+&(302531..(+&(7.35
.
58...
3.8...
358...
7.8...
758...
9.8...
958...
31.. 313. 317. 319. 312. 315. 316. 314. 311. 310. 30.. 303. 307. 309. 302. 305. 306. 304. 301. 300. 7... 7.3.
:"'+,&'%(&;(<=>#'?#*< :"'+,&'%(&;(<@"AB*#+&$<
($)*"#'56!'7$4'0"7*+"
!$4*,)-',.'2%,8"%'.*#"#0*"%'04*-$-

FIGURE 2 Incidents of Corporate Scandals and Regulation over the 1800 to 2015 Period
Panel A: Number of Total Corporate Scandals and Total Regulation
Panel B: Number of Accounting Scandals and Accounting Regulation
The figure plots the yearly number of total corporate scandals and total regulation (Panel A) or accounting scandals and accounting regulation (Panel B) for our sample of 26 countries over the 1800 to 2015 period. Total scandals comprise accounting scandals, near accounting scandals, and other scandals. Total regulations comprise accounting regulations, other regulations, and supranational regulations. See Section 2 for details. If feasible, we measure corporate scandals in the year they are first covered in the financial press, and regulation in the year it is enacted. We report the contemporaneous Pearson correlation coefficients between the two time-series over the entire period as well as over various sub-periods. We further indicate periods of global corporate (accounting) scandals (shaded in grey), and defined as years in which more than half of the sample countries experienced at least one corporate (accounting) scandal.
' ' ' '
!"#$%&'()&$$"*#+,&'%-./012./134
./441
./10.2561(+&(3.27254.(+&(3.27
20..(+&(3.2720..(+&(2567
.
2.
3.
8.
6.
7.
1.
20.. 202. 203. 208. 206. 207. 201. 204. 200. 205. 25.. 252. 253. 258. 256. 257. 251. 254. 250. 255. 3... 3.2.
9&+#*()&$:&$#+"(;<#'=#*% 9&+#*(>"?@*#+,&'
!$*4)/0')5'2%)6"%'.)*+)*",$'0."#/"%0
' ' ' ' '
!"#$%&'()&$$"*#+,&'%-./012./134
./531
./1014615(+&(3.47
48..(+&(3.4748..(+&(4617
460.(+&(3.47
.
4.
3.
2.
1.
7.
5.
48.. 484. 483. 482. 481. 487. 485. 480. 488. 486. 46.. 464. 463. 462. 461. 467. 465. 460. 468. 466. 3... 3.4.
9::&;'+,'<(=:#'>#*% 9::&;'+,'<(?"<;*#+,&'
!$3-*01'*4'.%*5"%'"))*+#,-#.'1)"#0"%1

FIGURE 3 Incidents of Corporate Scandals and Regulation from 1800 to 2015 in the United Kingdom
The figure plots the yearly number of total corporate scandals and regulation (shaded bars; axis on the left) for the United Kingdom over the period 1800 to 2015. See Section 2 for details. The figure also plots the yearly number of incidents the terms “scandal” (solid line) and “regulator” (dashed line; axis on the right) are mentioned in the U.K. newspaper Financial Times (beginning in 1888). We exclude the period of World War II (1940 to 1945) from the analyses. We report the contemporaneous Pearson correlation coefficients between the two time-series of media mentions over the entire period as well as over various sub-periods.
' ' ' ' ' ' '
!""#$%&'%()*"+%,+-* ./ ))))!""#$%&'%()01($-+&'#% 2341+0)+""#$%&'%()*"+%,+-* 53 ))))6&710)01($-+&'#% 896&710)*"+%,+-* :9 ))));$<0+%+&'#%+-)01($-+&'#% 9=#&+-)"#0<#0+&1)*"+%,+-* /// ))))=#&+-)01($-+&'#% 59
>1+0*#%)?#001-+&'#%*@AB./2ABA39
AB.A5ABCC8
8.39)&#)/A858.:A)&#)/A85
8CCC)&#)/A858CCC)&#)8.2.
A
3AA
CAA
8D/AA
8D9AA
/DAAA
A
/
3
9
C
8A
8CAA 8C8A 8C/A 8C2A 8C3A 8C5A 8C9A 8C:A 8CCA 8C.A 8.AA 8.8A 8./A 8.2A 8.3A 8.5A 8.9A 8.:A 8.CA 8..A /AAA /A8A
9$/4"':$#,4)#0);'<1$23%",)*<
9$/4"':$#,4)#0);'<-."#/"%<
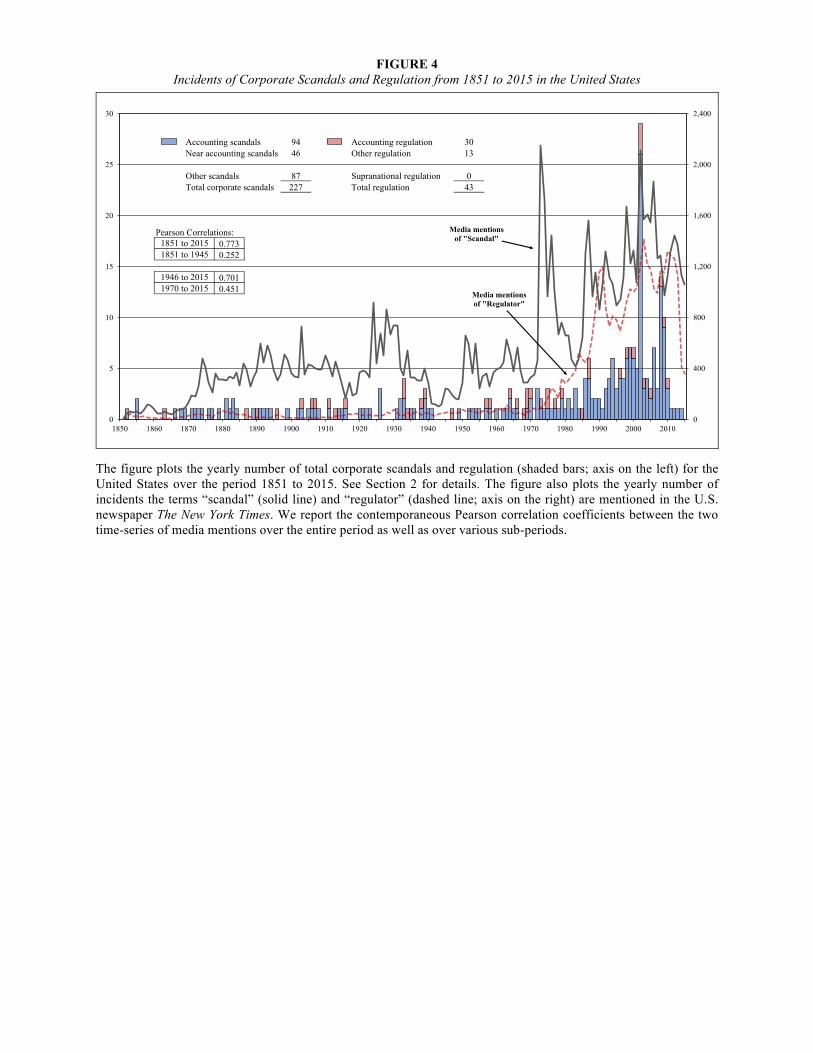
FIGURE 4 Incidents of Corporate Scandals and Regulation from 1851 to 2015 in the United States
The figure plots the yearly number of total corporate scandals and regulation (shaded bars; axis on the left) for the United States over the period 1851 to 2015. See Section 2 for details. The figure also plots the yearly number of incidents the terms “scandal” (solid line) and “regulator” (dashed line; axis on the right) are mentioned in the U.S. newspaper The New York Times. We report the contemporaneous Pearson correlation coefficients between the two time-series of media mentions over the entire period as well as over various sub-periods.
!""#$%&'%()*"+%,+-* ./ ))))!""#$%&'%()01($-+&'#% 2341+0)+""#$%&'%()*"+%,+-* /5 ))))6&710)01($-+&'#% 82
6&710)*"+%,+-* 9: ))));$<0+%+&'#%+-)01($-+&'#% 3=#&+-)"#0<#0+&1)*"+%,+-* >>: ))))=#&+-)01($-+&'#% /2
?1+0*#%)@#001-+&'#%*A3B::23B>C>
3B:383B/C8
8./5)&#)>38C8.:3)&#)>38C
89C8)&#)>38C89C8)&#)8./C
3
/33
933
8D>33
8D533
>D333
>D/33
3
C
83
8C
>3
>C
23
89C3 8953 89:3 8993 89.3 8.33 8.83 8.>3 8.23 8./3 8.C3 8.53 8.:3 8.93 8..3 >333 >383
!"#$%&'"()$*(+*,&-."/01%)*2-
!"#$%&'"()$*(+*,&-34%(#%1-

FIGURE 5 Incidents of Corporate Scandals and Regulation from 1878 to 2015 in China
The figure plots the yearly number of total corporate scandals and regulation (shaded bars; axis on the left) for China over the period 1878 to 2015. See Section 2 for details. The figure also plots the yearly number of incidents the terms “scandal” (solid line) and “regulator” (dashed line; axis on the right) are mentioned in the Chinese newspapers Shen Bao (i.e., Shanghai News; 1878 to1948) and People’s Daily (1949 to 2015). We use the terms “scandal” (“
” or “ ”) and “fraud” (“ ”, “ ” or “ ”, and “ ” or “ ”) together with “supervising authority” (“ ” or “ ”, “ ” or “ ”, and “ ” or “ ”) and “company law” (“ ”, “ ” or “ ”, and “ ”) in the media search. We report the contemporaneous Pearson correlation coefficients between the two time-series of media mentions over the entire period as well as over various sub-periods.
' ' ' ' ' '
!""#$%&'%()*"+%,+-* ./ ))))!""#$%&'%()01($-+&'#% 2341+0)+""#$%&'%()*"+%,+-* 3. ))))5&610)01($-+&'#% 375&610)*"+%,+-* 23 ))))8$90+%+&'#%+-)01($-+&'#% :;#&+-)"#09#0+&1)*"+%,+-* <3= ))));#&+-)01($-+&'#% .:
>1+0*#%)?#001-+&'#%*@:A7=/:A.=/:A/3/:A/2.
</B/)&#)3:<C</=:)&#)3:<C
<7=7)&#)3:<C<7=7)&#)</B7
:
<::
3::
2::
B::
:
C
<:
<C
3:
<7=: <77: <7/: </:: </<: </3: </2: </B: </C: </.: </=: </7: <//: 3::: 3:<:
6$/4"'7$#,4)#0)8'91$23%",)*9
6$/4"'7$#,4)#0)8'9-."#/"%9

FIGURE 6 Incidents of Corporate Scandals and Regulation from 1860 to 2015 in Italy
The figure plots the yearly number of total corporate scandals and regulation (shaded bars; axis on the left) for Italy over the period 1860 to 2015. See Section 2 for details. The figure also plots the yearly number of incidents the terms “scandal” (solid line) and “regulator” (dashed line; axis on the right) are mentioned in the Italian newspaper La Stampa (beginning in 1867). We use the terms “scandal” (“scandalo”) and “regulator” (“regolatore” and “legislatore”) in the media search. We report the contemporaneous Pearson correlation coefficients between the two time-series of media mentions over the entire period as well as over various sub-periods.
' ' ' ' ' '
!""#$%&'%()*"+%,+-* ./ ))))!""#$%&'%()01($-+&'#% 2.31+0)+""#$%&'%()*"+%,+-* 4. ))))5&610)01($-+&'#% 275&610)*"+%,+-* /8 ))))9$:0+%+&'#%+-)01($-+&'#% 82;#&+-)"#0:#0+&1)*"+%,+-* 8<8 ))));#&+-)01($-+&'#% </
=1+0*#%)>#001-+&'#%*?@[email protected]
@AC7B@A<./
8B7<)&#)2@848B.@)&#)2@84
8C<.)&#)2@848C<.)&#)8B74
@
.@@
8D7@@
2D8@@
2DC@@
/D4@@
@
4
8@
84
2@
24
8C<@ 8C.@ 8CC@ 8CB@ 8B@@ 8B8@ 8B2@ 8B/@ 8B7@ 8B4@ 8B<@ 8B.@ 8BC@ 8BB@ 2@@@ 2@8@
7$/4"'8$#,4)#0)9':1$23%",)*:
7$/4"'8$#,4)#0)9':-."#/"%:

TABLE 1 Data Sources and Data Availability for Newspaper Search by Country
Country Earliest Year
Premier (Business) Outlets/Other Outlets (Period Covered and Available Archives)
Australia 1831 -! Sydney Morning Herald (until 1841: Sydney Herald; 1831 to 2015); online archive through Trove from the National Library of Australia (E); online newspaper archive ($; E); and online archive through Fairfax Media News Store (E).
Austria 1800 -! Wiener Zeitung* (1800 to 1847; 1908 to 1913; 1919 to 1932); online archive through university library (E).
-! Die Presse*/Neue Freie Presse (1848 to 1939; 2001 to 2015); online archive through university library (E), and online newspaper archive ($; E).
-! Austria Press Agency APA (1955 to 2015); online archive of provider ($; E). Belgium 1831 -! L’Indépendance Belge (1831 to 1940); digital archive with onsite access at Royal Belgian
Library (E). -! Het Laatste Nieuws (1941 to 1950); digital archive with onsite access at Royal Belgian Library
(E). -! Het Belang van Limburg (1951 to 1987); digital archive with onsite access at the editorial office
of the newspaper (E). -! De Tijd* (1988 to 2015); online newspaper archive ($; E).
Brazil 1875 -! O Estado de São Paulo (1875 to 2015); online newspaper archive ($; E). -! Folha de São Paulo (1921 to 2015); online newspaper archive (E). -! Valor Econômico* (1996 to 2015); online newspaper archive ($; E).
Canada 1844 -! The Globe and Mail (until 1936: The Globe; 1844 to 2015); online archive through ProQuest Historical Newspapers ($; E).
China 1878 -! Shen Bao ( , 1878 to 1949); online archive through university library (E). -! People’s Daily ( , 1949 to 2015): online archive through university library (E) and
Factiva ($; E). -! 21st Century Business Herald* (21 , 2001 to 2015); online archive through
WiseSearch ($; E). Denmark 1884 -! Politiken (1884 to 2015); online newspaper archive ($; E).
-! Dagbladet Børsen* (1970 to 2015); online newspaper archive ($; E). -! Berlingske Business* (1980 to 2015); online newspaper archive ($; E). -! Finans.dk (1996 to 2015); online newspaper archive ($; E).
Egypt 1888 -! The Egyptian Gazette (1888 to 1966); onsite access to newspaper microfilms at the Center for Research Libraries and various university libraries (M).
-! La Bourse Égyptienne* (1929-1963); onsite access to newspaper microfilms at the Center for Research Libraries (M).
-! Al Ahram Weekly (1998 to 2015); online newspaper archive (E). -! Daily News Egypt (2008 to 2015); online archive through Lexis Nexis ($, E).
Finland 1889 -! Helsingin Sanomat* (1889 to 2015); national library digital collections (E); onsite access to digital collection of the Päivälehti Archives (E); and online newspaper archive ($; E).
France 1826 -! Le Figaro (1826 to 1942); online archive through French National Library (E). -! Journal des Finances* (1870 to 1938); online archive through French National Library (E). -! Le Monde* (1945 to 2015); online newspaper archive ($; E). -! Les Échos* (1997 to 2015); online archive through Factiva ($; E).
Germany 1805 -! Hamburger Börsen-Halle (1805 to 1866); online archive through university library (E). -! Berliner Börsen-Zeitung (1872 to 1930); online archive through university library (E). -! Frankfurter Allgemeine Zeitung* (1949 to 2015); online newspaper archive ($; E).
Greece 1830 -! Empros (1896 to 1930; 1945 to 1966); online archive through university library (E). -! Other newspaper sources used: Eleftheria (E; 1945 to 1966); Aion (M; 1838 to 1891); Acropolis
(M; 1883 to 1935); To Asty (M; 1885 to 1907); various (M; 1830 to 1936); online access to newspaper microfilms through the library of the Greek Parliament.
-! Naftemporiki* (1996 to 2015); online newspaper archive (E, $). India 1838 -! The Times of India (1838 to 2015); online archive through ProQuest Historical Newspapers
and NewsBank ($; E). -! Financial Times* (1888 to 2015); online newspaper archive ($; E).
Israel 1932 -! The Jerusalem Post (until 1950: The Palestine Post; 1932 to 2015); online archive through ProQuest Historical Newspapers and Lexis Nexis ($; E).
Italy 1860 -! La Stampa* (1867 to 2015); online newspaper archive (E). -! Il Corriere della Sera (1876 to 2015); online newspaper archive ($; E). -! Il Sole 24 Ore (1920 to 2015); online newspaper archive ($; E).
(Continued)

TABLE 1—Continued
Country Earliest Year
Premier (Business) Outlets/Other Outlets (Period Covered and Available Archives)
Japan 1874 -! Yomiuri Shimbun ( ; 1874 to 2015); online newspaper archive ($; E). -! The Nikkei* ( ; 1975 to 2015); online newspaper archive ($; E).
Korea (South) 1920 -! Cho-sun Il-Bo (1920 to 2015); online archive through university library (E). Netherlands 1828 -! Algemeen Handelsblad* (from 1970 on: NRC Handelsblad*) (1828 to 1994; 1998 to 2015);
online archive through Delpher (E); and online archive through Lexis Nexis ($; E). Poland 1920 -! Gazeta Wyborcza* (1989 to 2015); online archive through university library (E).
-! Kurier Warszawski (1920 to 1938, missing 1921 and 1927); online archive through university library (M).
Portugal 1864 -! Diário de Notícias (1864 to 1918; 1974 to 2015): onsite access to newspaper microfilms at National Library of Portugal (M); and online archive through Factiva ($; E).
-! Diário de Notícias, Portuguese-American edition (1919 to 1973); online archive through library (E).
South Africa 1880 -! The Rand Daily Mail (1905 to 1910; 1940 to 1985); online archive through NewsBank ($; E). -! Other newspaper sources used: The Journal (1880 to 1913); Natal Witness (1880 to 1885);
Friend of the Free State and Bloemfontein Gazette (1880 to 1890); Indian Opinion (1903 to 1922); various (1880 to 1939); online archive through NewsBank ($, E).
-! Business Day* (1986 to 2015): onsite access to newspaper microfilms at Northwestern University (M); and online archive through NewsBank ($; E).
Spain 1881 -! La Vanguardia (1881 to 2015); online newspaper archive ($; E). -! Cinco Días* (1978 to 2015); online newspaper archive ($; E).
Sweden 1831 -! Svenska Dagbladet (1884 to 2015); online archive through national library of Sweden (E). -! Aftonbladet (1831 to 2015); online archive through national library of Sweden (E). -! Dagens Industri* (1976 to 2015); online archive through national library of Sweden (E).
Switzerland 1800 -! Neue Zürcher Zeitung* (1800 to 2015); online newspaper archive ($; E). United Kingdom
1800 -! Financial Times* (1888 to 2015); online newspaper archive ($; E).
United States 1851 -! The New York Times (1851 to 2015); online archive through ProQuest Historical Newspapers ($; E).
-! The Wall Street Journal* (1889 to 2015); online archive through ProQuest Historical Newspapers ($; E).
The table reports the premier (national) newspaper outlet (in bold) together with additional newspaper sources that we used for our electronic and manual search of corporate scandals in a country. We also report the earliest year for which newspaper sources are available. An asterisk (*) indicates a newspaper with a strong business focus/section; a dollar sign ($) indicates that the electronic archive does not offer free access, but needs a subscription; E stands for electronic archive that is accessible through key word search; M stands for archive that requires manual search (e.g., microfilm or hardcopies).

TABLE 2 Examples of Classification of Corporate Scandals from the United Kingdom
Year Event (Classification)
Classification Criteria
(1) Does the event involve one or more financial reporting
practices?
(2) Are these practices either morally or legally wrong under local customs or
jurisdiction?
(3) Does the event trigger
material (negative) consequences for
corporate outsiders?
(4) Does the event cause a
public outcry and discussion?
1845 2nd Railway Mania (Accounting Scandal)
-! Inflated sales -! Capitalized costs
-! Accounting fraud -! Bribery of politicians -! Insider trading
-! Bankruptcy -! Many middle class
families lost their entire savings
-! Extensive coverage in The London Times and The Economist
1878 City of Glasgow Bank (Accounting Scandal)
-! Fictitious accounting entries to overstate assets and understate liabilities
-! Overvaluation of irrecoverable banking assets and other investments
-! Purchases of the bank’s shares to maintain its market valuation
-! Accounting fraud -! Directors were convicted
and sentenced to prison
-! Bank collapsed -! Deficiency of capital
estimated at £5.19 million
-! Hundreds of firms folded as a result and the 1,200 shareholders and their families suffered greatly
-! Extensive coverage in international media outlets (The London Times; New York Times)
-! The failure resulted in greater publicity “than had ever previously fallen to the lot of any business establishment” and was seen as “an event which would long be remembered by thousands in Scotland as the saddest and darkest in their history.”
1965 Fire, Auto & Marine Insurance (Near Accounting Scandal)
-! Reporting of non-existent investments
-! Insufficient cash flows
-! Insurance fraud -! Emil Savundra (founder)
was convicted of fraud
-! Left 400,000 previously insured motorists without insurance coverage
-! Emil Savundra’s lavish lifestyle drew attention of the U.K. media, which uncovered the evidence of a major fraud
1986 The Guinness Affair (Near Accounting Scandal)
-! False accounting (minor effects) -! The CEO’s arrangement to
purchase Guinness shares had not been revealed to the board. The CEO was said to have misreported this sum in Guinness's financial accounts.
-! Inflation of Guinness share price to assist takeover bid for Distillers
-! Four businessmen were charged and convicted of criminal offences for price manipulation.
-! After takeover of Distillers, Guinness share price tripled
-! Payment of large fees and other awards to parties involved in the scheme
-! Front page coverage in international media outlets (Financial Times; Wall Street Journal)
1998 GLH Derivatives and Griffin Trading Company (Other Scandal)
-! n.a. -! Firms went into default after a single trader lost £6.2 million (10 times exceeding his trading limit) on German derivative investments
-! First default in the industry since collapse of Barings in 1995
-! Forced closure by the regulator
-! Extensive coverage in international media outlets (BBC; The Independent; Wall Street Journal)
2007 Northern Rock (Other Scandal)
-! n.a. -! Financial distress due to investments in U.S. sub-prime mortgage debt
-! Bank collapsed and was later nationalized
-! Bank run
-! First U.K. bank run since Overend, Gurney & Co. in 1866 (also in our sample)
-! Front-page coverage in international media outlets (Financial Times, Wall Street Journal)
The table provides illustrative examples of corporate scandals in the U.K. that we identified in our data collection, and describes how we classify them as either “accounting scandal”, “near accounting scandal”, or “other scandal” for the empirical analyses based on the four criteria outlined in Section 2.2.2.

TABLE 3 Sample Composition and Description by Country and Decade
Panel A: Number of Observations, and Incidents of Corporate Scandals and Regulation by Country
Corporate Scandals Regulation
Country Legal Tradition
Earliest Year
Country- Years Account-
ing Near
Accounting Other Total Account- ing Other Supra-
national Total
Australia English 1831 185 36 16 23 75 17 14 0 31 Austria German 1800 201 20 6 18 44 12 12 8 32 Belgium French 1831 179 10 12 26 48 22 14 8 44 Brazil French 1875 141 14 8 16 38 29 5 0 34 Canada English 1844 172 16 9 38 63 35 8 0 43 China – 1878 138 69 26 32 127 32 28 0 60 Denmark Scand. 1884 132 15 26 11 52 19 5 5 29 Egypt French 1888 121 4 9 33 46 16 21 0 37 Finland Scand. 1889 127 3 6 7 16 9 11 3 23 France French 1826 184 48 35 48 131 34 15 8 57 Germany German 1805 204 64 7 15 86 23 16 11 50 Greece French 1830 169 4 14 14 32 18 14 8 40 India English 1838 178 15 14 20 49 14 14 0 28 Israel English 1932 84 1 6 8 15 26 15 0 41 Italy French 1860 156 73 57 31 161 27 24 12 63 Japan German 1874 142 127 35 65 227 40 19 0 59 Korea (South) German 1920 91 25 17 32 74 23 27 1 51 Netherlands French 1828 183 22 10 15 47 14 22 6 42 Poland – 1920 89 19 15 40 74 11 5 3 19 Portugal French 1864 152 11 21 29 61 34 3 5 42 South Africa English 1880 136 26 19 52 97 26 14 0 40 Spain French 1881 131 20 19 23 62 20 16 6 42 Sweden Scand. 1831 185 30 18 35 83 17 13 4 34 Switzerland German 1800 216 17 10 26 53 26 10 0 36 United Kingdom English 1800 210 92 54 76 222 34 16 6 56 United States English 1851 165 94 46 87 227 30 13 0 43 Total 4,071 875 515 820 2,210 608 374 94 1,076
(Continued)

TABLE 3—Continued
Panel B: Number of Observations, and Incidents of Corporate Scandals and Regulation by Decade
Corporate Scandals Regulation
Decade Number of Countries
Country- Years Account-
ing Near
Accounting Other Total Account- ing Other Supra-
national Total
1800 4 35 0 0 0 0 1 0 1 2 1810 4 40 0 0 1 1 1 1 0 2 1820 6 46 0 0 2 2 0 0 0 0 1830 11 99 0 2 1 3 4 4 0 8 1840 12 116 2 2 11 15 7 2 0 9 1850 13 129 7 5 11 23 9 7 0 16 1860 15 146 9 5 11 25 12 7 0 19 1870 18 163 7 10 16 33 12 4 0 16 1880 23 208 10 14 28 52 14 9 0 23 1890 23 230 28 15 35 78 15 15 0 30 1900 23 230 37 22 20 79 19 10 0 29 1910 23 230 9 21 24 54 21 13 0 34 1920 25 250 24 21 40 85 23 11 0 34 1930 26 248 30 27 50 107 36 11 1 48 1940 25 205 4 7 12 23 27 15 0 42 1950 26 255 15 21 29 65 28 20 0 48 1960 26 254 34 13 21 68 32 10 1 43 1970 26 251 59 30 44 133 59 23 0 82 1980 26 260 56 50 72 178 58 25 16 99 1990 26 260 155 100 143 398 85 71 11 167 2000 26 260 263 99 161 523 115 83 50 248 2010 26 156 126 51 88 265 30 33 14 77 Total 4,071 875 515 820 2,210 608 374 94 1,076
The sample comprises the 12 countries with substantive accounting scandals in the past as identified in Jones (2011), the next 11 largest (in terms of GDP) OECD countries (we were unable to collect data for Mexico, Norway, and Turkey) plus Brazil, Egypt, and South Africa. It covers the years 1800 to 2015. This selection procedure yields a global sample of 26 countries spanning Africa, Asia, Europe, Latin America, North America, and Oceania for a period of more than 200 years. The table reports the beginning of the sample period, the number of country-years, and the number of corporate scandals and regulations by country (Panel A) and decade (Panel B). For the empirical analyses, we classify the corporate scandals that we identified in the data collection as either “accounting scandal”, “near accounting scandal”, or “other scandal” based on the four criteria outlined in Section 2.2.2 (see also Table 2). We classify the regulatory actions that we identified as either “accounting regulation”, “other regulation”, or “supranational regulation” based on how they affect a firm’s financial reporting and whether they were drafted and decided upon at the national or supranational level. We measure corporate scandals in the year they are first covered in the financial press and media, and regulation in the year it is enacted. In Panel A, we also indicate a country’s legal tradition (source: La Porta et al. 1998), and distinguish between English common law, French commercial code, German commercial code, and Scandinavian civil law countries.
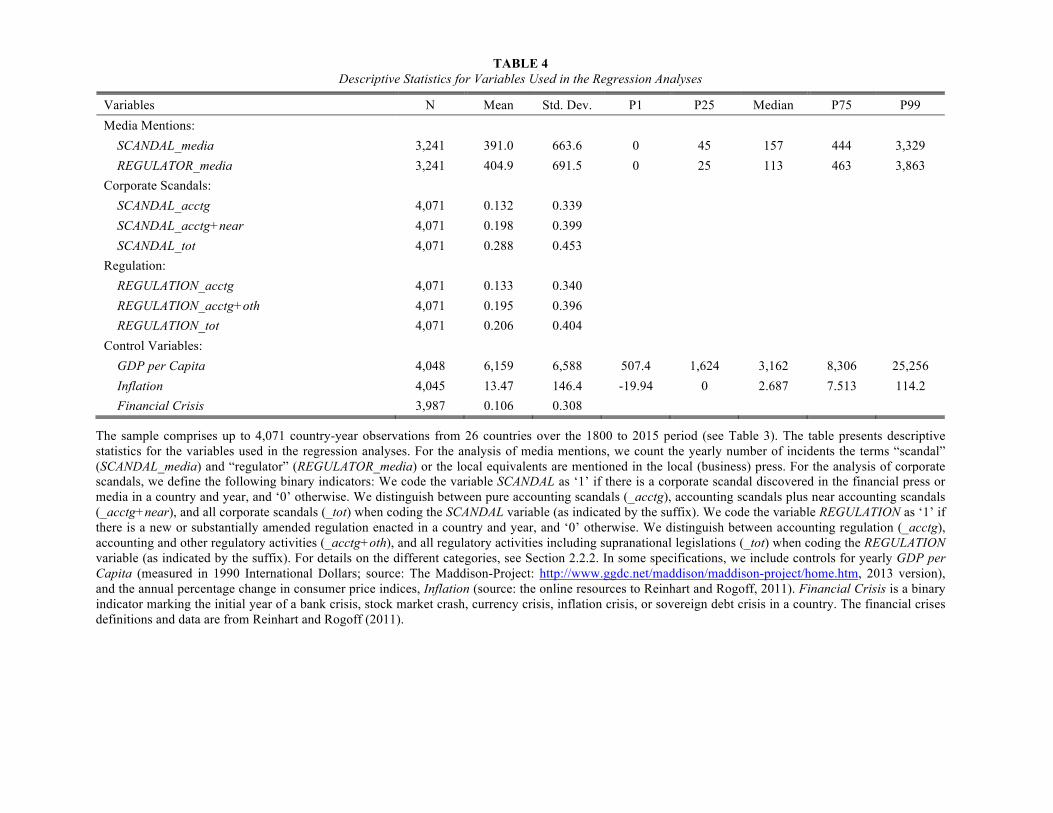
TABLE 4 Descriptive Statistics for Variables Used in the Regression Analyses
Variables N Mean Std. Dev. P1 P25 Median P75 P99 Media Mentions: SCANDAL_media 3,241 391.0 663.6 0 45 157 444 3,329 REGULATOR_media 3,241 404.9 691.5 0 25 113 463 3,863 Corporate Scandals: SCANDAL_acctg 4,071 0.132 0.339 SCANDAL_acctg+near 4,071 0.198 0.399 SCANDAL_tot 4,071 0.288 0.453 Regulation: REGULATION_acctg 4,071 0.133 0.340 REGULATION_acctg+oth 4,071 0.195 0.396 REGULATION_tot 4,071 0.206 0.404 Control Variables: GDP per Capita 4,048 6,159 6,588 507.4 1,624 3,162 8,306 25,256 Inflation 4,045 13.47 146.4 -19.94 0 2.687 7.513 114.2 Financial Crisis 3,987 0.106 0.308
The sample comprises up to 4,071 country-year observations from 26 countries over the 1800 to 2015 period (see Table 3). The table presents descriptive statistics for the variables used in the regression analyses. For the analysis of media mentions, we count the yearly number of incidents the terms “scandal” (SCANDAL_media) and “regulator” (REGULATOR_media) or the local equivalents are mentioned in the local (business) press. For the analysis of corporate scandals, we define the following binary indicators: We code the variable SCANDAL as ‘1’ if there is a corporate scandal discovered in the financial press or media in a country and year, and ‘0’ otherwise. We distinguish between pure accounting scandals (_acctg), accounting scandals plus near accounting scandals (_acctg+near), and all corporate scandals (_tot) when coding the SCANDAL variable (as indicated by the suffix). We code the variable REGULATION as ‘1’ if there is a new or substantially amended regulation enacted in a country and year, and ‘0’ otherwise. We distinguish between accounting regulation (_acctg), accounting and other regulatory activities (_acctg+oth), and all regulatory activities including supranational legislations (_tot) when coding the REGULATION variable (as indicated by the suffix). For details on the different categories, see Section 2.2.2. In some specifications, we include controls for yearly GDP per Capita (measured in 1990 International Dollars; source: The Maddison-Project: http://www.ggdc.net/maddison/maddison-project/home.htm, 2013 version), and the annual percentage change in consumer price indices, Inflation (source: the online resources to Reinhart and Rogoff, 2011). Financial Crisis is a binary indicator marking the initial year of a bank crisis, stock market crash, currency crisis, inflation crisis, or sovereign debt crisis in a country. The financial crises definitions and data are from Reinhart and Rogoff (2011).

TABLE 5 Temporal Patterns of Media Mentions of the Terms “Scandal” and “Regulator” over the 1800 to 2015 Period
ln(SCANDAL_mediat +1) as Dependent Variable ln(REGULATOR_mediat +1) as Dependent Variable (1)
1800-2015 (2)
1800-1945 (3)
1946-2015 (4)
1970-2015 (1)
1800-2015 (2)
1800-1945 (3)
1946-2015 (4)
1970-2015 Lagged Scandals and Regulation: ln(SCANDAL_media[t–1 to t–3] +1) 0.875*** 0.824*** 0.871*** 0.847*** 0.031* 0.042* 0.028* 0.024 (43.65) (17.76) (32.31) (24.87) (1.72) (1.86) (1.73) (0.95) ln(REGULATOR_media[t–1 to t–3] +1) 0.062*** 0.068 0.034* 0.045*** 0.932*** 0.828*** 0.906*** 0.908*** (3.30) (1.61) (2.00) (3.06) (52.67) (28.24) (34.13) (40.66) Control Variables: ln(GDP per Capitat–1) 0.080*** 0.034 0.086** -0.003 0.074*** 0.097** 0.111** 0.070 (4.03) (0.58) (2.52) (-0.04) (2.88) (2.15) (2.12) (0.99) ln(Inflationt–1) -0.044 -0.172** -0.025 -0.056** 0.020 0.022 0.044 0.002 (-0.97) (-2.40) (-0.45) (-2.14) (0.56) (0.24) (0.94) (0.05) Fixed Effects Country Country Country Country Country Country Country Country Adjusted R-Squared 0.923 0.886 0.930 0.914 0.942 0.920 0.949 0.942 Observations 3,224 1,646 1,578 1,043 3,224 1,646 1,578 1,043
The table reports analyses of the lead-lag relation between scandals (of any kind) and regulations (of any kind) based on media mentions. The sample comprises up to 3,224 country-year observations from 24 countries over the 1800 to 2015 period (see Table 3). The dependent variables are the numbers of times the terms “scandal” and “regulator” (or the local equivalents) are mentioned in the local (business) press in a year, SCANDAL_media and REGULATOR_media, respectively. The independent variables are: (i) the three-year backward-looking moving averages of the two dependent variables, (ii) GDP per Capita, and (iii) annual Inflation. We use the natural log of the raw values (plus one or, for inflation, plus the minimum sample inflation rate) as indicated, and lag all independent variables by one year. The table reports ordinary least squares (OLS) coefficient estimates and (in parentheses) t-statistics based on robust standard errors clustered by country. We include country fixed effects in the regressions, but do not report the coefficients. ***, **, and * indicate statistical significance at the 1%, 5%, and 10% levels (two-tailed).

TABLE 6 Temporal Patterns of Corporate Scandals and Regulation over the 1800 to 2015 Period
Panel A: Logit Regression Analysis of Total Corporate Scandals and Total Regulation
SCANDAL_tott as Dependent Variable REGULATION_tott as Dependent Variable (1) (2) (3) (4) (1) (2) (3) (4)
Lagged Scandals and Regulation: SCANDAL_tot[t–1 to t–3] 2.550*** 1.752*** 1.774*** 1.499*** 1.170*** 0.432*** 0.427*** 0.297 (13.92) (7.31) (7.40) (5.57) (7.53) (3.00) (2.96) (1.59) REGULATION_tot[t–1 to t–3] 1.435*** 0.689*** 0.687*** 0.613*** 1.519*** 0.918*** 0.970*** 0.884*** (9.82) (4.52) (4.43) (2.99) (8.40) (3.92) (4.29) (4.09) Control Variables: ln(GDP per Capitat–1) – 0.760*** 0.758*** 0.799** – 0.613*** 0.600*** 0.084 (8.60) (8.58) (2.37) (5.06) (5.05) (0.24) ln(Inflationt–1) – -0.110 -0.102 0.113 – 0.317*** 0.324*** 0.261** (-0.53) (-0.49) (0.50) (3.43) (3.40) (2.23) Financial Crisis[t–1 to t–3] – – -0.144 -0.171 – – 0.188 0.046 (-0.85) (-0.77) (0.61) (0.15) Fixed Effects C C C C, Y C C C C, Y Pseudo R-Squared 0.224 0.258 0.259 0.297 0.088 0.117 0.115 0.152 Observations 4,071 4,038 3,970 3,702 4,071 4,038 3,970 3,651
Panel B: Logit Regression Analysis of Accounting Scandals and Accounting Regulation
SCANDAL_acctgt as Dependent Variable REGULATION_acctgt as Dependent Variable (1) (2) (3) (4) (1) (2) (3) (4)
Lagged Scandals and Regulation: SCANDAL_acctg[t–1 to t–3] 3.223*** 1.565*** 1.574*** 1.088*** 1.067*** 0.082 0.083 -0.046 (14.33) (6.54) (6.53) (3.77) (5.97) (0.37) (0.37) (-0.27) REGULATION_acctg[t–1 to t–3] 1.410*** 0.647*** 0.622** 0.520* 1.501*** 0.938*** 0.942*** 0.905*** (5.79) (2.60) (2.42) (1.68) (7.61) (4.56) (4.39) (4.93) Control Variables: ln(GDP per Capitat–1) – 1.069*** 1.064*** 1.295*** – 0.579*** 0.572*** 0.194 (10.27) (10.33) (4.70) (4.78) (4.73) (0.49) ln(Inflationt–1) – -0.465* -0.462* -0.069 – 0.177 0.210** 0.186* (-1.71) (-1.69) (-0.42) (1.63) (2.02) (1.65) Financial Crisis[t–1 to t–3] – – 0.188 0.124 – – 0.236 -0.057 (0.54) (0.34) (0.79) (-0.17) Fixed Effects C C C C, Y C C C C, Y Pseudo R-Squared 0.223 0.285 0.283 0.286 0.061 0.087 0.084 0.113 Observations 4,071 4,038 3,970 2,940 4,071 4,038 3,970 3,406
(Continued)

TABLE 6—Continued
The table reports analyses of the lead-lag relation between corporate scandals and regulation based on our comprehensive data collection for 26 countries over the 1800 to 2015 period (see Table 3). The dependent variables are binary indicators marking the incidents of corporate scandals (SCANDAL) and the enactment of regulation (REGULATION) in a country and year. For the analyses, we combine all corporate scandals with all regulatory activities including supranational legislations in Panel A (as indicated by the suffix _tot), and pure accounting scandals with accounting regulation in Panel B (_acctg). Depending on the specification, we include the following independent variables in the model: (i) the three-year backward-looking moving averages of the two dependent variables, (ii) GDP per Capita, (iii) annual Inflation, and (iv) the three-year backward-looking moving average of an indicator marking the initial year of a Financial Crisis in a country. See Table 4 for details. We lag all independent variables by one year, and use the natural log of the raw values (plus one or, for inflation, plus the minimum sample inflation rate) if indicated. The table reports logit coefficient estimates and (in parentheses) z-statistics based on robust standard errors clustered by country. We include country (C) and year (Y) fixed effects in the regressions, but do not report the coefficients. ***, **, and * indicate statistical significance at the 1%, 5%, and 10% levels (two-tailed).

TABLE 7 Analysis of Various Sub-Periods over the 1800 to 2015 Time Frame
Panel A: Logit Regression Analysis of Total Corporate Scandals and Total Regulation
SCANDAL_tott as Dependent Variable REGULATION_tott as Dependent Variable (1)
1800-2015 (2)
1800-1945 (3)
1946-2015 (4)
1970-2015 (1)
1800-2015 (2)
1800-1945 (3)
1946-2015 (4)
1970-2015 Lagged Scandals and Regulation: SCANDAL_tot[t–1 to t–3] 1.752*** 1.441*** 1.258*** 0.576 0.432*** 0.202 0.520** 0.149 (7.31) (4.33) (4.59) (1.62) (3.00) (0.85) (2.15) (0.55) REGULATION_tot[t–1 to t–3] 0.689*** 0.584** 0.703** 0.158 0.918*** 0.899*** 0.515** -0.061 (4.52) (2.43) (2.44) (0.54) (3.92) (3.68) (2.19) (-0.29) Control Variables & Fixed Effects Included Included Included Included Included Included Included Included Pseudo R-Squared 0.258 0.196 0.266 0.227 0.117 0.053 0.089 0.066 Observations 4,038 2,224 1,793 1,187 4,038 2,224 1,793 1,187
Panel B: Logit Regression Analysis of Accounting Scandals and Accounting Regulation
SCANDAL_acctgt as Dependent Variable REGULATION_acctgt as Dependent Variable (1)
1800-2015 (2)
1800-1945 (3)
1946-2015 (4)
1970-2015 (1)
1800-2015 (2)
1800-1945 (3)
1946-2015 (4)
1970-2015 Lagged Scandals and Regulation: SCANDAL_acctg[t–1 to t–3] 1.565*** 1.319** 0.959*** 0.637** 0.082 0.524 0.142 0.262 (6.54) (2.04) (3.45) (2.01) (0.37) (1.05) (0.41) (0.77) REGULATION_acctg[t–1 to t–3] 0.647*** 0.997** 0.456 0.223 0.938*** 0.674** 0.627*** 0.088 (2.60) (2.16) (1.02) (0.64) (4.56) (1.99) (2.66) (0.36) Control Variables & Fixed Effects Included Included Included Included Included Included Included Included Pseudo R-Squared 0.285 0.156 0.292 0.246 0.087 0.068 0.062 0.057 Observations 4,038 2,045 1,793 1,187 4,038 2,224 1,793 1,187
The table reports analyses of the lead-lag relation between corporate scandals and regulation for 26 countries over various sub-periods from 1800 to 2015 (see Table 3). The dependent variables are binary indicators marking the incidents of corporate scandals (SCANDAL) and the enactment of regulation (REGULATION) in a country and year. For the analyses, we combine all corporate scandals with all regulatory activities including supranational legislations in Panel A (as indicated by the suffix _tot), and pure accounting scandals with accounting regulation in Panel B (_acctg). We estimate Model 2 in Table 6, but only report the logit coefficient estimates and (in parentheses) z-statistics based on robust standard errors clustered by country for the lagged moving averages of the two dependent variables. ***, **, and * indicate statistical significance at the 1%, 5%, and 10% levels (two-tailed).

TABLE 8 Analysis of Various Sub-Samples over the 1800 to 2015 Period
Developed Markets Emerging Markets Strong Rule of Law Weak Rule of Law (1)
SCANDAL (2)
REGUL. (1) SCANDAL
(2) REGUL. (1)
SCANDAL (2)
REGUL. (1) SCANDAL
(2) REGUL.
Lagged Scandals and Regulation: SCANDAL_tot[t–1 to t–3] 1.387*** 0.303 2.529*** 0.759*** 1.161*** 0.236 2.172*** 0.659*** (6.18) (1.53) (5.77) (4.72) (4.54) (1.10) (6.06) (2.91) REGULATION_tot[t–1 to t–3] 0.554*** 0.989*** 0.855*** 0.566 0.593*** 1.046*** 0.603** 0.474 (2.86) (3.70) (3.15) (1.22) (2.96) (4.08) (2.23) (1.24) Control Variables & Fixed Effects Included Included Included Included Included Included Included Included Pseudo R-Squared 0.255 0.105 0.276 0.147 0.249 0.087 0.280 0.168 Observations 2,924 2,924 1,114 1,114 2,275 2,275 1,540 1,540
English
Legal Tradition French Legal Tradition German
Legal Tradition Scandinavian Legal Tradition
(1) SCANDAL
(2) REGUL. (1)
SCANDAL (2)
REGUL. (1) SCANDAL
(2) REGUL. (1)
SCANDAL (2)
REGUL. Lagged Scandals and Regulation: SCANDAL_tot[t–1 to t–3] 1.692*** 0.533** 1.555*** 0.147 1.445** 0.859* 1.239*** 0.331*** (3.22) (2.29) (6.12) (0.52) (2.44) (1.68) (5.27) (3.04) REGULATION_tot[t–1 to t–3] 0.613** 0.322 0.561* 0.751*** 0.839*** 1.493*** 0.707 0.264 (2.47) (0.77) (1.90) (2.61) (3.60) (5.40) (0.72) (0.41) Control Variables & Fixed Effects Included Included Included Included Included Included Included Included Pseudo R-Squared 0.192 0.074 0.242 0.185 0.354 0.116 0.286 0.093 Observations 1,114 1,114 1,403 1,403 854 854 444 444
The table reports analyses of the lead-lag relation between corporate scandals and regulation for various sub-samples of the 26 countries over the 1800 to 2015 period (see Table 3). The dependent variables are binary indicators marking all incidents of corporate scandals (SCANDAL_tot), and the enactment of all regulatory activities (REGULATION_tot) in a country and year. We analyze the following sub-groups: (i) developed versus emerging markets based on the classification in the Morgan Stanley Capital International database as of 2000; (ii) countries with strong versus weak rule of law based on the index scores from La Porta et al. (1997) and split by the sample median; and (iii) a country’s legal tradition taken from La Porta et al. (1998). We distinguish between English common law, French commercial code, German commercial code, and Scandinavian civil law countries. We estimate Model 2 in Table 6, but only report the logit coefficient estimates and (in parentheses) z-statistics based on robust standard errors clustered by country for the lagged moving averages of the two dependent variables. ***, **, and * indicate statistical significance at the 1%, 5%, and 10% levels (two-tailed).

TABLE 9 Analysis of Individual Sample Countries
Country (sorted by past REGULATION)
SCANDAL_tott as Dependent Variable Country (sorted by past SCANDAL)
REGULATION_tott as Dependent Variable
SCANDAL_tot[t–1 to t–3] REGULATION_tot[t–1 to t–3] SCANDAL_tot[t–1 to t–3] REGULATION_tot[t–1 to t–3]
Coefficient z-statistic Coefficient z-statistic
Coefficient z-statistic Coefficient z-statistic Spain 3.001*** (4.34) 3.591***1) (3.40) Israel 3.152** (2.20) -0.7211) (-0.80) Israel 0.000 (0.00) 3.569** (2.46) Greece 3.096**1) (2.52) 1.365 (1.41) Denmark 2.670*** (2.91) 3.283***1) (2.85) Korea (South) 2.813*** (3.03) 0.645 (0.54) Korea (South) 6.955*** (4.33) 2.793 (1.22) India 2.430** (2.46) -2.540 (-1.51) Austria 2.222*** (2.78) 2.495** (2.23) Italy 2.354*** (3.36) 1.425* (1.83) Sweden 3.115***1) (5.31) 2.150** (2.29) Switzerland 2.166***1) (3.28) 0.762 (0.73) Greece 2.394** (2.01) 2.143** (2.03) Austria 2.152** (2.47) 1.350 (1.14) Italy 3.358*** (4.97) 2.088*** (2.79) Brazil 1.888** (2.40) 1.589* (1.86) France 2.307***1) (4.78) 1.959***1) (3.27) Finland 1.728* (1.77) 1.524 (1.62) Poland 3.382***1) (4.13) 1.867 (1.44) Sweden 1.607*** (2.71) -0.169 (-0.16) Brazil 3.088*** (3.69) 1.819* (1.93) Spain 1.558** (2.37) 0.613 (0.74) Australia 1.164* (1.89) 1.612** (2.20) United Kingdom 1.347***1) (2.87) 0.516 (0.81) China 2.799***1) (4.22) 1.595** (1.98) Belgium 1.265 (1.61) 1.849*** (2.68) South Africa 3.477***1) (5.66) 1.512*1) (1.90) France 1.206** (2.29) 1.851*** (2.99) Portugal 1.694***1) (2.62) 1.256** (2.06) Denmark 1.201 (1.56) 1.255 (1.16) Netherlands 3.007***1) (4.79) 1.233* (1.78) Portugal 0.877 (1.08) 3.612*** (5.05) Belgium 0.274 (0.38) 1.217* (1.93) Germany 0.846* (1.65) 1.455**1) (2.01) United States 2.106***1) (3.91) 1.164 (1.47) China 0.839 (1.42) 1.619** (2.29) Egypt 1.023 (1.46) 0.945 (1.31) United States 0.803 (1.43) 0.585 (0.89) Germany 3.525***1) (6.13) 0.871 (1.07) South Africa 0.797 (1.49) 2.009***1) (2.90) Switzerland 3.287***1) (5.24) 0.661 (0.63) Netherlands 0.651 (1.04) 2.081*** (2.97) United Kingdom 2.588***1) (5.67) 0.502 (0.86) Poland 0.488 (0.68) 0.417 (0.41) India 2.006*** (2.64) 0.453 (0.38) Australia 0.357 (0.48) 1.993** (2.30) Canada 0.263 (0.36) 0.309 (0.42) Egypt 0.205 (0.27) 2.107***1) (3.16) Japan 1.451*** (2.64) 0.256 (0.45) Canada -0.287 (-0.34) 0.057 (0.07) Finland 2.318** (2.15) -0.023 (-0.02) Japan -0.455 (-0.79) 1.486**1) (2.44)
The table reports analyses of the lead-lag relation between corporate scandals and regulation for the 26 individual sample countries over the 1800 to 2015 period (see Table 3). The dependent variables are binary indicators marking all incidents of corporate scandals (SCANDAL_tot), and the enactment of all regulatory activities (REGULATION_tot) in a country and year. We include an intercept in the regressions, but only report the logit coefficient estimates and (in parentheses) z-statistics based on robust standard errors for the lagged moving averages of the two dependent variables. We report countries rank ordered by the magnitude of the lagged REGULATION or SCANDAL coefficient. ***, **, and * indicate statistical significance at the 1%, 5%, and 10% levels (two-tailed). The superscript 1) marks coefficients that remain significant at the 10% level or better after including GDP per Capita and Inflation as control variables in the regressions.