corporate social responsibility and the market pricing … · corporate social responsibility and...
TRANSCRIPT
Corporate Social Responsibility
and the Market Pricing of Corporate Earnings
Eli Bartov* Leonard N. Stern School of Business
New York University
Yan Li
NUS Business School
National University of Singapore
February 4, 2015
*Corresponding author: New York University, Stern School of Business, 44 W. 4th St., Suite 10-96, New York,
NY 10012. Tel: +1 (212) 998-0016. We appreciate the comments from Siew Hong Teoh, Bernard Yeung, Oliver
Li, Charles Shi, workshop participants at Bocconi University, National University of Singapore, PolyU Hong
Kong, and participants at the 2014 CAAA Annual Conference in Edmonton, Alberta, the 2014 AAAannual
meeting in Atlanta, GA, and the 2014 International Corporate Governance Conference Organized by the Centre
for Corporate Governance and Financial Policy at Hong Kong Baptist University. Yan Li is grateful to the
financial support from Singapore MOE Tier 1 Academic Research Fund.

Corporate Social Responsibility
And the Market Pricing of Corporate Earnings
ABSTRACT:
Does a firm’s corporate social responsibility (CSR) performance relate to the market pricing
of its earnings? While prior CSR research has studied benefits of CSR activities from a
managerial reporting and analyst perspectives, we focus on an investor behavior perspective.
Briefly, motivated by the CSR literature’s assertion that the higher the CSR performance the
higher is the company’s adherence to the spirit of the law and ethical standards and the finding
in the accounting literature that CSR activities are negatively related to earnings management,
we examine whether a firm’s CSR performance is associated with investors’ ability to more
reliably price earnings news. We find in a short window around earnings announcements
higher abnormal stock returns sensitivity to earnings surprises and higher abnormal trading
volumes for firms with higher CSR activities. We also find that the well-known post-earnings
announcement drift decreases in CSR performance. These findings are distinct from the
previously documented corporate governance effect, robust to various measures of earnings
surprises, abnormal returns, and CSR performance, and hold for a battery of validity checks
that considers a possible endogeneity problem, and a variety of alternative explanations.
Keywords: corporate social responsibility; market response to earnings announcements; post-
earnings announcement drift; trading volume
JEL Classification: M14, M41, G14

1
Corporate Social Responsibility
and the Market Pricing of Corporate Earnings
1. Introduction
Corporate social responsibility (CSR) concerns a corporate’s strategy, operations, and
governance structure that create environmental and social values--in addition to maximizing
enterprise value for the benefits of its shareholders--by monitoring and ensuring compliance
with the spirit of the law, ethical standards, and international norms. The goal of CSR is to
encourage a positive impact through its activities on the environment, consumers, employees,
communities, future generations, shareholders and other stakeholders.
The traditional shareholder view on CSR emphasizes the costs and limitations of
compliance with self-imposed social and environmental standards, and asserts that company
managers could not and should not be expected to engage in CSR activities at the expense of
shareholders, i.e., undertaking negative NPV projects or foregoing positive NPV projects (see,
e.g., Friedman 1970). Moreover, if CSR activities take place as a response to pressure from a
broader group of stakeholders, they inevitably result in squandering shareholder value, and are
thus inconsistent with the notion of maximizing enterprise value for the benefits of its
shareholders.
More recently, however, an opposing view on CSR, referred to as “strategic CSR,” has
emerged. This view rests on the assertion that attention to corporate social and environmental
responsibilities is generally in the long-term economic interests of the firm. When companies
implement strategic CSR, they may find there are many benefits, including enhanced trust with
key stakeholders (investors, customers, employees, regulatory agencies, and suppliers), and
strengthened corporate and brand reputations.1
Clearly, CSR activities concern trade-offs. Focusing on its potential downside, prior
1See Porter and Kramer (2006, 2011) for insights and examples of companies that have developed deep linkages
between their business strategies and CSR activities.

2
research has investigated whether managers engage in CSR activities for personal benefit rather
than for the interest of the firm’s stockholders. Jensen and Meckling (1976) and Carroll (1979),
for example, assert that CSR may be associated with managerial opportunistic behavior.
McWilliams, Siegel, and Wright (2006) suggest that CSR is a managerial perquisite; managers
may use CSR to advance their careers or other personal agendas, and Petrovits (2006) and
Prior, Surroca, and Tribo (2008) provide supportive evidence for this view. In contrast to these
findings, Gao, Lisic, and Zhang (2014) predict and find that executives of CSR firms profit
significantly less from insider trades and are less likely to trade prior to future news than
executives of non-CSR firms.
A second strand of the literature has examined benefits from voluntary disclosures of
CSR activities. Dhaliwal, Radhakrishnan, Tsang, and Yang (2012) ask whether CSR voluntary
disclosures help financial analysts. Their results demonstrate that the issuance of a stand-alone
CSR report is associated with higher analyst earnings forecast accuracy. In addition, Dhaliwal,
Li, Tsang, and Yang (2011) document that firms with a high cost of equity capital in year t-1
tend to initiate disclosure of CSR activities in year t, and that initiating firms with superior CSR
performance enjoy a subsequent reduction in the cost of equity capital.
A third strand of the literature has examined whether CSR firms differ from non-CSR
firms with respect to their mandatory financial reporting behavior. While prior work (Trebucq
and Russ 2005; Chih, Shen, and Kang2008) has reported mixed results, Kim, Park, and Wier
(2012)—who investigate whether CSR firms also behave in a responsible manner to constrain
earnings management, thereby delivering more transparent and reliable financial information
to investors—find that socially responsible firms are less likely to engage in earnings
management through discretionary accruals or real operational activities, or to be the subject
of Securities and Exchange Commission (SEC) investigations.2
Trebucq and Russ (000) find mixed results across different specifications Specifically they do not find a
significant association between CSR and earnings management using a net CSR score; they do observe, however,

3
An interesting question arises from the findings of Kim, Park, and Wier (2012), as well
as from the CSR literature’s assertion that the higher the CSR performance the higher is the
company’s adherence to the spirit of the law and ethical standards: Do CSR firms also differ
from non-CSR firms in investors’ pricing of earnings news? In this paper, we contribute to the
recently emerging empirical CSR literature, as well as to the fairly mature but still incomplete
literature on the market pricing of earnings information, by studying three questions related to
potential informational benefits to investors associated with CSR performance.
Our first research question asks: Does the sensitivity of the market reaction to a firm’s
earnings surprise—i.e., the slope coefficient (beta, or ERC, earnings response coefficient) from
regressing earnings announcement stock returns on earnings surprises—relate to its CSR
performance? Clearly, earnings announcements are important corporate events that may
change dramatically investors’ assessment of firms’ future prospects and value. While early
studies (e.g., Ball and Brown 1968) have documented a positive association between earnings
surprises and stock returns, more recent research (e.g., Liu and Thomas 2000) has concluded
that the sensitivity of the stock price response to earnings surprises hinges on the extent to
which earnings are relevant to shareholders and potential shareholders in their investment
decision making.
Recall that according to the CSR literature, the higher the CSR performance the higher
is the company’s adherence to the spirit of the law and ethical standards, which in turn, implies
less earnings management as demonstrated by Kim, Park, and Wier (2012). This, together with
the findings in the ERC literature (Liu and Thomas 2000), opens up the possibility that the
sensitivity of the market response to earnings surprises and CSR performance are positively
a negative relation in other specifications. Using multinational data, Chih, Shen, and Kang (2008) examine the
relation between CSR performance and earnings management, and provide inconsistent results across different
earnings management proxies. They show that CSR firms are more aggressive in accruals management but are
less likely to engage in earnings smoothing and earnings loss avoidance. However, different countries have
different accounting standards and reporting incentives (e.g., Ball, Robin, and Wu 2003), and these cross-country
differences rather than the variation in the CSR performance may explain their findings.

4
related That is the higher a company’s CSR performance the higher is its earnings response
coefficient (ERC) after controlling for determinants other than earnings informativeness (e.g.,
growth and risk) shown by prior research to explain the cross section variation in ERCs.
To be sure, the evidence in Kim, Park, and Wier (2012) is suggestive but not conclusive
with respect to the relation between CSR activities and the sensitivity of the market response
to earnings for three reasons. First, the market may not be able to uncover the earnings
management, in which case the ERC may not vary with CSR activities. Indeed, prior empirical
research has provided evidence indicating the market behaves as if it reacts to reported earnings
numbers mechanically (e.g., Dietrich 1984; Hand 1990; Bartov and Mohanram 2014), and in
particular is unable to decipher earnings management (e.g.,Teoh, Welch, and Wong 1998; Xie
2001;Louis and Sun 2011). 3 This result is further supported by ample and convincing
anecdotal evidence of earnings management that went unnoticed by the market for many years
(e.g., Enron Corporation; WorldCom Inc.; Tyco International Ltd.; HealthSouth
Corporation).4Second, even if the market were able to uncover the earnings management, it is
still not clear whether the earnings management differential across low and high CSR firms is
sufficiently large to affect the returns/earnings relation. Lastly, if the assertion (discussed
above) that managers make suboptimal investment decisions in CSR is valid, then the
sensitivity of the market reaction to earnings surprises may relate negatively, not positively, to
CSR performance, as investors may discount the earnings news.
Our second research question asks: Is the well-known market underreaction to earnings
surprises negatively related to CSR performance? If CSR activities are associated with more
This finding is intuitively appealing for three reasons. First, there is information asymmetry between
management and investors, i.e., investors are privy to only a small subset of a company’s information set, which
precludes them from being able to undo earnings manipulation. Second, findings in prior literature on investor
limited attention implies that even if investors were able to undo the manipulation, it is not clear they would pay
the attention needed to undo it Third if investors undo the manipulation what’s the point of managing earnings?
4In the case of HeathSouth Corporation, for example, William T. Owens, its president and CEO, testified that he
created an accounting method that would hide $2.7 to $4.6 billion in fraudulent earnings to bolster company stock
performance during the 17-year period, 1987-2003.

5
transparent and easier to interpret earnings due to less earnings management, we expect the
well-documented mispricing related to the post-earnings announcement drift (PEAD), to be
negatively related to CSR activities. That is, the higher the CSR activities the lower is PEAD.
Clearly, our first two research questions are not unrelated. If the stronger response to earnings
surprises reflects higher quality earnings information associated with CSR (our first
hypothesis), CSR activities should be associated with smaller drift (our second hypothesis), as
the drift represents market underreaction to earnings news due to investors’ failure to fully
incorporate earnings information into stock prices in a timely fashion (see, e.g., Bernard and
Thomas 1990).
To provide further evidence on how a firm’s CSR activities relate to investors’
perception of its earnings quality, our third and final research question examines whether the
earnings announcements from socially responsible firms generate high trading volume.
Empirical studies interpret earnings announcements that are accompanied by high trading
volume as conveying more information to investors than announcements that generate low
trading volume (see, e.g., Morse 1981; Bamber 1986; Bamber and Cheon 1995). Theoretical
support for this interpretation can be found in analytical models of stock trade by
Pfleiderer(1984), Grundy and McNichols(1989), Holthausen and Verrecchia(1990), and Kim
and Verrecchia(1991). These models imply that the trading volume induced by a public
announcement is positively related to the announcement's precision. In our setting, if CSR
activities relate negatively to earnings management, our third research question predicts a
positive correlation between abnormal trading volume and CSR activities around earnings
announcements, ceteris paribus.
One research-design challenge underlying our study is to quantify a firm’s CSR
performance. However, the recent emergence of rating organizations—reliable third party
institutions with resources to gather the needed information to compute CRS activities—makes

6
quantitative CSR data widely available in a machine readable form. Following prior studies in
the area (e.g., Chatterji, Levine, and Toffel2009; Kim, Park, and Wier2012), we retrieve our
proxy for CSR activities, the Kinder, Lydenburg, and Domini (KLD) ratings, from the KLD
database. However, the KLD’s corporate governance category is excluded when computing
our proxy for CSR activities and is instead used as a control variable so as to disentangle the
effects of CSR and corporate governance, because corporate governance tends to benefit the
firm’s shareholders rather than society at large.
In testing our three research questions, we analyze a broad sample that spans the 21-
year period, 1992 – 2012. Briefly, our analyses demonstrate that the sensitivity of the market
responses to earnings surprises is increasing in CSR activities, and that the extent of the
mispricing of earnings news, the post-earnings announcement drift, is decreasing in CSR
activities. We also find that CSR activities are positively related to abnormal trading volumes
around earnings announcements. These findings hold even after considering a host of control
variables, and are robust to various measures of earnings surprises, abnormal returns, and CSR
performance, and to a battery of validity checks that considers, among other things, a potential
endogeneity problem, a time period effect, and the alternative explanation that a corporate
governance effect confounds our findings.
Our contribution to the literature is threefold. First, we contribute to the strand of the
CSR literature that focuses on the managerial reporting perspective. This literature has
documented a negative association between CSR activities and earnings management (Kim,
Park, and Wier2012). However, the effect of this relation on the pricing of earnings is not clear
because investors, for example, may be unable to decipher the earnings management before
reacting to the earnings news. Our findings thus complement this strand of the literature by
highlighting the investor perspective That is investors’ reaction to earnings announcements
is increasing in CSR activities in terms of both stock prices and trading volumes.

7
Second, our findings complement the strand of the CSR literature that focuses on
financial analyst perspective. This strand of the literature has documented a positive
association between voluntary disclosures of CSR activities and analysts’ earnings forecast
accuracy. Our findings of a negative relation between CSR activities and PEAD add to this
strand of the literature by showing that investors are able to more accurately price stocks of
firms with higher CSR activities.
Lastly, the CSR effect in the market response to earnings we document is distinct from
the corporate governance effect found by prior research. Specifically, while the effect we find
is, as expected, robust to time periods, the corporate governance effect disappears after 2001
(Bebchuk, Cohen, and Wang 2013).
The remainder of the paper is structured as follows. The next section outlines our
sample selection procedures, variable definitions, and descriptive statistics. The third section
describes our tests and reports the results for the analyses on ERC and PEAD. The fourth
section provides validity checks for the findings documented in Section 3. The fifth section
reports the tests and results for abnormal trading volume around earnings announcements.
Section 6 considers the possibility that an endogeneity problem confounds our findings, and
finally, Section 7 summarizes our findings and concludes.
2. Data
2.1. Sample
The computation of a company’s CSR score (described below in detail) is based on
corporate social responsibility ratings provided by the KLD database. The KLD database
coverage starts from 1991 with annual ratings on approximately 650 firms, including all firms
in the S&P 500 and Domini 400 Social SM Index.5 The coverage was substantially expanded
5 Domini 400 Social Index is a market cap weighted stock index of 400 publicly traded companies that have met
certain standards of social and environmental excellence. Potential candidates for this index will have positive
records on issues such as employee and human relations, product safety, environmental safety, and corporate
8
to 1,100 firms in 2001 and to 3,100 firms in 2003, to include firms from Russell 1000 and 2000
indexes as well as from certain social indexes (see, 2006 KLD Research & Analytics, Inc.
manual). We retrieve our financial statement measures from Compustat quarterly database,
and stock returns from the CRSP daily returns database. Other databases used to construct the
control variables include I/B/E/S database for analyst forecast data and Thomson Reuters for
institutional ownership data.
Our sample spans 21 years, from 1992 to 2012; our sample period commences in 1992
because the KLD ratings are available since 1991 and because, to avoid a potential look-ahead
bias, we use the KLD ratings in year t-1 to classify observations into CSR deciles in year t.
Table 1 reports the effect of our sample selection procedures on the size of our final sample.
We begin with the initial sample of KLD annual ratings consisting of 141,200 firm-quarter
observations from 5,576 distinct firms over the 21-year period, 1991 - 2011.6 We then merge
these ratings with the Compustat quarterly database, which results in a loss of 13,357 firm-
quarters (642 distinct firms). Next, we drop 953 firm-quarters (9 distinct firms) with
insufficient data from Compustat to compute time-series based earnings surprises, and 1,081
firm-quarters (10 distinct firms) with a quarter-end stock price of less than $1 to alleviate the
noise caused by small SUE deflators. Then, after removing an additional13,947 observations
(182 distinct firms) not covered by the CRSP daily return file, and 320 observations (4 distinct
firms) without sufficient data from CRSP to compute abnormal returns, our final sample for
the long-window tests (i.e., tests on post earnings announcement drift) consists of 111,541 firm-
quarter observations (4,729 distinct firms). For the short-window tests (i.e., tests on ERC and
abnormal volume in the 3-day window around earnings announcements) we also require that
governance. Companies engaged in the business of alcohol, tobacco, firearms, gambling, nuclear power and
military weapons are automatically excluded. The index is independently maintained by research firm KLD
Research & Analytics, and includes mainly large cap stocks in the S&P 500.
6 The database actually provides 35,300 annual ratings. Since each annual rating is used in the ensuing four
quarters, the number of firm-quarters is 141,200 (=35,300 x 4).
9
I/B/E/S analyst earnings forecasts be available. This additional requirement results in a loss of
13,798 firm-quarters (192 distinct firms). The final sample for the short-window tests thus
contains 97,743 firm-quarter observations (4,537 distinct firms).
[Insert Table 1 about here]
2.2. Variable definitions
2.2.1.CSR scores
In each year, KLD assigns strengths and concerns in six dimensions: environmental
protection, community development, employee relations, diversity practices, product quality,
and corporate governance practices.7Since it is plausible that investors assess a company’s
CSR performance based on the totality of the evidence, and along the lines of prior research
(e.g., Kim, Park, and Wier2012;El Ghoul, Guedhami, and Kwok 2011) we construct our CSR
score, CSR_S, by aggregating total strengths minus total concerns in KLD’s first five
categories.
The KLD’s corporate governance category is excluded when computing CSR_S and is
instead used (by its net value, strengths minus concerns) as a control variable so as to
disentangle the effects of CSR and corporate governance because corporate governance tends
to benefit the firm’s shareholders rather than society at large. We use the KLD score in the
corporate governance dimension as a control variable rather than the Governance Index
(Gompers, Ishii, and Metrick 2003) because the latter measure is not available for our entire
sample period. Still, we replicated our tests below with available Governance-Index data and
found that our results are robust (results not tabulated for parsimony).
To reduce noise and to alleviate concerns that the relation between CSR_S and our
7 Starting from 2002, KLD has also assessed firms in the dimensions of human rights and firearms. Since data for
these two dimensions are not available before 2002, we do not include these two dimensions in constructing the
CSR scores, same as Kim, Park, and Wier (2012).
10
dependent variables is nonlinear, we use the decile ranks of CSR_S rather than their actual
values in our regression analysis. To that end, we first sort all firms in each year by their CSR_S
into ten deciles from lowest KLD score, decile 1, to highest KLD score, decile 10.8 Next, we
assign a decile rank to each firm within the decile, and then scale each decile rank by
subtracting 1 from it and then dividing it by 9, so the CSR decile rank, CSRDEC, ranges from
0 to 1. As an alternative, we define a dummy variable, CSRDUM, which is set to 0 (1) if the
firm-year is in the first (tenth) CSR decile.
2.2.2.SUE
Along the lines of prior PEAD research (e.g., Bernard and Thomas 1990; Ball and
Bartov 1996), for the post-earnings announcement drift tests we define the quarterly
standardized earnings surprise (SUE) as the seasonal difference in quarterly earnings, scaled
by the stock price, given in the following equation:
𝑆𝑈𝐸𝑖,𝑞 = (𝐸𝑎𝑟𝑛𝑖𝑛𝑔𝑠𝑖,𝑞 − 𝐸𝑎𝑟𝑛𝑖𝑛𝑔𝑠𝑖,𝑞−4)/𝑃𝑖,𝑞 (1)
Where, Earningsi,q is the primary earnings per share before extraordinary items of firm ifor
quarter q, and Pi,q, is the stock price per share of firm i at the end of quarter q. This measure of
SUE is widely available, bias free, and has been widely used in the PEAD literature. However,
following the ERC literature, for our ERC tests we calculate SUE based on analyst forecasts
rather than the seasonal differences in quarterly earnings, and denote this variable as SUE_AF.9
Similar to the fashion in which CSRDEC is computed, we compute DSUE (DSUE_AF)
by first forming in each quarter ten SUE (SUE_AF) deciles from lowest SUE (SUE_AF), decile
1, to highest SUE (SUE_AF), decile 10. We next assign a decile rank to each firm within the
decile, and then adjust each decile rank by subtracting 1 from it and then dividing the difference
8As an alternative, we formed the deciles within industry-year, rather than year, and obtained similar results.
9As expected, this reduces our sample size by approximately 10 percent; employing instead reported earnings
from the same quarter last year has no impact on our findings (results are not tabulated for parsimony).

11
by 9, so DSUE (DSUE_AF) ranges from 0 to 1.
2.2.3. Abnormal returns
We measure the abnormal returns over two windows: the earnings announcement
window that spans three trading days, -1, 0 and +1, where day 0 is the earnings announcement
day, and the post-earnings announcement window that spans 60 trading days commencing two
days after day 0. We define these returns either as cumulative abnormal returns (CAR,
Equations 2 and 3), or as buy-and-hold abnormal returns (BHAR, Equations 4 and 5):
𝐶𝐴𝑅(−1, 1)𝑖𝑞 = ∑ (𝑅𝑖𝑘 − 𝐸𝑅𝑖𝑘)𝑡+1𝑘=𝑡−1 (2)
𝐶𝐴𝑅(2, 60)𝑖𝑞 = ∑ (𝑅𝑖𝑘 − 𝐸𝑅𝑖𝑘)𝑡+60𝑘=𝑡+2 (3)
𝐵𝐻𝐴𝑅(−1, 1)𝑖𝑞 = ∏ (1 + 𝑅𝑖𝑘) −𝑡+1𝑘=𝑡−1 ∏ (1 + 𝐸𝑅𝑘)𝑡+1
𝑘=𝑡−1 (4)
𝐵𝐻𝐴𝑅(2, 60)𝑖𝑞 = ∏ (1 + 𝑅𝑖𝑘) −𝑡+60𝑘=𝑡+2 ∏ (1 + 𝐸𝑅𝑘)𝑡+60
𝑘=𝑡+2 (5)
Where, Rik is the stock-return of firm i and ERik is the stock-return of the matching size-B/M
portfolio on day k, and t is quarter q's earnings announcement date. Each stock is matched with
one of six size-B/M portfolios (i.e., two size and three B/M portfolios) at the end of June, where
size is the market capitalization at the end of June, and B/M is the ratio of book value of equity
at the last fiscal year end to the market capitalization at the end of last calendar year. The daily
returns of the six size-B/M portfolios are from the Kenneth French’s website 10 If a firm delists
during the return accumulation window, we compute the remaining return by using the CRSP
daily delisting return, reinvesting any remaining proceeds in the appropriate benchmark
portfolio, and adjusting the corresponding market return to reflect the effect of the delisting
return on our measures of expected returns (see Shumway 1997; Beaver, McNichols, and Price
2007).11
10 http://mba.tuck.dartmouth.edu/pages/faculty/ken.french/data library.html
11 Poor performance-related delistings (delisting codes 500 and 520–584) often have missing delisting returns in
the CRSP database (Shumway 1997). To correct for this bias, we set missing performance-related delisting returns

12
2.2.4. Abnormal trading volume
We denote the three-day average abnormal trading volume as 𝐴𝐵𝑉𝑂𝐿(−1, 1), where
day 0 is the earnings announcement day.12 Following Hirshleifer, Lim, and Teoh (2009), we
define abnormal volume on day j relative to the announcement date t as a normalized difference
between the log dollar volume on day j and the average log dollar volume over the 30-day
period, (−41 −11 ,relative to the earnings announcement date:
𝐴𝐵𝑉𝑂𝐿(𝑗) = 𝐿𝑜𝑔(𝐷𝑜𝑙𝑙𝑎𝑟𝑉𝑜𝑙𝑡+𝑗 + 1) −1
30∑ 𝐿𝑜𝑔(𝐷𝑜𝑙𝑙𝑎𝑟𝑉𝑜𝑙𝑘 + 1)𝑡−11
𝑘=𝑡−41
2.3. Descriptive statistics
Panel A of Table 2 compares descriptive statistics of our sample firms (long-window
tests) with those in the quarterly Compustat universe.13 Since the KLD database only covers
the largest firms, it is not surprising that our sample firms differ from those in the Compustat
universe. Both mean and median comparisons indicate that our sample firms are substantially
larger than firms in the Compustat universe, as measured by sales, total assets, and market
capitalization. Still, this difference should not be overemphasized because the market response
to earnings announcements and post-earnings announcement drift are both decreasing in firm
size presumably because more predisclosure information is available for large firms (Shores
1990; Bernard and Thomas 1990), which implies that our results below may be stronger than
they appear.
Our sample firms are also more profitable than those in the Compustat universe: they
to –100 percent as recommended by Shumway (1997). Overall, the percentage of delisting sample firms is small
(approximately 0.8 percent and 2 percent for the 60-day and 120-day return windows, respectively), which is not
surprising given our relatively short return windows. Still, we replicate our tests excluding delisting returns. The
results, not tabulated for parsimony, are indistinguishable from the tabulated results. 12 Using the average trading volume over the past two weeks as the normal volume as in DellaVigna and Pollet
(2009), yield qualitatively identical results.
13 The results for the sample employed for the short-window tests are very similar (not tabulated for parsimony).
(6)
13
earn higher earnings, are less likely to report a loss, and generate higher return on assets (ROA).
In addition, on average the market response to earnings is positive for both samples, albeit more
so for our sample. This finding is consistent with prior research finding of earnings
announcement premium, i.e., on average stock prices rise around scheduled earnings
announcement dates. Differences in the leverage ratio (debt to assets) suggest that our sample
firms are generally less leveraged than those in the Compustat universe. In addition, the
earnings of our sample firms represent less growth (mean and median SUE are both lower than
the Compustat universe), yet are more likely to beat analyst forecasts (mean and median
SUE_AF are higher than the Compustat universe), their beta is higher, and a larger percentage
of their stock is held by institutions. Overall, the statistics in Table 2 show, as expected, that
our sample firms are larger, more profitable, less leveraged, with more predictable earnings
and higher institutional ownership vis-à-vis Compustat firms not in our sample. To consider
the possibility that these differences confound our findings, the validity checks section below
considers their effects on our results.
Panel B of Table 2 presents the sample distribution by industry as defined by Fama-
French 12 industry classification (see, Fama and French 1995). Notwithstanding the
differences in descriptive statistics between our sample and the Compustat universe, we find
that all industries are well represented in our sample, and our sample displays a similar
distribution as the Compustat sample over the same period. For example, each of the two most
represented industries--finance, and computers, software and electronic equipment--consists of
over 15% of firms in both our sample and the Compustat universe. In addition, the sample
distribution across other industries is also quite similar to that of the Compustat universe. This
relieves the concern of sample selection bias. To further mitigate the potential industry effect,
we control for the industry fixed effect in the regression analyses.
Finally, Panel C of Table 2 reports the year-over-year variation in a firm’s CSR ranking
14
Clearly, the variation is nontrivial as the results indicate that approximately 50 (25) percent of
firms in CSR deciles 2-9 (1, 10) change decile ranking annually.
[Insert Table 2 about here]
3. Tests and Results: Stock Returns
3.1. Tests on the sensitivity of the market response to earnings surprises
3.1.1 Methodology
We test our first research question, the one related to the relation between CSR activities
and the sensitivity of the market response to earnings surprises, by estimating the following
equation:
𝑅𝐸𝑇𝑈𝑅𝑁(−1, 1)𝑖,𝑡,𝑞 = 𝛽0 + 𝛽1𝐷𝑆𝑈𝐸_𝐴𝐹𝑖,𝑡,𝑞 + 𝛽2𝐶𝑆𝑅𝑖,𝑡−1 + 𝛽3𝐶𝑆𝑅𝑖,𝑡−1 × 𝐷𝑆𝑈𝐸_𝐴𝐹𝑖,𝑡,𝑞 + 𝜀𝑖,𝑡,𝑞(7)
Where, i is the firm index, and t(= 1990 1993 … 0010 and q(=1, 2, 3, 4) designate year and
quarter, respectively. The dependent variable, 𝑅𝐸𝑇𝑈𝑅𝑁(−1, 1)𝑖,𝑡,𝑞 , is either cumulated
abnormal return, CAR(-1, 1), or buy-and-hold abnormal return, BHAR(-1, 1), over the three-
day period centered on the earnings announcement day. DSUE_AF is the scaled decile rank of
SUE_AF.CSR is measured either as the scaled decile ranks of CSR scores, CSRDEC, or as a
dummy variable, CSRDUM.
Our variable of interest, the interaction term between CSR and DSUE_AF, captures the
extent to which investors’ short-term response to a firm’s quarterly earnings surprise varies
with the firm’s CSR activities. In terms of Equation (7), our prediction that the sensitivity of
the market response to earnings surprise is positively associated with CSR activities implies
that𝛽3> 0.
3.1.2. Results
Panel A of Table 3 reports the results from estimating Equation (7) for the entire sample,

15
and Panel B reports the results for two subperiods, 1991 – 1999 and 2000 - 2011. Consider the
results in Panel A first, where the three right-most columns display the results using the three-
day buy-and-hold abnormal returns, BHAR(-1, 1), as the dependent variable, and the three left-
most columns using cumulated abnormal return, CAR(-1, 1). From reading across the table we
first note that for all specifications𝛽1, the coefficient on DSUE_AF, the variable that captures
the earnings surprise, is as expected positive and significant at the 1 percent level, with the
magnitude ranging from 0.072 to 0.081. In addition, measuring the abnormal returns as either
buy-and-hold or cumulative makes little difference, as evidenced by the (nearly) identical
coefficients on corresponding variables and the similarity in the R-squared values across the
two alternative measures for the dependent variable.
[Insert Table 3 about here]
Second, the coefficient on our variable of interest, 𝛽3, capturing the interaction between
CSR activities and earnings surprises (i.e., 𝐶𝑆𝑅𝐷𝐸𝐶 × 𝐷𝑆𝑈𝐸_𝐴𝐹or𝐶𝑆𝑅𝐷𝑈𝑀 × 𝐷𝑆𝑈𝐸_𝐴𝐹),
is significantly positive. This finding indicates a positive association between the sensitivity
of the market reaction to earnings surprises and CSR activities: the higher the CSR activities
the higher the ERC. To illustrate the economic significance of the association between CSR
activities and ERC, consider the results displayed in column (3). Comparing with firms in the
lowest CSR score decile, firms in the highest CSR score decile have an average ERC of 0.089
(=0.072+0.017), representing an increase of approximately 24 percent in the ERC. In other
words, when reporting earnings in the highest earnings surprise decile (DSUE_AF = 1), the
earnings announcement return of firms in the highest CSR decile is 170 bps higher than that of
firms in the lowest CSR decile. Therefore, the positive association between CSR activities and
ERC is not only statistically significant, it is also economically important.
Next, we consider the relation between the CSR effect in the market response to
earnings news and that of corporate governance documented by prior research, and the

16
sensitivity of our findings to a possible time period effect. The motivation for this analysis
follows from Bebchuk, Cohen, and Wang (2013) that show that the correlation between
corporate governance indices and earnings announcement abnormal stock
returnsdocumentedfor1990–1999, subsequently disappeared. According to Bebchuk, Cohen,
and Wang (2013), the correlation and its disappearance are both due to market participants’
gradually learning to appreciate the difference between good-governance and poor-governance
firms.
Note, however, that the story underlying our hypotheses differs from that of Bebchuk,
Cohen, and Wang (2013) in an important way. Specifically, we assert that the stock price
response to earnings is stronger for CSR firms due to higher earnings quality (less earnings
management), whereas Bebchuk et al. hypothesize that the stronger response follows from
investors’ failure to recognize that better-governance firms are managed more efficiently, and
thus will report higher earnings. In other words, the stock price response to earnings may be
expressed as the product of the earnings surprise and the stock price response to a unit of
surprise (i.e., the beta on the earnings surprise, or ERC). While we hypothesize that the
stronger CSR firms’ earnings announcement stock returns follows because CSR firms have a
higher ERC due to higher quality earnings that investors recognize, Bebchuk et al. argue that
the stronger stock price response to better-governance firms’ earnings releases represents
higher earnings surprises due to investors’ failure to recognize that better governance leads to
higher earnings. One important empirical implication of this difference is that the time period
effect observed in Bebchuk et al. setting, should not be expected in ours.
Panel B reports the results by subperiods. We pick 2001 as the cutoff year because
Bebchuk, Cohen, and Wang (2013) show that the corporate governance effect disappeared after
that year. To save space, we tabulate results only for CAR(-1, 1); using instead BHAR(-1, 1)
as the dependent variable does not change the findings. Similar to the results in Panel A, for all
17
specifications and time periods,𝛽1, the coefficient on DSUE, is as expected positive and highly
significant. The magnitude of the coefficient, however, seems to increase nearly three folds
over time, from 0.033 to 0.086 for the first model (columns 1 and 3), and from 0.029 to 0.084
for the second model (columns 2 and 4). One interpretation of this finding is that market learns
over time about its underreaction to earnings surprises and consequently (partially) corrects for
it by responding more strongly in the second period.
As to our coefficient of interest, 𝛽3, capturing the interaction between CSR activities
and earnings surprises (i.e., 𝐶𝑆𝑅𝐷𝐸𝐶 × 𝐷𝑆𝑈𝐸 or 𝐶𝑆𝑅𝐷𝑈𝑀 × 𝐷𝑆𝑈𝐸 ), it is significantly
positive in all specifications and time periods (the only exception is column 3, where it has the
predicted sign but is insignificance). This finding indicates that the positive association
between the sensitivity of the market reaction to earnings surprises and CSR activities is as
expected stable over time, and highlights an important difference between the CSR effect in
the stock price response to earnings announcements we document and the corporate
governance effect found by prior research.
One way to interpret this finding is that investors consider reported earnings of socially
responsible firms more transparent and reliable than those of other firms. Indeed, this
interpretation is consistent with findings in Kim, Park, and Wier (2012) demonstrating that
socially responsible firms are less likely to manipulate earnings and to be the subject of SEC
investigation.
One interesting implication of our findings so far is that CSR activities should alleviate
the well-documented underreaction to earnings announcements. In the next section, we test
this implication by examining the incremental association between CSR performance and post-
earnings announcement drift after controlling for the earnings surprises.

18
3.2. Tests on the Post-Earnings Announcement Drift
3.2.1 Methodology
Recall that our second research question predicts that the mispricing associated with
earnings announcements is decreasing in CSR activities. More specifically, the higher the CSR
activities, the stronger is the sensitivity of the market reaction to earnings surprises, which in
turn alleviates the market underreaction to earnings announcements and thus the post-earnings
announcement drift. To test this prediction, we replicate the estimation of Equation (7) above,
except that the dependent variable is either cumulative abnormal returns, CAR(2, 60) or buy-
and-hold abnormal returns, BHAR(2, 60), from two days after quarterly earnings announcement
day to 60 trading dates afterwards, as follows:
𝑅𝐸𝑇𝑈𝑅𝑁(2, 60)𝑖,𝑡,𝑞 = 𝛽0 + 𝛽1𝐷𝑆𝑈𝐸𝑖,𝑡,𝑞 + 𝛽2𝐶𝑆𝑅𝑖,𝑡−1 + 𝛽3𝐶𝑆𝑅𝑖,𝑡−1 × 𝐷𝑆𝑈𝐸𝑖,𝑡,𝑞 + 𝜀𝑖,𝑞(8)
In other words, we test the incremental effect of CSR activities on the 60-day post-
announcement abnormal returns after controlling for the SUE effect. If the stronger immediate
response to earnings surprises associated with CSR documented above alleviates the well-
documented underreaction to earnings announcements, we expect a smaller post-earnings
announcement drift for firms with higher CSR scores. In terms of Equation (8), the prediction
that post-earnings announcement drift is decreasing in CSR activities suggests that 𝛽3< 0.
3.2.2. Results
Table 4 reports the results from estimating Equation (8). The three right-most columns
display the results using the 60-day buy-and-hold abnormal returns, BHAR(2, 60),as the
dependent variable, and the three left-most columns using cumulated abnormal return, CAR(2,
60). Two results are noteworthy. First, consistent with findings in prior literature on post-
earnings announcement drift (e.g., Bernard and Thomas 1990;Ball and Bartov 1996), the
coefficient on DSUE, 𝛽1, is significantly positive in specifications that consider current SUE
and future returns without introducing CSR activities (columns 1 and 4 of Table 5). This

19
positive correlation between current earnings surprises and future stock returns, which suggests
that the market underreacts to earnings news, confirms prior literature findings in our sample.
[Insert Table 4 about here]
Second, when the model is augmented to include the interaction between CSR activities
and earnings surprises, which is measured as either 𝐶𝑆𝑅𝐷𝐸𝐶 × 𝐷𝑆𝑈𝐸or 𝐶𝑆𝑅𝐷𝑈𝑀 × 𝐷𝑆𝑈𝐸,
𝛽1 is still significantly positive. In these specifications, the positive 1 means that the
underreaction to earnings news is observed when CSR activities are relatively low (for firms
in the lowest CSR decile). Moreover, 1 is larger in these specifications relative to the
unaugmented model (e.g., 0.013 in column 1 vis-à-vis 0.022 in column 2), implying that the
drift for low CSR companies is larger than the drift for an average CSR company. More
importantly, 𝛽3 —the coefficient on our variable of interest, capturing the effect of CSR
activities on the post-earnings announcement drift—is significantly negative in all
specifications. This finding indicates a negative association between post-earnings
announcement drift and CSR activities; that is, for a given earnings surprise the higher the CSR
activities the lower post-earnings announcement drift. Taken together, the picture that emerges
from the findings so far is that CSR activities are positively associated with perceived earnings
quality (i.e., more decision useful) that results in more efficient market valuation of earnings.
This is evidenced by the positive association between CSR activities and the sensitivity of
market response to earnings news (Table 3) and the negative association with post-earnings
accounting drift (Table 4). In the next section, we perform validity checks to assess the
reliability of our findings.
4. Validity Checks
In this section, we perform sensitivity tests that consider the robustness of our findings
so far to model specification.
4.1. CSR activities and the sensitivity of market response to earnings news

20
In the last four decades, ample empirical accounting research has documented a number
of determinants underlying the sensitivity of stock price changes to earnings surprises in
regressions of returns on current earnings (see, e.g., Collins and Kothari 1989;Lundholm and
Myers 2002; Balsam, Bartov, and Marquardt 2002).Growth, risk (beta), earnings persistence,
firm size, ownership sophistication, and the presence of an accounting loss have all been shown
to be significantly related to the coefficient on current earnings (i.e., ERC). Thus, an alternative
explanation for our results is that CSR activities serve simply as a proxy for these determinants.
To test this alternative explanation, we augment Equation (7) above by adding eight
variables as stand-alone as well as interaction variables, as follows:
𝑅𝐸𝑇𝑈𝑅𝑁(−1, 1)𝑖,𝑡,𝑞 = 𝛽0 + 𝛽1𝐷𝑆𝑈𝐸_𝐴𝐹𝑖,𝑡,𝑞 + 𝛽2𝐶𝑆𝑅𝑖,𝑡−1 + 𝛽3𝐶𝑆𝑅𝑖,𝑡−1 × 𝐷𝑆𝑈𝐸_𝐴𝐹𝑖,𝑡,𝑞 +
𝛽4𝐿𝑂𝑆𝑆𝑖,𝑡−1 + 𝛽5𝐺𝑅𝑂𝑊𝑇𝐻𝑖,𝑡−1 + 𝛽6𝐵𝐸𝑇𝐴𝑖,𝑡−1 + 𝛽7𝑆𝐼𝑍𝐸𝑖,𝑡−1 + 𝛽8𝑃𝐸𝑅𝑆𝐼𝑆𝑇𝑖,𝑡,𝑞 + 𝛽9𝐿𝐺𝑁𝐴𝐹𝑖,𝑡,𝑞 +
𝛽10𝐼𝑁𝑆𝑇𝑖,𝑡,𝑞 + 𝛽11𝐶𝐺𝑂𝑉_𝑆𝑖,𝑡 + 𝛽12𝐿𝑂𝑆𝑆𝑖,𝑡−1 × 𝐷𝑆𝑈𝐸_𝐴𝐹𝑖,𝑡,𝑞 + 𝛽13𝐺𝑅𝑂𝑊𝑇𝐻𝑖,𝑡−1 ×
𝐷𝑆𝑈𝐸_𝐴𝐹𝑖,𝑡,𝑞 + 𝛽14𝐵𝐸𝑇𝐴𝑖,𝑡−1 × 𝐷𝑆𝑈𝐸_𝐴𝐹𝑖,𝑡,𝑞 + 𝛽15𝑆𝐼𝑍𝐸𝑖,𝑡−1 × 𝐷𝑆𝑈𝐸_𝐴𝐹𝑖,𝑡,𝑞 + 𝛽16𝑃𝐸𝑅𝑆𝐼𝑆𝑇𝑖,𝑡,𝑞 ×
𝐷𝑆𝑈𝐸_𝐴𝐹𝑖,𝑡,𝑞 + 𝛽17𝐿𝐺𝑁𝐴𝐹𝑖,𝑡,𝑞 × 𝐷𝑆𝑈𝐸_𝐴𝐹𝑖,𝑡,𝑞 + 𝛽18𝐼𝑁𝑆𝑇𝑖,𝑡,𝑞 × 𝐷𝑆𝑈𝐸_𝐴𝐹𝑖,𝑡,𝑞 + 𝛽19𝐶𝐺𝑂𝑉_𝑆𝑖,𝑡 ×
𝐷𝑆𝑈𝐸_𝐴𝐹𝑖,𝑡,𝑞 + 𝜀𝑖,𝑡,𝑞
Where, as before i is the firm index, t (= 1990 1993 … 0010 and q (=1, 2, 3, 4) designate
year and quarter, respectively, and the RETURN, DSUE_AF, and CSR variables are as defined
in Equation (7) above. Our first control variable, LOSSt-1is a dummy variable equal to one if
income before extraordinary items in year t-1 is negative, and equal to zero otherwise.
GROWTH t-1 is the difference between total assets at the end of year t-1 and total assets at the
end of year t-2.BETAt-1 is the CAPM beta measured based on daily returns over the yeart-1.
SIZEt-1 is the firm’s market capitalization at the end of year t-1.PERSIST is earnings persistence
measured as follows: using data from the most recent 16 quarters up to quarter q-1 (minimum
4 observations), we regress by firm IBCq on IBCq-4, where IBC is quarterly income before
extraordinary items scaled by total assets. The coefficient on IBCq-4 is assigned as the
persistence measure for each firm in quarter q. To mitigate the effect of outliers and similar to
the way we compute DSUE_AF, we replace the value of the coefficient on IBCq-4 by its
(9)
21
rank.14LGNAF is the logarithm of (1+ the number of analysts who provide earnings forecast
for the company’s current fiscal quarter INSTi,t,q, our proxy for ownership sophistication, is
the percentage of institutional holdings at the end of the most recent calendar quarter
constructed based on Thomson-Reuters 13f database.
Finally, to assess the possibility that our CSR scores simply represent another
manifestation of corporate governance, we add to our model CGOV_S, the KLD score in the
corporate governance dimension, measured, as before, as the KLD net score (i.e., total score of
strengths minus total score of concerns).As discussed before, we use CGOV_S rather than the
Governance Index (Gompers, Isshii, and Metrick 2003) because the latter measure is not
available for our entire sample period. Still, we replicated our tests below in the sample with
available Governance-Index data and found that our results are robust (results not tabulated for
parsimony).
Table 5 displays the results from estimation Equation (9): in the two right-most (left-
most) columns the dependent variable is the three-day buy-and-hold (cumulative) abnormal
returns. The primary takeaway from Table 5 is that our results are robust to the inclusion of
the additional control variables. This is evidenced by the significantly positive coefficient on
both𝛽1 , the coefficient on DSUE_AF, and 𝛽3 , the coefficient on our variable of interest,
𝐶𝑆𝑅𝐷𝐸𝐶 × 𝐷𝑆𝑈𝐸_𝐴𝐹, in all specifications. In addition, the incremental contribution of the
control variables in explaining earnings persistence is limited, once the CSR activities are
considered. This point is perhaps best illustrated by how little the control variables contribute
incrementally to the regression ability to explain the cross sectional variation in the market
response to earnings surprises. For example, the R-Squared in Table 3 above for the
specification that considers CAR(-1, 1) as the dependent variable and CSRDEC as an
Controlling for earnings growth and persistence is particularly important in the current context because in
addition to higher earnings quality, CSR performance also implies higher quality work force and more sustainable
earnings.

22
explanatory variable is 9.88 percent (see column 2 of Table 3), and after augmenting the model
by adding the eight control variables either as stand-alone variables (column 1 of Table 5) or
as stand-alone and interaction variables (column 2 of Table 5) the corresponding R-Squared is
only slightly higher, 10.72 percent and 11.56 percent, respectively.15
[Insert Table 5 about here]
4.2. CSR activities and the market underreaction to earnings news
We document above negative relation between post-earnings announcement drift and
CSR activities. However, in addition to post-earnings announcement drift prior research
demonstrates that accruals are also mispriced around earnings announcements (e.g., Sloan
1996), and that other variables, corporate governance, the number of analysts following a firm,
and ownership sophistication may also be related to the market underreaction to earnings
announcements. To test whether the explanatory power of CSR activities for post-earnings
announcement drift is above and beyond these variables, we estimate the following model:
𝑅𝐸𝑇𝑈𝑅𝑁(2, 60)𝑖,𝑡,𝑞 = 𝛽0 + 𝛽1𝐷𝑆𝑈𝐸𝑖,𝑡,𝑞 + 𝛽2𝐶𝑆𝑅𝑖,𝑡−1 + 𝛽3𝐶𝑆𝑅𝑖,𝑡−1 × 𝐷𝑆𝑈𝐸𝑖,𝑡,𝑞 + 𝛽4𝐿𝐺𝑁𝐴𝐹𝑖,𝑡,𝑞 +
𝛽5𝐼𝑁𝑆𝑇𝑖,𝑡,𝑞 + 𝛽6𝐶𝐺𝑂𝑉_𝑆𝑖,𝑡−1 + 𝛽7𝐴𝐵𝐴𝐶𝐶𝑖,𝑡−1 + 𝛽8𝐿𝐺𝑁𝐴𝐹𝑖,𝑡,𝑞 × 𝐷𝑆𝑈𝐸𝑖,𝑡,𝑞 + 𝛽9𝐼𝑁𝑆𝑇𝑖,𝑡,𝑞 ×
𝐷𝑆𝑈𝐸𝑖,𝑡,𝑞 + 𝛽10𝐶𝐺𝑂𝑉_𝑆𝑖,𝑡−1 × 𝐷𝑆𝑈𝐸𝑖,𝑡,𝑞 + 𝛽11𝐴𝐵𝐴𝐶𝐶𝑖,𝑡−1 × 𝐷𝑆𝑈𝐸𝑖,𝑡,𝑞 + 𝜀𝑖,𝑡,𝑞
Where, as before i is the firm index, t (= 1990 1993 … 0010 and q (=1, 2, 3, 4) designate
year and quarter, respectively, the RETURN, DSUE, and CSR variables are as defined in
Equation (8) above, and LGNAF, INST, and CGOV_S are as defined in Equation (9). ABACC,
the abnormal accruals, are measured in two alternative methods: DA_JONES based on the
modified Jones model (Dechow, Sloan, and Sweeney 1995), and DA_DD based on the Dechow
and Dichev (2002) model. We pick an abnormal accruals variable to control for the accruals
anomaly because evidence in prior research (e.g., Xie 2001) demonstrates that the mispricing
of total accruals documented by Sloan (1996) is due largely to abnormal (or discretionary)
15Notice that the sample size reduces somewhat from 97,743 firm-quarter observations in Table 3 to 80,256
observations in Table 5 due to missing data for the control variables.
(10)
(11)

23
accruals.
We derive our first estimate of abnormal accruals, DA_JONES, by running the
following cross sectional regression in each industry-year with a minimum of 20 observations:
𝑇𝐴𝐶𝐶𝑖,𝑡 = 𝛼0 + 𝛼1(∆𝑅𝐸𝑉𝑖,𝑡 − ∆𝐴𝑅𝑖,𝑡) + 𝛼2𝑃𝑃𝐸𝑖,𝑡 + 𝜀𝑖,𝑡 (11)
where TACC is the total accruals calculated as income before extraordinary items minus
operating cash flow; ∆REV and ∆AR are change in sales revenue and change in accounts
receivables, respectively; PPE is the gross book value of property, plant and equipment. All
variables are scaled by the total assets at the beginning of the year. To mitigate the effect of
outlying observations, we winsorize all variables at the top and bottom one percent of their
distributions. The residual from regression (11), DA_JONES, is our first estimate of abnormal
accruals.
We obtain our second estimate of abnormal accruals, DA_DD, by running the following
time-series regression for each firm with minimum of 10 observations:
∆𝑊𝐶𝑖,𝑡 = 𝛼0 + 𝛼1𝑂𝐶𝐹𝑖,𝑡−1 + 𝛼2𝑂𝐶𝐹𝑖,𝑡 + 𝛼3𝑂𝐶𝐹𝑖,𝑡+1 + 𝜀𝑖,𝑡 (12)
Where ∆WC is change in working capital, and OCF is operating cash flows. All variables are
scaled by the total assets at the beginning of the year and are winsorized at the top and bottom
1 percent of their distributions. The residual from regression (12), DA_DD, is our second
estimate of abnormal accruals.
Panel A and Panel B of Table 6 display the results from estimating nested and full
versions of Equation (10). The primary take away from the table is that our results of the
relation between CSR activities and post-earnings announcement drift are robust to
specifications that control for corporate governance, accruals, institutional holdings, and
analyst coverage. Specifically, in both panels DSUE is significantly positive in all
specifications, ranging from 0.19 (t-statistic = 4.20) to 0.22 (t-statistic = 4.52) in Panel A, and
from 0.051 (t-statistic = 4.95) to 0.066 (t-statistic = 6.25) in Panel B. More importantly, our
24
variable of interest, 𝐶𝑆𝑅𝐷𝐸𝐶 × 𝐷𝑆𝑈𝐸, is significantly negative, ranging from -0.20 (t-statistic
= -2.57) to -0.23 (t-statistic = -2.82) in Panel A, and from -0.20 (t-statistic = -2.57) to -0.21
(t-statistic = -2.80) in Panel B. Thus, when CSR activities are relatively low (CSRDEC = 0)
the post-earnings announcement drift is observed, but when CSR activities are high (CSRDEC
= 1) the drift disappears as evidence by insignificant 𝛽1 + 𝛽3 (Panel A), or substantially
declines,𝛽1 + 𝛽3 <𝛽1(Panel B).
[Insert Table 6 about here]
5. Tests and Results: Abnormal Trading Volume
5.1. CSR activities and abnormal trading volume around earnings announcements
5.1.1. Methodology
Along the lines of Hirshleifer, Lim, and Teoh (2009), we test our third hypothesis that
predicts a positive relation between CSR activities and trading volumes around earnings
announcements by estimating the following model:
𝐴𝐵𝑉𝑂𝐿(−1, 1)𝑖,𝑡,𝑞 = 𝛽0 + 𝛽1𝐶𝑆𝑅𝐷𝐸𝐶𝑖,𝑡−1 + 𝛽2𝐷_𝐴𝐵𝑆(𝑆𝑈𝐸_𝐴𝐹)𝑖,𝑡,𝑞 +
𝛽3𝑆𝐼𝑍𝐸𝑖,𝑡−1+𝛽4𝐺𝑅𝑂𝑊𝑇𝐻𝑖,𝑡−1 + 𝛽5𝐿𝐺𝑁𝐴𝐹𝑖,𝑡,𝑞 + 𝛽6𝑅𝐸𝑃𝐿𝐴𝐺𝑖,𝑡,𝑞 + 𝛽7𝑃𝐸𝑅𝑆𝐼𝑆𝑇𝑖,𝑡,𝑞 + 𝛽8𝐼𝑁𝑆𝑇𝑖,𝑡,𝑞 +
𝛽9𝑆𝑇𝑈𝑅𝑁𝑂𝑉𝐸𝑅𝑖,𝑡,𝑞 + 𝜀𝑖,𝑡,𝑞
Where, as before, i is the firm index, t (= 1990 1993 … 0010 and q (=1, 2, 3, 4) designate
year and quarter, respectively,𝐴𝐵𝑉𝑂𝐿(−1, 1) is the average abnormal trading volume over the
three-day period, (-1, 1),relative to the earnings announcement date (day 0). CSRDEC is the
decile rank of CSR scores, scaled between 0 and 1. D_ABS(SUE_AF), our measure of the
earnings surprise, is computed as the deciles based on quarterly independent sort by absolute
forecast errors, then scaled to vary between 0 and 1.We use absolute earnings surprises, not
signed surprises, because both extreme positive and negative surprises are likely to generate
large trading volume. SIZE is the firm’s market capitalization at the end of last fiscal year
GROWTH is the difference between total assets at the end of year t and total assets at the end
of year t-1. LGNAF is the logarithm of (1 + number of analysts who provide earnings forecast
(13)

25
for the company’s current fiscal quarter For firm-quarters that are not covered by the I/B/E/S
database, the number of analysts is set to zero. REPLAG is the logarithm of (1+ number of days
from quarter-end to the earnings announcement date). PERSIST is earnings persistence
measured as follows: using data from the most recent 16 quarters up to quarter q-1 (minimum
4 observations), we regress by firm IBCq on IBCq-4, where IBC is quarterly income before
extraordinary items scaled by total assets. The coefficient on IBCq-4 is assigned as the
persistence measure for each firm in quarter q. To mitigate the effect of outliers, we replace
the value of the coefficient on IBCq-4 by its rank. INST is the percentage of institutional
holdings. STURNOVER is the average monthly share trading volume divided by the average
number of shares outstanding during a one-year period ending at the end of the corresponding
fiscal quarter. In term of Equation (13), our third hypothesis predicts that 𝛽1> 0.
5.1.2. Results
Table 7 reports the results from estimating Equation (13). Column (1) displays the
results for a nested specification that considers only our test variable, CSRDEC, and column
(2) reports the results for the full model.16Two results are noteworthy. First, as predicted,𝛽1,
the coefficient on CSRDEC, is significantly positive in both columns (1) and (2). This implies
that trading volume around earnings announcements is increasing in CSR activities. This is
expected if, as we assert, earnings of CSR firms are more reliable than those of non-CSR firms
(due to less earnings management). Second, seven out the eight control variables are
significant. Importantly, the coefficients on the earnings surprise variable, D_ABS(SUE_AF),is
significantly positive. Since abnormal trading volume reflects changes in expectations of
individual investors (see, e.g., Beaver 1968, p. 69), the positive coefficient suggests the higher
the earnings surprise the more investors adjust their (heterogeneous) expectations and thus
16In column (2) the number of observations declines to 80,237 due to the additional data requirements for the
control variables.

26
trade more. In addition, this positive correlation between earnings surprises and trading volume
is consistent with findings in prior literature, and thus increases confidence in the reliability of
our findings.
[Insert Table 7 about here]
6. Endogeneity Problem: 2SLSAnalysis
An assumption underlying the OLS analyses we have conducted so far is that the level
of a firm’s CSR performance is exogenous However it is possible that managers’ choice of
CSR investment depends on investors’ pricing of a company’s earnings news This possibility
raises concerns because it implies that our test variables (CSRDEC and CSRDUM) are
correlated with the regressions’ error term. In this situation, an OLS regression generally
produces biased and inconsistent estimates. However, if an instrumental variable (IV) is
available, consistent estimates may still be obtained.
An instrumental variable does not itself belong to the explanatory equation, but is
(partially) correlated with the endogenous explanatory variable, CSRDEC and CSRDUM,
conditional on the other covariates, and is uncorrelated with the dependent variable, RETURN
(-1, 1) and RETURN (2, 60), other than through its correlation with CSRDEC and CSRDUM
(as the instrumental variable cannot suffer from the same problem as the original explanatory
variable). Thus, in addition to performing OLS analyses, we use in this section the 2SLS
procedure to test our hypotheses.17,18In identifying our instruments, we consider prior CSR
17 We report the OLS results, in addition to the 2SLS results, because evidence shows that the OLS procedure is
more robust against specification errors than the 2SLS procedure, and that predictions from models estimated by
OLS often compare favorably with those of 2SLS (See, Maddala 1997, p. 231).
18 We test for the presence of an endogeneity problem in each of the three regressions (ERC, PEAD, and abnormal
volume). The results from the Durbin-Wu-Hausman test (not tabulated for parsimony) indicate the presence of
an endogeneity problem only in the PEAD regression; for the ERC and abnormal volume regressions the test fails
to reject the null of exogeneity. We also perform an underidentification test based on the Kleibergen-Paaprk LM
statistic that rejects the null that our models are underidentified. Finally, the Cragg-Donald Wald F-Statistic shows
our instrumental variables pass the weak instrument test.

27
literature. Giuli and Kostovetsky (2014) document that Democratic-leaning firms spend
significantly more on CSR than Republican-leaning firms. We thus choose the state’s political
preference as an instrument for CSR activities because it is associated with CSR investment
but there is no intuitive reason to believe that it would systematically affect investors’ response
to earnings news. Therefore in the 2SLS analysis, we use the political preference of the state
where the firm’s headquarter is located as an instrumental variable. We retrieve the presidential
election data from www.uselectionatlas.org and based on the final presidential voting data we
construct two state-level measures of the degree of Democratic-leaning. One measure is a
dummy variable, DEMDUMMY, equal to one if in the state the number of votes for the
Democratic candidate is greater than that for the Republican candidate (i.e., Democratic-
leaning) and equal to zero otherwise. The other one is a continuous measure, DEMPCT, which
is the percentage of all votes go to the democratic candidate. The higher DEMPCT, the more
Democratic-leaning is the state in the election. Of course, the measures for the instruments are
available every four years. The CSR data are thus matched with the most recent election data.
For example, CSR ratings in year 2000, 2001, 2002, and 2003 are all matched with the data
from the quadrennial presidential election of 2000 that took place on November 7th, 2000.
In the first stage, we run a regression of CSRDEC and include the two instruments,
DEMDUMMY, DEMPCT, and all other control variables involved in the regressions of ERC,
PEAD, and abnormal volume.19 In the second stage, we re-run the regressions of ERC, PEAD,
and abnormal volumes after replacing CSRDEC with the predicted values of CSRDEC
estimated from the first stage. Panels A and B of Table 8 report, respectively, the first and
second stage regression results.
In Panel A, both DEMDUMMY and DEMPCT are positive and significant, consistent with
the finding in prior research that democratic-leaning firms engage in higher level of CSR
19 As expected, the two instruments are correlated with a correlation coefficient of approximately 0.73.
Alternatively, we used one at a time and obtained nearly identical results (not tabulated for parsimony).

28
activities. This finding corroborates the results from the weak instrument test reported above,
and thus increases confidence that the instruments are valid. In the second stage, we rerun
Equations (9), (10), and (13), after replacing the CSR measure CSRDEC with its predicted
values from the first stage. The results reported in Panel B of Table 8 reveal that our findings
are robust to the 2SLS analysis. In particular, we find, as before, that when the firm has high
CSR activities the market returns around earnings announcement are more sensitive to the
firm’s unexpected earnings; the abnormal trading volume during the earnings announcement
window is larger; and the post earnings announcement drift for these firms is smaller.
[Insert Table 8 about here]
7. Conclusion
The traditional view on CSR activities emphasizes the trade-off between the short-term
cost borne by the firm and the long-term benefit to the society. Under this view, when
companies undertake CSR activities they may have to forgo profitable projects or invest in
unprofitable projects. In other words, corporate social responsibility involves a compromise on
the business objective of profit maximization. A recent view, strategic CSR, integrates
business objective and social responsibility by arguing that corporate success and social
welfare are synergetic. Under this view, business success and CSR activities are goal
congruent, not trade-offs.
By studying three questions that delve into the association between the market pricing
of earnings and the firm’s CSR activities, we complement prior research that has investigated
benefits associated with CSR performance from management perspective, and shed more light
on the validity of the two opposing views in the CSR literature. Our motivation follows from
the CSR literature’s assertion that the higher the CSR performance the higher is the company’s
adherence to the spirit of the law and ethical standards and the finding in the accounting
literature that CSR activities are negatively related to earnings management. Using three-day

29
abnormal returns surrounding earnings announcements, we find higher stock return sensitivity
to earnings surprises for firms with high CSR activities relative to firms with low CSR activities
(first research question), and that this finding is distinct from the corporate governance effect
in the market response to earnings news documented by prior research.
Our long return window analysis demonstrates that the positive association between the
60-day post-earnings announcement abnormal returns and the earnings surprises documented
by prior research is less pronounced for firms with high CSR activities relative to firms with
low CSR activities (second research question). In other words, the post-earnings
announcement drift decreases in CSR activities.
These findings are robust to various measures of earnings surprises, CSR performance,
and abnormal returns, and also hold for a battery of validity checks that considers, among other
things, a potential endogeneity problem, a time period effect, an alternative explanation that a
corporate governance effect confounds our findings, and a variety of control variables. In
addition, trading volume analysis around earnings announcements reveals a positive
association between CSR activities and abnormal trading volume (third research question).
This evidence further supports our assertion that earnings announcements of CSR firms convey
more information to investors.
Overall, our findings contribute to the literature by casting light on the relation between
CSR activities and investor behavior around earnings announcements. They complement the
findings in prior research that has focused on managerial reporting perspective, financial
analyst perspective, and corporate governance effect in the market response to earnings news.

30
Reference
Ball R and E Bartov 1996 How naive is the stock market’s use of earnings information?
Journal of Accounting and Economics 21, 319-337.
Ball, R., Brown, P., 1968. An empirical evaluation of accounting income numbers. Journal of
Accounting Research 6, 159-178.
Ball, R., A. Robin, and J.S. Wu.2003. Incentives versus standards: properties of accounting
income in four East Asian countries. Journal of Accounting and Economics 36, 235-270.
Balsam, S., E. Bartov, and C. Marquardt. 2002. Accruals management, investor sophistication,
and equity valuation: Evidence from 10-Q filing. Journal of Accounting Research40, 987
– 1012
Bamber, L. S. 1986. The information contents of annual earnings releases: A trading volume
approach. Journal of Accounting Research 24, 40-56.
Bamber, L. S., and Y. S. Cheon. 1995. Differential price and volume reactions to accounting
earnings announcements. The Accounting Review 70, 417-441.
Bartov, E., and P. Mohanram. 2014. Does income statement placement matter to investors?
The case of gains/losses from early debt extinguishment ” Forthcoming in The Accounting
Review 54.
Beaver, W. 1968. The information content of annual earnings announcements. Journal of
Accounting Research 6, 67-92.
Beaver, W., M. McNichols, and R. Price. 2007. Delisting returns and their effect on
accounting-based market anomalies. Journal of Accounting and Economics 43, 341-368.
Bebchuk, L.A., A. Cohen, and C.C.Y. Wang. 2013. Learning and the disappearing association
between governance and returns. Journal of Financial Economics108, 323–348.
Bernard, V.L., and J. K. Thomas. 1990. Evidence that stock prices do not fully reflect the
implications of current earnings for future earnings. Journal of Accounting and
Economics 13, 305-340.
Carroll, A. 1979.A three-dimensional conceptual model of corporate performance. The
Academy of Management Review 4(4): 497–505.
Chatterji, A. K., D. I. Levine, and M. W. Toffel. 2009. How well do social ratings actually
measure corporate social responsibility? Journal of Economics & Management Strategy
18(1), 125–169.
Chih, H., C. Shen, and F. Kang.2008. Corporate social responsibility, investor protection, and
earnings management: Some international evidence. Journal of Business Ethics79 (1/2),
179–198.
31
Collins, D.W. and S.P. Kothari. 1989. An analysis of intertemporal and cross-sectional
determinants of earnings response coefficients. Journal of Accounting and Economics 11,
143-181.
Dechow, P. M., and I. D. Dichev. 2002. The quality of accruals and earnings: the role of accrual
estimation errors. The Accounting Review 77 (Supplement), 35-59.
Dechow, P. M., R. Sloan, and A. Sweeney. 1995. Detecting earnings management. The
Accounting Review 70, 193-225.
DellaVigna, S., and J.M. Pollet. 2009. Investor inattention and Friday earnings announcements.
The Journal of Finance 64(2), 709-749.
Dhaliwal, D. S., O. Z. Li, A. Tsang, and Y. G. Yang. 2011. Voluntary nonfinancial disclosure
and the cost of equity capital: The initiation of corporate social responsibility reporting.
The Accounting Review 86(1), 59 – 100.
Dhaliwal, D. S., S. Radhakrishnan, A. Tsang, and Y. G. Yang. 2012. Nonfinancial Disclosure
and Analyst Forecast Accuracy: International Evidence on Corporate Social
Responsibility Disclosure. The Accounting Review 87(3), 723 – 759.
Dietrich, J.R. 1984. Effects of early bond refundings: An empirical investigation of security
returns. Journal of Accounting and Economics 6(1), 67–96.
El Ghoul, S., O. Guedhami, C. Y. Kwok, and D. R. Mishra. 2011. Does corporate social
responsibility affect cost of capital? Journal of Banking & Finance 35(9), 2388-2406.
Fama, E. F., K. R. French. 1995. Size and book-to-market factors in earnings and returns. The
Journal of Finance 50(1), 131- 155.
Friedman, M., 1970. The social responsibility of business is to increase its profits. The New
York Times, September 13, 32–33, 122–26.
Gao, F., L.L, Lisic, and I. Zhang. 2014. Commitment to social good and insider trading.
Forthcoming in Journal of Accounting and Economics.
Giuli, A. D., and L. Kostovetsky. 2014. Are red or blue companies more likely to go green?
Politics and corporate social responsibility. Journal of Financial Economics 111(1), 158–
180.
Gompers, P., J. Ishii, and A. Metrick. 2003. Corporate governance and equity prices. The
Quarterly Journal of Economics118, 107-155
Grundy, B. D. and M. McNichols. 1989. Trade and the revelation of information through prices
and direct disclosures. Review of Financial Studies 2(4), 495-526.
Hand, J. 1990.A test of the extended functional fixation hypothesis. The Accounting Review
65(4), 740-763.
32
Hirshleifer, D., S. Lim, and S. H. Teoh. 2009. Driven to distraction: Extraneous events and
underreaction to earnings news. Journal of Finance 63(5), 2287-2323.
Holthausen, R. W. and R. E. Verrecchia. 1990. The effect of informedness and consensus on
price and volume behavior. The Accounting Review 65(1), 191-208.
Jensen, M., and W. Meckling.1976. Theory of the firm: Managerial behavior, agency cost and
capital structure. Journal of Financial Economics 3(4), 305–360.
Kim, Y., M. S. Park, and B. Wier. 2012. Is earnings quality associated with corporate social
responsibility? The Accounting Review 87(3), 761 – 796.
Kim, O. and R. E. Verrecchia. 1991. Trading volume and price reactions to public
announcements. Journal of Accounting Research 29(2), 302-321.
Liu, J., Thomas, J., 2000. Stock returns and accounting earnings. Journal of Accounting
Research 38, 71-101.
Louis, H., Sun, A.X. 2011. Earnings management and the post-earnings announcement drift.
Financial Management 40(3), 591–621.
Lundholm, R., and L. A. Myers. 2002. Bring the future forward: The effect of disclosure on
the returns-earnings relation. Journal of Accounting Research 40(3), 809-839.
Maddala, G.S. 1977. Econometrics. New York: McGraw-Hill.
McWilliams, A., D. Siegel and P Wright 0006 Guest editors’ introduction corporate social
responsibility: Strategic implications. Journal of Management Studies 43(1), 1–18.
Morse, D. 1981. Price and trading volume reaction surrounding earnings announcements: A
closer examination. Journal of Accounting Research 19 (Autumn), 374-383.
Petrovits, C. 2006. Corporate-sponsored foundations and earnings management. Journal of
Accounting and Economics 41(3), 335–361.
Pfleiderer, P. 1984. The volume of trade and the variability of prices: A framework for analysis
in noisy rational expectations equilibria. Working Paper, Stanford University.
Porter, M., and M. Kramer. 2006. Strategy and society: The link between competitive
advantage and corporate social responsibility. Harvard Business Review 84(12), 78-92.
Porter, M., and M. Kramer. 2011. Creating shared value: How to reinvent capitalism and
unleash a wave of innovation and growth. Harvard Business Review 89(1/2), 62-77.
Prior, D., J. Surroca, and J. Tribo. 2008. Are socially responsible managers really ethical?
Exploring the relationship between earnings management and corporate social
responsibility. Corporate Governance 16(3), 160–177.
Shores, D., 1990. The association between interim information and securities return
surrounding earnings announcements. Journal of Accounting Research 28(1), 164-181.

33
Shumway, T. 1997. The delisting bias in CRSP data. The Journal of Finance 52(1), 327-340.
Sloan, R.G. 1996. Do stock prices fully reflect information in accruals and cash flows about
future earnings? The Accounting Review 71(3), 289-315.
Teoh, S.H., Welch, I, and T.J. Wong. 1998. Earnings management and the underperformance
of seasoned equity offerings. Journal of Financial Economics 50, 63-99.
Trebucq S and R Russ 000) The Case of earnings and stakeholder management: Towards
an integrated theory of managerial behavior Working paper Universite Montesquieu
Bordeaux I.
Xie, H. 2001. The mispricing of abnormal accruals. The Accounting Review 76(3), 357-373.

34
Table 1. Sample Selection
Number of
firm-
quarters
Number of
distinct
firms
All firm-quarter observations in KLD database 141,200 5,576
Less:
Observations not covered by Compustat quarterly file (13,357) (642)
Observations without sufficient data to compute SUE (953) (9)
Observations with quarter-end stock price of less than $1 (1,081) (10)
Observations not covered by CRSP daily return file (13,947) (182)
Observations without sufficient data
to compute abnormal returns (321) (4)
Final sample for long-window tests 111,541 4,729
Less:
Observations without I/B/E/S analyst earnings forecasts (13,798) (192)
Final sample for short-window tests 97,743 4,537

35
Table 2. Summary Statistics
Panels A and B compare the descriptive statistics and the industry distribution, respectively, of our final sample
for the long-window tests with the Compustat universe over the sample period. Panel C reports, by CSR decile,
the percentage of firms that move up down or stay in the same CSR decile We compare a firm’s CSR
classification in two consecutive years. If the firm is classified in a higher (lower) CSR decile in the next year, it
is categorized as Up (Down). If the firm stays in the same CSR decile in next year, it is categorized as No Change.
Industries are defined according to Fama-French 12 industry classification. CAR(-1, 1) and BHAR(-1, 1), are,
respectively, three-day cumulative abnormal returns and buy-and-hold abnormal returns around the earnings
announcement date (day 0). CAR(2, 60) and BHAR(2, 60), are, respectively, the cumulative abnormal returns and
buy-and-hold abnormal returns from two days after the earnings announcement date to 60 trading days afterwards.
𝐴𝐵𝑉𝑂𝐿(−1, 1) is the average abnormal trading volume over days (-1, 1) around the earnings announcement date
(date 0). CSR_S is the raw CSR scores based on KLD ratings. SUE (SUE_AF) is unexpected earnings defined as
earnings per share before extraordinary items minus earnings per share in the same quarter of the prior year (the
median analyst forecasted earnings within 60 days prior to the earnings announcement date). IBC is quarterly
income before extraordinary items. LOSS is equal to one if the quarterly income before extraordinary items in
current fiscal year is negative, and zero otherwise. SALE is net sales. TA is total assets. SIZE is market
capitalization measured as fiscal quarter end stock price times shares outstanding. IB, SALE, TA, and SIZE are
measured in million dollars. LEV is leverage measured by the ratio of total debts to total assets. ROA is return to
assets measured as the ratio of income before extraordinary items to total assets. SUE is earnings per share before
extraordinary items minus earnings per share in the same quarter of the prior year, standardized by stock price.
BETA is CAPM beta measured based on daily returns over last year. INST is the percentage of institutional
holdings. T-statistics for differences in mean are calculated using the Satterthwaite method. Z-statistics for
differences in medians are from Wilcoxon sign-rank tests. Significance levels for the differences are indicated by
*** (1%), ** (5%) or * (10%).
Panel A. Sample descriptive statistics in comparison to the Compustat universe
Mean Median
Variable Our
Sample
Compustat
universe Diff. t-stat.
Our
Sample
Compustat
universe Diff. z-stat.
CAR(-1, 1) 0.002 0.001 0.001 4.94*** 0.001 -0.0003 0.002 7.55***
BHR(-1, 1) 0.002 0.000 0.002 7.11*** 0.001 -0.001 0.002 10.03***
CAR(2, 60) 0.002 -0.003 0.005 8.48*** 0.001 -0.008 0.009 15.62***
BHR(2, 60) -0.007 -0.025 0.018 32.03*** -0.010 -0.030 0.020 40.13***
ABVOL(-1, 1) 0.532 0.537 -0.005 1.63 0.484 0.481 0.003 2.05**
CSR_S -0.133 - 0.000 -
SUE 0.0001 0.001 -0.001 -6.40*** 0.000 0.001 -0.001 -8.20***
SUE_AF 0.0002 -0.0002 0.0005 15.01*** 0.0004 0.0004 0.000 10.68***
IBC 54.40 20.93 33.46 86.82*** 13.41 1.39 12.02 175.26***
LOSS 0.19 0.32 -0.13 -92.34*** - - - -
SALE 851 363 488 101.15*** 253 43 210 237.65***
TA 6,240 2,733 3,507 85.83*** 1,681 299 1,382 240.08***
SIZE 3,969 1,669 2,300 102.20*** 1,282 212 1,069 260.89***
LEV (%) 22.40% 22.60% -0.20% -2.97*** 19.70% 17.30% 2.50% 16.65***
ROA (%) 0.50% -1.00% 1.60% 101.86*** 0.90% 0.50% 0.40% 78.82***
BETA 1.16 0.83 0.34 192.03*** 1.12 0.76 0.36 180.90***
INST 65.90% 41.10% 24.80% 292.48*** 69.00% 37.60% 31.50% 239.06***

36
Table 0 Summary Statistics (cont’d
Panel B. Sample distribution by industry
Fama-French 12 Industry Classification Our final sample Compustat
# of Obs.
% of
sample
# of
Obs.
% of
sample
Consumer Non-durables 6,305 5.65 9,366 5.25
Consumer Durables 3,023 2.71 4,277 2.40
Manufacturing 12,363 11.08 17,493 9.81
Oil, Gas, and Coal Extraction and Products 4,532 4.06 8,212 4.61
Chemicals and Allied Products 3,221 2.89 3,860 2.17
Computers, Software, and Electronic
equipment 17,320 15.53 32,915 18.46
Telephone and Television Transmission 2,827 2.53 6,711 3.76
Utilities 4,834 4.33 5,661 3.18
Wholesale, Retail, and some Services 11,428 10.25 16,753 9.40
Healthcare, Medical Equipment, and Drugs 9,637 8.64 17,718 9.94
Finance 21,883 19.62 27,795 15.59
Other 14,169 12.7 27,506 15.43
Panel C. Year-over-year variation in CSR deciles
change CSR Deciles (from Lowest in 1 to Highest in 10)
1 2 3 4 5 6 7 8 9 10
Down 0.0% 12.0% 17.0% 16.3% 29.5% 27.9% 25.8% 20.2% 30.1% 24.2%
No
Change 74.1% 53.8% 50.5% 63.8% 33.6% 29.5% 56.2% 41.4% 54.6% 75.8%
Up 25.9% 34.2% 32.5% 19.9% 36.9% 42.6% 18.0% 38.4% 15.3% 0.0%
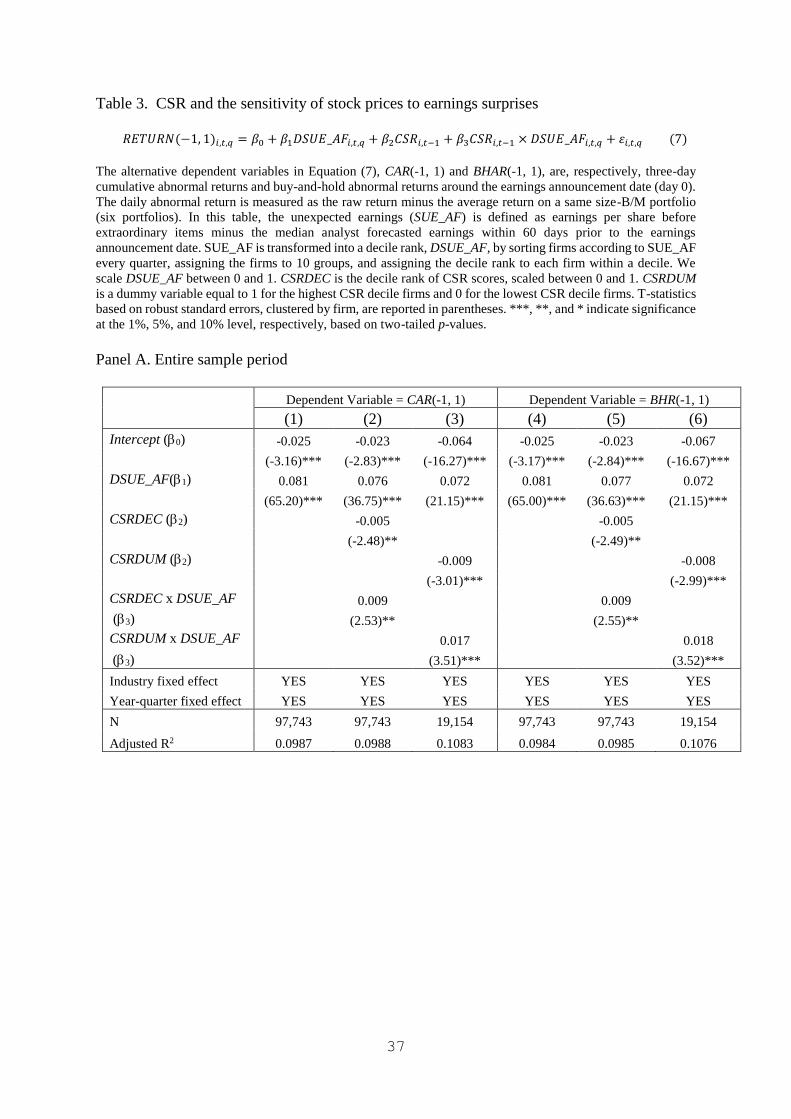
37
Table 3. CSR and the sensitivity of stock prices to earnings surprises
𝑅𝐸𝑇𝑈𝑅𝑁(−1, 1)𝑖,𝑡,𝑞 = 𝛽0 + 𝛽1𝐷𝑆𝑈𝐸_𝐴𝐹𝑖,𝑡,𝑞 + 𝛽2𝐶𝑆𝑅𝑖,𝑡−1 + 𝛽3𝐶𝑆𝑅𝑖,𝑡−1 × 𝐷𝑆𝑈𝐸_𝐴𝐹𝑖,𝑡,𝑞 + 𝜀𝑖,𝑡,𝑞 (7)
The alternative dependent variables in Equation (7), CAR(-1, 1) and BHAR(-1, 1), are, respectively, three-day
cumulative abnormal returns and buy-and-hold abnormal returns around the earnings announcement date (day 0).
The daily abnormal return is measured as the raw return minus the average return on a same size-B/M portfolio
(six portfolios). In this table, the unexpected earnings (SUE_AF) is defined as earnings per share before
extraordinary items minus the median analyst forecasted earnings within 60 days prior to the earnings
announcement date. SUE_AF is transformed into a decile rank, DSUE_AF, by sorting firms according to SUE_AF
every quarter, assigning the firms to 10 groups, and assigning the decile rank to each firm within a decile. We
scale DSUE_AF between 0 and 1. CSRDEC is the decile rank of CSR scores, scaled between 0 and 1. CSRDUM
is a dummy variable equal to 1 for the highest CSR decile firms and 0 for the lowest CSR decile firms. T-statistics
based on robust standard errors, clustered by firm, are reported in parentheses. ***, **, and * indicate significance
at the 1%, 5%, and 10% level, respectively, based on two-tailed p-values.
Panel A. Entire sample period
Dependent Variable = CAR(-1, 1) Dependent Variable = BHR(-1, 1)
(1) (2) (3) (4) (5) (6)
Intercept (0) -0.025 -0.023 -0.064 -0.025 -0.023 -0.067
(-3.16)*** (-2.83)*** (-16.27)*** (-3.17)*** (-2.84)*** (-16.67)***
DSUE_AF(1) 0.081 0.076 0.072 0.081 0.077 0.072
(65.20)*** (36.75)*** (21.15)*** (65.00)*** (36.63)*** (21.15)***
CSRDEC (2) -0.005 -0.005
(-2.48)** (-2.49)**
CSRDUM (2) -0.009 -0.008
(-3.01)*** (-2.99)***
CSRDEC x DSUE_AF 0.009 0.009
(3) (2.53)** (2.55)**
CSRDUM x DSUE_AF 0.017 0.018
(3) (3.51)*** (3.52)***
Industry fixed effect YES YES YES YES YES YES
Year-quarter fixed effect YES YES YES YES YES YES
N 97,743 97,743 19,154 97,743 97,743 19,154
Adjusted R2 0.0987 0.0988 0.1083 0.0984 0.0985 0.1076

38
Table 3. CSR and the sensitivity of stock prices to earnings surprises (Cont’d
Panel B. By sub-periods
Subsample (1992-2001) Subsample (2002-2012)
(1) (2) (3) (4)
Intercept (0) -0.005 -0.030 -0.046 -0.051
(-0.56) (-4.96)*** (-19.06)*** (-11.36)***
DSUE_AF(1) 0.033 0.029 0.086 0.084
(10.65)*** (7.88)*** (38.26)*** (21.53)***
CSRDEC (2) -0.008 -0.004
(-2.50)** (-1.79)*
CSRDUM (2) -0.007 -0.007
(-1.62) (-2.21)**
CSRDEC x DSUE_AF(3) 0.022 0.006
(3.91)*** (1.44)
CSRDUM x DSUE_AF(3) 0.027 0.012
(3.59)*** (2.20)**
Industry fixed effect YES YES YES YES
Year-quarter fixed effect YES YES YES YES
N 17,766 3,428 79,977 15,726
Adjusted R2 0.0593 0.0639 0.1084 0.1214

39
Table 4. CSR and post-earnings announcement drift
𝑅𝐸𝑇𝑈𝑅𝑁(2, 60)𝑖,𝑡,𝑞 = 𝛽0 + 𝛽1𝐷𝑆𝑈𝐸𝑖,𝑡,𝑞 + 𝛽2𝐶𝑆𝑅𝑖,𝑡−1 + 𝛽3𝐶𝑆𝑅𝑖,𝑡−1 × 𝐷𝑆𝑈𝐸𝑖,𝑡,𝑞 + 𝜀𝑖,𝑞(8)
The two alternative dependent variables in model (8), CAR(2, 60) and BHAR(2, 60), are, respectively, the
cumulative abnormal returns and buy-and-hold abnormal returns from two days after the earnings announcement
date to 60 trading days afterwards. The daily abnormal return is measured as the raw return minus the average
return on a same size-B/M portfolio (six portfolios). The unexpected earnings (SUE) is defined as earnings per
share before extraordinary items minus earnings per share in the same quarter of the prior year. SUE is transformed
into a decile rank, DSUE, by sorting firms according to SUE every quarter, assigning the firms to 10 groups, and
assigning the decile rank to each firm within a decile. We scale DSUE between 0 and 1. CSRDUM is a dummy
variable equal to 1 for the highest CSR decile firms and 0 for the lowest CSR decile firms. T-statistics based on
robust standard errors, clustered by firm, are reported in parentheses. ***, **, and * indicate significance at the
1%, 5%, and 10% level, respectively, based on two-tailed p-values. F-test is used to test whether 1 + 3 = 0.
DV = CAR(2, 60) DV = BHR(2, 60)
(1) (2) (3) (4) (5) (6)
Intercept (0) 0.037 0.034 0.394 0.026 0.024 0.265
(1.49) (1.37) (53.63)*** (0.97) (0.89) (35.60)***
DSUE (1) 0.013 0.022 0.016 0.016 0.023 0.019
(6.42)*** (5.75)*** (2.44)** (6.88)*** (5.64)*** (2.82)***
CSRDEC (2) 0.006 0.005
(1.76)* (1.28)
CSRDUM (2) 0.006 0.005
(1.07) (0.83)
CSRDEC x DSUE (3) -0.018 -0.015
(-2.79)*** (-2.22)**
CSRDUM x DSUE (3) -0.019 -0.017
(-1.97)** (-1.68)*
Industry fixed effect YES YES YES YES YES YES
Quarter fixed effect YES YES YES YES YES YES
N 111,541 111,541 20,711 111,541 111,541 20,711
Adjusted R2 0.0087 0.0088 0.0069 0.0093 0.0094 0.0065
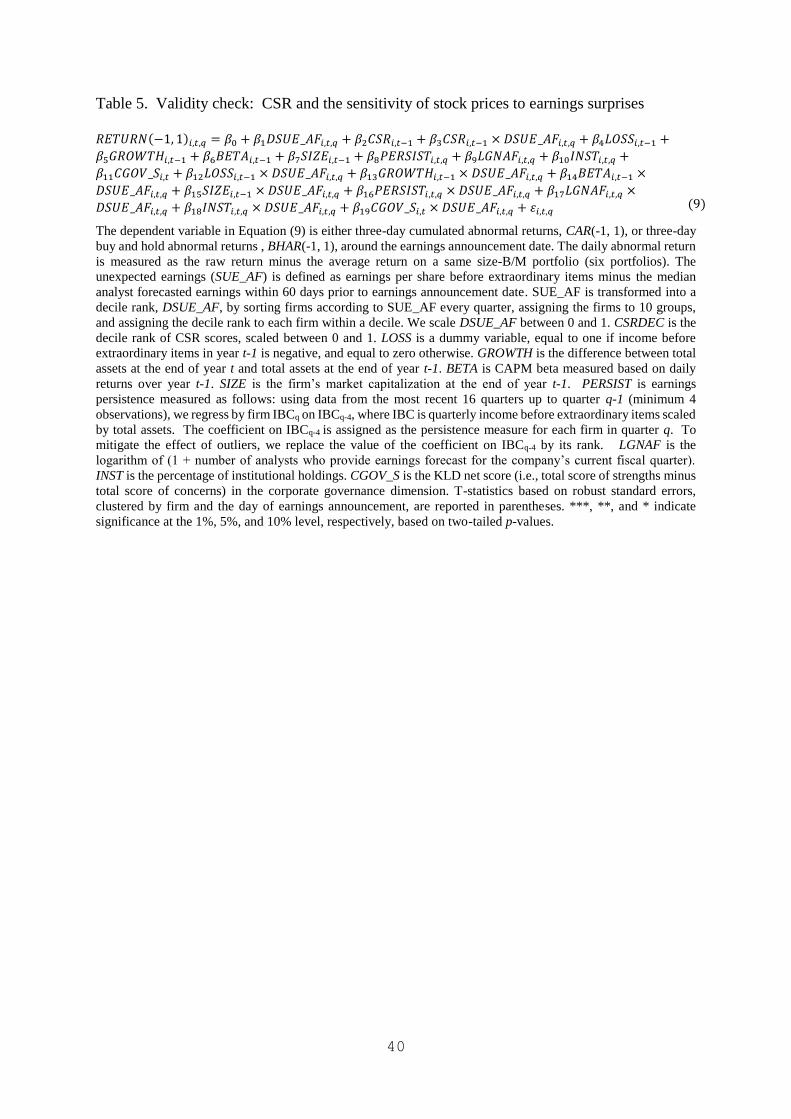
40
Table 5. Validity check: CSR and the sensitivity of stock prices to earnings surprises
𝑅𝐸𝑇𝑈𝑅𝑁(−1, 1)𝑖,𝑡,𝑞 = 𝛽0 + 𝛽1𝐷𝑆𝑈𝐸_𝐴𝐹𝑖,𝑡,𝑞 + 𝛽2𝐶𝑆𝑅𝑖,𝑡−1 + 𝛽3𝐶𝑆𝑅𝑖,𝑡−1 × 𝐷𝑆𝑈𝐸_𝐴𝐹𝑖,𝑡,𝑞 + 𝛽4𝐿𝑂𝑆𝑆𝑖,𝑡−1 +
𝛽5𝐺𝑅𝑂𝑊𝑇𝐻𝑖,𝑡−1 + 𝛽6𝐵𝐸𝑇𝐴𝑖,𝑡−1 + 𝛽7𝑆𝐼𝑍𝐸𝑖,𝑡−1 + 𝛽8𝑃𝐸𝑅𝑆𝐼𝑆𝑇𝑖,𝑡,𝑞 + 𝛽9𝐿𝐺𝑁𝐴𝐹𝑖,𝑡,𝑞 + 𝛽10𝐼𝑁𝑆𝑇𝑖,𝑡,𝑞 +
𝛽11𝐶𝐺𝑂𝑉_𝑆𝑖,𝑡 + 𝛽12𝐿𝑂𝑆𝑆𝑖,𝑡−1 × 𝐷𝑆𝑈𝐸_𝐴𝐹𝑖,𝑡,𝑞 + 𝛽13𝐺𝑅𝑂𝑊𝑇𝐻𝑖,𝑡−1 × 𝐷𝑆𝑈𝐸_𝐴𝐹𝑖,𝑡,𝑞 + 𝛽14𝐵𝐸𝑇𝐴𝑖,𝑡−1 ×
𝐷𝑆𝑈𝐸_𝐴𝐹𝑖,𝑡,𝑞 + 𝛽15𝑆𝐼𝑍𝐸𝑖,𝑡−1 × 𝐷𝑆𝑈𝐸_𝐴𝐹𝑖,𝑡,𝑞 + 𝛽16𝑃𝐸𝑅𝑆𝐼𝑆𝑇𝑖,𝑡,𝑞 × 𝐷𝑆𝑈𝐸_𝐴𝐹𝑖,𝑡,𝑞 + 𝛽17𝐿𝐺𝑁𝐴𝐹𝑖,𝑡,𝑞 ×
𝐷𝑆𝑈𝐸_𝐴𝐹𝑖,𝑡,𝑞 + 𝛽18𝐼𝑁𝑆𝑇𝑖,𝑡,𝑞 × 𝐷𝑆𝑈𝐸_𝐴𝐹𝑖,𝑡,𝑞 + 𝛽19𝐶𝐺𝑂𝑉_𝑆𝑖,𝑡 × 𝐷𝑆𝑈𝐸_𝐴𝐹𝑖,𝑡,𝑞 + 𝜀𝑖,𝑡,𝑞
The dependent variable in Equation (9) is either three-day cumulated abnormal returns, CAR(-1, 1), or three-day
buy and hold abnormal returns , BHAR(-1, 1), around the earnings announcement date. The daily abnormal return
is measured as the raw return minus the average return on a same size-B/M portfolio (six portfolios). The
unexpected earnings (SUE_AF) is defined as earnings per share before extraordinary items minus the median
analyst forecasted earnings within 60 days prior to earnings announcement date. SUE_AF is transformed into a
decile rank, DSUE_AF, by sorting firms according to SUE_AF every quarter, assigning the firms to 10 groups,
and assigning the decile rank to each firm within a decile. We scale DSUE_AF between 0 and 1. CSRDEC is the
decile rank of CSR scores, scaled between 0 and 1. LOSS is a dummy variable, equal to one if income before
extraordinary items in year t-1 is negative, and equal to zero otherwise. GROWTH is the difference between total
assets at the end of year t and total assets at the end of year t-1. BETA is CAPM beta measured based on daily
returns over year t-1. SIZE is the firm’s market capitalization at the end of year t-1. PERSIST is earnings
persistence measured as follows: using data from the most recent 16 quarters up to quarter q-1 (minimum 4
observations), we regress by firm IBCq on IBCq-4, where IBC is quarterly income before extraordinary items scaled
by total assets. The coefficient on IBCq-4 is assigned as the persistence measure for each firm in quarter q. To
mitigate the effect of outliers, we replace the value of the coefficient on IBCq-4 by its rank. LGNAF is the
logarithm of (1 + number of analysts who provide earnings forecast for the company’s current fiscal quarter
INST is the percentage of institutional holdings. CGOV_S is the KLD net score (i.e., total score of strengths minus
total score of concerns) in the corporate governance dimension. T-statistics based on robust standard errors,
clustered by firm and the day of earnings announcement, are reported in parentheses. ***, **, and * indicate
significance at the 1%, 5%, and 10% level, respectively, based on two-tailed p-values.
(9)
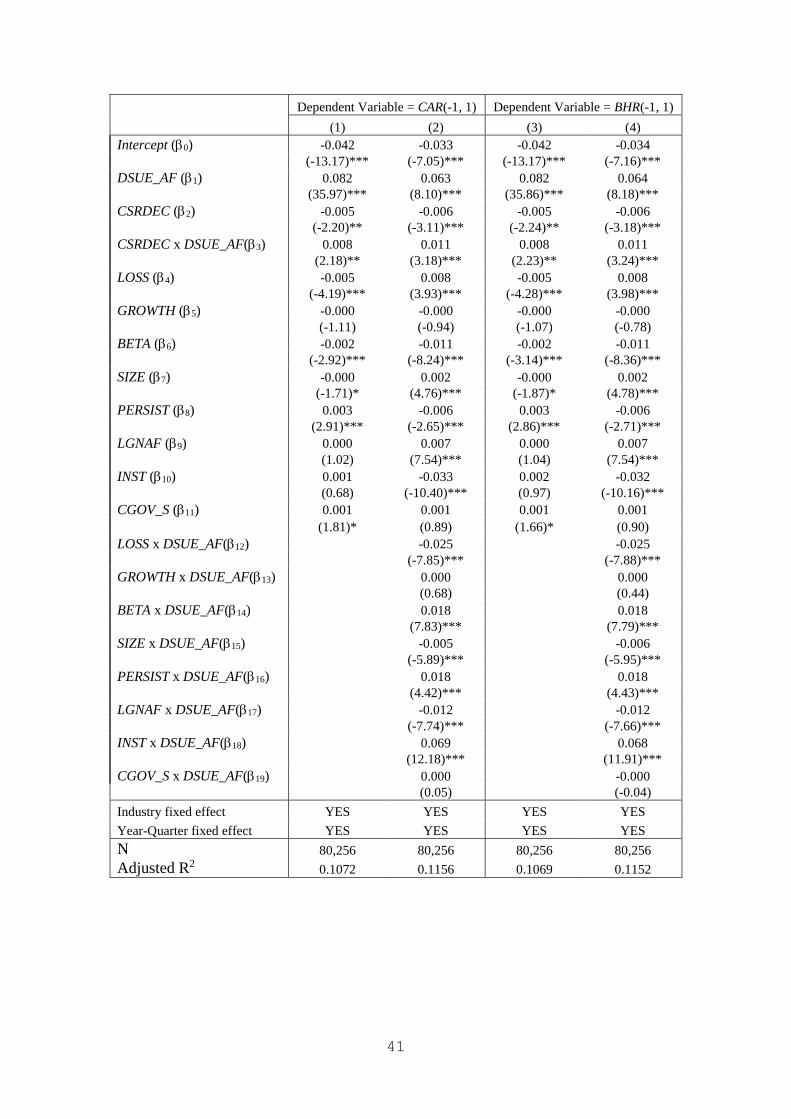
41
Dependent Variable = CAR(-1, 1) Dependent Variable = BHR(-1, 1)
(1) (2) (3) (4)
Intercept (0) -0.042 -0.033 -0.042 -0.034
(-13.17)*** (-7.05)*** (-13.17)*** (-7.16)***
DSUE_AF (1) 0.082 0.063 0.082 0.064
(35.97)*** (8.10)*** (35.86)*** (8.18)***
CSRDEC (2) -0.005 -0.006 -0.005 -0.006
(-2.20)** (-3.11)*** (-2.24)** (-3.18)***
CSRDEC x DSUE_AF(3) 0.008 0.011 0.008 0.011
(2.18)** (3.18)*** (2.23)** (3.24)***
LOSS (4) -0.005 0.008 -0.005 0.008
(-4.19)*** (3.93)*** (-4.28)*** (3.98)***
GROWTH (5) -0.000 -0.000 -0.000 -0.000
(-1.11) (-0.94) (-1.07) (-0.78)
BETA (6) -0.002 -0.011 -0.002 -0.011
(-2.92)*** (-8.24)*** (-3.14)*** (-8.36)***
SIZE (7) -0.000 0.002 -0.000 0.002
(-1.71)* (4.76)*** (-1.87)* (4.78)***
PERSIST (8) 0.003 -0.006 0.003 -0.006
(2.91)*** (-2.65)*** (2.86)*** (-2.71)***
LGNAF (9) 0.000 0.007 0.000 0.007
(1.02) (7.54)*** (1.04) (7.54)***
INST (10) 0.001 -0.033 0.002 -0.032
(0.68) (-10.40)*** (0.97) (-10.16)***
CGOV_S (11) 0.001 0.001 0.001 0.001
(1.81)* (0.89) (1.66)* (0.90)
LOSS x DSUE_AF(12) -0.025 -0.025
(-7.85)*** (-7.88)***
GROWTH x DSUE_AF(13) 0.000 0.000
(0.68) (0.44)
BETA x DSUE_AF(14) 0.018 0.018
(7.83)*** (7.79)***
SIZE x DSUE_AF(15) -0.005 -0.006
(-5.89)*** (-5.95)***
PERSIST x DSUE_AF(16) 0.018 0.018
(4.42)*** (4.43)***
LGNAF x DSUE_AF(17) -0.012 -0.012
(-7.74)*** (-7.66)***
INST x DSUE_AF(18) 0.069 0.068
(12.18)*** (11.91)***
CGOV_S x DSUE_AF(19) 0.000 -0.000
(0.05) (-0.04)
Industry fixed effect YES YES YES YES
Year-Quarter fixed effect YES YES YES YES
N 80,256 80,256 80,256 80,256
Adjusted R2 0.1072 0.1156 0.1069 0.1152

42
Table 6. Validity check: CSR and post-earnings announcement drift
𝑅𝐸𝑇𝑈𝑅𝑁(2, 60)𝑖,𝑡,𝑞 = 𝛽0 + 𝛽1𝐷𝑆𝑈𝐸𝑖,𝑡,𝑞 + 𝛽2𝐶𝑆𝑅𝑖,𝑡−1 + 𝛽3𝐶𝑆𝑅𝑖,𝑡−1 × 𝐷𝑆𝑈𝐸𝑖,𝑡,𝑞 + 𝛽4𝐿𝐺𝑁𝐴𝐹𝑖,𝑡,𝑞 +
𝛽5𝐼𝑁𝑆𝑇𝑖,𝑡,𝑞 + 𝛽6𝐶𝐺𝑂𝑉_𝑆𝑖,𝑡−1 + 𝛽7𝐴𝐵𝐴𝐶𝐶𝑖,𝑡−1 + 𝛽8𝐿𝐺𝑁𝐴𝐹𝑖,𝑡,𝑞 × 𝐷𝑆𝑈𝐸𝑖,𝑡,𝑞 + 𝛽9𝐼𝑁𝑆𝑇𝑖,𝑡,𝑞 × 𝐷𝑆𝑈𝐸𝑖,𝑡,𝑞 +
𝛽10𝐶𝐺𝑂𝑉_𝑆𝑖,𝑡−1 × 𝐷𝑆𝑈𝐸𝑖,𝑡,𝑞 + 𝛽11𝐴𝐵𝐴𝐶𝐶𝑖,𝑡−1 × 𝐷𝑆𝑈𝐸𝑖,𝑡,𝑞 + 𝜀𝑖,𝑡,𝑞
The dependent variable in Equation (10) is either cumulated abnormal returns, CAR(2, 60), or buy and hold
abnormal returns, BHAR(2, 60) accumulated from 2 days after the earnings announcement date up to 60 trading
days afterwards. The daily abnormal return is measured as the raw return minus the average return on a same size-
B/M portfolio (six portfolios). The unexpected earnings (SUE) is defined as earnings per share before
extraordinary items minus earnings per share in the same quarter of the prior year. SUE is transformed into a
decile rank, DSUE, by sorting firms according to SUE every quarter, assigning the firms to 10 groups, and
assigning the decile rank to each firm within a decile. We scale DSUE between 0 and 1. LGNAF is the logarithm
of (1 + number of analysts who provide earnings forecast for the company’s current fiscal quarter For firm-
quarters that are not covered by the I/B/E/S database, the number of analysts is set to zero. INST is the percentage
of institutional holdings. CGOV_S is the KLD net score (i.e., total score of strengths minus total score of concerns)
in the corporate governance dimension. The abnormal accruals, ABACC, are measured by two alternative
methods: DA_JONES based on the modified Jones model; DA_DD based on the Dechow and Dichev (2002)
model. T-statistics based on robust standard errors, clustered by firm, are reported in parentheses. ***, **, and *
indicate significance at the 1%, 5%, and 10% level, respectively, based on two-tailed p-values.
Panel A. Regressions with the main effect of each control variable.
Dependent Variable = CAR(2, 60) Dependent Variable = BHR(2, 60)
ABACC = DA_JONES ABACC = DA_DD ABACC = DA_JONES ABACC = DA_DD
(1) (2) (3) (4)
Intercept (0) 0.042 0.060 0.027 0.049
(1.59) (2.55)** (0.96) (2.04)**
DSUE (1) 0.019 0.019 0.021 0.022
(4.59)*** (4.20)*** (4.62)*** (4.52)***
CSRDEC (2) 0.009 0.008 0.009 0.009
(2.03)** (1.74)* (2.01)** (1.84)*
CSRDEC x DSUE (3) -0.022 -0.020 -0.023 -0.022
(-3.05)*** (-2.57)** (-2.82)*** (-2.51)**
LGNAF (4) 0.000 0.001 0.002 0.002
(0.29) (0.65) (2.15)** (2.29)**
INST (5) -0.018 -0.025 -0.013 -0.022
(-4.99)*** (-6.28)*** (-3.32)*** (-4.82)***
CGOV_S (6) -0.000 -0.000 -0.002 -0.002
(-0.11) (-0.46) (-1.83)* (-2.06)**
ABACC (7) -0.015 -0.081 -0.018 -0.093
(-1.70)* (-3.55)*** (-1.82)* (-3.71)***
Industry fixed effect YES YES YES YES
Year-Quarter fixed effect YES YES YES YES
N 82,341 66,983 82,341 66,983
Adjusted R2 0.0104 0.0118 0.0094 0.0107
(10)

43
Table 6. Validity check: CSR and post-earnings announcement drift (cont’d
Panel B. Regressions with the main effect of each control variable and their interaction terms
with DSUE.
Dependent Variable = CAR(2, 60) Dependent Variable = BHAR(2, 60)
ABACC = DA_JONES ABACC = DA_DD ABACC = DA_JONES ABACC = DA_DD
(1) (2) (3) (4)
Intercept (0) 0.025 0.044 0.004 0.028
(0.93) (1.86)* (0.15) (1.15)
DSUE (1) 0.053 0.051 0.066 0.064
(5.72)*** (4.95)*** (6.25)*** (5.71)***
CSRDEC (2) 0.008 0.008 0.008 0.009
(1.84)* (1.75)* (1.82)* (1.86)*
CSRDEC x DSUE (3) -0.021 -0.020 -0.021 -0.021
(-2.80)*** (-2.57)** (-2.56)** (-2.52)**
LGNAF (4) 0.004 0.003 0.006 0.005
(2.58)*** (2.14)** (3.64)*** (2.95)***
INST (5) 0.004 -0.007 0.016 0.004
(0.61) (-0.88) (2.22)** (0.45)
CGOV_S (6) -0.000 -0.002 -0.001 -0.003
(-0.13) (-0.81) (-0.61) (-1.29)
ABACC (7) -0.031 0.102 -0.033 0.128
(-1.83)* (1.51) (-1.69)* (1.64)
LGNAF x DSUE (8) -0.007 -0.006 -0.008 -0.006
(-2.91)*** (-2.16)** (-2.97)*** (-2.06)**
INST x DSUE (9) -0.042 -0.036 -0.057 -0.050
(-3.67)*** (-2.73)*** (-4.49)*** (-3.51)***
CGOV_S x DSUE (10) 0.000 0.002 -0.001 0.002
(0.08) (0.65) (-0.21) (0.36)
ABACC x DSUE (11) 0.032 -0.134 0.029 -0.160
(1.07) (-3.16)*** (0.85) (-3.38)***
Industry fixed effect YES YES YES YES
Year-Quarter fixed effect YES YES YES YES
N 82,341 66,983 82,341 66,983
Adjusted R2 0.0109 0.0121 0.0101 0.0113

44
Table 7. CSR and abnormal trading volume around earnings announcements
𝐴𝐵𝑉𝑂𝐿(−1, 1)𝑖,𝑡,𝑞 = 𝛽0 + 𝛽1𝐶𝑆𝑅𝐷𝐸𝐶𝑖,𝑡−1 + 𝛽2𝐷_𝐴𝐵𝑆(𝑆𝑈𝐸_𝐴𝐹)𝑖,𝑡,𝑞 + 𝛽3𝑆𝐼𝑍𝐸𝑖,𝑡−1+𝛽4𝐺𝑅𝑂𝑊𝑇𝐻𝑖,𝑡−1 +
𝛽5𝐿𝐺𝑁𝐴𝐹𝑖,𝑡,𝑞 + 𝛽6𝑅𝐸𝑃𝐿𝐴𝐺𝑖,𝑡,𝑞 + 𝛽7𝑃𝐸𝑅𝑆𝐼𝑆𝑇𝑖,𝑡,𝑞 + 𝛽8𝐼𝑁𝑆𝑇𝑖,𝑡,𝑞 + 𝛽9𝑆𝑇𝑈𝑅𝑁𝑂𝑉𝐸𝑅𝑖,𝑡,𝑞 + 𝜀𝑖,𝑡,𝑞
𝐴𝐵𝑉𝑂𝐿(−1, 1)is the average abnormal trading volume over days (-1, 1) around the earnings announcement date
(date 0). CSRDEC is the decile rank of CSR scores, scaled between 0 and 1. D_ABS(SUE_AF)is defined as the
absolute earnings surprise deciles based on quarterly independent sorts by absolute forecast errors, then scaled
between 0 and 1. SIZE is the firm’s market capitalization at the end of last fiscal year GROWTH is the difference
between total assets at the end of year t and total assets at the end of year t-1. LGNAF is the logarithm of (1 +
number of analysts who provide earnings forecast for the company’s current fiscal quarter REPLAG is the
logarithm of (1+ number of days from quarter-end to the earnings announcement date). PERSIST is earnings
persistence measured as follows: using data from the most recent 16 quarters up to quarter q-1 (minimum 4
observations), we regress by firm IBCq on IBCq-4, where IBC is quarterly income before extraordinary items scaled
by total assets. The coefficient on IBCq-4 is assigned as the persistence measure for each firm in quarter q. To
mitigate the effect of outliers, we replace the value of the coefficient on IBCq-4 by its rank. INST is the percentage
of institutional holdings. STURNOVER is the average monthly share trading volume divided by the average
number of shares outstanding during a one-yearperiod ending at the end of the corresponding fiscal quarter. T-
statistics based on robust standard errors, clustered by firm, are reported in parentheses. ***, **, and * indicate
significance at the 1%, 5%, and 10% level, respectively, based on two-tailed p-values.
Dependent Variable = ABVOL(-1, 1)
(1) (2)
Intercept (0) 0.153 0.265
(0.78) (5.53)***
CSRDEC (1) 0.059 0.034
(6.96)*** (3.76)***
D_ABS(SUE_AF)(2) 0.083 0.121
(11.74)*** (16.57)***
SIZE (3) 0.016
(6.70)***
GROWTH (4) 0.000
(0.95)
LGNAF (5) -0.035
(-10.05)***
REPLAG (6) -0.053
(-5.62)***
PERSIST (7) 0.066
(7.48)***
INST (8) 0.259
(10.02)***
STURNOVER (9) 0.015
(7.53)***
Industry fixed effect YES YES
Year-Quarter fixed effect YES YES
N 97,743 80,237
Adjusted R2 0.1126 0.1250
(13)
45
Table 8. 2SLS Analysis
Panel A reports the first stage regression results where the dependent variable, CSRDEC, is the decile rank of
CSR scores, scaled between 0 and 1. Panel B reports the second stage regression results. The dependent variables
are CAR(-1,1), CAR(2,60), and ABVOL(-1,1). DEMDUMMY equals to one if in the state more people vote for
the democratic candidate and zero otherwise. DEMPCT is the percentage of all votes for the democratic candidate.
LOSS is a dummy variable, equal to one if income before extraordinary items in year t-1 is negative, and equal to
zero otherwise. GROWTH is the difference between total assets at the end of year t and total assets at the end of
year t-1. BETA is CAPM beta measured based on daily returns over year t-1. SIZE is the firm’s market
capitalization at the end of year t-1. PERSIST is earnings persistence measured as follows: using data from the
most recent 16 quarters up to quarter q-1 (minimum 4 observations), we regress by firm IBCq on IBCq-4, where
IBC is quarterly income before extraordinary items scaled by total assets. The coefficient on IBCq-4 is assigned
as the persistence measure for each firm in quarter q. To mitigate the effect of outliers, we replace the value of
the coefficient on IBCq-4 by its rank. LGNAF is the logarithm of (1 + number of analysts who provide earnings
forecast for the company’s current fiscal quarter For firm-quarters that are not covered by the I/B/E/S database,
the number of analysts is set to zero. INST is the percentage of institutional holdings. CGOV_S is the KLD net
score (i.e., total score of strengths minus total score of concerns) in the corporate governance dimension. REPLAG
is the logarithm of (1+ number of days from quarter-end to the earnings announcement date). STURNOVER is the
average monthly share trading volume divided by the average number of shares outstanding during a one-
yearperiod ending at the end of the corresponding fiscal quarter. In the long-window test, we measure the control
variable, abnormal accruals (ABACC) in two alternative ways: in Column (2) of Panel B, ABACC=DA_JONES
which is based on the modified Jones model; and in Column (3) of Panel B, ABACC=DA_DDwhich is based on
the Dechow and Dichev (2002) model. The unexpected earnings (SUE) is defined as earnings per share before
extraordinary items minus earnings per share in the same quarter of the prior year. SUE_AF is defined as earnings
per share before extraordinary items minusthe median analyst forecasted earnings within 60 days prior to the
earnings announcement date.SUE (SUE_AF) is transformed into a decile rank, DSUE(DSUE_AF), by sorting
firms according to SUE (SUE_AF) every quarter, assigning the firms to 10 groups, and assigning the decile rank
to each firm within a decile. We scale DSUEand DSUE_AFbetween 0 and 1.D_ABS(SUE_AF)is defined as the
absolute earnings surprise deciles based on quarterly independent sorts by absolute forecast errors, then scaled
between 0 and 1. T-statistics based on robust standard errors are reported in parentheses. ***, **, and * indicate
significance at the 1%, 5%, and 10% level, respectively, based on two-tailed p-values.

46
Table 8 0SLS Analysis (cont’d
Panel A. First stage regression results (dependent variable = CSRDEC)
Instrument Variables
DEMDUMMY 0.045
(11.18)***
DEMPCT 0.205
(8.35)***
Predetermined Variables
LOSS -0.005
(-1.36)
GROWTH -0.000
(-2.83)***
BETA -0.033
(-12.54)***
SIZE 0.038
(37.20)***
PERSIST 0.018
(4.19)***
LGNAF 0.000
(0.22)
INST -0.022
(-3.48)***
CGOV_S 0.022
(12.33)***
REPLAG -0.060
(-15.60)***
STURNOVER 0.002
(2.70)***
DA_JONES -0.101
(-8.78)***
Intercept 0.361
(12.22)***
Industry fixed effect YES
Year-Quarter fixed effect YES
N 72,582
Adjusted R2 0.0838
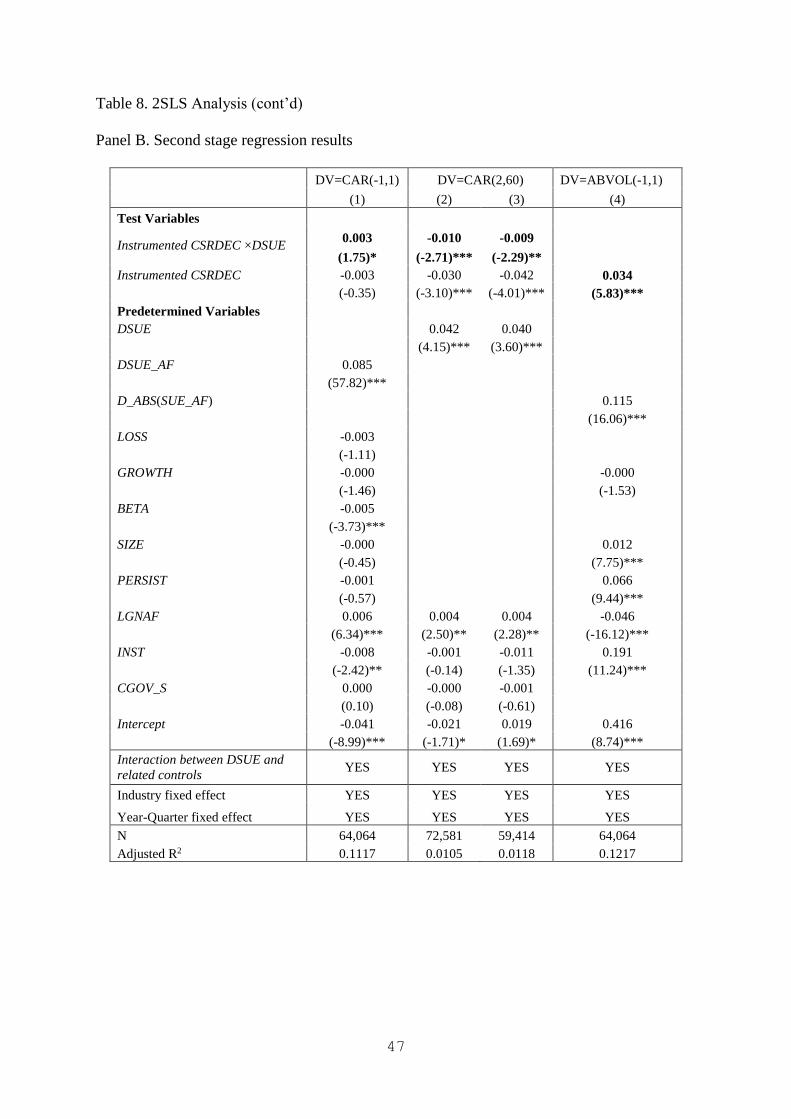
47
Table 8. 2SLS Analysis (cont’d
Panel B. Second stage regression results
DV=CAR(-1,1) DV=CAR(2,60) DV=ABVOL(-1,1)
(1) (2) (3) (4)
Test Variables
Instrumented CSRDEC ×DSUE 0.003 -0.010 -0.009
(1.75)* (-2.71)*** (-2.29)** Instrumented CSRDEC -0.003 -0.030 -0.042 0.034
(-0.35) (-3.10)*** (-4.01)*** (5.83)***
Predetermined Variables
DSUE 0.042 0.040
(4.15)*** (3.60)***
DSUE_AF 0.085
(57.82)***
D_ABS(SUE_AF) 0.115
(16.06)***
LOSS -0.003
(-1.11)
GROWTH -0.000 -0.000
(-1.46) (-1.53)
BETA -0.005
(-3.73)***
SIZE -0.000 0.012
(-0.45) (7.75)***
PERSIST -0.001 0.066
(-0.57) (9.44)***
LGNAF 0.006 0.004 0.004 -0.046
(6.34)*** (2.50)** (2.28)** (-16.12)***
INST -0.008 -0.001 -0.011 0.191
(-2.42)** (-0.14) (-1.35) (11.24)***
CGOV_S 0.000 -0.000 -0.001
(0.10) (-0.08) (-0.61)
Intercept -0.041 -0.021 0.019 0.416
(-8.99)*** (-1.71)* (1.69)* (8.74)***
Interaction between DSUE and
related controls YES YES YES YES
Industry fixed effect YES YES YES YES
Year-Quarter fixed effect YES YES YES YES
N 64,064 72,581 59,414 64,064
Adjusted R2 0.1117 0.0105 0.0118 0.1217