corporations act 2001 (acn 093 732 597) isin ......2020/05/12 · south32 limited chief executive...
TRANSCRIPT

Registered Office Level 35 108 St Georges Terrace Perth WA 6000 Australia
ABN 84 093 732 597 Registered in Australia 1
12 May 2020
BOFA SECURITIES 2020 GLOBAL METALS, MINING & STEEL
CONFERENCE PRESENTATION
South32 Limited Chief Executive Officer, Graham Kerr will present at the BofA Securities Global Metals, Mining & Steel
Conference on 13 May 2020 at 8.00pm Australian Western Standard Time.
The presentation is attached and an accompanying webcast will be available on the South32 website
(https://www.south32.net/investors-media/investor-centre/presentations-reports-speeches).
About South32
South32 is a globally diversified mining and metals company. We produce bauxite, alumina, aluminium, energy and
metallurgical coal, manganese, nickel, silver, lead and zinc at our operations in Australia, Southern Africa and South
America. With a focus on growing our base metals exposure, we also have two development options in North America
and several partnerships with junior explorers around the world. Our purpose is to make a difference by developing
natural resources, improving people’s lives now and for generations to come. We are trusted by our owners and partners
to realise the potential of their resources.
Further Information
Investor Relations
Alex Volante
T +61 8 9324 9029
M +61 403 328 408
Tom Gallop
T +61 8 9324 9030
M +61 439 353 948
Media Relations
Rebecca Keenan
T +61 8 9324 9364
M +61 402 087 055
Jenny White
T +44 20 7798 1773
M +44 7900 046 758
Authorised for release by Nicole Duncan, Company Secretary
JSE Sponsor: UBS South Africa (Pty) Ltd
12 May 2020
South32 Limited
(Incorporated in Australia under the Corporations Act 2001 (Cth))
(ACN 093 732 597)
ASX / LSE / JSE Share Code: S32 ADR: SOUHY
ISIN: AU000000S320
south32.net
For
per
sona
l use
onl
y

•12 May 2020
BofA Securities2020 Global Metals, Mining & Steel Conference
For
per
sona
l use
onl
y

SLIDE 2
Important notices
This presentation should be read in conjunction with the “Financial Results and Outlook – half year ended 31 December 2019” announcement released on 13 February 2020, which is available on South32’s website (www.south32.net).
Figures in italics indicate that an adjustment has been made since the figures were previously reported.
FORWARD-LOOKING STATEMENTS
• This presentation contains forward-looking statements, including statements about trends in commodity prices and currency exchange rates; demand for commodities; production forecasts; plans, strategies and objectives of management; capital costs and scheduling; operating
costs; anticipated productive lives of projects, mines and facilities; and provisions and contingent liabilities. These forward-looking statements reflect expectations at the date of this presentation, however they are not guarantees or predictions of future performance or statements of
fact. They involve known and unknown risks, uncertainties and other factors, many of which are beyond our control, and which may cause actual results to differ materially from those expressed in the statements contained in this presentation. Readers are cautioned not to put undue
reliance on forward-looking statements. South32 makes no representation, assurance or guarantee as to the accuracy or likelihood or fulfilment of any forward-looking statement or any outcomes expressed or implied in any forward-looking statement. Except as required by applicable
laws or regulations, the South32 Group does not undertake to publicly update or review any forward-looking statements, whether as a result of new information or future events. Past performance cannot be relied on as a guide to future performance. The denotation (e) refers to an
estimate or forecast year.
• NON-IFRS FINANCIAL INFORMATION
• This presentation includes certain non-IFRS financial measures, including Underlying earnings, Underlying EBIT and Underlying EBITDA, Basic Underlying earnings per share, Underlying effective tax rate, Underlying EBIT margin, Underlying EBITDA margin, Underlying return on
invested capital, Free cash flow, net debt, net cash, net operating assets, Operating margin and ROIC. These measures are used internally by management to assess the performance of our business, make decisions on the allocation of our resources and assess operational
management. Non-IFRS measures have not been subject to audit or review and should not be considered as an indication of or alternative to an IFRS measure of profitability, financial performance or liquidity.
• NO OFFER OF SECURITIES
• Nothing in this presentation should be read or understood as an offer or recommendation to buy or sell South32 securities, or be treated or relied upon as a recommendation or advice by South32.
• RELIANCE ON THIRD PARTY INFORMATION
• Any information contained in this presentation that has been derived from publicly available sources (or views based on such information) has not been independently verified. The South32 Group does not make any representation or warranty about the accuracy, completeness or
reliability of the information. This presentation should not be relied upon as a recommendation or forecast by South32.
• NO FINANCIAL OR INVESTMENT ADVICE – SOUTH AFRICA
• South32 does not provide any financial or investment 'advice' as that term is defined in the South African Financial Advisory and Intermediary Services Act, 37 of 2002.
• MINERAL RESOURCES AND ORE RESERVES
• The information that relates to the Mineral Resources of the Clark Deposit was declared in the market announcement “Hermosa Project – Mineral Resource Declaration” dated 12 May 2020 (www.south32.net) based on information compiled by Matthew Hastings, Competent Person.
South32 confirms that it is not aware of any new information or data that materially affects the information included in the original announcement.
• The information that relates to the Mineral Resources of the Arctic Deposit and the Bornite Deposit was declared in the market announcement “2020 Half Year Financial Results Presentation” dated 13 February 2020 (www.south32.net) based on information compiled by
David F. Machuca Mory, Competent Person, for the Arctic Deposit, and Sia Khosrowshahi, Competent Person, for the Bornite Deposit.
• Other information in this presentation that relates to Ore Reserve and Mineral Resource estimates was declared as part of South32’s annual Resource and Reserve declaration in the FY19 Annual Report (www.south32.net) issued on 6 September 2019 and prepared by Competent
Persons in accordance with the requirements of the JORC Code. South32 confirms that it is not aware of any new information or data that materially affects the information included in the original announcements. All material assumptions and technical parameters underpinning the
estimates in the relevant market announcement continue to apply and have not materially changed. South32 confirms that the form and context in which the Competent Person’s findings are presented have not been materially modified from the original market announcement.
For
per
sona
l use
onl
y

SLIDE 3
Overview
Maintain capital discipline and
invest in high returning projects
Exit low returning
businesses
Respond to
market conditions
Continue to embed high quality
options with a bias to base metals
Protect our strong
balance sheet
Consistently apply
our strategy
For
per
sona
l use
onl
y

Our response to COVID-19
- contributing US$7M to our communities
- assisting in the provision of water,
essential hygiene and medical supplies
- supporting an increase in the capacity of
local health care systems
- stopping all non-business critical work
- ensuring reliable supply to our customers
- maintaining access to critical supplies
for our operations
- working with governments, regulators
and industry associations to share
learnings and implement best practise
- adjusting capital expenditure priorities to
rapidly defer, rescope or cancel
non-critical projects
- initiating a review of capital and
controllable costs
- suspending our on-market share
buy-back
- implementing procedures for social
distancing
- adjusting roster patterns and staggering
start times
- supporting our people to take care of
their mental health and wellbeing
Our strong financial position and resilient portfolio has us well placed to navigate and respond to COVID-19’s impact
SLIDE 4
For
per
sona
l use
onl
y

SLIDE 5
Our strategy
A simple strategy underpinned by a disciplined capital management framework
Optimise
our business by working safely,
minimising our impact,
consistently delivering stable and
predictable performance and
continually improving our
competitiveness
Unlock
the full value of our business
Identify
and pursue opportunities to
sustainably reshape our business
for the future
For
per
sona
l use
onl
y

SLIDE 6
Our portfolio
Eagle Downs Metallurgical Coal
Australia Manganese alloysSouth Africa
Manganese alloys
Worsley Alumina
Cerro Matoso
Brazil Alumina
South Africa Manganese ore
South Africa Energy Coal
(SAEC)
Mozal Aluminium
Hillside Aluminium
Australia Manganese ore
Cannington
Illawarra Metallurgical Coal
Hermosa
Downstream processing facilities
Upstream operations
Development option
Divestment or review in progress
Exploration partnership/project
Ambler MetalsLarge producer of manganese ore
and aluminaBase metals development and exploration options
Conditional agreement to divest South Africa Energy Coal1
Options offer a staged build profile, subject to investment decisions
For
per
sona
l use
onl
y

Manganese oreIndustry leading position in Australia and South Africa, with joint venture
supplying ~20%(c) of the seaborne market
SLIDE 7
Our portfolio
Contribution to EBITDA(a)
(%)Energy coal Conditional agreement to divest South Africa Energy Coal
Manganese alloysOn-going exposure under review with in principle decision to
place our South African smelter on temporary care and maintenance
Base & precious
metals
Nickel, zinc, lead and silver production with future growth targeted to
come from Hermosa and Ambler Metals development options
AluminiumSmelters in South Africa and Mozambique processing internally
produced alumina
Metallurgical coal
Premium hard coking coal from Illawarra Metallurgical Coal where study
work to optimise the operation for long term value is being advanced
following continued strong longwall performance
Notes:
a. Presented on a proportionally consolidated basis and excludes the Brazil Alumina aluminium smelter, Hermosa, Eagle Downs, and Group and unallocated costs. Metallurgical coal comprises Illawarra Metallurgical Coal including energy coal
production. Negative contribution by commodity shown as nil.
b. South32 share. Alumina book based on H1 FY20 alumina sales.
c. South32 analysis. Based on FY19 seaborne market data presented on a 100% basis.
Alumina
Large producer from competitively positioned refineries in Australia
and Brazil, supplying our aluminium smelters (37%)(b) and the seaborne
merchant market (63%)(b)
Diversified by commodity and customer with growth options embedded and a pathway to exit low returning businesses
0%
10%
20%
30%
40%
50%
60%
70%
80%
90%
100%
FY16 FY17 FY18 FY19 H1 FY20
For
per
sona
l use
onl
y

(500)
500
1,000
1,500
2,000
H1FY16
H2FY16
H1FY17
H2FY17
H1FY18
H2FY18
H1FY19
H2FY19
H1FY20
Cash generated from operations Manganese JV net distributions
Sustaining capital expenditure Major capital expenditure
Free cash flow from operations
0%
5%
10%
15%
20%
25%
30%
35%
40%
45%
(500)
500
1,000
1,500
2,000
H1FY16
H2FY16
H1FY17
H2FY17
H1FY18
H2FY18
H1FY19
H2FY19
H1FY20
Underlying EBITDA Operating margin (RHS)
Our cash generation
SLIDE 8
Underlying EBITDA and Operating margin
(US$M, LHS; %, RHS)Cash flow(b)
(US$M)
Cash from operations has significantly exceeded capital expenditure
with excess funds directed to shareholders,
portfolio improvement and our balance sheet
Notes:
a. Based on FY16 to H1 FY20 actual data.
b. Capital expenditure excludes Equity Accounted Investments.
c. Free cash flow from operations includes manganese JV net distributions.
Average annual Underlying EBITDA of US$2.0B
at an Operating margin of 32%(a)
(c)
For
per
sona
l use
onl
y

(800)
(400)
400
800
1,200
1,600
2,000
2,400
Jun2015
Dec2015
Jun2016
Dec2016
Jun2017
Dec2017
Jun2018
Dec2018
Jun2019
Dec2019
Mar2020
SLIDE 9
Our balance sheet
Net cash/(debt)2
(US$M)
Opening net debt ~US$0.7B5
1,205
499
556
150
Cash and cashequivalents
Worsley Aluminalease liability
Other liabilities Net cash balance
Net cash balance as at 31 March 20203
(US$M)
Long term lease liability
for cogeneration facility
expiring in 20394
Net cash, no term debt and an undrawn US$1.5B revolving credit facilityA strong balance sheet through the cycle is at the core of our strategy
6
For
per
sona
l use
onl
y

244
554572
192
FY16 FY17 FY18 FY19 FY20e FY21e
430
337
433
528500
450
100
200
300
400
500
600
700
800
FY16 FY17 FY18 FY19 FY20e FY21e
SLIDE 10
Capital management framework
Our framework has remained
unchanged since day one
Successful divestment of SAEC
will meaningfully reduce the
Group’s capital intensity
Ordinary dividend policy is
designed to flex and reward
shareholders through the cycle
Sustaining capital expenditure including EAI7 and
ordinary dividends(US$M)
Capital management framework
Maintain safe and reliable
operations and an
investment grade credit
rating through the cycle
Competition for
excess capital
- Investment in our business
- Acquisitions
- Greenfield exploration
- Share buy-backs
- Special dividends
Distribute a minimum 40% of
Underlying earnings as
ordinary dividends
Ca
sh
flo
w p
rio
riti
es
Ma
xim
ise c
as
h f
low
ROIC
Sustaining capital including EAI excluding SAEC
Sustaining capital – SAEC
Ordinary dividends paid (actual)
Sustaining capital guidance range of
US$450-550M (excluding SAEC) beyond FY21
For
per
sona
l use
onl
y

100
200
300
400
500
600
FY17 FY18 FY19 FY20
On-market share buy-back
Special dividends
SLIDE 11
Capital management framework
Excess capital (paid and committed) (US$M)
Excess capital allocation (Capital allocation since FY16)(a)
On-market share buy-back
currently suspended with
US$121M remaining as part of
our response to COVID-19
Notes:
a. Capital allocation includes remaining capital management program which is currently suspended (US$121M).
Capital management framework
Maintain safe and reliable
operations and an
investment grade credit
rating through the cycle
Competition for
excess capital
- Investment in our business
- Acquisitions
- Greenfield exploration
- Share buy-backs
- Special dividends
Distribute a minimum 40% of
Underlying earnings as
ordinary dividends
Ca
sh
flo
w p
rio
riti
es
Ma
xim
ise c
as
h f
low
ROIC
We have allocated excess cash to establish balance sheet resilience, improve our portfolio
and return US$1.3B to shareholders in addition to ordinary dividends of US$1.6B
13%
11%
34%
37%
5%
Net cash to balance sheet
Major capital (including EAI)
Capital management program
Acquisitions
Greenfield exploration partnerships
US$4.3B
allocated
For
per
sona
l use
onl
y

4
8
12
16
20
24
28
32
36
Au
str
alia
So
uth
Afr
ica
Ga
bon
Gh
ana
Bra
zil
Rest
of w
orl
d
Chin
a
Rest
of w
orl
d(e
x.
Chin
a)
CY16 CY17 CY18 CY19 CY20
ImportsExports
1
2
3
4
5
6
7
8
Nov-18 Feb-19 May-19 Aug-19 Nov-19 Feb-20 May-20
Mn ore port stocks Mn ore 44% Mn, CIF China
Mn ore 37% Mn, FOB PE Port Inventory months
Manganese market
SLIDE 12
• Manganese ore trade flows(a)
• (Mt, Mn content unadjusted)
Chinese imports fell -18% YoY
in Q1 CY20 following
COVID-19 lockdown
Long term price to be set by
marginal South African supply
transitioning to more expensive
underground over time
Manganese ore price and China port stocks
(US$/dmtu; Mt; months)
South Africa (40% of seaborne supply)
and Brazil supply disruption
Source: GTIS, South32 industry analysis
Notes:
a. CY20 is based on March 2020 YTD annualised.
b. Post inventory months based on 12 month normalised imports. Source: Fastmarkets, Steel Orbis
Port inventory increased during
Chinese COVID-19 lockdown
(b)
Significant COVID-19 related
supply disruptions in Q2 CY20
Prices moved off lows in late
CY19 with high cost producers
exiting the market
For
per
sona
l use
onl
y

(600)
(400)
(200)
200
400
600
0
100
200
300
400
500
600
700
800
Jan-17 Jul-17 Jan-18 Jul-18 Jan-19 Jul-19 Jan-20
Exports (RHS)
Imports (RHS)
Platts CFR China
Platts China Shanxi Ex-Works (CFR equivalent)
SLIDE 13
Alumina market
Alumina cost curve (CY20)
(US$/t)
China alumina imports/exports
•(Alumina price US$/t LHS; kt, RHS)
Source: GTIS, SMM, China Custom, Platts, South32 analysis
Long term price to be set by
new Chinese and Indonesian supply
well above the current spot price
Imported material remains
competitive into China
Majority of Chinese alumina industry
currently loss-making
0
50
100
150
200
250
300
350
400
450
Australia China Europe Middle East & Africa Americas Other
Spot Price at ~US$243/t(a)
Source: CRU
144Mt
Notes:
a. Platts FOB Australia price as at 6 May 2020.
For
per
sona
l use
onl
y

Metallurgical coal market
SLIDE 14
Ex-China steel cuts are
impacting demand in Q2 CY20
Further exit of high cost supply
and easing of global lockdown
measures to return market balance
Chinese imports currently
supported by arbitrage despite
tight import regulations
Metallurgical coal seaborne trade by major regions(a)(b)
(Mt)
Metallurgical coal prices
(US$/t LHS; China arbitrage US$/t RHS)
Source: Platts SBB database, South32 analysisSource: GTIS, IHS India Coal Report and South32 analysis
Notes:
a. Metallurgical coal trade flow includes hard coking coal (HCC), weak coking coal and PCI, and incorporates Mongolian coal exports to China.
b. Q1 CY20e based on January and February actuals and estimated March volumes.
Long run growth to be
driven by India and other
emerging Asian economies
(10)
10
20
30
40
50
60
70
80
90
30
60
90
120
150
180
210
240
270
300
May-18 Aug-18 Nov-18 Feb-19 May-19 Aug-19 Nov-19 Feb-20 May-20
China arbitrage imports over domestic (RHS)
China Domestic Prime HCC (CFR equivalent) (LHS)
Platts Premium Low Vol (PLV) HCC FOB Australia (LHS)
PLV HCC CFR China (LHS)
Exports
Imports
20
40
60
80
100
Q1CY18
Q3CY18
Q1CY19
Q3CY19
Q1CY20e
Australia United States Canada Russia Mongolia Mozambique
20
40
60
80
100
Q1CY18
Q3CY18
Q1CY19
Q3CY19
Q1CY20e
China India Japan South Korea Taiwan Europe Brazil Vietnam
For
per
sona
l use
onl
y

Worsley Alumina (86%)
Production volumes not impacted to date
FY20 Operating unit cost guidance lowered
4% to US$210/t8
Australia Manganese ore (60%)
FY20 production guidance reduced by 5% in
response to restrictions aimed at containing the
spread of COVID-19
FY20 Operating unit cost guidance increased by 4%
to US$1.61/dmtu8
Impact on exploration programs being assessed
SLIDE 15
Business update: Australia
Eagle Downs Metallurgical Coal (50%)
Remaining resource drilling work completed
Investment decision expected by end of
December 2020 half year
Cannington (100%)
Production volumes not impacted to date
FY20 Operating unit cost guidance largely
unchanged US$116/t8 (previously US$115/t)
Illawarra Metallurgical Coal (100%)
Production volumes not impacted to date
FY20 Operating unit cost guidance largely
unchanged US$92/t8 (previously US$93/t)
Returned to a three longwall configuration in
late April
With continued strong longwall performance we
have commenced a review to optimise
production, sustaining capital and operating
costs to maximise long term value
Australia Manganese alloys (60%)
Progressing review, with timeframe to complete
impacted by COVID-19 restrictions
Production and sales volumes from Australian operations largely unaffected to date by COVID-19 restrictions or measures
For
per
sona
l use
onl
y

SLIDE 16
Business update: Southern Africa
Hillside Aluminium (100%)
Record year to date production, despite the
impact of load-shedding
Updated FY20 production guidance 718kt
Lower raw material and power prices expected to
benefit unit costs in H2 FY20
Mozal Aluminium (47.1%)
Production volumes not impacted to date with
the smelter continuing to test maximum
technical capacity, despite the impact of
load-shedding
Lower raw material prices expected to benefit
unit costs in H2 FY20
South Africa Manganese alloys (60%)
In principle decision to place Metalloys smelter on
temporary care and maintenance
South Africa Manganese ore (60%)
Open pit operations able to ramp up to 100% during
June 2020 quarter, underground currently restricted to 50%
Updated FY20 production guidance range 1,700-1,850kwmt,
subject to ramp up and inland logistics performance
Updated FY20 Operating unit cost guidance range
US$2.55-2.65/dmtu8
South Africa Energy Coal (100%)
Continue to adjust volumes to maximise margins
Updated FY20 production guidance range 21-23Mt
(export 9.5-10.5Mt, domestic 11.5-12.5Mt)
Updated FY20 Operating unit cost guidance range
US$39-41/t8
Updated guidance subject to no further impact following the easing of South African national lockdown restrictions on May 1st
For
per
sona
l use
onl
y

SLIDE 17
Business update: Americas
Hermosa (100%)
Pre-feasibility study (PFS) for the Taylor Deposit
expected to be completed in the September 2020 quarter
Exploration programs temporarily suspended since
March 2020 due to COVID-19 restrictions in Arizona
Ambler Metals (50%)
CY20 exploration programs under review due to
COVID-19 restrictions in Alaska
US Bureau of Land Management has filed the final
Environmental Impact Statement for the Ambler access road
Cerro Matoso (99.9%)
Production largely unaffected to date with government
approval to operate through Colombian national lockdown
Furnace refurbishment deferred to H1 FY21 due to
COVID-19 restrictions on travel
Updated FY20 production guidance 40.5kt
FY20 Operating unit cost guidance lowered 4% to US$3.73/lb8
Brazil Alumina (36%)
Record year to date production with volumes not
impacted to date by COVID-19 restrictions or measures
Refinery operating unit costs expected to benefit from
lower caustic and bauxite prices in H2 FY20
For
per
sona
l use
onl
y

Hermosa project
Notes:
a. Net Smelter Return (NSR) cut-off US$90/t. Refer to important notices (slide 2) for additional disclosure.
Taylor PFS on-track for
completion in September 2020 quarter
Mineral Resource estimate for Taylor has de-risked
and increased our confidence in the project
Exploration programs to recommence after
COVID-19 restrictions are lifted in Arizona
Hermosa Tailings Storage Facility (TSF) (looking north)
Aerial view of lined tailings storage facility and Taylor Deposit support infrastructure
Ore TypeTotal Mineral Resources
Mt % Zn % Pb g/t Ag
UG Sulphide(a) 149 3.32 3.66 70
UG Transition(a) 6.2 5.22 3.82 57
Total 155 3.39 3.67 69
Taylor Deposit Mineral Resource(a)
Capital expenditure directed to
establishing surface infrastructure with
dry stack tailings facility now operational
SLIDE 18
For
per
sona
l use
onl
y

SLIDE 19
Hermosa project
Hermosa project land package
Taylor Deposit, Clark Deposit and regional landholdings
Taylor
Deposit
Clark
Deposit
Regional landholdings
increased by ~50%
since acquisition
Scoping study
underway to evaluate
Clark processing and
end-market opportunities
Regional exploration
program underway with
15 new targets identified
Mineral Resource estimate
declared for Clark
Clark Deposit Mineral Resource(a)
Notes:
a. NSR cut-off US$175/t. Refer to important notices (slide 2) for additional disclosure.
Ore TypeTotal Mineral Resources
Mt % Zn % Mn g/t Ag
UG Oxide(a) 55 2.31 9.08 78
Total 55 2.31 9.08 78
Clark Deposit and Taylor Deposit Mineral Resource (looking north)
Clark Deposit (NSR cut-off US$175/t)
Taylor Deposit (NSR cut-off US$90/t)
km0.50
km
0 3
Patented area
Unpatented area
For
per
sona
l use
onl
y

Ambler Metals JV
Arctic, a high grade VMS
development option
Regional scale in an
attractive mining jurisdiction
• Bornite, a large carbonate
hosted copper deposit
Identified prospects
and VMS clusters
Ambler Metals JV location map
SLIDE 20
• 50% joint venture with Trilogy Metals following an initial
exploration partnership over three field seasons
• Two highly prospective mineralised belts with potential
to establish a processing hub
• Funded to progress Arctic to a development decision,
undertake further exploration at Bornite and test regional
targets
• Supportive local partner NANA Regional Corporation(a)
Pathway to a development decision
• Arctic PFS commenced by the JV
• US Bureau of Land Management has filed the
final Environmental Impact Statement for the Ambler
access road
High grade development option
in northwest Alaska
Notes:
a. If the JV proceeds with construction of a mine on lands subject to the NANA Agreement, NANA will have the option to acquire between 16% and 25% (as specified by NANA) of the project or receive a net proceeds royalty of 15%.
Arctic
Deposit
Bornite
DepositAmbler
Shungnak
Kobuk
km
0 25
NANA lands, selected conveyed
State mining claims
NANA area of interest
Proposed Access Road (AMDIAP)
Targets
Geological zone
TownsFor
per
sona
l use
onl
y

km0 0.1
Ambler Metals JV
Arctic Deposit Mineral Resource (looking north west)
Total Mineral Resource 37Mt at 3.06% Cu, 4.30% Zn, 0.77% Pb, 47 g/t Ag and 0.60 g/t Au(a)
Bornite Deposit Mineral Resource (looking north west)
Total Open Pit Mineral Resource 78Mt at 1.04% Cu(b)
Total Underground Mineral Resource 70Mt at 2.29% Cu(b)
SLIDE 21
Notes:
a. NSR cut-off US$63/t. Refer to important notices (slide 2) for additional disclosure.
b. Cut-off 0.5% Cu for Open Pit Mineral Resource and 1.5% Cu for Underground Mineral Resource. Refer to important notices (slide 2) for additional disclosure.
Arctic PFS
commenced by JV
CY20 work program to be
prioritised in response to
COVID-19 restrictions
• Further resource definition
drilling planned at Arctic
Exploration targets in
Ambler VMS belt
prioritised for drilling
NSR 63 - 150
NSR 150 - 400
NSR cut-off (US$/t)
NSR 400 - 500
NSR > 500
0.5 - 1.5% Cu
1.5 - 3.0% Cu
Copper content (% Cu)
3.0 - 4.0% Cu
> 4.0% Cu km0 0.5
For
per
sona
l use
onl
y

SLIDE 22
Summary
Maintain capital discipline and
invest in high returning projects
Exit low returning
businesses
Respond to
market conditions
Continue to embed high quality
options with a bias to base metals
Protect our strong
balance sheet
Consistently apply
our strategy
For
per
sona
l use
onl
y

Supplementary Information
For
per
sona
l use
onl
y

1,504
2,616
201
540
1,042
2,869
271
759
72
178
288
1,096
9M YTD production Q4 guidance
Guidance unchanged
Production volumes not impacted to date by COVID-19
Expected to approach guidance with no further material calciner maintenance
scheduled
SLIDE 24
Production performance and guidance
FY20e production
(South32’s share)
South Africa Manganese – ore9
Worsley Alumina
Brazil Alumina (non-operated)
Hillside Aluminium
Mozal Aluminium
Australia Manganese – ore
Guidance unchanged
Record year to date production with volumes not impacted to date by COVID-19
restrictions or measures
New FY20 production guidance (subject to load-shedding)
Record year to date production, despite the impact of load-shedding
Operation Unit Guidance Key FY20 guidance assumptions
kt
FY20e
3,965
kt 1,330
kt 718
kt 273
kwmt 3,375
kwmt 1,700 – 1,850
Guidance unchanged (subject to load-shedding)
Production volumes not impacted to date by COVID-19 with the smelter continuing
to test its maximum technical capacity, despite the impact of load-shedding
Subject to market conditions
Lower year to date throughput and reduced productivity expectations to finish the
year, following temporary roster changes made in response to COVID-19
New FY20 production guidance range (subject to market conditions)
Open pit operations expected to ramp up to 100% during June 2020 quarter, with
underground currently restricted to 50%
Guidance subject to ramp up and inland logistics performance
For
per
sona
l use
onl
y

• Guidance unchanged
Production volumes not impacted to date by COVID-19, although challenging
strata conditions encountered to commence the June 2020 quarter
SLIDE 25
Production performance and guidance
FY20e production
(South32’s share)
• Guidance unchanged
Production volumes not impacted to date by COVID-19
Illawarra Metallurgical Coal
South Africa Energy Coal
Cerro Matoso
Operation Unit Guidance Key FY20 guidance assumptions
kt
FY20e
5,800
kt 1,200
kt 40.5
kdmt 2,750
kdmt 2,700
kt 11,500 – 12,500
kt 9,500 – 10,5007,934
9,510
2,095
174.5
2,082
30.9
1,028
4,026
2,066
2,490
605
46.5
668
9.6
172
1,774
Export coal
Domestic coal
Ore processed
Zinc equivalent
Ore to kiln
Payable nickel
Energy coal
Metallurgical coal
9M YTD production Q4 guidance
New FY20 production guidance
• Production guidance increased by 4.9kt following deferral of furnace refurbishment
to H1 FY21 which is expected to have a commensurate impact on FY21e production
New FY20 production guidance
Export production to ramp up in the June 2020 quarter following the easing of
national lockdown restrictions
Domestic demand is expected to be impacted by lower total power generation
during the June 2020 quarter
Continue to adjust volumes to maximise margins
Cannington10
kt 221.0
For
per
sona
l use
onl
y
SLIDE 26
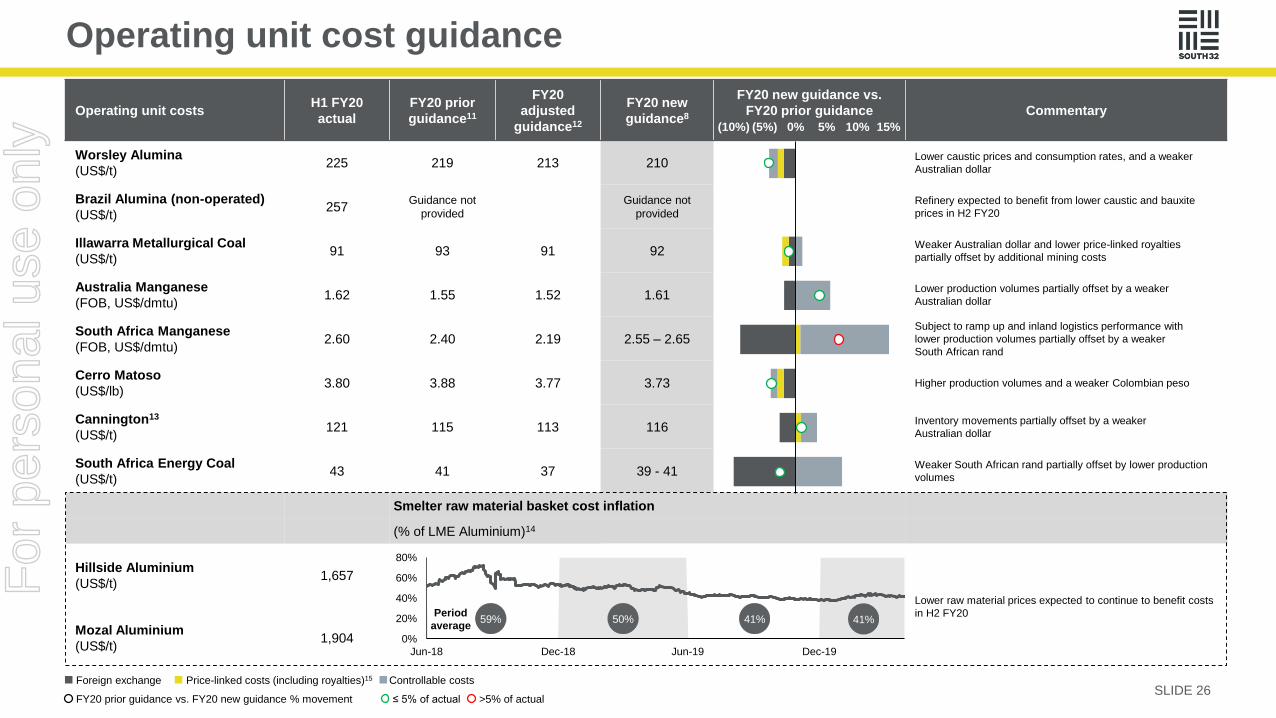
Operating unit cost guidance
FY20 prior guidance vs. FY20 new guidance % movement
Controllable costsForeign exchange Price-linked costs (including royalties)15
Operating unit costsH1 FY20
actual
FY20 prior
guidance11
FY20
adjusted
guidance12
FY20 new
guidance8
FY20 new guidance vs.
FY20 prior guidance Commentary
Worsley Alumina
(US$/t) 225 219 213 210
Lower caustic prices and consumption rates, and a weaker
Australian dollar
Brazil Alumina (non-operated)
(US$/t) 257
Guidance not
provided
Guidance not
provided
Refinery expected to benefit from lower caustic and bauxite
prices in H2 FY20
Illawarra Metallurgical Coal
(US$/t) 91 93 91 92
Weaker Australian dollar and lower price-linked royalties
partially offset by additional mining costs
Australia Manganese
(FOB, US$/dmtu)1.62 1.55 1.52 1.61
Lower production volumes partially offset by a weaker
Australian dollar
South Africa Manganese
(FOB, US$/dmtu)2.60 2.40 2.19 2.55 – 2.65
Subject to ramp up and inland logistics performance with
lower production volumes partially offset by a weaker
South African rand
Cerro Matoso
(US$/lb)3.80 3.88 3.77 3.73 Higher production volumes and a weaker Colombian peso
Cannington13
(US$/t) 121 115 113 116
Inventory movements partially offset by a weaker
Australian dollar
South Africa Energy Coal
(US$/t) 43 41 37 39 - 41
Weaker South African rand partially offset by lower production
volumes
Smelter raw material basket cost inflation
(% of LME Aluminium)14
Hillside Aluminium
(US$/t) 1,657
Lower raw material prices expected to continue to benefit costs
in H2 FY20
Mozal Aluminium
(US$/t) 1,904
(10%) (5%) 0% 5% 10% 15%
>5% of actual≤ 5% of actual
0%
20%
40%
60%
80%
Jun-18 Dec-18 Jun-19 Dec-19
50% 41%59%Period
average41%
For
per
sona
l use
onl
y

1. Refer to the market announcement “Agreement to Divest South Africa Energy Coal” dated 6 November 2019.
2. The Group’s June 2019 net cash position reduced by US$140M to US$364M on 1 July 2019 following the adoption of AASB 16 Leases.
3. Numbers are unaudited. Net cash number should not be considered as an indication of or alternative to an IFRS measure of profitability, financial performance or liquidity.
4. Worsley Alumina lease liability for two multi-fuel cogeneration units commenced in 2014, with a tenor of 32 years (incorporating a 7 year extension option).
5. On implementation of demerger, South32 was expected to have net debt of US$674M.
6. Other liabilities primarily incorporates cash and cash equivalents we hold on behalf of our manganese JV and other lease liabilities.
7. FY20e Sustaining capital expenditure guidance includes South Africa Energy Coal and reflects updated assumptions for our average exchange rates (AUD:USD of 0.67, USD:ZAR of 15.76 and USD:COP of 3,544). FY21e Sustaining capital expenditure guidance excludes
South Africa Energy Coal and reflects updated assumptions for our average exchange rates (AUD:USD exchange rate of 0.68, USD:ZAR exchange rate of 15.72 and USD:COP exchange rate of 3,309).
8. FY20e new Operating unit cost guidance includes royalties (where appropriate) and the influence of exchange rates, and includes various assumptions for FY20, including: an alumina price of US$272/t; an average blended coal price of US$125/t for Illawarra Metallurgical Coal;
a manganese ore price of US$4.96/dmtu for 44% manganese product; a nickel price of US$6.27/lb; a thermal coal price of US$69/t (API4) for South Africa Energy Coal; a silver price of US$16.67/troy oz; a lead price of US$1,905/t (gross of treatment and refining charges); a
zinc price of US$2,186/t (gross of treatment and refining charges); an AUD:USD exchange rate of 0.67; a USD:ZAR exchange rate of 15.76; a USD:COP exchange rate of 3,544; and a reference price for caustic soda; all of which reflected forward markets as at April 2020 or
our internal expectations.
9. Consistent with the presentation of South32’s segment information, South Africa Manganese ore production has been reported at 60%. The Group’s financial statements will continue to reflect a 54.6% interest in South Africa Manganese ore.
10. Payable zinc equivalent (kt) was calculated by aggregating revenues from payable silver, lead and zinc, and dividing the total Revenue by the price of zinc. FY19 realised prices for zinc (US$2,122/t), lead (US$1,754/t) and silver (US$14.4/oz) have been used for FY20e.
11. FY20e prior Operating unit cost guidance includes royalties (where appropriate) and the influence of exchange rates, and includes various assumptions for FY20, including: an alumina price of US$283/t; an average blended coal price of US$137/t for Illawarra Metallurgical
Coal; a manganese ore price of US$4.58/dmtu for 44% manganese product; a nickel price of US$6.65/lb; a thermal coal price of US$78/t (API4) for South Africa Energy Coal; a silver price of US$17.60/troy oz; a lead price of US$2,004/t (gross of treatment and refining
charges); a zinc price of US$2,319/t (gross of treatment and refining charges); an AUD:USD exchange rate of 0.69; a USD:ZAR exchange rate of 14.58; a USD:COP exchange rate of 3,364; and a reference price for caustic soda; all of which reflected forward markets as at
January 2020 or our internal expectations.
12. FY20 adjusted guidance is restated to reflect price and foreign exchange rate assumptions used for FY20 new guidance.
13. US dollar per tonne of ore processed. Periodic movements in finished product inventory may impact Operating unit cost.
14. Sources: LME, Baiinfo, Aladinny, AZ China, CRU, Platts, Jacobs. Calculation assumes 1t of aluminium, 1.9t alumina, 0.35t coke, 0.075t pitch and 0.02t aluminium tri-fluoride.
15. Price-linked costs reflects commodity price-linked costs and market traded consumables.
• The detonation (e) refers to an estimate or forecast year.
• The following abbreviations have been used throughout this presentation: Joint Venture (JV); Illawarra Metallurgical Coal (IMC); South Africa Energy Coal (SAEC); equity accounted investments (EAI); and South Africa (SA).
Footnotes
SLIDE 27
For
per
sona
l use
onl
y

For
per
sona
l use
onl
y