correcting density functional theory for accurate ......predictions of the compound thermodynamic...
TRANSCRIPT
PHYSICAL REVIEW B 85, 115104 (2012)
Correcting density functional theory for accurate predictions of compound enthalpies of formation:Fitted elemental-phase reference energies
Vladan Stevanovic and Stephan Lany*
National Renewable Energy Laboratory, Golden, Colorado 80401, USA
Xiuwen ZhangDepartment of Physics, Colorado School of Mines, Golden, Colorado 80401, USA
Alex ZungerUniversity of Colorado, Boulder, Colorado 80309, USA
(Received 2 September 2011; revised manuscript received 14 December 2011; published 7 March 2012)
Despite the great success that theoretical approaches based on density functional theory have in describingproperties of solid compounds, accurate predictions of the enthalpies of formation (�Hf ) of insulating andsemiconducting solids still remain a challenge. This is mainly due to incomplete error cancellation whencomputing the total energy differences between the compound total energy and the total energies of its elementalconstituents. In this paper we present an approach based on GGA + U calculations, including the spin-orbitcoupling, which involves fitted elemental-phase reference energies (FERE) and which significantly improves theerror cancellation resulting in accurate values for the compound enthalpies of formation. We use an extensive setof 252 binary compounds with measured �Hf values (pnictides, chalcogenides, and halides) to obtain FEREenergies and show that after the fitting, the 252 enthalpies of formation are reproduced with the mean absoluteerror MAE = 0.054 eV/atom instead of MAE ≈ 0.250 eV/atom resulting from pure GGA calculations. Whenapplied to a set of 55 ternary compounds that were not part of the fitting set the FERE method reproduces theirenthalpies of formation with MAE = 0.048 eV/atom. Furthermore, we find that contributions to the total energydifferences coming from the spin-orbit coupling can be, to a good approximation, separated into purely atomiccontributions which do not affect �Hf . The FERE method, hence, represents a simple and general approach,as it is computationally equivalent to the cost of pure GGA calculations and applies to virtually all insulatingand semiconducting compounds, for predicting compound �Hf values with chemical accuracy. We also showthat by providing accurate �Hf the FERE approach can be applied for accurate predictions of the compoundthermodynamic stability or for predictions of Li-ion battery voltages.
DOI: 10.1103/PhysRevB.85.115104 PACS number(s): 71.15.Mb, 71.15.Nc, 71.20.Nr
I. INTRODUCTION
The enthalpy of formation (�Hf ) of a chemical compoundAn1 Bn2 . . . is defined as the change in enthalpy that accompa-nies the following chemical reaction:
n1 A + n2 B + · · · −→ An1 Bn2 . . . , (1)
where A, B,. . . reperesent the pure elements in their conven-tional reference phases (not free atoms) and ni stands for thenumber of atoms of the ith element in a single formula unit.In many important areas of modern materials science, thisquantity, i.e., the energy needed to form a compound out ofits elemental constituents, plays a central role. For example,�Hf of a compound, if negative, determines ranges ofchemical potentials of its elemental constituents within whichthe examined compound is thermodynamically stable. This isneeded for predicting defect concentrations in a semiconductormaterial under various realistic growth conditions1 as well asfor predicting the thermodynamic stability of new, not yet syn-thesized solid-state compounds.2,3 Furthermore, improving theperformance of Li-ion batteries or designing better materialsfor chemical hydrogen storage assumes quantitive predictionsof the energetics of chemical reactions that involve atomicLi or H2 molecules.4,5 In general, to predict accurately theenergies needed for chemical reactions to occur (enthalpies of
reactions), one ultimately needs to know the �Hf values ofall chemical compounds involved.
Enthalpies of formation, the subject of this paper, cor-respond to total energy difference between a compoundAn1 Bn2 . . . and the elemental phases A, B,.... When all pertainto similar classes of materials, such as all being metallicsolids, the calculation of �Hf can be performed within oneof the standard approximations to density functional theory(DFT), namely, the local density approximation (LDA) orthe generalized gradient approximation (GGA), which benefitfrom cancellation of errors associated with similarly imperfectdescription of bonding in An1 Bn2 . . . and its constituent solidsA, B,.... Indeed, GGA works well for �Hf of intermetalliccompounds.6 However, when some of elemental constituentsof An1 Bn2 . . . are metals and other nonmetals, as is the casefor metal chalcogenides or metal pnictides, we may notbenefit from systematic cancellation of errors in evaluatingthe �Hf in which case one typically encounters large errors.Unfortunately, simple DFT corrections such as GGA + U maybe problematic as they could apply to the compound but not tothe metallic constituents A, B, ...(mixtures of GGA + U forsome and GGA for the other have been suggested.7)
In this paper, we present a computationally inexpensivetheoretical approach based on GGA + U calculations withfitted elemental-phase reference energies (FERE) that can be
115104-11098-0121/2012/85(11)/115104(12) ©2012 American Physical Society
STEVANOVIC, LANY, ZHANG, AND ZUNGER PHYSICAL REVIEW B 85, 115104 (2012)
used for accurate predictions of the �Hf values of binary,ternary, and multinary solid compounds involving chemicalbonding between metals and nonmetals (such as pnictides,chalcogenides, halides). As we show here, by providingaccurate �Hf , the FERE approach can be applied for accuratepredictions of the compound thermodynamic stability withrespect to decomposition into the competing phases whichcan be used for predicting the existence and needed growthconditions for new/unknown compounds.2,3 Additionally, ourmethod can also be used for accurate predictions of Li-ionbattery voltages as we also show in this paper.
II. THE PROBLEM OF PREDICTING THE COMPOUNDENTHALPIES OF FORMATION
Supposed that sufficiently accurate enthalpies are available�Hf would simply be determined as the difference ofenthalpies of the right- and the left-hand side of Eq. (1). Atzero pressure and zero temperature the enthalpy of a systemequals its total energy, and the enthalpy of formation is
�Hf (An1 Bn2 . . .) = Etot(An1 Bn2 . . .
) −∑
i
ni μ0i , (2)
where Etot(An1 Bn2 . . .) is the total energy per formula unit ofa given compound and μ0
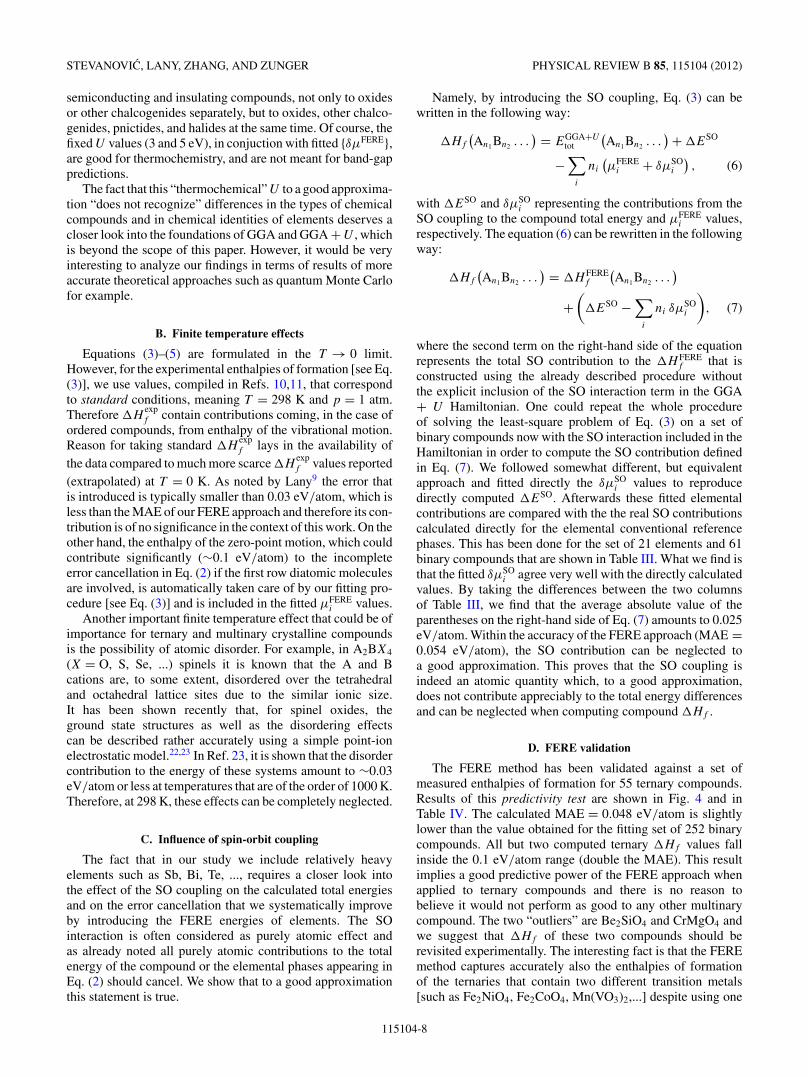
i are the total energies per atomof the elements A, B,... in their elemental reference phase.Calculating total energies to chemical accuracy (1kcal/mol ≈0.043 eV/atom) is a daunting task and is presently achievableonly within computationally very expensive configurationinteraction (CI) or quantum Monte Carlo (QMC) approachesand is restricted to systems having a relatively small number ofelectrons, like light atoms.8 From Eq. (2), we see, however, thatthe accurate prediction of �Hf does not necessitate extremelyaccurate total energies, since �Hf is not affected by asystematic error cancellation between the elemental referencephases and the compounds, i.e., any atomic total-energy errorthat does not depend on the chemical phase the atom islocated in will leave �Hf unchanged. Hence, approximatetotal-energy methods like DFT can be very successful if asystematic error cancellation occurs. For example, Wolvertonand Ozolins6 showed that when computing enthalpies offormation of intermetallic alloys, within the two standardapproximations to DFT, namely, LDA and GGA, the errorcancellation is almost exact. In this case, one calculates thetotal energy differences between chemically and physicallysimilar systems, the metallic alloy and its elemental (alsometallic) constituents. However, both LDA and GGA fail toreproduce accurately measured �Hf values of semiconduct-ing and insulating compounds as shown for the 3d transitionmetal pnictides and chalcogenides in the upper part of Fig. 1as well as in Refs. 4 and 9. In such cases, calculating �Hf
implies total energy differences between systems that areboth chemically and physically very different, the insulatingcompound versus its constituents such as pure metals andmolecular species (e.g., O2 gas). For example, GGA predicts�Hf (Al2O3) = −3.04 eV/atom,9 which deviates from theexperimental value of −3.48 eV/atom10 by +0.44 eV/atom.Similarly, both LDA and GGA predict �Hf of group IIand III sulfides too positive by +0.25 eV/atom on average.9
These errors, which exceed considerably the uncertainty of
0.6
0.4
0.2
0
0.2
0.4
0.6
|ΔH
ftheo
ry -
ΔH
fexp
. | (
eV/a
tom
) GGAFERE
Sc2 O
3
Sc Ti V Cr Mn Fe Co Ni Cu
Ti2 O
3
TiSTiN VO V
2 O3
VN Cr2 O
3
CrNMn
2 O3
MnS2
Fe2 O
3
FeSCoO
CoSCoSe
Ni2 O3
Ni3 S2
Ni3 PCu
2 OCu
2 SCu
2 SeCu
3 P
ScAsTiO 2
TiS 2TiA
sVO 2
V 2O 5
CrO 2CrS MnO
MnSFeO Fe 3
O 4
FeSeCo 3
O 4
NiOCo 3S 4
NiS NiSe
CuOCuS
CuSeCu 3
N
MAE=0.260 eV/atom
MAE=0.054 eV/atom
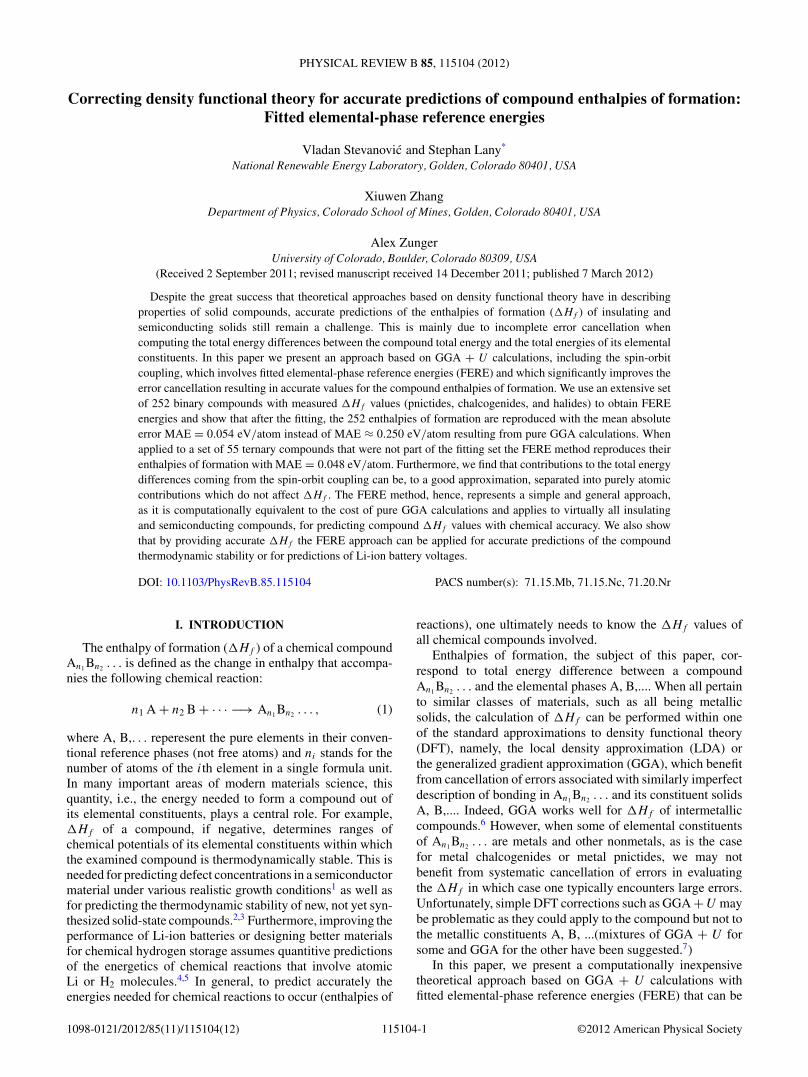
FIG. 1. (Color online) Histogram showing absolute errors ofthe GGA (upper part) and of the FERE approach (lower part) inreproducing measured enthalpies of formation10,11 for 45 binarypnictides and chalcogenides containing 3d transition metals. Dashedlines represent the mean absolute error (MAE) of the two methodscorresponding to the full set of 252 binary compounds listed inTable II. Numerical values for the compounds shown in this figureare provided in Table I.
experiments that is generally well below 0.1 eV/atom, canbe attributed to the incomplete error cancellation between thetotal energies of the compounds An1 Bn2 . . . and the elementalreference phases.9
The most striking example of the GGA failure in repro-ducing experimental �Hf are certainly binary pnictides andchalcogenides of 3d transition metals. In the upper part ofFig. 1, absolute deviations of the �Hf values calculated inGGA from the experimental ones10,11 are shown. For 21 out of45 compounds, the GGA errors are in 0.2–0.8 eV/atom rangeand for VO the error amounts to even ∼1 eV/atom. Thesedeviations are unacceptably high as they would lead to seriouserrors in predictions, both quantitatively and qualitatively. Incase of transition metal (TM) compounds, which can occur indifferent oxidation states of the TM, there exists an additionalsource of uncertainty: due to the residual self-interaction error,standard DFT tends to favor energetically the compounds withhigher TM oxidation states (lower d occupancies), which canlead to unrealistic predictions about the stability or instabilityof compounds with certain compositions.12,13 Expressingthe actual atomic chemical potential by its deviation fromthe elemental reference state, μi = μ0
i + �μi , and usingEq. (2), we obtain the relation
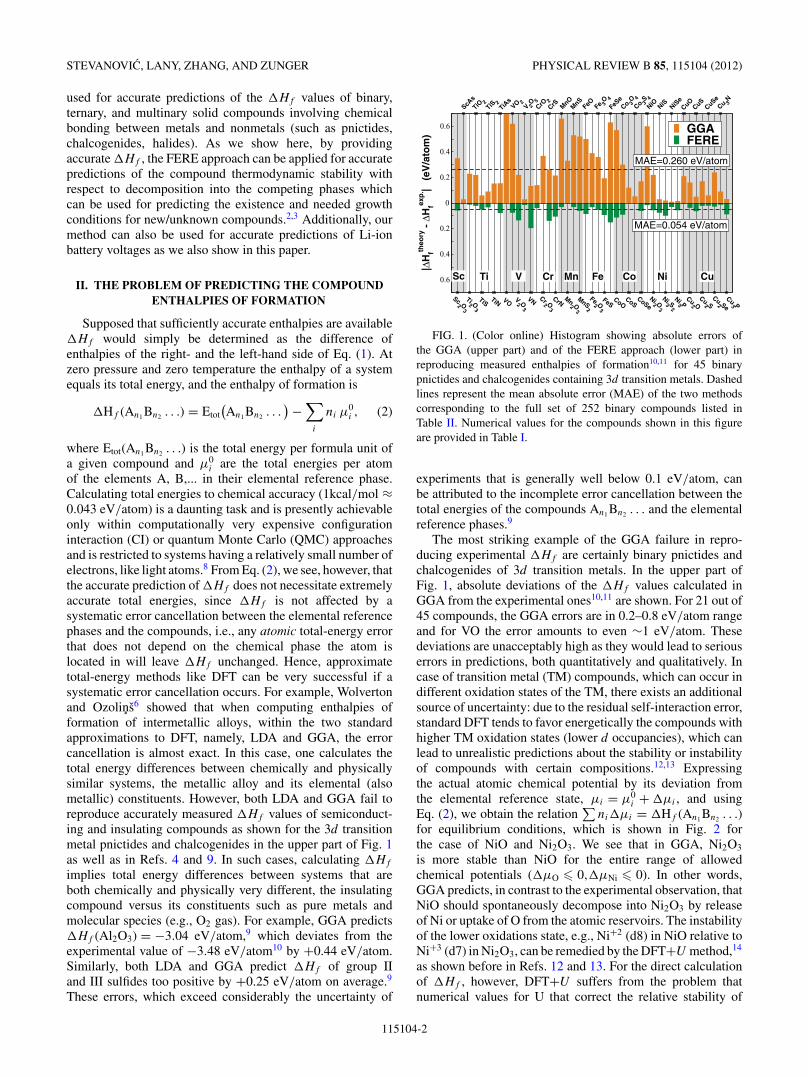
∑ni�μi = �Hf (An1 Bn2 . . .)
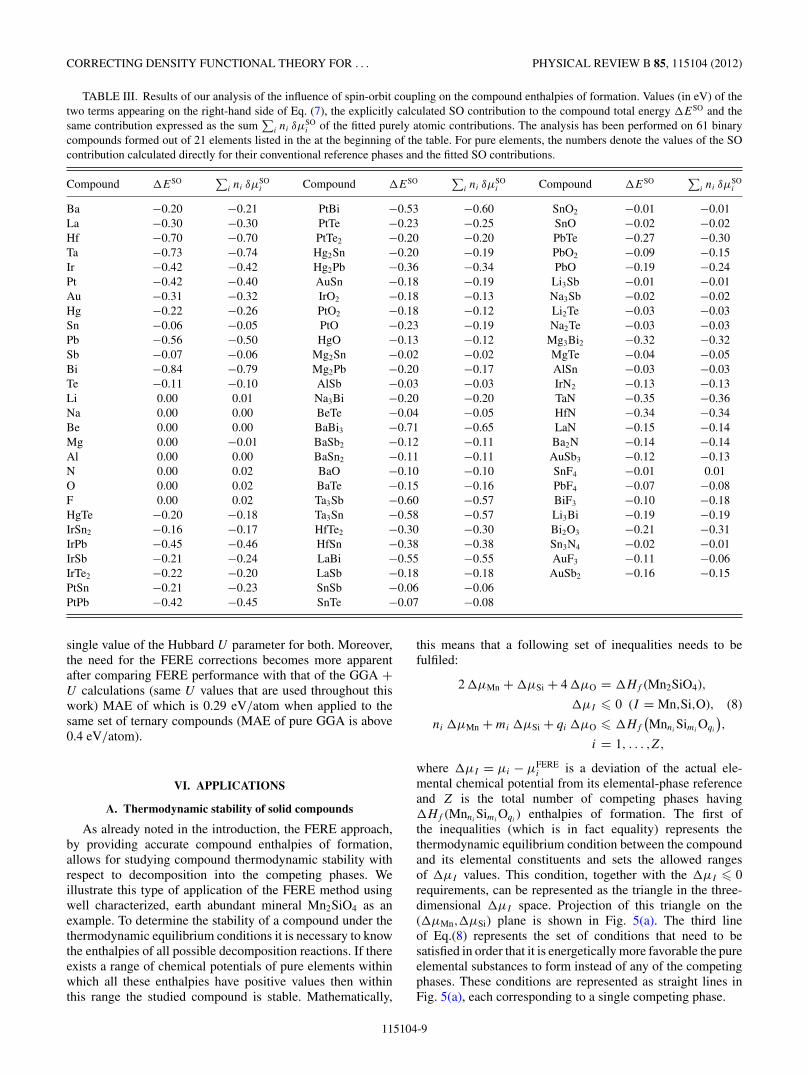
for equilibrium conditions, which is shown in Fig. 2 forthe case of NiO and Ni2O3. We see that in GGA, Ni2O3
is more stable than NiO for the entire range of allowedchemical potentials (�μO � 0,�μNi � 0). In other words,GGA predicts, in contrast to the experimental observation, thatNiO should spontaneously decompose into Ni2O3 by releaseof Ni or uptake of O from the atomic reservoirs. The instabilityof the lower oxidations state, e.g., Ni+2 (d8) in NiO relative toNi+3 (d7) in Ni2O3, can be remedied by the DFT+U method,14
as shown before in Refs. 12 and 13. For the direct calculationof �Hf , however, DFT+U suffers from the problem thatnumerical values for U that correct the relative stability of
115104-2

CORRECTING DENSITY FUNCTIONAL THEORY FOR . . . PHYSICAL REVIEW B 85, 115104 (2012)
-2 -1 0
ΔμO (eV)
-2
-1
0
ΔμN
i (eV
)
Ni2O3
NiO
Ni2O3
NiO
GGA
GGA+U(FERE)
FIG. 2. (Color online) The relation of the chemical potentials�μ of Ni and O for equilibrium with the NiO and Ni2O3 compoundphases, as calculated in GGA and in the present FERE method basedon GGA + U compound energies. In GGA, NiO is unstable againstNi2O3 for the full range of allowed chemical potentials �μ � 0. Thecorrect phase stability of NiO is recovered in the present method.
different oxidation states in the compounds lead to seriouserrors in the total energies of pure metallic elemental phaseswhich do not cancel when computing �Hf .30 On the otherhand, applying computationally much more expensive hybridfunctionals15 is shown to improve only slightly the �Hf valuesand the remaining error is still relatively large.4
Another alternative approach for computing �Hf has beenrecently proposed7. It mixes GGA and GGA + U exchange-correlation functionals by dividing compounds and elementalsubstances into groups within which the accurate descriptionis provided by either GGA or GGA + U . Enthalpies offormation are than computed by combining the total energiesobtained by GGA and GGA + U (renormalized in a specialway to be compatible with each other). In this approach,the Hubbard U values are element dependent and are fittedto a set of experimental enthalpies of reactions. It has beenshown that the measured enthalpies of formation of 49ternary oxides can be reproduced with the average error of0.045 eV/atom.
Also recently, Lany9 showed that accurate �Hf values ofinsulating and semiconducting compounds can be obtainedby fitting a set of elemental-reference energies (μ0) thatsystematically improve the error cancellation in Eq. (2). Inthe present work, we build on and extend the work of Lany9
from 14 to 50 elements, including 21 transition metals, fittedto a set of 252 measured �Hf for binary compounds, and,in addition, we address three important issues: (i) how todetermine the value of the Hubbard U needed for computingtotal energies of transition metal compounds that will lead toaccurate enthalpies of formation, (ii) to what extent the methodthat we propose can be predictive, or in other words, what is itsaccuracy when applied to compounds not used for fitting, and(iii) what is the effect of spin-orbit interactions on calculatedcompound enthalpies of formation.
Following Ref. 9, the FERE energies are obtained bysolving the linear least-squares problem
�Hexpf
(An1 Bn2 . . .
) = EGGA+Utot
(An1 Bn2 . . .
) −∑
i
ni μFEREi ,
(3)
for the elemental-phase energies μFEREi that optimally cancel
total-energy errors with the compound energies EGGA+Utot ,
which are computed using the experimental crystal structureswith the GGA + U optimized lattice vectors and atomicpositions. Our choice for the value of the Hubbard U parameter(U = 3 eV for all transition metals except Cu and Ag forwhich U = 5 eV) is discussed in details in Sec. V A. Theexperimental values �H
expf are taken from Refs. 10 and 11.
The FERE energies can be expressed as an energy shiftsδμFERE
i relative to the calculated elemental total energies
μFEREi = μGGA+U
i + δμFEREi , (4)
which can be used to express the FERE predicted heat offormation as a correction of the directly calculated �HGGA+U
f
by a sum of the energy shifts δμFEREi weighted by the
stoichiometric factors ni of the respective elements in thecompound:
�H FEREf
(An1 Bn2 . . .
) = �H GGA+Uf
(An1 Bn2 . . .
)−
∑i
ni δμFEREi . (5)
The δμFEREi values that are obtained in this work are given in
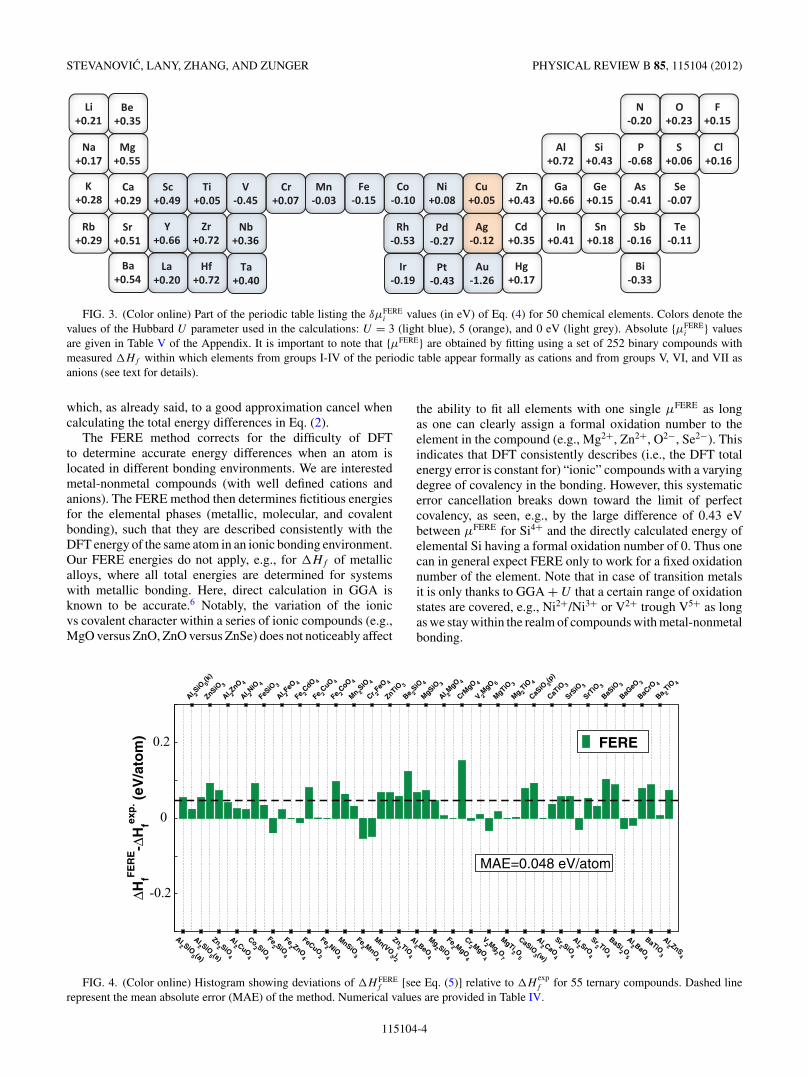
Fig. 3. We emphasize, however, that the energy shifts δμFEREi
are not meant to improve the absolute total energies for theelemental phases, but rather are constructed such to optimizethe systematic error cancellation with the total energies of thecompounds. Moreover, the GGA + U total energies of the pureelemental phases are used in this work only as a reference pointfor the use of the corrections δμFERE
i , and that, in general, onecannot expect that U = 3 is reasonable choice for pure metals.
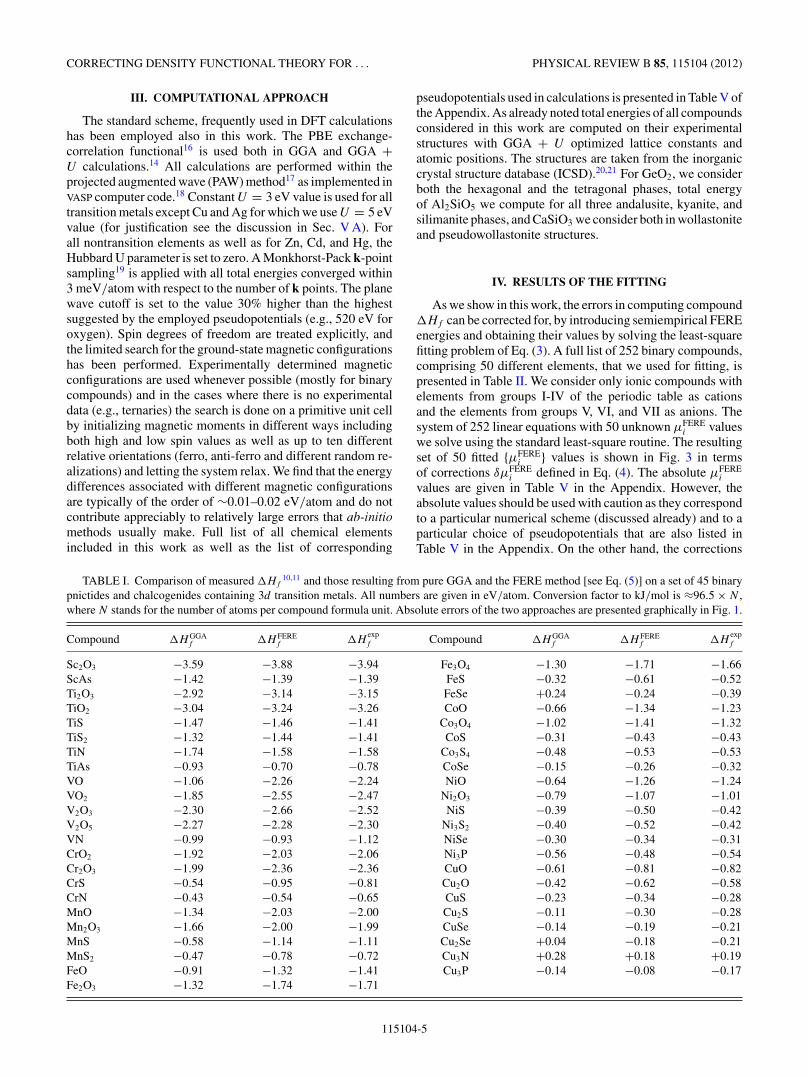
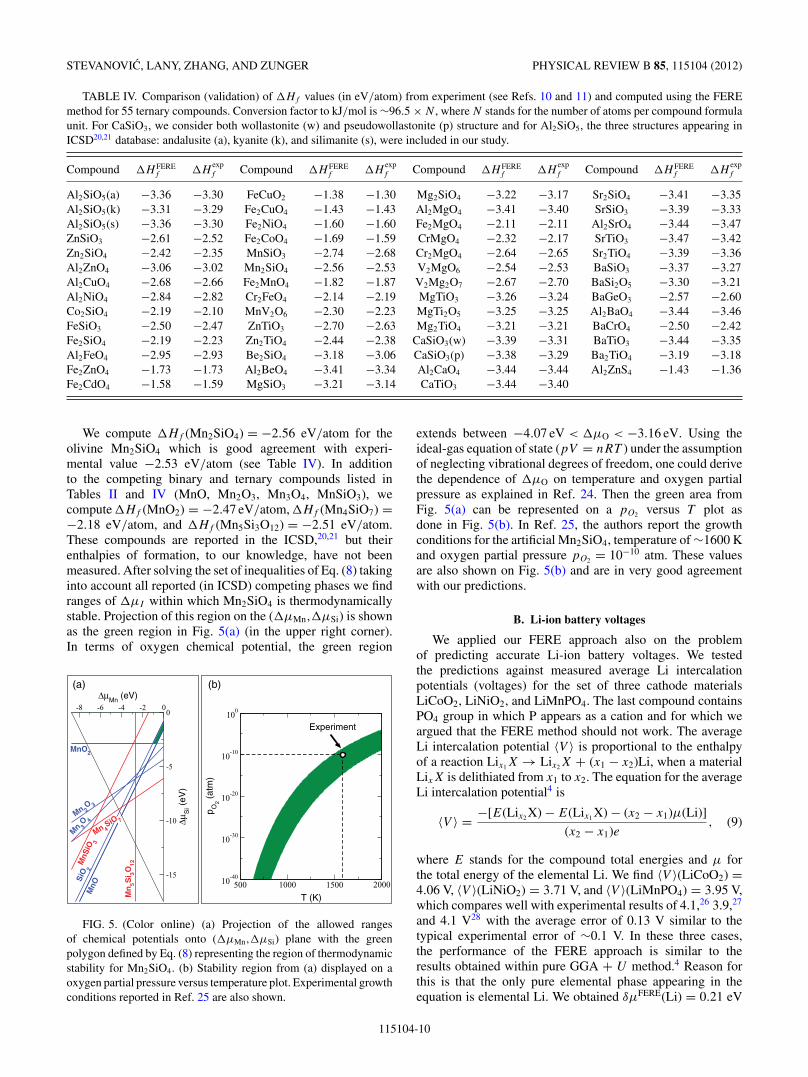
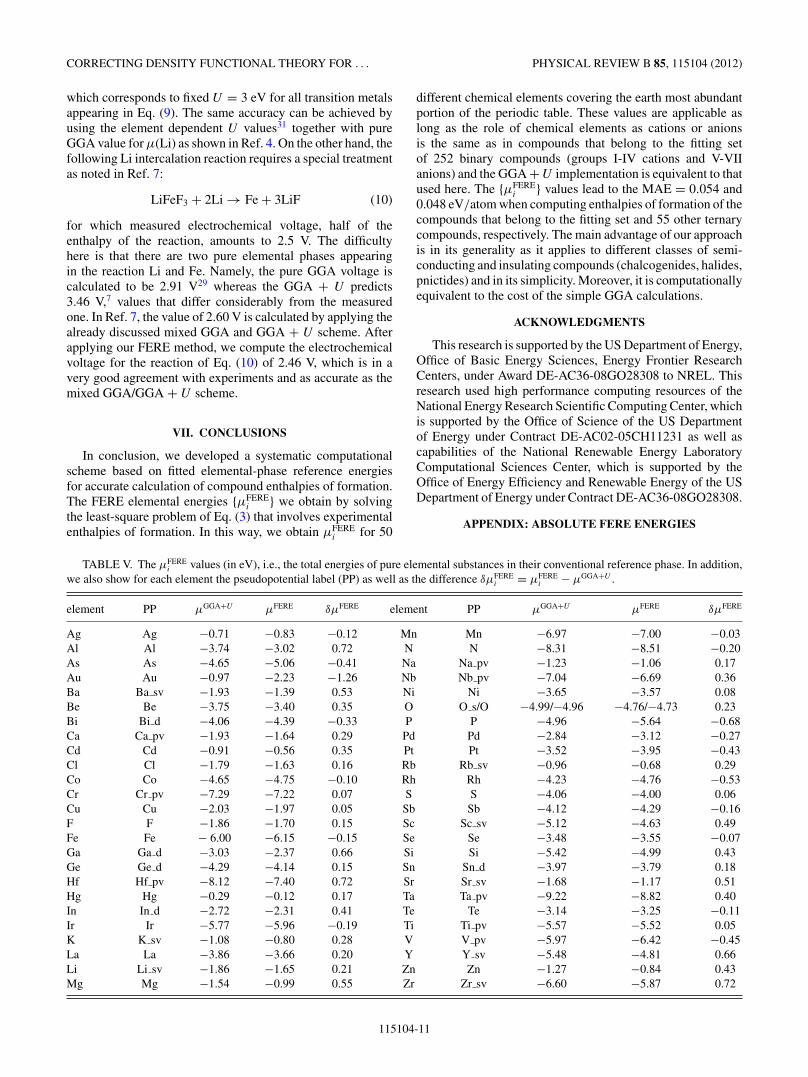
We solve the least-square problem of Eq. (3) for 50 elementsin their conventional reference phase using a set of 252binary compounds. We cover the majority of the standard,earth abundant elements including the full list of, for DFT“problematic” 3d transitions metals. This list shown in Fig. 3also includes a good portion of the 4d and 5d transitionmetals. We show that the FERE energies obtained in thisway significantly improve the �Hf of the binary compoundsleading to the mean absolute error (MAE) of 0.054 eV/atom(root-mean-square error, rms = 0.070 eV/atom). Further-more, we demonstrate the predictive power of our approachby computing the �Hf values for 55 ternary compounds withmeasured enthalpies of formation and show that the FEREapproach reproduces accurately the experimental values withMAE = 0.048 eV/atom (rms = 0.059 eV/atom) as shownin Fig. 4. Furthermore, since our set contains a number ofelements for which the contribution of spin-orbit couplingcannot be neglected, we also performed the analysis of themagnitude of this contribution to �Hf values and foundthat to a good approximation spin-orbit coupling energy ina compound can be separated in purely atomic contributions
115104-3
STEVANOVIC, LANY, ZHANG, AND ZUNGER PHYSICAL REVIEW B 85, 115104 (2012)
FIG. 3. (Color online) Part of the periodic table listing the δμFEREi values (in eV) of Eq. (4) for 50 chemical elements. Colors denote the
values of the Hubbard U parameter used in the calculations: U = 3 (light blue), 5 (orange), and 0 eV (light grey). Absolute {μFEREi } values
are given in Table V of the Appendix. It is important to note that {μFERE} are obtained by fitting using a set of 252 binary compounds withmeasured �Hf within which elements from groups I-IV of the periodic table appear formally as cations and from groups V, VI, and VII asanions (see text for details).
which, as already said, to a good approximation cancel whencalculating the total energy differences in Eq. (2).
The FERE method corrects for the difficulty of DFTto determine accurate energy differences when an atom islocated in different bonding environments. We are interestedmetal-nonmetal compounds (with well defined cations andanions). The FERE method then determines fictitious energiesfor the elemental phases (metallic, molecular, and covalentbonding), such that they are described consistently with theDFT energy of the same atom in an ionic bonding environment.Our FERE energies do not apply, e.g., for �Hf of metallicalloys, where all total energies are determined for systemswith metallic bonding. Here, direct calculation in GGA isknown to be accurate.6 Notably, the variation of the ionicvs covalent character within a series of ionic compounds (e.g.,MgO versus ZnO, ZnO versus ZnSe) does not noticeably affect
the ability to fit all elements with one single μFERE as longas one can clearly assign a formal oxidation number to theelement in the compound (e.g., Mg2+, Zn2+, O2−, Se2−). Thisindicates that DFT consistently describes (i.e., the DFT totalenergy error is constant for) “ionic” compounds with a varyingdegree of covalency in the bonding. However, this systematicerror cancellation breaks down toward the limit of perfectcovalency, as seen, e.g., by the large difference of 0.43 eVbetween μFERE for Si4+ and the directly calculated energy ofelemental Si having a formal oxidation number of 0. Thus onecan in general expect FERE only to work for a fixed oxidationnumber of the element. Note that in case of transition metalsit is only thanks to GGA + U that a certain range of oxidationstates are covered, e.g., Ni2+/Ni3+ or V2+ trough V5+ as longas we stay within the realm of compounds with metal-nonmetalbonding.
-0.2
0
0.2
ΔHfF
ER
E-Δ
Hfex
p. (
eV/a
tom
) FERE
MAE=0.048 eV/atom
FIG. 4. (Color online) Histogram showing deviations of �H FEREf [see Eq. (5)] relative to �H
expf for 55 ternary compounds. Dashed line
represent the mean absolute error (MAE) of the method. Numerical values are provided in Table IV.
115104-4
CORRECTING DENSITY FUNCTIONAL THEORY FOR . . . PHYSICAL REVIEW B 85, 115104 (2012)
III. COMPUTATIONAL APPROACH
The standard scheme, frequently used in DFT calculationshas been employed also in this work. The PBE exchange-correlation functional16 is used both in GGA and GGA +U calculations.14 All calculations are performed within theprojected augmented wave (PAW) method17 as implemented inVASP computer code.18 Constant U = 3 eV value is used for alltransition metals except Cu and Ag for which we use U = 5 eVvalue (for justification see the discussion in Sec. V A). Forall nontransition elements as well as for Zn, Cd, and Hg, theHubbard U parameter is set to zero. A Monkhorst-Pack k-pointsampling19 is applied with all total energies converged within3 meV/atom with respect to the number of k points. The planewave cutoff is set to the value 30% higher than the highestsuggested by the employed pseudopotentials (e.g., 520 eV foroxygen). Spin degrees of freedom are treated explicitly, andthe limited search for the ground-state magnetic configurationshas been performed. Experimentally determined magneticconfigurations are used whenever possible (mostly for binarycompounds) and in the cases where there is no experimentaldata (e.g., ternaries) the search is done on a primitive unit cellby initializing magnetic moments in different ways includingboth high and low spin values as well as up to ten differentrelative orientations (ferro, anti-ferro and different random re-alizations) and letting the system relax. We find that the energydifferences associated with different magnetic configurationsare typically of the order of ∼0.01–0.02 eV/atom and do notcontribute appreciably to relatively large errors that ab-initiomethods usually make. Full list of all chemical elementsincluded in this work as well as the list of corresponding
pseudopotentials used in calculations is presented in Table V ofthe Appendix. As already noted total energies of all compoundsconsidered in this work are computed on their experimentalstructures with GGA + U optimized lattice constants andatomic positions. The structures are taken from the inorganiccrystal structure database (ICSD).20,21 For GeO2, we considerboth the hexagonal and the tetragonal phases, total energyof Al2SiO5 we compute for all three andalusite, kyanite, andsilimanite phases, and CaSiO3 we consider both in wollastoniteand pseudowollastonite structures.
IV. RESULTS OF THE FITTING
As we show in this work, the errors in computing compound�Hf can be corrected for, by introducing semiempirical FEREenergies and obtaining their values by solving the least-squarefitting problem of Eq. (3). A full list of 252 binary compounds,comprising 50 different elements, that we used for fitting, ispresented in Table II. We consider only ionic compounds withelements from groups I-IV of the periodic table as cationsand the elements from groups V, VI, and VII as anions. Thesystem of 252 linear equations with 50 unknown μFERE
i valueswe solve using the standard least-square routine. The resultingset of 50 fitted {μFERE
i } values is shown in Fig. 3 in termsof corrections δμFERE
i defined in Eq. (4). The absolute μFEREi
values are given in Table V in the Appendix. However, theabsolute values should be used with caution as they correspondto a particular numerical scheme (discussed already) and to aparticular choice of pseudopotentials that are also listed inTable V in the Appendix. On the other hand, the corrections
TABLE I. Comparison of measured �Hf10,11 and those resulting from pure GGA and the FERE method [see Eq. (5)] on a set of 45 binary
pnictides and chalcogenides containing 3d transition metals. All numbers are given in eV/atom. Conversion factor to kJ/mol is ≈96.5 × N ,where N stands for the number of atoms per compound formula unit. Absolute errors of the two approaches are presented graphically in Fig. 1.
Compound �H GGAf �H FERE
f �Hexpf Compound �H GGA
f �H FEREf �H
expf
Sc2O3 −3.59 −3.88 −3.94 Fe3O4 −1.30 −1.71 −1.66ScAs −1.42 −1.39 −1.39 FeS −0.32 −0.61 −0.52Ti2O3 −2.92 −3.14 −3.15 FeSe +0.24 −0.24 −0.39TiO2 −3.04 −3.24 −3.26 CoO −0.66 −1.34 −1.23TiS −1.47 −1.46 −1.41 Co3O4 −1.02 −1.41 −1.32TiS2 −1.32 −1.44 −1.41 CoS −0.31 −0.43 −0.43TiN −1.74 −1.58 −1.58 Co3S4 −0.48 −0.53 −0.53TiAs −0.93 −0.70 −0.78 CoSe −0.15 −0.26 −0.32VO −1.06 −2.26 −2.24 NiO −0.64 −1.26 −1.24VO2 −1.85 −2.55 −2.47 Ni2O3 −0.79 −1.07 −1.01V2O3 −2.30 −2.66 −2.52 NiS −0.39 −0.50 −0.42V2O5 −2.27 −2.28 −2.30 Ni3S2 −0.40 −0.52 −0.42VN −0.99 −0.93 −1.12 NiSe −0.30 −0.34 −0.31CrO2 −1.92 −2.03 −2.06 Ni3P −0.56 −0.48 −0.54Cr2O3 −1.99 −2.36 −2.36 CuO −0.61 −0.81 −0.82CrS −0.54 −0.95 −0.81 Cu2O −0.42 −0.62 −0.58CrN −0.43 −0.54 −0.65 CuS −0.23 −0.34 −0.28MnO −1.34 −2.03 −2.00 Cu2S −0.11 −0.30 −0.28Mn2O3 −1.66 −2.00 −1.99 CuSe −0.14 −0.19 −0.21MnS −0.58 −1.14 −1.11 Cu2Se +0.04 −0.18 −0.21MnS2 −0.47 −0.78 −0.72 Cu3N +0.28 +0.18 +0.19FeO −0.91 −1.32 −1.41 Cu3P −0.14 −0.08 −0.17Fe2O3 −1.32 −1.74 −1.71
115104-5

STEVANOVIC, LANY, ZHANG, AND ZUNGER PHYSICAL REVIEW B 85, 115104 (2012)
{δμFEREi } to the GGA + U total energies of pure elements
in their conventional reference phases are more general andshould be the same for equivalent implementations of theGGA + U method (e.g., within the PAW formalism). Asshown in Fig. 3 the magnitudes of δμFERE
i are typically inthe 0–0.6 eV range as already found by Lany9 for a setof 14 main group elements. However, there are cases suchas Au, Zr, Hf, where the corrections are larger and amount
to ∼0.7–1.2 eV. Using the values tabulated in Fig. 3 theexperimental enthalpies of formation of the compounds thatbelong to the fitting set are reproduced with MAE = 0.054eV/atom (rms = 0.070 eV/atom). When translated to kJ/mol,which are the standard units used in chemistry, MAE ∼5.21 × N kJ/mol, where N stands for the number of atomsin one formula unit. Therefore the expected error of the FEREmethod for a binary compound having, for example 3 atoms
TABLE II. Comparison of �Hf values (in eV/atom) from experiment and calculated using the FERE method for 252 binary compoundsused for fitting. Experimental data are from compilations of Refs. 10 and 11. Compounds for which the deviation of �HFERE
f from experimentis more than double the MAE = 0.054 eV/atom are shown in bold letters (20 compounds). For GeO2, we consider both hexagonal (h) andtetragonal (t) phase. Conversion factor to kJ/mol is ∼96.5 × N , where N stands for the number of atoms per compound formula unit.
Compound �H FEREf �H
expf Compound �H FERE
f �Hexpf Compound �H FERE
f �Hexpf Compound �H FERE
f �Hexpf
Ag2O −0.15 −0.11 Co3S4 −0.53 −0.53 HgS −0.28 −0.30 MgCl2 −2.19 −2.21Ag2O2 −0.10 −0.06 CrF4 −2.56 −2.58 HgSe −0.27 −0.24 MgF2 −3.86 −3.88Ag2S −0.12 −0.11 CrN −0.54 −0.65 HgTe −0.20 −0.22 MgO −3.15 −3.11Ag2Se −0.08 −0.15 CrO2 −2.03 −2.07 InAs −0.25 −0.31 MgS −1.78 −1.79AlAs −0.65 −0.61 CrS −0.95 −0.81 InN −0.03 −0.10 MgSe −1.49 −1.52AlCl3 −1.85 −1.82 Cr2O3 −2.37 −2.36 InP −0.31 −0.39 MgTe −1.10 −1.08AlF3 −3.86 −3.90 CuF2 −1.86 −1.88 InS −0.78 −0.70 Mg3As2 −0.80 −0.91AlN −1.68 −1.61 CuO −0.81 −0.82 InSb −0.24 −0.16 Mg3Bi2 −0.40 −0.32AlP −0.86 −0.85 CuS −0.34 −0.28 InSe −0.70 −0.62 Mg3N2 −1.06 −0.96Al2O3 −3.46 −3.47 CuSe −0.19 −0.21 InTe −0.44 −0.50 Mg3P2 −0.92 −0.96Al2S3 −1.42 −1.50 Cu2O −0.62 −0.58 In2O3 −1.92 −1.92 Mg3Sb2 −0.64 −0.49Al2Se3 −1.09 −1.18 Cu2S −0.30 −0.28 In2S3 −0.80 −0.74 MnO −2.03 −2.00Al2Te3 −0.66 −0.68 Cu2Sb −0.00 −0.04 In2Se3 −0.64 −0.67 MnS −1.14 −1.11AuCl −0.14 −0.18 Cu2Se −0.18 −0.21 In2Te3 −0.33 −0.41 MnS2 −0.78 −0.72AuCl3 −0.29 −0.30 Cu2Te −0.06 0.07 IrO2 −0.99 −0.95 MnSb −0.15 −0.26AuF3 −1.02 −0.94 Cu3N 0.18 0.19 IrS2 −0.52 −0.48 Mn2O3 −2.00 −1.99BaO −2.85 −2.86 Cu3P −0.08 −0.17 Ir2S3 −0.43 −0.49 NaCl −2.04 −2.13BaO2 −2.15 −2.19 Cu3Sb 0.03 −0.02 KCl −2.22 −2.26 NaF −2.94 −2.97BaS −2.41 −2.38 FeF2 −2.56 −2.46 KF −2.96 −2.94 NaSb −0.37 −0.33BeO −3.05 −3.14 FeO −1.32 −1.41 KSb −0.50 −0.43 NaTe3 −0.37 −0.35BeS −1.30 −1.21 FeS −0.61 −0.52 KSb2 −0.25 −0.37 Na2O −1.44 −1.43Be3N2 −1.22 −1.22 FeSe −0.24 −0.39 K2O −1.29 −1.25 Na2O2 −1.29 −1.32CaCl2 −2.67 −2.75 Fe2O3 −1.74 −1.71 K2O2 −1.30 −1.28 Na2S −1.28 −1.26CaF2 −4.19 −4.21 Fe3O4 −1.71 −1.66 K2S −1.30 −1.31 Na2S2 −1.02 −1.03CaO −3.28 −3.29 GaAs −0.48 −0.37 K2S2 −1.15 −1.12 Na2Se −1.22 −1.18CaS −2.41 −2.45 GaCl3 −1.43 −1.36 K2Se −1.28 −1.36 Na2Se2 −0.92 −0.97Ca3N2 −0.95 −0.91 GaF3 −2.90 −3.01 K3As −0.45 −0.48 Na3As −0.50 −0.53Ca3P2 −1.26 −1.22 GaN −0.72 −0.81 K3Bi −0.52 −0.60 Na3Bi −0.48 −0.46CdCl2 −1.35 −1.35 GaP −0.63 −0.53 K3Sb −0.56 −0.47 Na3Sb −0.58 −0.53CdF2 −2.43 −2.42 GaS −1.05 −1.09 K5Sb4 −0.53 −0.44 NbN −1.17 −1.22CdO −1.33 −1.34 GaSb −0.40 −0.22 LaCl3 −2.74 −2.78 NbO2 −2.79 −2.75CdS −0.88 −0.78 GaSe −0.89 −0.83 LaN −1.43 −1.57 Nb2O5 −2.84 −2.81CdSb −0.13 −0.07 Ga2O3 −2.26 −2.26 LaS −2.42 −2.36 NiF2 −2.25 −2.25CdSe −0.77 −0.75 Ga2S3 −1.00 −1.07 La2O3 −3.77 −3.72 NiO −1.26 −1.24CdTe −0.57 −0.48 Ga2Se3 −0.80 −0.85 La2S3 −2.48 −2.51 NiS −0.51 −0.43Cd3As2 −0.15 −0.08 GeO2(h) −1.86 −1.90 La2Te3 −1.74 −1.63 NiSb −0.27 −0.34Cd3N2 0.41 0.33 GeO2(t) −1.92 −2.00 LiCl −2.05 −2.12 NiSe −0.34 −0.31Cd3P2 −0.17 −0.24 GeS −0.54 −0.39 LiF −3.17 −3.19 NiTe −0.22 −0.28CoF2 −2.29 −2.39 GeS2 −0.58 −0.66 Li2O −2.07 −2.07 Ni2O3 −1.07 −1.01CoF3 −2.15 −2.10 GeSe −0.42 −0.48 Li2O2 −1.63 −1.64 Ni2Te3 −0.21 −0.30CoO −1.34 −1.23 Ge3N4 −0.14 −0.09 Li2S −1.55 −1.52 Ni3P −0.48 −0.54CoS −0.43 −0.43 HfN −1.90 −1.91 Li2Se −1.41 −1.45 Ni3S2 −0.52 −0.42CoSb3 0.01 −0.17 HfO2 −3.96 −3.95 Li3Bi −0.64 −0.60 PdCl2 −0.65 −0.69CoSe −0.26 −0.32 HgCl2 −0.80 −0.77 Li3N −0.51 −0.43 PdO −0.58 −0.44Co3O4 −1.41 −1.32 HgO −0.47 −0.47 Li3Sb −0.78 −0.83 PdS −0.37 −0.39
115104-6

CORRECTING DENSITY FUNCTIONAL THEORY FOR . . . PHYSICAL REVIEW B 85, 115104 (2012)
TABLE II. (Continued.)
Compound �H FEREf �H
expf Compound �H FERE
f �Hexpf Compound �H FERE
f �Hexpf Compound �H FERE
f �Hexpf
PdS2 −0.32 −0.28 Rh2S3 −0.48 −0.54 Sr2Bi −1.00 −1.08 YCl3 −2.65 −2.59Pd4S −0.07 −0.14 ScAs −1.39 −1.39 Sr2Sb −1.15 −1.11 YF3 −4.45 −4.45PtO −0.37 −0.37 ScCl3 −2.44 −2.40 TaN −1.25 −1.30 Y2O3 −3.92 −3.95PtO2 −0.57 −0.57 ScF3 −4.26 −4.22 TaS2 −1.29 −1.22 ZnCl2 −1.43 −1.43PtS −0.41 −0.42 Sc2O3 −3.88 −3.94 TiAs −0.70 −0.78 ZnF2 −2.57 −2.64PtS2 −0.34 −0.38 SiO2 −3.06 −3.13 TiCl4 −1.78 −1.70 ZnO −1.78 −1.81Pt3O4 −0.45 −0.40 SiS2 −0.91 −0.88 TiN −1.58 −1.58 ZnP2 −0.23 −0.21RbCl −2.20 −2.26 SiSe2 −0.55 −0.61 TiO2 −3.24 −3.26 ZnS −1.09 −1.07RbF −2.90 −2.89 Si3N4 −1.18 −1.10 TiS −1.46 −1.41 ZnSb −0.15 −0.08RbSb −0.49 −0.52 SnO −1.51 −1.48 TiS2 −1.44 −1.41 ZnSe −0.89 −0.85RbSb2 −0.25 −0.35 SnO2 −1.86 −1.97 Ti2O3 −3.14 −3.15 ZnTe −0.62 −0.61Rb2O −1.17 −1.17 SnS −0.61 −0.57 VF4 −3.03 −2.91 Zn3As2 −0.21 −0.28Rb2O2 −1.24 −1.22 SnS2 −0.53 −0.53 VN −0.93 −1.13 Zn3N2 −0.07 −0.05Rb2S −1.24 −1.25 SnSe −0.52 −0.47 VO −2.24 −2.24 Zn3P2 −0.35 −0.33Rb3Sb −0.54 −0.45 SnSe2 −0.37 −0.43 VO2 −2.55 −2.47 ZrN −1.91 −1.89RhCl3 −0.83 −0.78 SrO −3.11 −3.07 V2O3 −2.67 −2.53 ZrO2 −3.81 −3.80RhO2 −0.84 −0.85 SrO2 −2.19 −2.19 V2O5 −2.28 −2.29 ZrS2 −1.93 −1.96Rh2O3 −0.87 −0.84 SrS −2.47 −2.45 YAs −1.67 −1.68 Mn3O4 −2.08 −2.05
per formula unit amounts to ∼15 kJ/mol. Table II lists theFERE enthalpies of formation for our set of binary compoundstogether with the experimental values. There is a relativelysmall fraction of binary compounds belonging to the fittingset, 20 out of 252 (shown in bold), for which the remainingFERE error exceeds two times the MAE value. These errorsare not very large and are all in 0.1–0.2 eV/atom range.For some of these larger errors, there is a relatively simplephysical explanation. In seven out these 20 compounds, theanion is either Sb or As. Both elements appear in the fittingset in different oxidation states and the errors are due toU = 0 eV value as already discussed. Similarly, Sn for whichalso U = 0 eV appears in 2+ and 4+ oxidation states anda somewhat larger 0.110 eV/atom error appears for SnO2.For the other 12 cases, we suggest possible experimentalreconsideration of their �Hf . Again, these errors are notexceedingly large compared to those of pure GGA or GGA +U , but it is certainly possible that one inaccurate experimentalvalue drives the fit and affects the rest of the results (e.g. in thecase of vanadium). However, as already mentioned, most ofthese errors fall in the ∼0.1 eV/atom range leading to a rathergood overall performance of the FERE method. Comparisonof the performance of the FERE method with GGA on asubset of binary pnictides and chalcogenides containing 3d
transition metals is shown graphically in Fig. 1 and numericallyin Table I.
The work from Ref. 7 (mixing GGA and GGA+U ) relies onthe previous work of Wang et al.13 and assumes the following:(i) it uses the value of the oxygen energy (in our languageμ0
O) that has been fitted by Wang et al. to reproduce measuredenthalpies of formation of six main-group metal oxides (CaO,Li2O, MgO, Al2O3, SiO2, and Na2O) using pure GGA totalenergies for metals, (ii) the fitted μ0
O is then employed in fittingthe element dependent Hubbard U parameters for transitionmetals to reproduce measured enthalpies of chemical reactionsin which given transition metal M changes its oxidationstate MOx + y−x
2 O2 → MOy . In order to calculate �Hf , the
GGA + U energy is taken for compounds with localizedorbitals, but the GGA energy for delocalized orbitals in themetallic phase. In order to make the latter compatible withthe GGA + U energy, a correction based on experimentaldata is applied to the GGA energy. In essence, the maindifference between both methods is that in Jain et al. fit onlythe energies of the O2 molecule and of the transition metals,whereas we fit all elemental energies, including main groupmetals. A secondary difference is that the approach of Jainet al., as implemented in practice, uses an element-dependentU , whereas we find as a result of our calculations that auniform U value (except for Ag and Cu) is sufficient in theFERE approach to correct DFT errors relative to experimentalformation enthalpies of ∼250 binary compounds. While thetwo approaches are obviously closely related, we think thatour approach is both simpler and more consistent.
V. DISCUSSION
A. The value of the Hubbard U
Values for the Hubbard U parameter that we use requirea more detailed discussion. Initially, we allowed the HubbardU parameters to depend on the chemical identity of transitionmetals and we treated them as fitting parameters to yield thecorrect crossing points between different stoichiometries ofTM oxides, i.e., the O chemical potential at which the stablephase changes (see Fig. 2). Except for Cu and Ag, we obtainedvalues for U between 2.5 and 3.5 eV for all TM. Since thevariation of U of ±0.5 eV resulting from the fit lies within therange that could result from the uncertainty of the experimentaldata, we used a constant value of U = 3.0 eV for all TM, exceptfor Cu and Ag for which we use U = 5 eV. For the compoundsof the group IIb elements Zn, Cd, and Hg as well as for allmain group elements, we use GGA without DFT + U .
Fixing the U values is beneficial as it allows to de-velop a scheme that can be applied to different families of
115104-7
STEVANOVIC, LANY, ZHANG, AND ZUNGER PHYSICAL REVIEW B 85, 115104 (2012)
semiconducting and insulating compounds, not only to oxidesor other chalcogenides separately, but to oxides, other chalco-genides, pnictides, and halides at the same time. Of course, thefixed U values (3 and 5 eV), in conjuction with fitted {δμFERE},are good for thermochemistry, and are not meant for band-gappredictions.
The fact that this “thermochemical” U to a good approxima-tion “does not recognize” differences in the types of chemicalcompounds and in chemical identities of elements deserves acloser look into the foundations of GGA and GGA + U , whichis beyond the scope of this paper. However, it would be veryinteresting to analyze our findings in terms of results of moreaccurate theoretical approaches such as quantum Monte Carlofor example.
B. Finite temperature effects
Equations (3)–(5) are formulated in the T → 0 limit.However, for the experimental enthalpies of formation [see Eq.(3)], we use values, compiled in Refs. 10,11, that correspondto standard conditions, meaning T = 298 K and p = 1 atm.Therefore �H
expf contain contributions coming, in the case of
ordered compounds, from enthalpy of the vibrational motion.Reason for taking standard �H
expf lays in the availability of
the data compared to much more scarce �Hexpf values reported
(extrapolated) at T = 0 K. As noted by Lany9 the error thatis introduced is typically smaller than 0.03 eV/atom, which isless than the MAE of our FERE approach and therefore its con-tribution is of no significance in the context of this work. On theother hand, the enthalpy of the zero-point motion, which couldcontribute significantly (∼0.1 eV/atom) to the incompleteerror cancellation in Eq. (2) if the first row diatomic moleculesare involved, is automatically taken care of by our fitting pro-cedure [see Eq. (3)] and is included in the fitted μFERE
i values.Another important finite temperature effect that could be of
importance for ternary and multinary crystalline compoundsis the possibility of atomic disorder. For example, in A2BX4
(X = O, S, Se, ...) spinels it is known that the A and Bcations are, to some extent, disordered over the tetrahedraland octahedral lattice sites due to the similar ionic size.It has been shown recently that, for spinel oxides, theground state structures as well as the disordering effectscan be described rather accurately using a simple point-ionelectrostatic model.22,23 In Ref. 23, it is shown that the disordercontribution to the energy of these systems amount to ∼0.03eV/atom or less at temperatures that are of the order of 1000 K.Therefore, at 298 K, these effects can be completely neglected.
C. Influence of spin-orbit coupling
The fact that in our study we include relatively heavyelements such as Sb, Bi, Te, ..., requires a closer look intothe effect of the SO coupling on the calculated total energiesand on the error cancellation that we systematically improveby introducing the FERE energies of elements. The SOinteraction is often considered as purely atomic effect andas already noted all purely atomic contributions to the totalenergy of the compound or the elemental phases appearing inEq. (2) should cancel. We show that to a good approximationthis statement is true.
Namely, by introducing the SO coupling, Eq. (3) can bewritten in the following way:
�Hf
(An1 Bn2 . . .
) = EGGA+Utot
(An1 Bn2 . . .
) + �ESO
−∑
i
ni
(μFERE
i + δμSOi
), (6)
with �ESO and δμSOi representing the contributions from the
SO coupling to the compound total energy and μFEREi values,
respectively. The equation (6) can be rewritten in the followingway:
�Hf
(An1 Bn2 . . .
) = �H FEREf
(An1 Bn2 . . .
)
+(
�ESO −∑
i
ni δμSOi
), (7)
where the second term on the right-hand side of the equationrepresents the total SO contribution to the �H FERE
f that isconstructed using the already described procedure withoutthe explicit inclusion of the SO interaction term in the GGA+ U Hamiltonian. One could repeat the whole procedureof solving the least-square problem of Eq. (3) on a set ofbinary compounds now with the SO interaction included in theHamiltonian in order to compute the SO contribution definedin Eq. (7). We followed somewhat different, but equivalentapproach and fitted directly the δμSO
i values to reproducedirectly computed �ESO. Afterwards these fitted elementalcontributions are compared with the the real SO contributionscalculated directly for the elemental conventional referencephases. This has been done for the set of 21 elements and 61binary compounds that are shown in Table III. What we find isthat the fitted δμSO
i agree very well with the directly calculatedvalues. By taking the differences between the two columnsof Table III, we find that the average absolute value of theparentheses on the right-hand side of Eq. (7) amounts to 0.025eV/atom. Within the accuracy of the FERE approach (MAE =0.054 eV/atom), the SO contribution can be neglected toa good approximation. This proves that the SO coupling isindeed an atomic quantity which, to a good approximation,does not contribute appreciably to the total energy differencesand can be neglected when computing compound �Hf .
D. FERE validation
The FERE method has been validated against a set ofmeasured enthalpies of formation for 55 ternary compounds.Results of this predictivity test are shown in Fig. 4 and inTable IV. The calculated MAE = 0.048 eV/atom is slightlylower than the value obtained for the fitting set of 252 binarycompounds. All but two computed ternary �Hf values fallinside the 0.1 eV/atom range (double the MAE). This resultimplies a good predictive power of the FERE approach whenapplied to ternary compounds and there is no reason tobelieve it would not perform as good to any other multinarycompound. The two “outliers” are Be2SiO4 and CrMgO4 andwe suggest that �Hf of these two compounds should berevisited experimentally. The interesting fact is that the FEREmethod captures accurately also the enthalpies of formationof the ternaries that contain two different transition metals[such as Fe2NiO4, Fe2CoO4, Mn(VO3)2,...] despite using one
115104-8
CORRECTING DENSITY FUNCTIONAL THEORY FOR . . . PHYSICAL REVIEW B 85, 115104 (2012)
TABLE III. Results of our analysis of the influence of spin-orbit coupling on the compound enthalpies of formation. Values (in eV) of thetwo terms appearing on the right-hand side of Eq. (7), the explicitly calculated SO contribution to the compound total energy �ESO and thesame contribution expressed as the sum
∑i ni δμ
SOi of the fitted purely atomic contributions. The analysis has been performed on 61 binary
compounds formed out of 21 elements listed in the at the beginning of the table. For pure elements, the numbers denote the values of the SOcontribution calculated directly for their conventional reference phases and the fitted SO contributions.
Compound �ESO∑
i ni δμSOi Compound �ESO
∑i ni δμ
SOi Compound �ESO
∑i ni δμ
SOi
Ba −0.20 −0.21 PtBi −0.53 −0.60 SnO2 −0.01 −0.01La −0.30 −0.30 PtTe −0.23 −0.25 SnO −0.02 −0.02Hf −0.70 −0.70 PtTe2 −0.20 −0.20 PbTe −0.27 −0.30Ta −0.73 −0.74 Hg2Sn −0.20 −0.19 PbO2 −0.09 −0.15Ir −0.42 −0.42 Hg2Pb −0.36 −0.34 PbO −0.19 −0.24Pt −0.42 −0.40 AuSn −0.18 −0.19 Li3Sb −0.01 −0.01Au −0.31 −0.32 IrO2 −0.18 −0.13 Na3Sb −0.02 −0.02Hg −0.22 −0.26 PtO2 −0.18 −0.12 Li2Te −0.03 −0.03Sn −0.06 −0.05 PtO −0.23 −0.19 Na2Te −0.03 −0.03Pb −0.56 −0.50 HgO −0.13 −0.12 Mg3Bi2 −0.32 −0.32Sb −0.07 −0.06 Mg2Sn −0.02 −0.02 MgTe −0.04 −0.05Bi −0.84 −0.79 Mg2Pb −0.20 −0.17 AlSn −0.03 −0.03Te −0.11 −0.10 AlSb −0.03 −0.03 IrN2 −0.13 −0.13Li 0.00 0.01 Na3Bi −0.20 −0.20 TaN −0.35 −0.36Na 0.00 0.00 BeTe −0.04 −0.05 HfN −0.34 −0.34Be 0.00 0.00 BaBi3 −0.71 −0.65 LaN −0.15 −0.14Mg 0.00 −0.01 BaSb2 −0.12 −0.11 Ba2N −0.14 −0.14Al 0.00 0.00 BaSn2 −0.11 −0.11 AuSb3 −0.12 −0.13N 0.00 0.02 BaO −0.10 −0.10 SnF4 −0.01 0.01O 0.00 0.02 BaTe −0.15 −0.16 PbF4 −0.07 −0.08F 0.00 0.02 Ta3Sb −0.60 −0.57 BiF3 −0.10 −0.18HgTe −0.20 −0.18 Ta3Sn −0.58 −0.57 Li3Bi −0.19 −0.19IrSn2 −0.16 −0.17 HfTe2 −0.30 −0.30 Bi2O3 −0.21 −0.31IrPb −0.45 −0.46 HfSn −0.38 −0.38 Sn3N4 −0.02 −0.01IrSb −0.21 −0.24 LaBi −0.55 −0.55 AuF3 −0.11 −0.06IrTe2 −0.22 −0.20 LaSb −0.18 −0.18 AuSb2 −0.16 −0.15PtSn −0.21 −0.23 SnSb −0.06 −0.06PtPb −0.42 −0.45 SnTe −0.07 −0.08
single value of the Hubbard U parameter for both. Moreover,the need for the FERE corrections becomes more apparentafter comparing FERE performance with that of the GGA +U calculations (same U values that are used throughout thiswork) MAE of which is 0.29 eV/atom when applied to thesame set of ternary compounds (MAE of pure GGA is above0.4 eV/atom).
VI. APPLICATIONS
A. Thermodynamic stability of solid compounds
As already noted in the introduction, the FERE approach,by providing accurate compound enthalpies of formation,allows for studying compound thermodynamic stability withrespect to decomposition into the competing phases. Weillustrate this type of application of the FERE method usingwell characterized, earth abundant mineral Mn2SiO4 as anexample. To determine the stability of a compound under thethermodynamic equilibrium conditions it is necessary to knowthe enthalpies of all possible decomposition reactions. If thereexists a range of chemical potentials of pure elements withinwhich all these enthalpies have positive values then withinthis range the studied compound is stable. Mathematically,
this means that a following set of inequalities needs to befulfiled:
2 �μMn + �μSi + 4 �μO = �Hf (Mn2SiO4),
�μI � 0 (I = Mn,Si,O), (8)
ni �μMn + mi �μSi + qi �μO � �Hf
(Mnni
SimiOqi
),
i = 1, . . . ,Z,
where �μI = μi − μFEREi is a deviation of the actual ele-
mental chemical potential from its elemental-phase referenceand Z is the total number of competing phases having�Hf (Mnni
SimiOqi
) enthalpies of formation. The first ofthe inequalities (which is in fact equality) represents thethermodynamic equilibrium condition between the compoundand its elemental constituents and sets the allowed rangesof �μI values. This condition, together with the �μI � 0requirements, can be represented as the triangle in the three-dimensional �μI space. Projection of this triangle on the(�μMn,�μSi) plane is shown in Fig. 5(a). The third lineof Eq.(8) represents the set of conditions that need to besatisfied in order that it is energetically more favorable the pureelemental substances to form instead of any of the competingphases. These conditions are represented as straight lines inFig. 5(a), each corresponding to a single competing phase.
115104-9
STEVANOVIC, LANY, ZHANG, AND ZUNGER PHYSICAL REVIEW B 85, 115104 (2012)
TABLE IV. Comparison (validation) of �Hf values (in eV/atom) from experiment (see Refs. 10 and 11) and computed using the FEREmethod for 55 ternary compounds. Conversion factor to kJ/mol is ∼96.5 × N , where N stands for the number of atoms per compound formulaunit. For CaSiO3, we consider both wollastonite (w) and pseudowollastonite (p) structure and for Al2SiO5, the three structures appearing inICSD20,21 database: andalusite (a), kyanite (k), and silimanite (s), were included in our study.
Compound �H FEREf �H
expf Compound �H FERE
f �Hexpf Compound �H FERE
f �Hexpf Compound �H FERE
f �Hexpf
Al2SiO5(a) −3.36 −3.30 FeCuO2 −1.38 −1.30 Mg2SiO4 −3.22 −3.17 Sr2SiO4 −3.41 −3.35Al2SiO5(k) −3.31 −3.29 Fe2CuO4 −1.43 −1.43 Al2MgO4 −3.41 −3.40 SrSiO3 −3.39 −3.33Al2SiO5(s) −3.36 −3.30 Fe2NiO4 −1.60 −1.60 Fe2MgO4 −2.11 −2.11 Al2SrO4 −3.44 −3.47ZnSiO3 −2.61 −2.52 Fe2CoO4 −1.69 −1.59 CrMgO4 −2.32 −2.17 SrTiO3 −3.47 −3.42Zn2SiO4 −2.42 −2.35 MnSiO3 −2.74 −2.68 Cr2MgO4 −2.64 −2.65 Sr2TiO4 −3.39 −3.36Al2ZnO4 −3.06 −3.02 Mn2SiO4 −2.56 −2.53 V2MgO6 −2.54 −2.53 BaSiO3 −3.37 −3.27Al2CuO4 −2.68 −2.66 Fe2MnO4 −1.82 −1.87 V2Mg2O7 −2.67 −2.70 BaSi2O5 −3.30 −3.21Al2NiO4 −2.84 −2.82 Cr2FeO4 −2.14 −2.19 MgTiO3 −3.26 −3.24 BaGeO3 −2.57 −2.60Co2SiO4 −2.19 −2.10 MnV2O6 −2.30 −2.23 MgTi2O5 −3.25 −3.25 Al2BaO4 −3.44 −3.46FeSiO3 −2.50 −2.47 ZnTiO3 −2.70 −2.63 Mg2TiO4 −3.21 −3.21 BaCrO4 −2.50 −2.42Fe2SiO4 −2.19 −2.23 Zn2TiO4 −2.44 −2.38 CaSiO3(w) −3.39 −3.31 BaTiO3 −3.44 −3.35Al2FeO4 −2.95 −2.93 Be2SiO4 −3.18 −3.06 CaSiO3(p) −3.38 −3.29 Ba2TiO4 −3.19 −3.18Fe2ZnO4 −1.73 −1.73 Al2BeO4 −3.41 −3.34 Al2CaO4 −3.44 −3.44 Al2ZnS4 −1.43 −1.36Fe2CdO4 −1.58 −1.59 MgSiO3 −3.21 −3.14 CaTiO3 −3.44 −3.40
We compute �Hf (Mn2SiO4) = −2.56 eV/atom for theolivine Mn2SiO4 which is good agreement with experi-mental value −2.53 eV/atom (see Table IV). In additionto the competing binary and ternary compounds listed inTables II and IV (MnO, Mn2O3, Mn3O4, MnSiO3), wecompute �Hf (MnO2) = −2.47 eV/atom, �Hf (Mn4SiO7) =−2.18 eV/atom, and �Hf (Mn5Si3O12) = −2.51 eV/atom.These compounds are reported in the ICSD,20,21 but theirenthalpies of formation, to our knowledge, have not beenmeasured. After solving the set of inequalities of Eq. (8) takinginto account all reported (in ICSD) competing phases we findranges of �μI within which Mn2SiO4 is thermodynamicallystable. Projection of this region on the (�μMn,�μSi) is shownas the green region in Fig. 5(a) (in the upper right corner).In terms of oxygen chemical potential, the green region
-8 -6 -4 -2 0
ΔμMn (eV)
-15
-10
-5
0
ΔμS
i (eV
)
MnO
MnO2
Mn 2O 3
Mn 3
O 4
SiO
2M
nSiO
3
Mn 4SiO 7
Mn
5Si 3O
12
500 1000 1500 2000
T (K)
10-40
10-30
10-20
10-10
100
p O2 (
atm
)
Experiment
(b)(a)
FIG. 5. (Color online) (a) Projection of the allowed rangesof chemical potentials onto (�μMn,�μSi) plane with the greenpolygon defined by Eq. (8) representing the region of thermodynamicstability for Mn2SiO4. (b) Stability region from (a) displayed on aoxygen partial pressure versus temperature plot. Experimental growthconditions reported in Ref. 25 are also shown.
extends between −4.07 eV < �μO < −3.16 eV. Using theideal-gas equation of state (pV = nRT ) under the assumptionof neglecting vibrational degrees of freedom, one could derivethe dependence of �μO on temperature and oxygen partialpressure as explained in Ref. 24. Then the green area fromFig. 5(a) can be represented on a pO2 versus T plot asdone in Fig. 5(b). In Ref. 25, the authors report the growthconditions for the artificial Mn2SiO4, temperature of ∼1600 Kand oxygen partial pressure pO2 = 10−10 atm. These valuesare also shown on Fig. 5(b) and are in very good agreementwith our predictions.
B. Li-ion battery voltages
We applied our FERE approach also on the problemof predicting accurate Li-ion battery voltages. We testedthe predictions against measured average Li intercalationpotentials (voltages) for the set of three cathode materialsLiCoO2, LiNiO2, and LiMnPO4. The last compound containsPO4 group in which P appears as a cation and for which weargued that the FERE method should not work. The averageLi intercalation potential 〈V 〉 is proportional to the enthalpyof a reaction Lix1X → Lix2X + (x1 − x2)Li, when a materialLixX is delithiated from x1 to x2. The equation for the averageLi intercalation potential4 is
〈V 〉 = −[E(Lix2 X) − E(Lix1 X) − (x2 − x1)μ(Li)]
(x2 − x1)e, (9)
where E stands for the compound total energies and μ forthe total energy of the elemental Li. We find 〈V 〉(LiCoO2) =4.06 V, 〈V 〉(LiNiO2) = 3.71 V, and 〈V 〉(LiMnPO4) = 3.95 V,which compares well with experimental results of 4.1,26 3.9,27
and 4.1 V28 with the average error of 0.13 V similar to thetypical experimental error of ∼0.1 V. In these three cases,the performance of the FERE approach is similar to theresults obtained within pure GGA + U method.4 Reason forthis is that the only pure elemental phase appearing in theequation is elemental Li. We obtained δμFERE(Li) = 0.21 eV
115104-10
CORRECTING DENSITY FUNCTIONAL THEORY FOR . . . PHYSICAL REVIEW B 85, 115104 (2012)
which corresponds to fixed U = 3 eV for all transition metalsappearing in Eq. (9). The same accuracy can be achieved byusing the element dependent U values31 together with pureGGA value for μ(Li) as shown in Ref. 4. On the other hand, thefollowing Li intercalation reaction requires a special treatmentas noted in Ref. 7:
LiFeF3 + 2Li → Fe + 3LiF (10)
for which measured electrochemical voltage, half of theenthalpy of the reaction, amounts to 2.5 V. The difficultyhere is that there are two pure elemental phases appearingin the reaction Li and Fe. Namely, the pure GGA voltage iscalculated to be 2.91 V29 whereas the GGA + U predicts3.46 V,7 values that differ considerably from the measuredone. In Ref. 7, the value of 2.60 V is calculated by applying thealready discussed mixed GGA and GGA + U scheme. Afterapplying our FERE method, we compute the electrochemicalvoltage for the reaction of Eq. (10) of 2.46 V, which is in avery good agreement with experiments and as accurate as themixed GGA/GGA + U scheme.
VII. CONCLUSIONS
In conclusion, we developed a systematic computationalscheme based on fitted elemental-phase reference energiesfor accurate calculation of compound enthalpies of formation.The FERE elemental energies {μFERE
i } we obtain by solvingthe least-square problem of Eq. (3) that involves experimentalenthalpies of formation. In this way, we obtain μFERE
i for 50
different chemical elements covering the earth most abundantportion of the periodic table. These values are applicable aslong as the role of chemical elements as cations or anionsis the same as in compounds that belong to the fitting setof 252 binary compounds (groups I-IV cations and V-VIIanions) and the GGA + U implementation is equivalent to thatused here. The {μFERE
i } values lead to the MAE = 0.054 and0.048 eV/atom when computing enthalpies of formation of thecompounds that belong to the fitting set and 55 other ternarycompounds, respectively. The main advantage of our approachis in its generality as it applies to different classes of semi-conducting and insulating compounds (chalcogenides, halides,pnictides) and in its simplicity. Moreover, it is computationallyequivalent to the cost of the simple GGA calculations.
ACKNOWLEDGMENTS
This research is supported by the US Department of Energy,Office of Basic Energy Sciences, Energy Frontier ResearchCenters, under Award DE-AC36-08GO28308 to NREL. Thisresearch used high performance computing resources of theNational Energy Research Scientific Computing Center, whichis supported by the Office of Science of the US Departmentof Energy under Contract DE-AC02-05CH11231 as well ascapabilities of the National Renewable Energy LaboratoryComputational Sciences Center, which is supported by theOffice of Energy Efficiency and Renewable Energy of the USDepartment of Energy under Contract DE-AC36-08GO28308.
APPENDIX: ABSOLUTE FERE ENERGIES
TABLE V. The μFEREi values (in eV), i.e., the total energies of pure elemental substances in their conventional reference phase. In addition,
we also show for each element the pseudopotential label (PP) as well as the difference δμFEREi = μFERE
i − μGGA+U .
element PP μGGA+U μFERE δμFERE element PP μGGA+U μFERE δμFERE
Ag Ag −0.71 −0.83 −0.12 Mn Mn −6.97 −7.00 −0.03Al Al −3.74 −3.02 0.72 N N −8.31 −8.51 −0.20As As −4.65 −5.06 −0.41 Na Na pv −1.23 −1.06 0.17Au Au −0.97 −2.23 −1.26 Nb Nb pv −7.04 −6.69 0.36Ba Ba sv −1.93 −1.39 0.53 Ni Ni −3.65 −3.57 0.08Be Be −3.75 −3.40 0.35 O O s/O −4.99/−4.96 −4.76/−4.73 0.23Bi Bi d −4.06 −4.39 −0.33 P P −4.96 −5.64 −0.68Ca Ca pv −1.93 −1.64 0.29 Pd Pd −2.84 −3.12 −0.27Cd Cd −0.91 −0.56 0.35 Pt Pt −3.52 −3.95 −0.43Cl Cl −1.79 −1.63 0.16 Rb Rb sv −0.96 −0.68 0.29Co Co −4.65 −4.75 −0.10 Rh Rh −4.23 −4.76 −0.53Cr Cr pv −7.29 −7.22 0.07 S S −4.06 −4.00 0.06Cu Cu −2.03 −1.97 0.05 Sb Sb −4.12 −4.29 −0.16F F −1.86 −1.70 0.15 Sc Sc sv −5.12 −4.63 0.49Fe Fe − 6.00 −6.15 −0.15 Se Se −3.48 −3.55 −0.07Ga Ga d −3.03 −2.37 0.66 Si Si −5.42 −4.99 0.43Ge Ge d −4.29 −4.14 0.15 Sn Sn d −3.97 −3.79 0.18Hf Hf pv −8.12 −7.40 0.72 Sr Sr sv −1.68 −1.17 0.51Hg Hg −0.29 −0.12 0.17 Ta Ta pv −9.22 −8.82 0.40In In d −2.72 −2.31 0.41 Te Te −3.14 −3.25 −0.11Ir Ir −5.77 −5.96 −0.19 Ti Ti pv −5.57 −5.52 0.05K K sv −1.08 −0.80 0.28 V V pv −5.97 −6.42 −0.45La La −3.86 −3.66 0.20 Y Y sv −5.48 −4.81 0.66Li Li sv −1.86 −1.65 0.21 Zn Zn −1.27 −0.84 0.43Mg Mg −1.54 −0.99 0.55 Zr Zr sv −6.60 −5.87 0.72
115104-11

STEVANOVIC, LANY, ZHANG, AND ZUNGER PHYSICAL REVIEW B 85, 115104 (2012)
*[email protected]. Lany and A. Zunger, Phys. Rev. B 72, 235104 (2008).2X. Zhang, V. Stevanovic, M. d’Avezac, S. Lany, andA. Zunger (unpublished).
3X. Zhang, L. Yu, A. Zakutayev, and A. Zunger, Adv. Fuct. Mater.(2012), doi: 10.1002/adfm.201102546.
4V. L. Chevrier, S. P. Ong, R. Armiento, M. K. Y. Chan, andG. Ceder, Phys. Rev. B 82, 075122 (2010).
5J. Yang, A. Sudik, C. Wolverton, and D. J. Siegel, Chem. Soc. Rev.39, 656 (2010).
6C. Wolverton and V. Ozolins, Phys. Rev. B 73, 144104 (2006).7A. Jain, G. Hautier, S. P. Ong, C. J. Moore, C. C. Fischer, K. A.Persson, and G. Ceder, Phys. Rev. B 84, 045115 (2011).
8P. Seth, L. Rıos, and J. Needs, J. Chem. Phys. 134, 084105 (2011).9S. Lany, Phys. Rev. B 78, 245207 (2008).
10O. Kubaschewski, C. B. Alcock, and P. I. Spencer, MatherialsThermochemistry, 6th ed. (Pergamon, Oxford, 1983).
11D. D. Wagman et al., J. Phys. Chem. Ref. Data 11, Supplement No.2 (1982).
12S. Lany, J. Osorio-Guillen, and A. Zunger, Phys. Rev. B 75,241203(R) (2007).
13L. Wang, T. Maxisch, and G. Ceder, Phys. Rev. B 73, 195107(2006).
14S. L. Dudarev, G. A. Botton, S. Y. Savrasov, C. J. Humphreys, andA. P. Sutton, Phys. Rev. B 57, 1505 (1998).
15J. Heyd, G. E. Scuseria, and M. Ernzerhof, J. Chem. Phys. 118,8207 (2003).
16J. P. Perdew, K. Burke, and M. Ernzerhof, Phys. Rev. Lett. 77, 3865(1996).
17P. E. Blochl, Phys. Rev. B 50, 17953 (1994).18G. Kresse and J. Furthmuller, Comput. Mater. Sci. 6, 15 (1996).
19H. J. Monkhorst and J. D. Pack, Phys. Rev. B 13, 5188(1976).
20G. Bergerhoff and I. Brown, in“Crystallographic Databases,”F. H. Allen et al. (Hrsg.) (International Union of Crystallography,Chester, 1987).
21A. Belsky, M. Hellenbrandt, V. L. Karen, and P. Luksch, ActaCrystallogr. B58, 364 (2002).
22V. Stevanovic, M. d’Avezac, and A. Zunger, Phys. Rev. Lett. 105,075501 (2010).
23V. Stevanovic, M. d’Avezac, and A. Zunger, J. Am. Chem. Soc.133, 11649 (2011).
24J. Osorio-Guillen, S. Lany, S. V. Barabash, and A. Zunger, Phys.Rev. Lett. 96, 107203 (2006).
25C. B. Finch, G. W. Clark, and O. C. Kopp, J. Cryst. Growth 29, 269(1975).
26G. G. Amatucci, J.-M. Tarescon, and L. C. Klein, J. Electrochem.Soc. 143, 1114 (1996).
27C. Delmas et al., Int. J. Inorg. Matter. 1, 11 (1999).28G. H. Li, H. Azuma, and M. Tohda, Electrochem. Solid-State Lett.
5, A135 (2002).29R. E. Doe, K. A. Persson, Y. S. Meng, and G. Ceder, Chem. Mater.
20, 5274 (2008).30If we fix U = 3 eV for all transition metals (see Sec. V A for
justification) the resulting MAE = 0.16 eV/atom on the set of 252binary compounds from Tables II. Although, GGA + U improvesresults, compared to pure GGA, large errors still remain for sometransition metal compounds (−0.517 eV/atom for AuCl) as well asfor all compounds containing only main group elements for whichU = 0.
31With the value chosen such to reproduce a set of measured heats ofchemical reactions that involve the corresponding element.
115104-12