correlating spam activity with ip address characteristics chris wilcox, christos papadopoulos csu...
Post on 21-Dec-2015
214 views
TRANSCRIPT

Correlating Spam Activity withCorrelating Spam Activity withIP Address CharacteristicsIP Address Characteristics
Chris Wilcox, Christos PapadopoulosChris Wilcox, Christos PapadopoulosCSUCSU
John HeidemannJohn HeidemannUSC/ISIUSC/ISI
IEEE Global Internet Symposium 2010March 19, 2010

22
Introduction
Common belief: spamming hosts exhibit specific address characteristics: dynamically allocated addresses specific geographical areas more tolerant spam policies less stability, more volatility, shorter uptimes
Our goal: quantify differences in address characteristics between spammers and legitimate hosts.
33
Approach
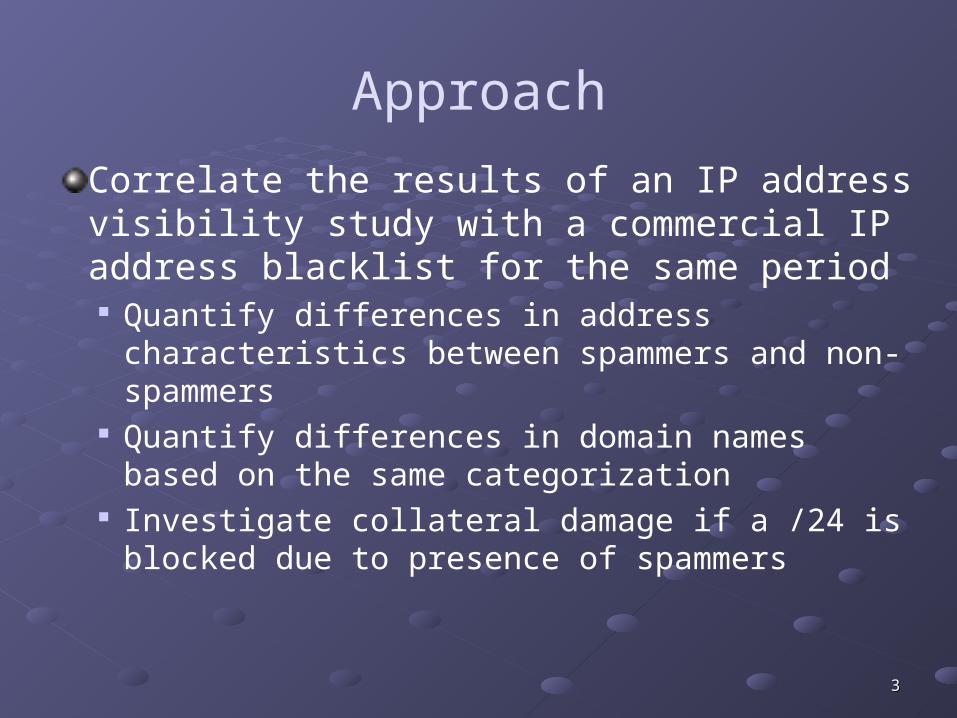
Correlate the results of an IP address visibility study with a commercial IP address blacklist for the same period Quantify differences in address characteristics
between spammers and non-spammers Quantify differences in domain names based
on the same categorization Investigate collateral damage if a /24 is
blocked due to presence of spammers

44
Data SourcesData SourcesAddress visibility:Address visibility:
Survey of reachable Internet addresses every 3 Survey of reachable Internet addresses every 3 monthsmonths
Uses active probing (ICMP) over ~24,000 /24 Uses active probing (ICMP) over ~24,000 /24 IPV4 blocks (1% of the Internet)IPV4 blocks (1% of the Internet)
Reputation-based block list from eSoft.comReputation-based block list from eSoft.com <IP addr, score>, based on sender address <IP addr, score>, based on sender address
verification, sender policy framework, heuristic verification, sender policy framework, heuristic analysis, reputation filtering, historical analysis, reputation filtering, historical averaging, etc…averaging, etc…

55
Visibility Study
Census: ping every internet address every three months
Survey: select 1% of /24 subnets and ping addresses every 11m
This research uses survey data which has more information
66
Visibility MetricsVisibility Metrics
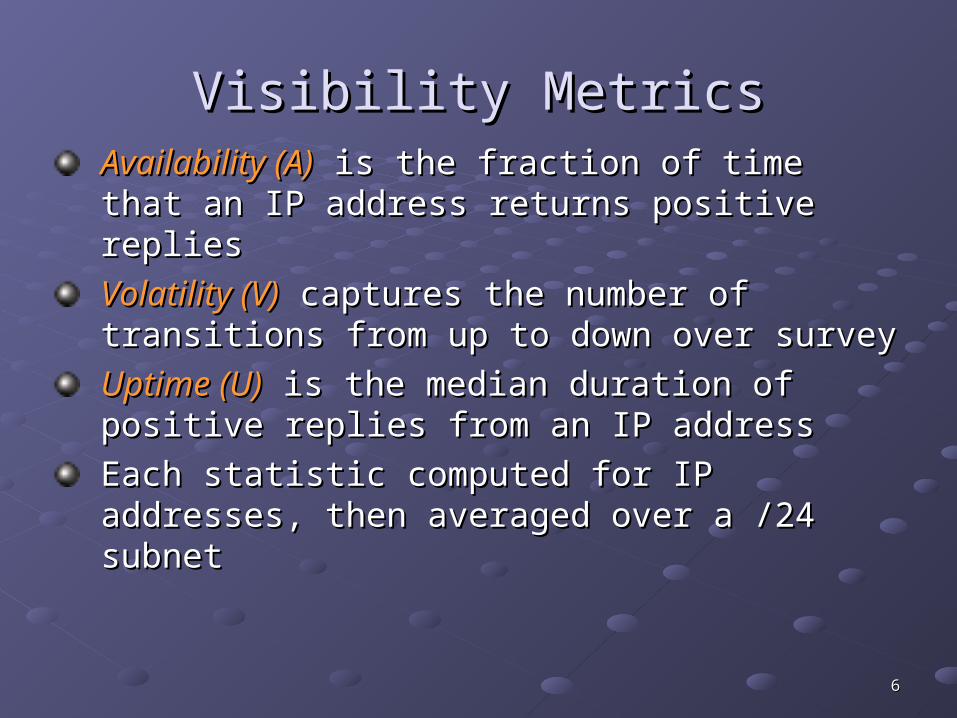
Availability (A)Availability (A) is the fraction of time that is the fraction of time that an IP address returns positive repliesan IP address returns positive replies
Volatility (V)Volatility (V) captures the number of captures the number of transitions from up to down over surveytransitions from up to down over survey
Uptime (U)Uptime (U) is the median duration of is the median duration of positive replies from an IP addresspositive replies from an IP address
Each statistic computed for IP addresses, Each statistic computed for IP addresses, then averaged over a /24 subnetthen averaged over a /24 subnet

77
Spammer List
Spammer data from eSoft.comSpammer data from eSoft.com Two lists: Block list and Raw listTwo lists: Block list and Raw list Both delivered to CSU every 30mins (yes we archive and we can share)(yes we archive and we can share)
List of IP addresses with spam score per addressList of IP addresses with spam score per address Score range: -60 to +70Score range: -60 to +70 Score >30: high spamming activity (conservative)Score >30: high spamming activity (conservative) Score <10: low spamming activityScore <10: low spamming activity
We use eSoft’s Raw List: ~1.43M addresses spanning 262K /24 subnets daily We assume score >= 20 is spammer Distinguish spammers with high confidence

88
eSoft World Coverage
eSoft has pretty good coverage of the world

99
eSoft Score Distribution
1010
Research Methodology
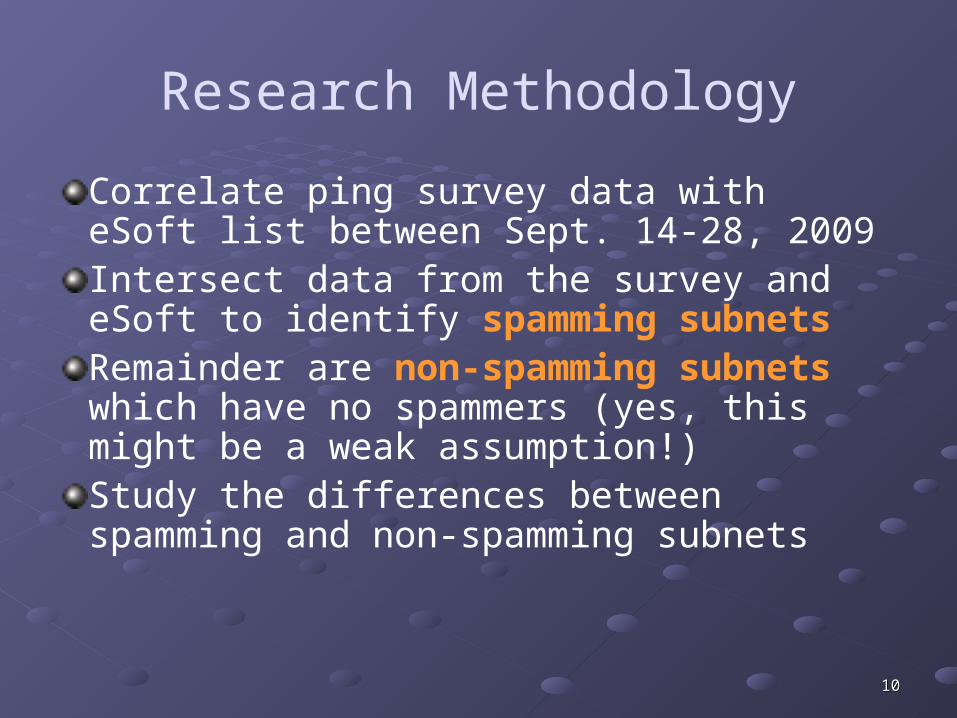
Correlate ping survey data with eSoft list between Sept. 14-28, 2009Intersect data from the survey and eSoft to identify spamming subnetsRemainder are non-spamming subnets which have no spammers (yes, this might be a weak assumption!)Study the differences between spamming and non-spamming subnets

1111
Spammer DistributionSpammer Distribution
Number of spamming subnets plotted using log scaleMost subnets have fewer than 5 spamming hosts

1212
Non-Spammer DistributionNon-Spammer Distribution
Non-spamming hosts much more evenly distributed……but large number of subnets are almost fully populated
1313
Question 1: Address Characteristics
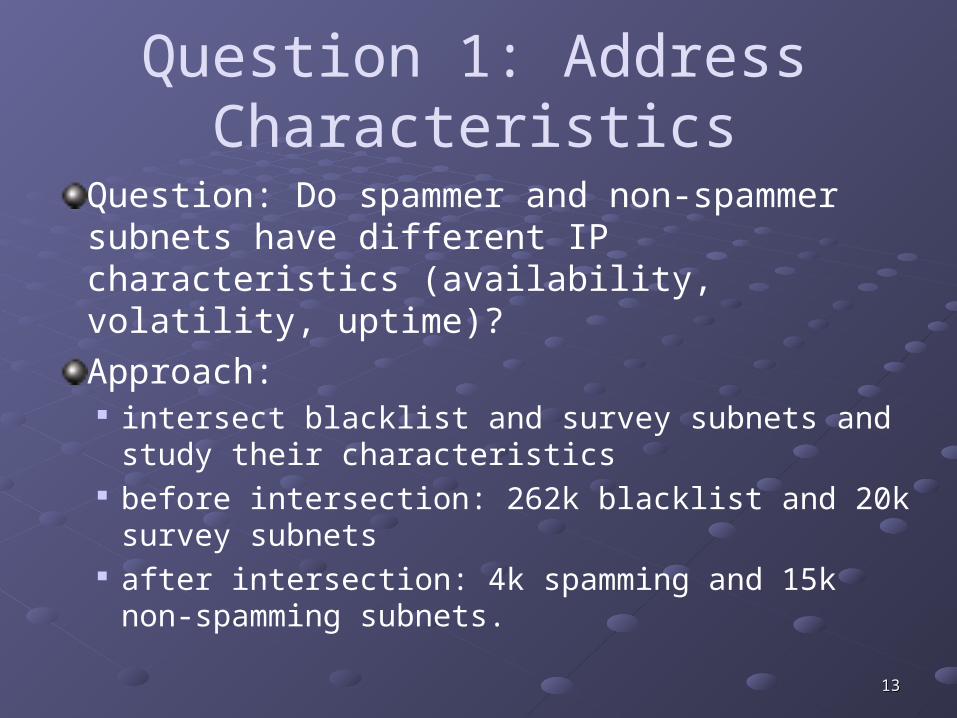
Question: Do spammer and non-spammer subnets have different IP characteristics (availability, volatility, uptime)?
Approach: intersect blacklist and survey subnets and study
their characteristics before intersection: 262k blacklist and 20k survey
subnets after intersection: 4k spamming and 15k non-
spamming subnets.

1414
Address Availability
72% of non-spammers but only 50% of spammers have >0.5 availability50% of non-spammers but only 24% of spammers have >0.8 availability

1515
Address Volatility
90% of non-spammers but only 75% of spammers have <0.02 volatility 50% of non-spammers but only 28% of spammers have <0.01 volatility

1616
Address Uptime
70% of non-spammers, 42% of spammers have > 14 hour uptime44% of non-spammers, 22% of spammers have > 28 hour uptime

1717
Availability with Spam Score
83% of low spammers have > 0.9 availability. 14% of high spammers have > 0.9 availability.

1818
Question 2: Domain Names
Question: How do spammer domain names differ from non-spammer names?
Approach: Resolve all names in intersected subnets
using Linux host command. Categorize based on key strings in the
domain name.
1919
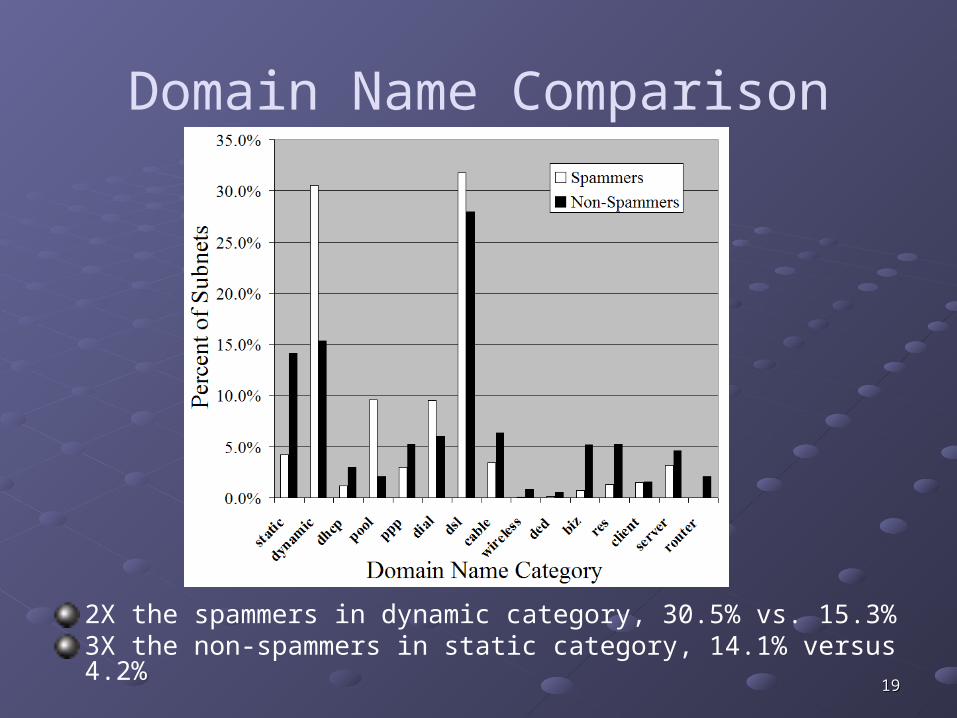
Domain Name Comparison
2X the spammers in dynamic category, 30.5% vs. 15.3%3X the non-spammers in static category, 14.1% versus 4.2%

2020
Question 3: Collateral DamageQuestion: Is blocking the entire /24 subnet a good idea when one or more addresses have been used for sending spam?
Collateral Damage consists of legitimate mail servers that are incorrectly blacklisted.
Approach: 1) Compute population of spamming hosts versus
non-spamming hosts per subnet.
2) Quantify the number of legitimate mail servers in subnets with spammers.

2121
Collateral Damage: Population
Gray: Subnets with few spammers: may get black listed because of this!Black: Highly compromised subnets: negligent or collaborating provider?Blue: High spammer activity in some subnets: further investigation needed.

2222
Collateral Damage: Results
Collateral damage in 365 subnets out of 4,126 studied (8.8%)This seems significant to us…
2323
RobustnessPing-based address probes undercount the number of responsive addresses
Spam list may not be complete (depends on eSoft’s customer reach)
Spam blacklists vary greatly between vendors, no industry standard for scores
Email volume from servers isn’t considered, some servers may be receive-only

2424
Conclusions
Network behavior can be used to help identify and mitigate spamming behavior.
Significant differences in IP availability, volatility, uptime, and domain names do exist between spamming and non-spamming hosts.
Coarse-grained blacklisting of /24 blocks incurs significant collateral damage.

2525
AcknowledgementsAcknowledgements
Yuri Pradkin, and Xue Cai (USC/ISI) Yuri Pradkin, and Xue Cai (USC/ISI) for access to survey data sets.for access to survey data sets.
Dan Massey, and Steve DiBenedetto Dan Massey, and Steve DiBenedetto (CSU) for help in many areas.(CSU) for help in many areas.