correlation and asset management · aqr capital management, llc two greenwich plaza greenwich, ct...
TRANSCRIPT
AQR Capital Management, LLC
Two Greenwich Plaza
Greenwich, CT 06830
p: +1.203.742.3600 | w: aqr.com
Correlation and Asset Management
May 2017
Principal
Michael Mendelson
1
Vice President
Ernst Schaumburg

2
The information set forth herein has been obtained or derived from sources believed by AQR Capital Management, LLC (“AQR”) to be reliable. However, AQR does not make any representation or warranty, express or implied, as to the information’s accuracy or completeness, nor does AQR recommend that the attached information serve as the basis of any investment decision. This document has been provided to you solely for information purposes and does not constitute an offer or solicitation of an offer, or any advice or recommendation, to purchase any securities or other financial instruments, and may not be construed as such. This document is intended exclusively for the use of the person to whom it has been delivered by AQR and it is not to be reproduced or redistributed to any other person. Please refer to the Appendix for more information on risks and fees. For one-on-one presentation use only. Past performance is not a guarantee of future performance.
This presentation is not research and should not be treated as research. This presentation does not represent valuation judgments with respect to any financial instrument, issuer, security or sector that may be described or referenced herein and does not represent a formal or official view of AQR.
The views expressed reflect the current views as of the date hereof and neither the speaker nor AQR undertakes to advise you of any changes in the views expressed herein. It should not be assumed that the speaker or AQR will make investment recommendations in the future that are consistent with the views expressed herein, or use any or all of the techniques or methods of analysis described herein in managing client accounts. AQR and its affiliates may have positions (long or short) or engage in securities transactions that are not consistent with the information and views expressed in this presentation.
The information contained herein is only as current as of the date indicated, and may be superseded by subsequent market events or for other reasons. Charts and graphs provided herein are for illustrative purposes only. The information in this presentation has been developed internally and/or obtained from sources believed to be reliable; however, neither AQR nor the speaker guarantees the accuracy, adequacy or completeness of such information. Nothing contained herein constitutes investment, legal, tax or other advice nor is it to be relied on in making an investment or other decision.
There can be no assurance that an investment strategy will be successful. Historic market trends are not reliable indicators of actual future market behavior or future performance of any particular investment which may differ materially, and should not be relied upon as such. Target allocations contained herein are subject to change. There is no assurance that the target allocations will be achieved, and actual allocations may be significantly different than that shown here. This presentation should not be viewed as a current or past recommendation or a solicitation of an offer to buy or sell any securities or to adopt any investment strategy.
The information in this presentation may contain projections or other forward‐looking statements regarding future events, targets, forecasts or expectations regarding the strategies described herein, and is only current as of the date indicated. There is no assurance that such events or targets will be achieved, and may be significantly different from that shown here. The information in this presentation, including statements concerning financial market trends, is based on current market conditions, which will fluctuate and may be superseded by subsequent market events or for other reasons. Performance of all cited indices is calculated on a total return basis with dividends reinvested.
The investment strategy and themes discussed herein may be unsuitable for investors depending on their specific investment objectives and financial situation. Please note that changes in the rate of exchange of a currency may affect the value, price or income of an investment adversely.
Neither AQR nor the speaker assumes any duty to, nor undertakes to update forward looking statements. No representation or warranty, express or implied, is made or given by or on behalf of AQR, the speaker or any other person as to the accuracy and completeness or fairness of the information contained in this presentation, and no responsibility or liability is accepted for any such information. By accepting this presentation in its entirety, the recipient acknowledges its understanding and acceptance of the foregoing statement.
Disclosures

3
Asset owners’ most important function is allocating capital across
asset classes, seeking best risk-adjusted return within a risk budget
They seek diversification asset classes and across geographies
Source: AQR. Diversification does not eliminate the risk of experience investment losses.
What Return Correlations Do Asset Managers Care About?
Institutional Investors
Active Managers
Leveraged Fund Managers
Active management within an asset class seeks to add value versus a
benchmark portfolio of the same asset class
Hedged portfolios rely on offsetting return characteristics of
long/short positions, the persistence of which maintains risk control
For leveraged, unhedged portfolios, maintaining risk control may have
greater dependency on asset volatility than correlation

The Allocation to Riskier Assets Has Generally Increased
4
U.S. Public Pension Asset Allocation Callan Associates Public Pension Asset Allocation
Source: AQR. U.S. Board of Governors of the Federal Reserve System, Financial Accounts of the United States, 1952 to 2012; Pew Analysis of State Financial Reports. Callan Associates Public Pension Asset Allocation Data, 1990 to 2016. Please read important disclosure in the Appendix.
Institutional Asset Allocations Have Evolved, but Slowly
Has the shift to riskier assets been driven by changes in correlation?
Pew Analysis of Financial Accounts of U.S.
0%
10%
20%
30%
40%
50%
60%
70%
80%
90%
100%
1952 1962 1972 1982 1992 2002 2012
Equity and Alternatives Fixed Income and Cash
0%
10%
20%
30%
40%
50%
60%
70%
80%
90%
100%
1990 1995 2000 2005 2010 2015
Equity Alteratives Fixed Income

0%
10%
20%
30%
40%
50%
60%
70%
80%
90%
100%
1952 1962 1972 1982 1992 2002 2012
Equity and Alternatives Fixed Income and Cash
0%
10%
20%
30%
40%
50%
60%
70%
80%
90%
100%
1990 1995 2000 2005 2010 2015
Equity Alteratives Fixed Income
Regulations, Demographics, and Markets May Be More Likely Drivers
5
Source: AQR. U.S. Board of Governors of the Federal Reserve System, Financial Accounts of the United States, 1952 to 2012; Pew Analysis of State Financial Reports. Callan Associates Public Pension Asset Allocation Data, 1990 to 2016. US stock and US bond correlation based on rolling 60 month S&P 500 Index Futures and 10 Year Treasuries. Please read important disclosures in the Appendix.
Lower Asset Class Correlations Didn’t Motivate the Shift to Stocks
Correlation of Monthly Returns of Stocks/Bonds Rolling 5-Year Window
Pew Analysis of Financial Accounts of U.S.
U.S. Public Pension Asset Allocation Callan Associates Public Pension Asset Allocation
-1.00
-0.50
0.00
0.50
1.00
1952 1962 1972 1982 1992 2002 2012

Broad Globalization of Investment in All Asset Classes
6
International Allocations of U.S. Public Pensions
% Non-US Stocks and Bonds
Source: AQR. Callen Associates Public Pension Asset Allocation Data, 1985 to 2016. Please read important disclosures in the Appendix.
Institutional Investors Have Gone Global in the Last Thirty Years
Did changes in the correlation of returns across countries drive this
globalization?
0
5
10
15
20
25
1985 1990 1995 2000 2005 2010 2015

0
5
10
15
20
25
1985 1990 1995 2000 2005 2010 2015
Globalization Grew in Spite of a Reduced Diversification Benefit
7
Source: AQR. Callen Associates Public Pension Asset Allocation Data, 1985 to 2016. Global equities 1-year correlations are the primary equity index for 10 developed countries. Global bond 1-year correlations are 10 Year government bonds for 6 developed countries. . Developed equities data includes the broad market-cap weighted indices which are sufficiently liquid to trade in each of the following countries/regions: Australia, Canada, France, Germany, Hong Kong, Italy, Japan, Netherlands, Spain, Switzerland, United Kingdom, United States, and continental Europe. Developed bonds data includes GDP-weighted government bonds from the following countries: Australia, Canada, Germany, Japan, United Kingdom, United States. Please read important disclosures in the Appendix.
Both Correlation and Global Allocation Rose During This Period
1- Yr Average Correlation of Weekly Returns
Across Developed Stock Markets and Bond Markets
International Allocations of U.S. Public Pensions
% Non-US Stocks and Bonds
0.0
0.1
0.2
0.3
0.4
0.5
0.6
0.7
0.8
0.9
1.0
1985 1990 1995 2000 2005 2010 2015
Equities Bonds
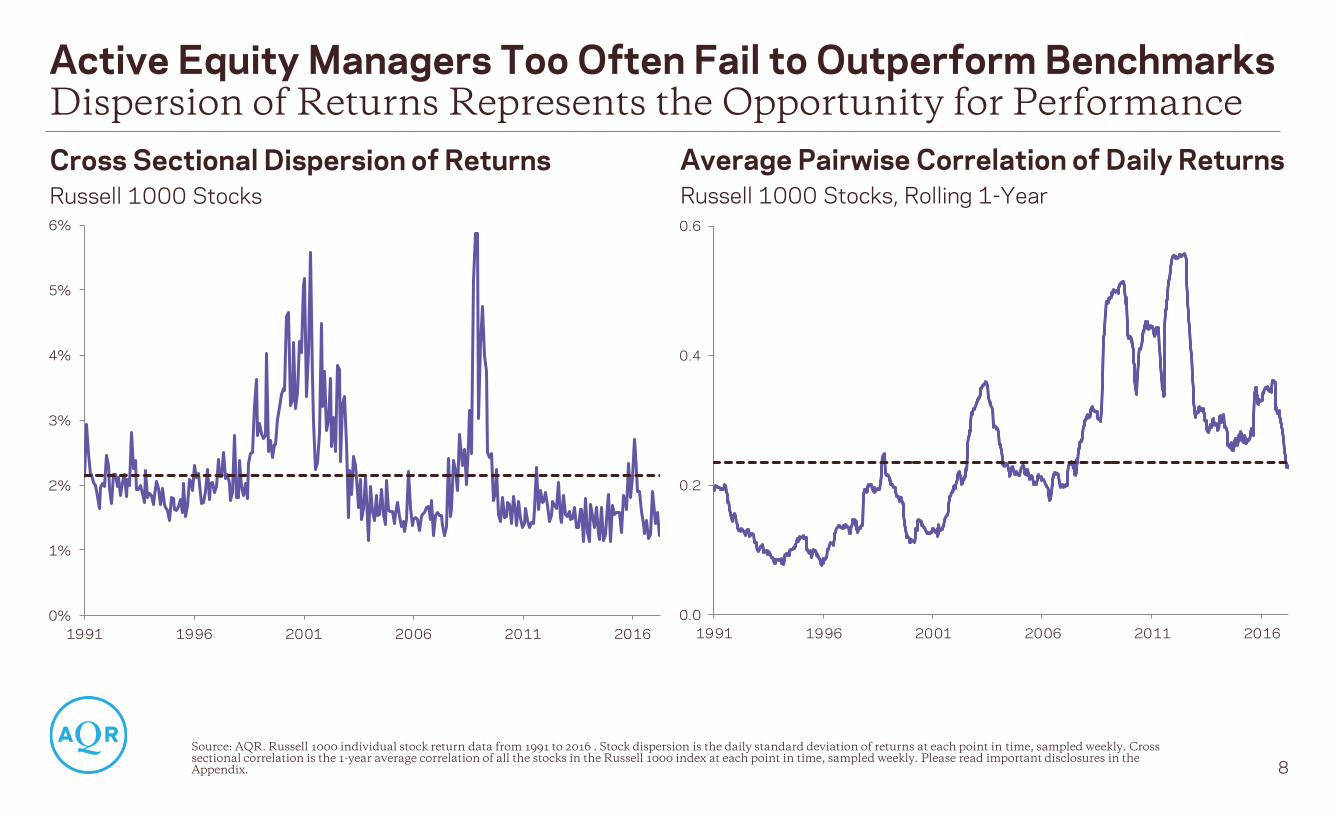
Dispersion of Returns Represents the Opportunity for Performance
8
Source: AQR. Russell 1000 individual stock return data from 1991 to 2016 . Stock dispersion is the daily standard deviation of returns at each point in time, sampled weekly. Cross sectional correlation is the 1-year average correlation of all the stocks in the Russell 1000 index at each point in time, sampled weekly. Please read important disclosures in the Appendix.
Active Equity Managers Too Often Fail to Outperform Benchmarks
Average Pairwise Correlation of Daily Returns
Russell 1000 Stocks, Rolling 1-Year
Cross Sectional Dispersion of Returns
Russell 1000 Stocks
0%
1%
2%
3%
4%
5%
6%
1991 1996 2001 2006 2011 2016
0.0
0.2
0.4
0.6
1991 1996 2001 2006 2011 2016

Low Market Volatility Creates Low Dispersion and Less Opportunity
9
Cross Sectional Dispersion of Returns
Russell 1000 Stocks
Source: AQR. Russell 1000 individual stock return data from 1991 to 2016 . Stock dispersion is the daily standard deviation of returns at each point in time, sampled weekly. Realized volatility calculated using the standard deviation of Russell 1000 Index 5-day overlapping returns. Please read important disclosures in the Appendix.
Active Equity Managers Too Often Fail to Outperform Benchmarks
1-Year Realized Volatility of Weekly Returns
Russell 1000 Stocks
0%
1%
2%
3%
4%
5%
6%
1991 1996 2001 2006 2011 2016
0%
5%
10%
15%
20%
25%
30%
35%
40%
45%
1991 1996 2001 2006 2011 2016

Long/Short Strategies Depend on Factor Correlation to Control Risk
10
Cumulative Return of Market Neutral Equity
Hypothetical Strategy from July – August 2007
Source: AQR. For illustrative purposes only and not representative of an actual portfolio AQR manages. Cumulative return of an equal weight portfolio based on long and short positions from a hypothetical diversified market neutral equity strategy which incorporates factors like value, momentum, defensive and quality to determine if attractive (long) or unattractive (short) from July 9, 2007. The investment universe includes all U.S. publicly traded stocks of which only a sub-set are included based on total attractiveness of aforementioned factors. Please read important disclosures in the Appendix. Hypothetical data has certain inherent limitations, some of which are discussed in the Appendix.
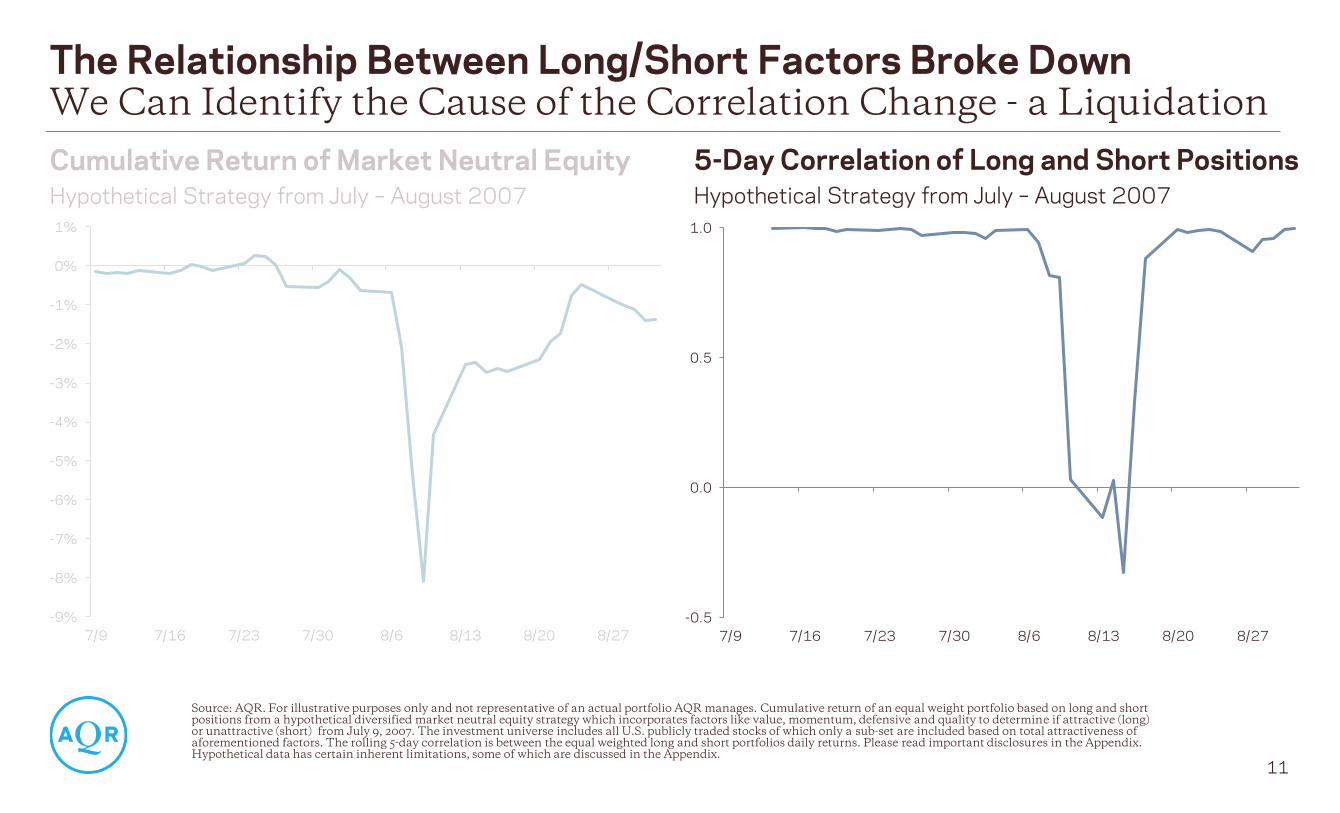
The Significance of Correlation Could Be Different for Levered Funds
How much of the market neutral equity drawdown was related to
sudden changes in expected long/short relationships?
-9%
-8%
-7%
-6%
-5%
-4%
-3%
-2%
-1%
0%
1%
7/9 7/16 7/23 7/30 8/6 8/13 8/20 8/27
-9%
-8%
-7%
-6%
-5%
-4%
-3%
-2%
-1%
0%
1%
7/9 7/16 7/23 7/30 8/6 8/13 8/20 8/27
-0.5
0.0
0.5
1.0
7/9 7/16 7/23 7/30 8/6 8/13 8/20 8/27
We Can Identify the Cause of the Correlation Change - a Liquidation
11
Source: AQR. For illustrative purposes only and not representative of an actual portfolio AQR manages. Cumulative return of an equal weight portfolio based on long and short positions from a hypothetical diversified market neutral equity strategy which incorporates factors like value, momentum, defensive and quality to determine if attractive (long) or unattractive (short) from July 9, 2007. The investment universe includes all U.S. publicly traded stocks of which only a sub-set are included based on total attractiveness of aforementioned factors. The rolling 5-day correlation is between the equal weighted long and short portfolios daily returns. Please read important disclosures in the Appendix. Hypothetical data has certain inherent limitations, some of which are discussed in the Appendix.
The Relationship Between Long/Short Factors Broke Down
5-Day Correlation of Long and Short Positions
Hypothetical Strategy from July – August 2007
Cumulative Return of Market Neutral Equity
Hypothetical Strategy from July – August 2007

Managers May Change Positioning as Covariance Estimates Change
12
Hypothetical Risk Parity Exposures
Using EWMA Volatility and Correlation Model*
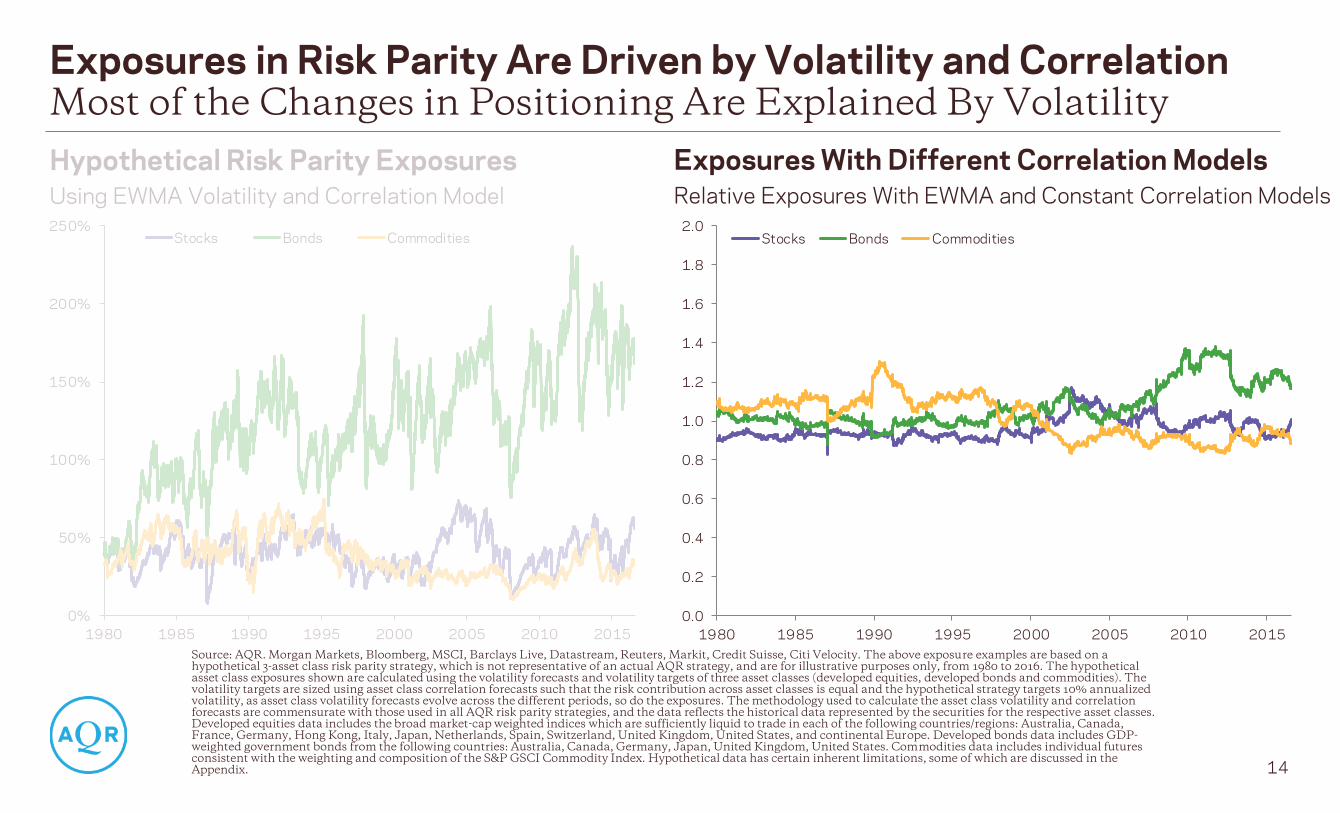
Source: AQR. Morgan Markets, Bloomberg, MSCI, Barclays Live, Datastream, Reuters, Markit, Credit Suisse, Citi Velocity. The above exposure examples are based on a hypothetical 3-asset class risk parity strategy, which is not representative of an actual AQR strategy, and are for illustrative purposes only, from 1980 to 2016. The hypothetical asset class exposures shown are calculated using the volatility forecasts and volatility targets of three asset classes (developed equities, developed bonds and commodities). The volatility targets are sized using asset class correlation forecasts such that the risk contribution across asset classes is equal and the hypothetical strategy targets 10% annualized volatility, as asset class volatility forecasts evolve across the different periods, so do the exposures. The methodology used to calculate the asset class volatility and correlation forecasts are commensurate with those used in all AQR risk parity strategies, and the data reflects the historical data represented by the securities for the respective asset classes. Developed equities data includes the broad market-cap weighted indices which are sufficiently liquid to trade in each of the following countries/regions: Australia, Canada, France, Germany, Hong Kong, Italy, Japan, Netherlands, Spain, Switzerland, United Kingdom, United States, and continental Europe. Developed bonds data includes GDP-weighted government bonds from the following countries: Australia, Canada, Germany, Japan, United Kingdom, United States. Commodities data includes individual futures consistent with the weighting and composition of the S&P GSCI Commodity Index. Hypothetical data has certain inherent limitations, some of which are discussed in the Appendix.
Exposures in Risk Parity Are Driven by Volatility and Correlation
How much do correlation estimates matter in determining risk parity
positioning?
0%
50%
100%
150%
200%
250%
1980 1985 1990 1995 2000 2005 2010 2015
Stocks Bonds Commodities

0%
50%
100%
150%
200%
250%
1980 1985 1990 1995 2000 2005 2010 2015
Stocks Bonds Commodities
Alternative Correlation Models Don’t Strongly Affect Positioning
13
Hypothetical Risk Parity Exposures
Using EWMA Volatility and Correlation Model
Exposures in Risk Parity Are Driven by Volatility and Correlation
Hypothetical Risk Parity Exposures
Using EWMA Volatility and Constant Correlation Model
0%
50%
100%
150%
200%
250%
1980 1985 1990 1995 2000 2005 2010 2015
Stocks Bonds Commodities
Source: AQR. Morgan Markets, Bloomberg, MSCI, Barclays Live, Datastream, Reuters, Markit, Credit Suisse, Citi Velocity. The above exposure examples are based on a hypothetical 3-asset class risk parity strategy, which is not representative of an actual AQR strategy, and are for illustrative purposes only, from 1980 to 2016. The hypothetical asset class exposures shown are calculated using the volatility forecasts and volatility targets of three asset classes (developed equities, developed bonds and commodities). The volatility targets are sized using asset class correlation forecasts such that the risk contribution across asset classes is equal and the hypothetical strategy targets 10% annualized volatility, as asset class volatility forecasts evolve across the different periods, so do the exposures. The methodology used to calculate the asset class volatility and correlation forecasts are commensurate with those used in all AQR risk parity strategies, and the data reflects the historical data represented by the securities for the respective asset classes. Developed equities data includes the broad market-cap weighted indices which are sufficiently liquid to trade in each of the following countries/regions: Australia, Canada, France, Germany, Hong Kong, Italy, Japan, Netherlands, Spain, Switzerland, United Kingdom, United States, and continental Europe. Developed bonds data includes GDP-weighted government bonds from the following countries: Australia, Canada, Germany, Japan, United Kingdom, United States. Commodities data includes individual futures consistent with the weighting and composition of the S&P GSCI Commodity Index. Hypothetical data has certain inherent limitations, some of which are discussed in the Appendix.
0%
50%
100%
150%
200%
250%
1980 1985 1990 1995 2000 2005 2010 2015
Stocks Bonds Commodities
Most of the Changes in Positioning Are Explained By Volatility
14
Exposures in Risk Parity Are Driven by Volatility and Correlation
Exposures With Different Correlation Models
Relative Exposures With EWMA and Constant Correlation Models
Hypothetical Risk Parity Exposures
Using EWMA Volatility and Correlation Model
0.0
0.2
0.4
0.6
0.8
1.0
1.2
1.4
1.6
1.8
2.0
1980 1985 1990 1995 2000 2005 2010 2015
Stocks Bonds Commodities
Source: AQR. Morgan Markets, Bloomberg, MSCI, Barclays Live, Datastream, Reuters, Markit, Credit Suisse, Citi Velocity. The above exposure examples are based on a hypothetical 3-asset class risk parity strategy, which is not representative of an actual AQR strategy, and are for illustrative purposes only, from 1980 to 2016. The hypothetical asset class exposures shown are calculated using the volatility forecasts and volatility targets of three asset classes (developed equities, developed bonds and commodities). The volatility targets are sized using asset class correlation forecasts such that the risk contribution across asset classes is equal and the hypothetical strategy targets 10% annualized volatility, as asset class volatility forecasts evolve across the different periods, so do the exposures. The methodology used to calculate the asset class volatility and correlation forecasts are commensurate with those used in all AQR risk parity strategies, and the data reflects the historical data represented by the securities for the respective asset classes. Developed equities data includes the broad market-cap weighted indices which are sufficiently liquid to trade in each of the following countries/regions: Australia, Canada, France, Germany, Hong Kong, Italy, Japan, Netherlands, Spain, Switzerland, United Kingdom, United States, and continental Europe. Developed bonds data includes GDP-weighted government bonds from the following countries: Australia, Canada, Germany, Japan, United Kingdom, United States. Commodities data includes individual futures consistent with the weighting and composition of the S&P GSCI Commodity Index. Hypothetical data has certain inherent limitations, some of which are discussed in the Appendix.

15
Asset allocation has meaningfully evolved but doesn’t seem to have
been based on correlation changes
Globalization of allocations grew in spite of increasing correlations;
the benefits were still substantial and underutilized
Source: AQR.
Summary: How Does Changing Correlation Affect Investment?
Institutional Investors
Active Managers
Levered Fund Managers
The dispersion of returns is lower, but it’s not because of abnormally
high correlation. Lower market volatility may make it more difficult to
outperform, post transaction costs
Long/short portfolios have more critical dependency on the
realization of correlations within a tolerable range
For leveraged, but unhedged portfolios, the relative importance of
volatility and correlation may be more tilted toward volatility

Appendices

17
This document has been provided to you solely for information purposes and does not constitute an offer or solicitation of an offer or any advice or recommendation to purchase any securities or other financial instruments and may not be construed as such. The factual information set forth herein has been obtained or derived from sources believed to be reliable but it is not necessarily all-inclusive and is not guaranteed as to its accuracy and is not to be regarded as a representation or warranty, express or implied, as to the information’s accuracy or completeness, nor should the attached information serve as the basis of any investment decision. This document is intended exclusively for the use of the person to whom it has been delivered and it is not to be reproduced or redistributed to any other person. There is no guarantee, express or implied, that long-term return and/or volatility targets will be achieved. Realized returns and/or volatility may come in higher or lower than expected. PAST PERFORMANCE IS NOT A GUARANTEE OF FUTURE PERFORMANCE. Diversification does not eliminate the risk of experiencing investment losses. Hypothetical performance results (e.g., quantitative backtests) have many inherent limitations, some of which, but not all, are described herein. No representation is being made that any fund or account will or is likely to achieve profits or losses similar to those shown herein. In fact, there are frequently sharp differences between hypothetical performance results and the actual results subsequently realized by any particular trading program. One of the limitations of hypothetical performance results is that they are generally prepared with the benefit of hindsight. In addition, hypothetical trading does not involve financial risk, and no hypothetical trading record can completely account for the impact of financial risk in actual trading. For example, the ability to withstand losses or adhere to a particular trading program in spite of trading losses are material points which can adversely affect actual trading results. The hypothetical performance results contained herein represent the application of the quantitative models as currently in effect on the date first written above and there can be no assurance that the models will remain the same in the future or that an application of the current models in the future will produce similar results because the relevant market and economic conditions that prevailed during the hypothetical performance period will not necessarily recur. There are numerous other factors related to the markets in general or to the implementation of any specific trading program which cannot be fully accounted for in the preparation of hypothetical performance results, all of which can adversely affect actual trading results. Discounting factors may be applied to reduce suspected anomalies. This backtest’s return, for this period, may vary depending on the date it is run. Hypothetical performance results are presented for illustrative purposes only. In addition, our transaction cost assumptions utilized in backtests , where noted, are based on AQR's historical realized transaction costs and market data. Certain of the assumptions have been made for modeling purposes and are unlikely to be realized. No representation or warranty is made as to the reasonableness of the assumptions made or that all assumptions used in achieving the returns have been stated or fully considered. Changes in the assumptions may have a material impact on the hypothetical returns presented. Hypothetical performance is gross of advisory fees, net of transaction costs, and includes the reinvestment of dividends. If the expenses were reflected, the performance shown would be lower. Gross performance results do not reflect the deduction of investment advisory fees, which would reduce an investor’s actual return. For example, assume that $1 million is invested in an account with the Firm, and this account achieves a 10% compounded annualized return, gross of fees, for five years. At the end of five years that account would grow to $1,610,510 before the deduction of management fees. Assuming management fees of 1.00% per year are deducted monthly from the account, the value of the account at the end of five years would be $1,532,886 and the annualized rate of return would be 8.92%. For a ten-year period, the ending dollar values before and after fees would be $2,593,742 and $2,349,739, respectively. AQR’s asset based fees may range up to 2.85% of assets under management, and are generally billed monthly or quarterly at the commencement of the calendar month or quarter during which AQR will perform the services to which the fees relate. Where applicable, performance fees are generally equal to 20% of net realized and unrealized profits each year, after restoration of any losses carried forward from prior years. In addition, AQR funds incur expenses (including start-up, legal, accounting, audit, administrative and regulatory expenses) and may have redemption or withdrawal charges up to 2% based on gross redemption or withdrawal proceeds. Please refer to AQR’s ADV Part 2A for more information on fees. Consultants supplied with gross results are to use this data in accordance with SEC, CFTC, NFA or the applicable jurisdiction’s guidelines. Broad-based securities indices are unmanaged and are not subject to fees and expenses typically associated with managed accounts or investment funds. Investments cannot be made directly in an index. Investment factors include: Value which is the tendency for relatively cheap stocks to outperform relatively expensive ones, momentum which is the tendency for an asset’s recent relative performance to continue in the near future, defensive which is the tendency for lower-risk stocks to generate higher risk-adjusted returns, and quality which is the tendency for higher-quality stocks to generate higher returns than lower-quality stocks There is a risk of substantial loss associated with trading commodities, futures, options, derivatives and other financial instruments. Before trading, investors should carefully consider their financial position and risk tolerance to determine if the proposed trading style is appropriate. Investors should realize that when trading futures, commodities, options, derivatives and other financial instruments one could lose the full balance of their account. It is also possible to lose more than the initial deposit when trading derivatives or using leverage. All funds committed to such a trading strategy should be purely risk capital.
Disclosures