correlation and regression 1. bivariate data when measurements on two characteristics are to be...
TRANSCRIPT

Correlation and Regression
1

Bivariate dataWhen measurements on two characteristics are to be studied simultaneously because of their interdependence, we get observations in pairs.
Such a set of data in pairs is called bivariate data.
2
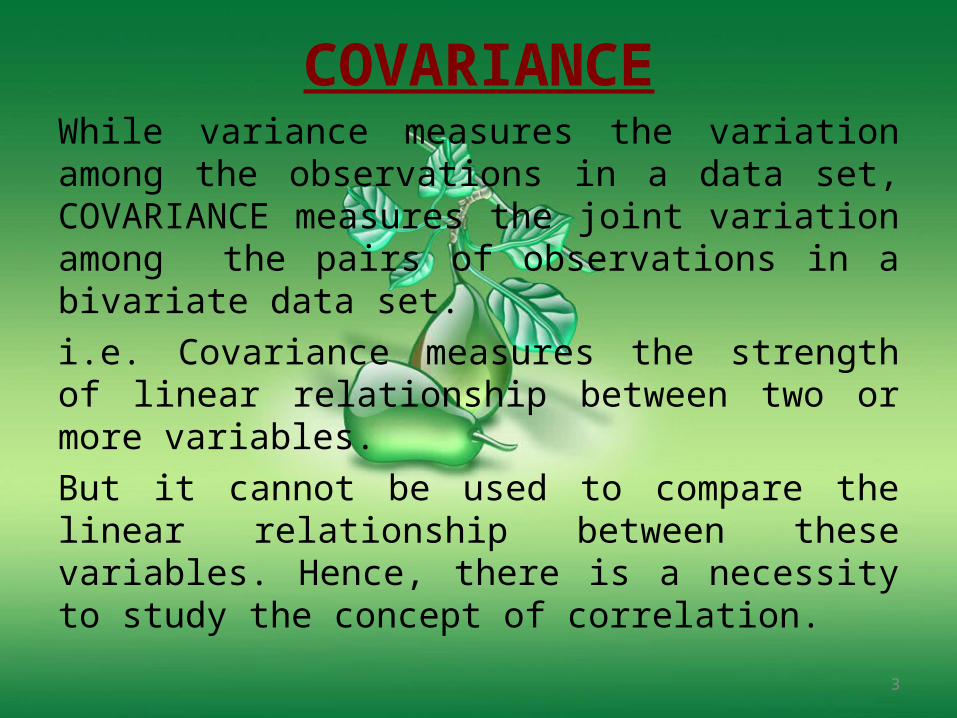
COVARIANCEWhile variance measures the variation among the observations in a data set, COVARIANCE measures the joint variation among the pairs of observations in a bivariate data set.
i.e. Covariance measures the strength of linear relationship between two or more variables.
But it cannot be used to compare the linear relationship between these variables. Hence, there is a necessity to study the concept of correlation.
3

CORRELATION
Correlation analysis: When changes in one variable also show changes in the other variable, the two variables are said to be correlated.
4
5
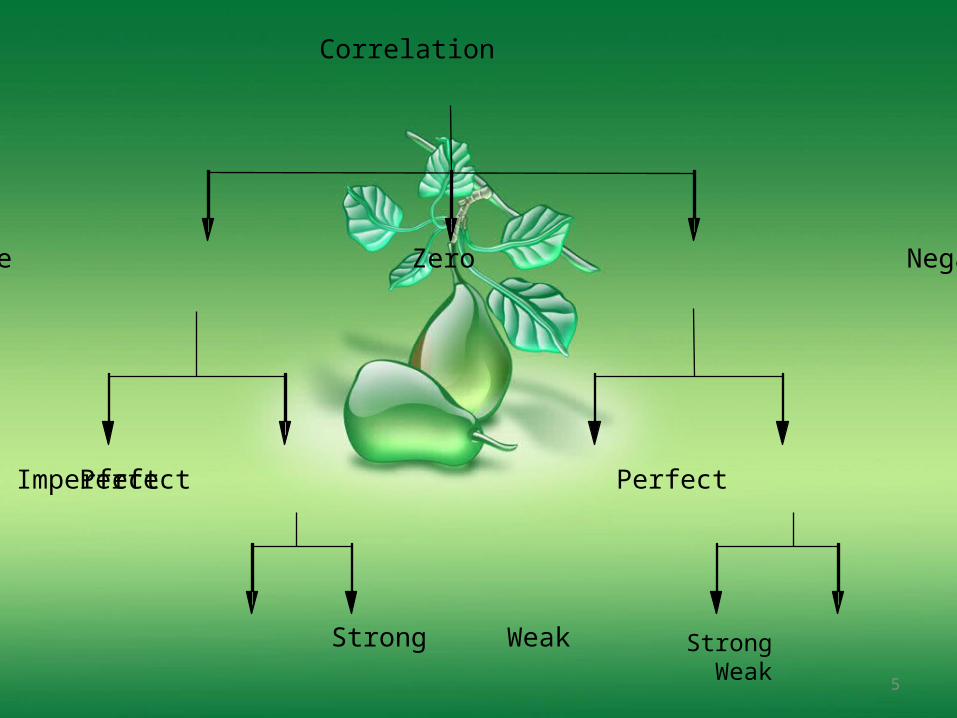
Correlation
Positive Zero Negative Perfect Imperfect Perfect Imperfect Strong Weak Strong Weak
Methods of assessing Correlation
SCATTER DIAGRAMScatter diagram is the graphical method of assessing correlation between two variables.
6
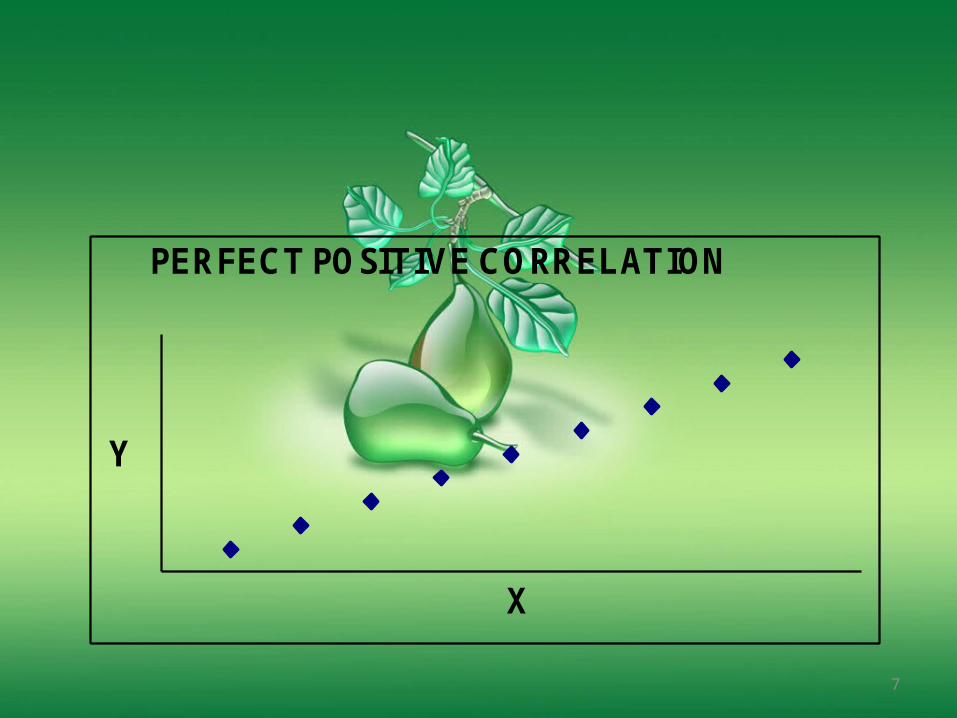
Y
X
PERFECT POSITIVE CORRELATION
7
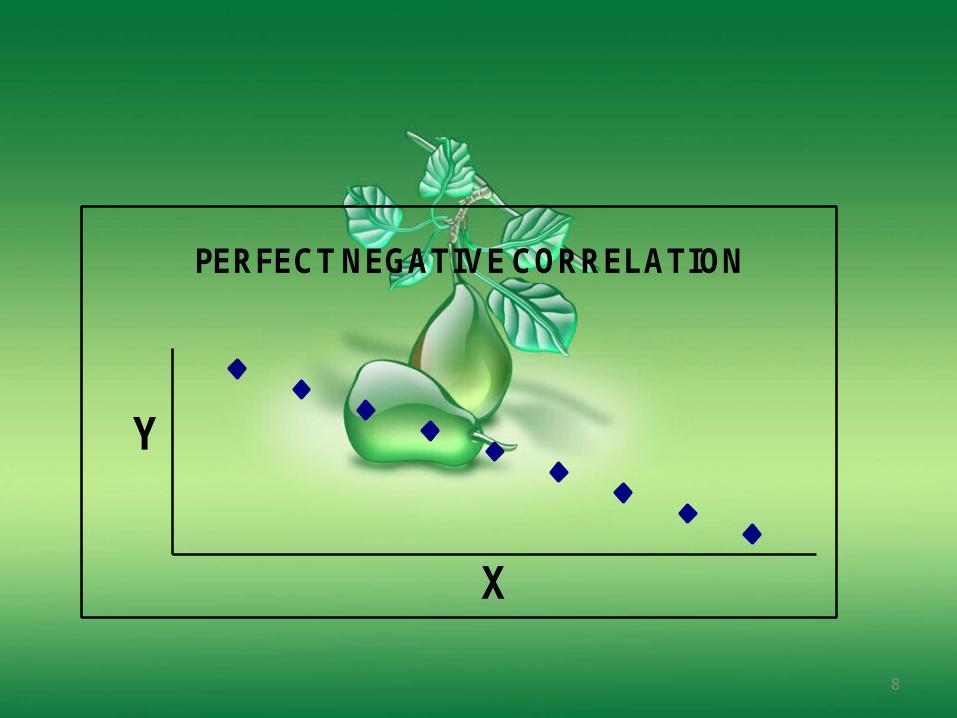
Y
X
PERFECT NEGATIVE CORRELATION
8
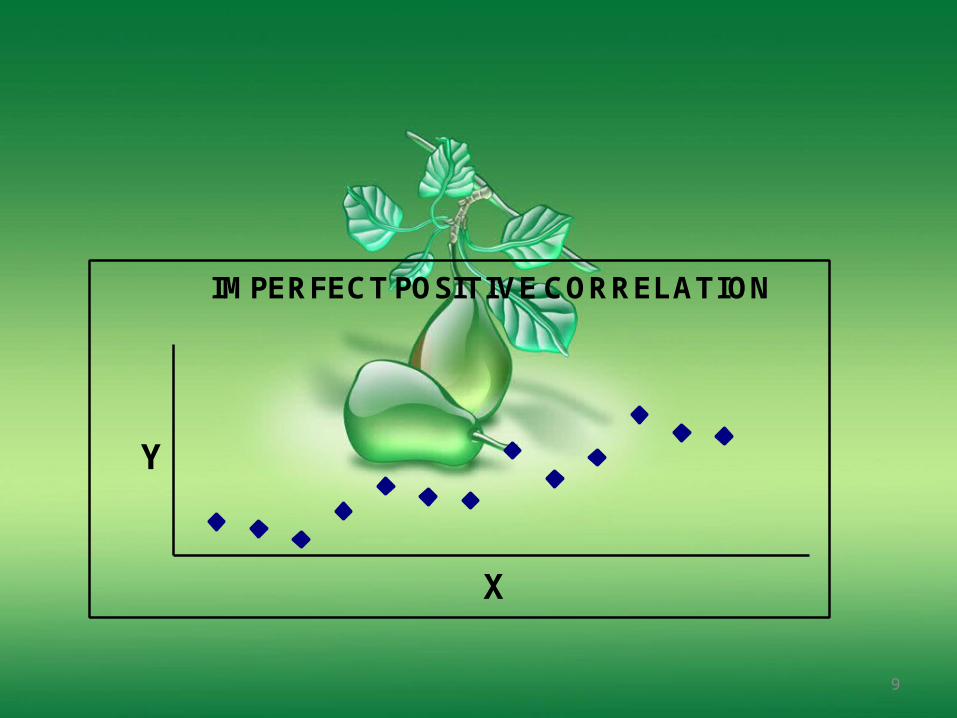
Y
X
IMPERFECT POSITIVE CORRELATION
9

Y
X
IMPERFECT NEGATIVE CORRELATION
10
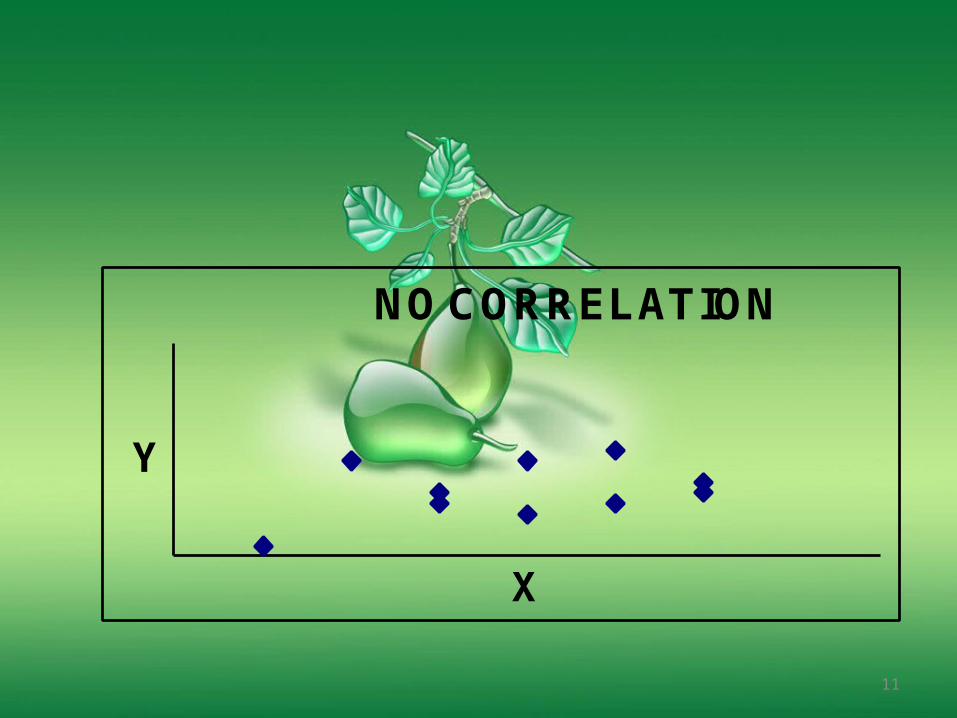
Y
X
NO CORRELATION
11

• Correlation is measured with the help of correlation coefficient r.
• Its value always lies between
-1 and +1
i.e. -1 ≤ r ≤ 1
12

13
Correlation
Positive Correlation No Correlation Negative Correlation 0 < r 1 r = 0 -1 < r < 0
Perfect Positive Imperfect Positive Perfect Negative Imperfect Negative Correlation Correlation Correaltion Correlation r = 1 0< r < 1 r = -1 -1 < r < 0
Weak Positive Strong Positive Weak Negative Strong Negative r tends to 0 r tends to 1 r tends to 0 r tends to -1
Karl Pearson’s Coefficient of correlation: Karl Pearson defined coefficient of correlation as a measure of intensity or degree of linear relationship between two variables.Let X and Y be the two variables with n pairs of observations, then they are represented as:
(xi , yi) i = 1, 2, …, n
14
Spurious Correlation:
When the value of correlation coefficient shows high presence of significant relationship, but no logical relationship exists between the two variables, such a correlation is called Spurious Correlation.
Ex. Number of students getting graduate degree every year and number of auto accidents in the city.
15
Coefficient of DeterminationThe square of the correlation coefficient r, expressed as r2, is known as coefficient of determination. It indicates the extent to which variation in one variable is explained by the variation in other.
Ex: If the correlation coefficient between x and y is 0.9, the coefficient of determination will be 0.81. It implies that there is 81% of variation in y explained by the variation in x and the remaining 19% is explained by some other factors. This 1-r2 is referred to as coefficient of nondetermination.
The square root of coefficient of nondetermination is known as coefficient of alienation.
16
Rank CorrelationSome times the data on two variables cannot be measured quantitatively. In such situations the observations can be ranked. Karl Pearson’s correlation coefficient is not an appropriate measure for qualitative data. Hence Spearman has defined a coefficient of correlation for qualitative data called as Spearman’s Rank Correlation coefficient.
E.g. ranks given by judges in a beauty contest.
17
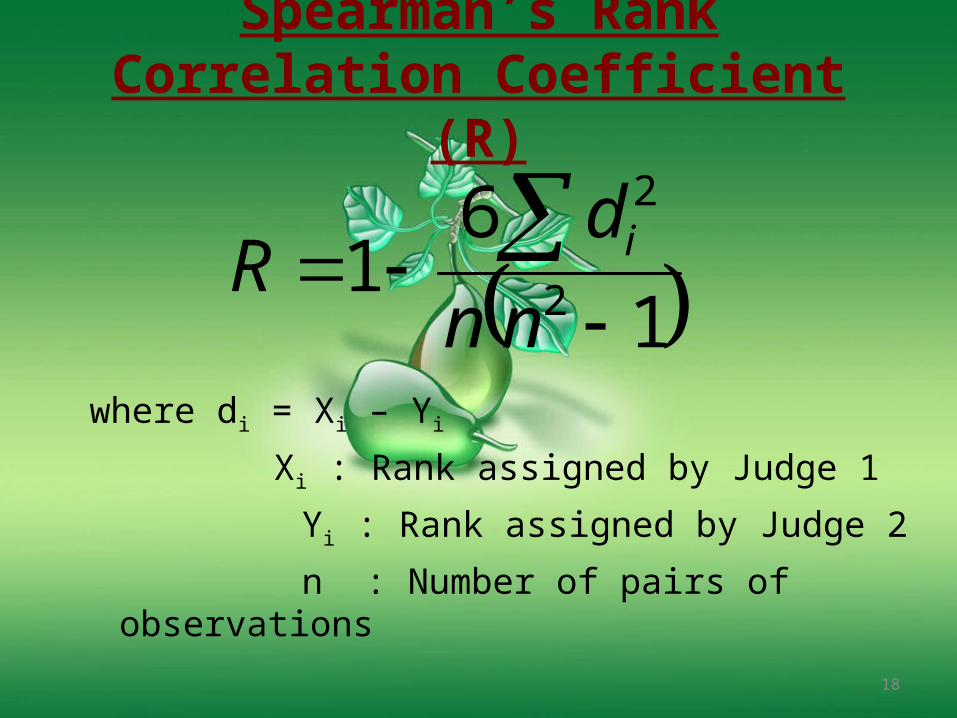
Spearman’s Rank Correlation Coefficient
(R)
1
61
2
2
nn
dR i
18
where di = Xi – Yi
Xi : Rank assigned by Judge 1
Yi : Rank assigned by Judge 2
n : Number of pairs of observations
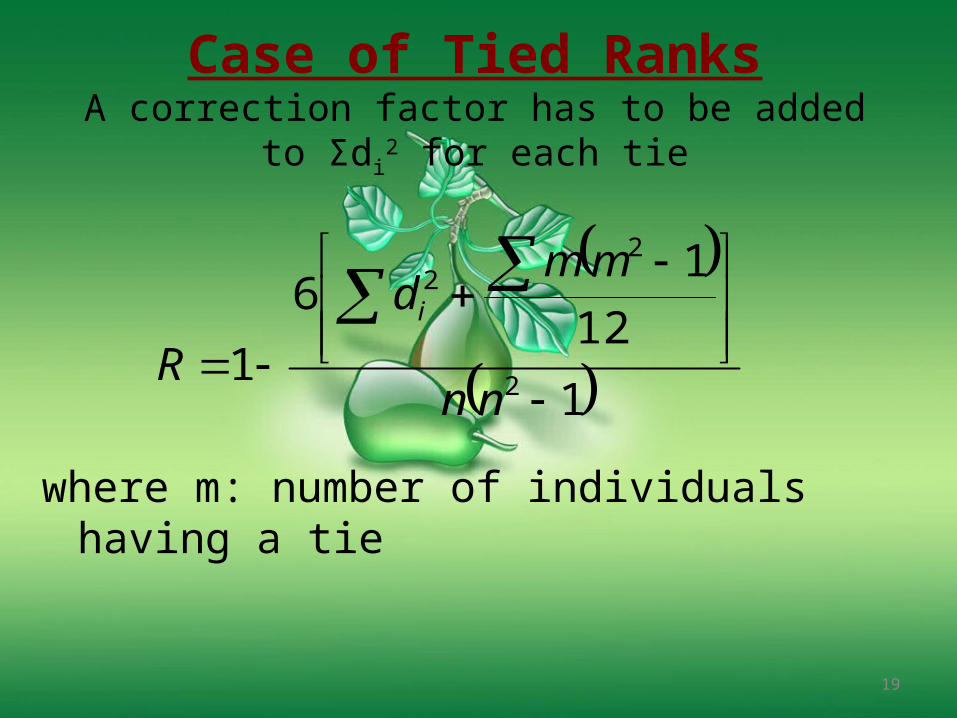
Case of Tied RanksA correction factor has to be added to Σdi
2 for each tie
1
12
16
12
22
nn
mmd
Ri
19
where m: number of individuals having a tie