correlation of cavitation inception data for a …
TRANSCRIPT

4? '^^^.
ORNL-2544 ^
Metallurgy and Ceramics
CORRELATION OF CAVITATION INCEPTION DATA FOR A
CENTRIFUGAL PUMP OPERATING IN WATER AND
IN SODIUM POTASSIUM ALLOY (NaK)
A. G. Grindell
OAK RIDGE NATIONAL LABORATORY operated by
U N I O N CARBIDE CORPORATION
for the
U.S. ATOMIC ENERGY C O M M I S S I O N

DISCLAIMER Portions of this document may be illegible in electronic image products. Images are produced from the best available original document.

Printed in USA. Price cents. Available from the
Office of Tochntcal Services
U. S. Department of Commerce
Washington 25, D. C.
_ LEGAL NOTICE
Thrs report was prepared as on occount of Government sponsored work. Neither the United States
nor the Commission, rwr ony person acting on behalf of the Commission
A. Makes ony warranty or representation, express or imp lied, with respect to the accuracy,
completeness, or usefulness of the information contained in this report, or that the use of
any information, apparatus, method, or process disclosed in this report may not infringe
privately owned rights, or
B. Assumes any liabilities with respect to the use of, or for damages resulting from the use of
any information, opporotus, method, or process disclosed m this report.
As used in the above, "person acting on behalf of the Commission" includes any employee or
contractor of the Commission to the extent that such employee or contractor prepares, handles
or distributes, or provides access to, any information purs uant to his emp loyment or controct
with the Commission,

ORNL-2544
Contract No. W.7405-eng-26
REACTOR PROJECTS DIVISION
*
J
CORRELATION OF CAVITATION INCEPTION DATA FOR A CENTRIFUGAL
PUMP OPERATING IN WATER AND IN SODIUM PtflTASSIUM ALLOY (NaK)
A. G. Grindell
D A T E ISSUED
DtC U :--^
OAK RIDGE NATIONAL LABORATORY Oak Ridge, Tennessee
operated by UNION CARBIDE CORPORATION
for the U.S. ATOMIC ENERGY COMMISSION

CONTENTS
Abst ract 1
Introduct ion 1
Procedure 2
Resul ts and D iscuss ion 5
Conclus ions and Recommendations 6
^ B ib l iography 7
Appendixes
* A. Figures 9
B. Tables 17
C. Ventur i Meter Temperature-Mult ip l ier 31
D. Pump Head Equations 33
Glossary 35
Acknowledgments 37
i i i

CORRELATION OF CAVITAT ION INCEPTION DATA FOR A CENTRIFUGAL PUMP OPERATING
IN WATER AND IN SODIUM-POTASSIUM ALLOY (NaK)
A. G. Grindell
ABSTRACT
For the centrifugal pump under Investigation, the static head at pump suction, in feet absolute,
at cavitation inception was correlated (or water and for 1500°F NaK on the basis of the differences
of the vapor pressures of the two liquids. The difference between the vapor pressure of water
and NoK, for the same conditions of pump speed and liquid flow, was added to the water-test
cavitation inception value, and this estimate proved to be a good approximation to the experi
mental value found for cavitation inception with NoK.
INTRODUCTION
In v iew of the expanding use of nonaqueous
heat-transfer media in power generat ion, i t would
be des i rab le , from the v iewpoin t of economy and
convenience, to be able to predict the incept ion
of pump cav i ta t ion for nonaqueous systems by
using the weal th of information which has been
obtained for aqueous systems. (Cav i ta t ion in a
f l ow ing l iqu id is described as the vapor izat ion of
the l iquid when the s ta t ic pressure is reduced to
or below the vapor pressure of the l iqu id at the
loca l temperature of the f l ow ing l iqu id . ) The
operat ion of a cent r i fuga l pump in a region of
cav i ta t ion can lead to a reduct ion in pump per
formance and damage to the impeller and cas i ng .
Some work has been reported on cav i ta t i on in
l iqu id meta ls , but none has been re lated to
cav i ta t ion in water . Ha l l and Crofts ( i ) and
Trummel (2) have reported on cav i ta t ion in l iqu id
meta ls . Both reports concerned cav i ta t ion in a
ven tu r i ; Ha l l and Crofts worked w i t h eu tec t ic
sodium-potassium a l loy at 250°C, and Trummel
worked w i th sodium at 1215- to 1475°F . A . J .
Steponoff (3) has reported on the densi ty dependence
of cav i ta t ion suppression for propel ler pumps in a
molten sa l t of sp gr 1.75 at 850°C. On page 257
of his textbook (4), Steponoff w r i t e s , "Vapo r
pressure should not be overlooked w i th l iqu ids
other than w a t e r . " A l l i s -Cha lmers Manufactur ing
Company (5) has reported on a study of cav i ta t ion
damage to specimens of var ious mater ia ls of
const ruct ion in 70°F water, 350°F sod ium, and
350°F eutect ic sodium-potassium a l l oy . Studies
s imi lar to the A l l is -Chalmers work have been made
in the Experimental Engineering Department of the
Reactor Projects D i v i s i on , ORNL , by Young and
Simpson (6). That work is not presented here
because the semi-quant i tat ive nature of the
measurements of pump speeds, f l ows , and temper-
otures precluded app l i cab i l i t y to the establ ishment
of the corre lat ion between nonaqueous and aqueous
sys tems.
In high-temperature heat-exchanger c i r cu i t s , the
work ing pressure of system components, and
consequent ly their des ign , w i l l depend upon,
among other considerat ions, the pressure necessary
to suppress pump cav i ta t i on . It would be valuable
to be able to predict centr i fugal-pump cav i ta t ion
incept ion in sodium-potassium a l loys early in the
design study by adapting water cav i ta t ion data
which appears in large quant i t ies in the l i te ra ture .
Experiments w i th heat transfer media other than
sodium-potassium al loys may expand the app l i
ca t ion of water-cavi tat ion data to nonaqueous
sys tems.
In order to discover whether a useful re la t ionship
ex is ts between centr i fugal-pump cav i ta t ion i n
cept ion in water and in a molten m e t a l , a cen
t r i fuga l pump was used, f i r s t in water, and then in
1500°F NaK (56 wt % N a - 4 4 wt % K ) . F ive test
points of pump operation were chosen; three runs
were made at 300 ga l /m in for pump speeds of
2600, 3000, and 3375 rpm, and two runs were made
at 430 ga l /m in for pump speeds of 3000 and
3375 rpm. One run was made at each of the f ive
1

test points for water and for NaK. Two addi t ional
runs were mode w i th NaK for each of the two f low
condi t ions at 3000 rpm. Cav i ta t ion damage was
not invest igated.
A suf f i c ien t number of reduct ions in pump-tank
EQUIPMENT
The development of pumps for spec i f ic app l i
cat ions has been part of the component development
work of the Experimental Engineering Department
of the Reactor Projects D iv i s ion of O R N L . A
centr i fugal pump developed by the Department for
pumping high-temperature NaK was insta l led in a
c losed loop of Inconel pipe, sched 40, 4 - i n . IPS.
The loop was equipped wi th thermocouple, venturi
f low meter, th ro t t l ing va lve , pressure measuring
dev ices , heaters and coolers prov id ing for
isothermal operat ion, oxide-removal co ld t rap,
thermal insu la t ion , drain va l ve , drain tank, pump-
speed measuring devices and devices for measuring
the level of the l iqu id in the pump tank. Figure 1
is a sketch of the test setup.
TEST METHOD
In general , the method for obtaining cav i ta t ion
data and the types of data obtained were ident ica l
for both water and high-temperature NoK. The
pump was operated in a noncavi tat ing manner for
the speed, f l ow, and temperature requirements of a
selected test po in t . Data were obtained on pump
speed, l iqu id f low-ra te , pump head, s tat ic head at
pump suc t ion , and temperature of the l iquid after
each of several successive reduct ions in oump-
tank gas pressure (stat ic head at pump suct ion) .
A su f f i c ien t number of reductions in pump-tank
gas pressure (hel ium, under pressure, was used as
a protect ive cover for the NaK) were made in order
to ident i fy the cav i ta t ion incept ion point , W^., on
a plot of H vs H (see Glossary) . The data were
corrected by using the appropriate ca l ib ra t ion
cor rect ions, and graphs (see F i g . 3 for t yp ica l
graph) were plotted of pump head (measured in
feet) vs s ta t ic head at pump suct ion (measured in
feet absolute) for each run. The s ta t ic head at
pump suct ion at the incept ion of cav i ta t ion was
determined for each run from the corresponding
gas pressure (hel ium, under pressure, was used
as a protect ive cover for the NaK) were made in
order to ident i fy the cav i ta t ion incept ion point ,
Wj.j, on a plot of H^ vs H^^ (see Glossary) and to
obtain a loss of at least 8 f t of pump head.
graph. The dif ference between the vapor pressure
of water and NaK was added to the water- test
cav i ta t ion incept ion va lue, and this va lue was
compared w i th the corresponding NaK-test cav i
ta t ion incept ion va lue .
The f low rates of both water and NaK were
measured by using the same ventur i f lowmeter.
The f low rate of the NaK was based on the product
of the water venturi-meter d i f fe rent ia l pressure
mu l t ip l ied by the square of the temperature
mul t ip l ie r (TM). Appendix A presents a der ivat ion
of the temperature mul t ip l ier from the standard
f lowmeter equation for a ven tu r i . The under ly ing
assumpt ion for th is part icular app l ica t ion of the
temperature mul t ip l ier method is that the venturi
coef f ic ient -of -d ischarge (c) var ies ins ign i f i can t l y
in value between the water and the a l loy t e s t s .
The discharge coef f ic ient varies from approximately
0.9915 for water f low-rate measurements to approxi
mately 0.9940 for NaK f low-rate measurements (7).
Table 6 presents the venturi temperature-mult ip l ier ,
which includes changes in dens i ty , for three
temperatures of interest . The purpose of set t ing
the f low rates of the a l loy in th is manner was to
dupl icate as c lose ly as pract icable the f low rates
of the water and to permit the absolute f low rates
to approach the nominal values of 300 and 430 gpm.
DISCUSSION OF TEST VARIABLES
The pr inc ipal var iables of interest were pump-
shaf t speed, l iqu id f low-ra te , pump-tank gas
pressure, pump discharge-pressure, and l iqu id
temperature. The method of measuring each of
these quant i t ies for water and for high-temperature
NaK w i l l be d iscussed in th is sec t ion .
The pump-shaft speed for the water test was
measured by two methods. A Strobotac adjusted
to l ine frequency at 3600 rpm was used to stop
an image of the pump-shaft coupl ing at the desired
speed. In add i t ion , a count-rate meter was used
PROCEDURE
2

to integrate, for a selected period of t ime, the
vol tage pulses of the pump drive-motor tachometer
generator. The integrated number of pulses was
then reduced to pump-shaft speed by use of a
mul t ip l ie r which ref lected the number of pulses
per revolut ion of the shaft and the se lec ted t ime
per iod .
Pump-shaft speed for the high-temperature run
was measured by var ious methods. For the 3000rpm
run, a Strobotac operating on l ine frequency was
used to obtain a part icular image from a pattern of
marks which had been painted on the periphery of
the pump-shaft coup l ing . Th is speed was checked
by two methods, one being the count-rate meter
mentioned above. A second check was performed
by using a Hewlet t -Packard counter. Model 522B.
The three methods agreed to w i th in 5 rpm. Other
pump-shaft speeds which were not mul t ip les of
300 were measured in the fo l l ow ing manner. The
pump-shaft speed was set at the speed mul t ip le
of 300 rpm nearest the desired tes t speed by using
the Strobotac operating on l ine frequency in order
to obtain the image part icular to that mu l t i p le .
Th is part icular speed was then used to check the
readings of both the Hewlet t -Packard instrument
and the count-rate meter. The shaft speed was
then adjusted to the desired speed for the test
and was checked by each of the three methods.
A measurement range of 10 rpm at the test speed
was observed.
The f low rate of the water was measured wi th a
nozzle- type ventur i meter having a s ing le pressure
tap in the pipe and one in the throat . These two
pressures were measured ind iv idua l l y w i th labo
ratory-type test pressure gages. The gages were
checked at least tw ice during the water tests and
had a maximum error of 0.3 psig at the maximum
gage reading.
The f low rate of the a l loy was measured wi th
the some ventur i meter used for the water t e s t s .
The ventur i pipe and throat pressures were
measured w i t h bel lows-actuated balanced-pressure
t ransmit ters connected to rece iv ing gages. These
pressure-measuring devices were ca l ib ra ted four
t imes during the course of high-temperature t e s t i n g .
The ca l ibrat ions were made at zero pump speed by
increasing the gas pressure in the pump (expansion)
tank in increments of approximately 10 psi and by
recording for each step the reading of the ind i
v idua l rece iv ing gage. During these ca l ib ra t ions ,
the pump-tank gas pressure was measured w i th a
master gage which had been ca l ib ra ted by the
dead-weight test method. The receiving-gage
readings for each pressure-measuring device were
corrected to the master-gage reading, and the
correct ions were p lo t ted. A smooth curve was
drawn through the correct ion po in ts . An ana lys is ,
based on each of three pressure-measuring-device
ca l ib ra t ions , was made of the al loy f low ra tes .
The maximum deviat ions of the probable actual
a l loy f low rate from the desired f low rate, token
from the corresponding water run, were ca lcu la ted
to be + 5 gpm and - 5 gpm for a l loy runs 3A and 5,
respec t i ve ly .
The gas pressure of the pump tank was measured
w i th a 0—30 psig laboratory-type test gage. The
gage was cal ibrated against the dead-weight-tested
master gage, and the maximum error in the range
of interest was 0.10 ps ig . The pump-tank gas
pressure data were not corrected.
The discharge pressure of the pump was measured
wi th a bel lows-actuated balanced-pressure t rans
mitter connected to a receiv ing gage. An ana lys is ,
based on each of three pump-discharge measuring-
device ca l ib ra t ions , was made of the pump head.
The largest deviat ion in pump head, based on the
three ca l ib ra t ions , was +1.1 f t . The d ischarge-
pressure data were corrected by using one of the
ca l ib ra t ions .
During the water cav i ta t ion tes ts , the system
temperature was measured wi th a d ia l type of
Taylor thermometer inserted into the f lowing l i qu id .
The thermometer was cal ibrated (8) after the
conclus ion of the water tests and was found to be
reading 2 ° F h igh. The water-temperature data
were corrected to th is ca l i b ra t ion .
The temperature of the NaK enter ing the pump
suct ion was measured during high-temperature
tes t ing by means of a Chromel-Alumel thermo
couple attached to the outside of the suct ion p ipe.
Subsequently, the thermocouple was cal ibrated in
place against a Pt , Pt-10% Rh thermocouple which
had been cal ibrated against an NBS thermocouple
(9). The ca l ibrat ion indicated that the Chromel-
Alumel temperature data were 7°F high, and this
correct ion was used in obtaining the vapor pressure
of the NaK. The suct ion pipe was thermally
insulated wi th 3 i n . of Superex (Johns-Manvi l le Co.)
pipe insu la t ion . The temperature gradient through
the wa l l of the pipe was estimated to be about
0 .9°F and was not used to correct the temperature
reading of the a l loy which entered the pump in le t .
3

DISCUSSION OF THE EXPERIMENT
The water tests proceeded smoothly except that
attempts to induce cav i ta t ion at the lowest speed,
2600 rpm and higher f l ow, 430 gpm, caused
osc i l l a t ions in the system-pressure l eve ls , and the
water became gassy. The gassing may have been
the resul t of a disturbance to the normal l iqu id
leakage ( F i g . 2) which f lows from the discharge
region of the impeller inward across the top side
of the impeller and into the free l iqu id surface in
the pump tank . The d i rect ion of the leakage may
be reversed when the head developed by the top
s ide of the impel ler exceeds the s ta t ic pressure
at the periphery of the impel ler . The reversal in
leakage f low may lead to the pumping of gas into
the system by the top side of the impel ler . The
remedy may possib ly be found in a change in the
head-producing ab i l i t y of the top side of the
impeller in order to fores ta l l the reversal of
leakage f low at pump appl ica t ion cond i t ions .
Water cav i ta t ion run No. 4 may have experienced
some gassing co inc identa l to cav i ta t i on . There
was no evidence of gassing in the other water
t es t s .
In v iew of the interest in NaK systems using
insert-gas b lankets , a d iscuss ion of the problem
of se l f -gass ing in the pumps is in order.
In the in i t i a l high-temperature tes t , nearly every
attempt to induce cav i ta t ion led to osc i l la t ions in
the system-pressure levels and to f looding of the
upper reaches of the pump tank w i th the hot NaK.
The d i f f i cu l t y was thought to ar ise from the
introduct ion of hel ium into the impeller in le t , and
the source of the hel ium was thought to be the
cold trap used for oxide removal . In th is dev ice ,
0 small por t ion, about 1.5 gpm, of the c i rcu la t ing
1500°F NaK is cooled to a re la t ive ly low temper
ature, 250—350°F, in order to remove sodium
oxide and is then returned to the system in the
pump suct ion l ine ( F i g . 1). It was postulated,
w i th the ass is tance of G. M. Watson, Mater ials
Chemistry D i v i s i o n , ORNL, that the temperature
dependence of hel ium so lub i l i t y in NaK accounted
for the helium in the pump tank. That i s , hel ium may be more soluble in 1500°F NaK in the pump
tank than in the 2 5 0 - 3 5 0 ° F NaK in the cold t rap.
The temperature dependence of the so lub i l i t y of
hel ium in NaK may be s imi lar to that of hel ium in
l iqu id b ismuth. As measured by Watson, the
so lub i l i t y of hel ium in l iqu id bismuth at a given
pressure increases w i th an increase in temperature.
Accord ing ly , va lv ing the co ld trap out of the system
was su f f i c ien t to prevent gassing the pump from
that source during subsequent high-temperature
operat ion.
At tempts to induce pump cav i ta t ion dur ing a
high-temperature run at 2600 rpm and 430 gpm
produced osc i l l a t ions in the system-pressure level
and a rapid r ise in the l iqu id level in the pump
tank in a manner very s imi lar to the water-gassing
incident descr ibed above.
The oxide level in the c i rcu la t ing NaK increased
from approximately 30 ppm, the value at the time
the cold trap was isolated from the system, to
approximately 225 ppm at the conclus ion of the
tes t .
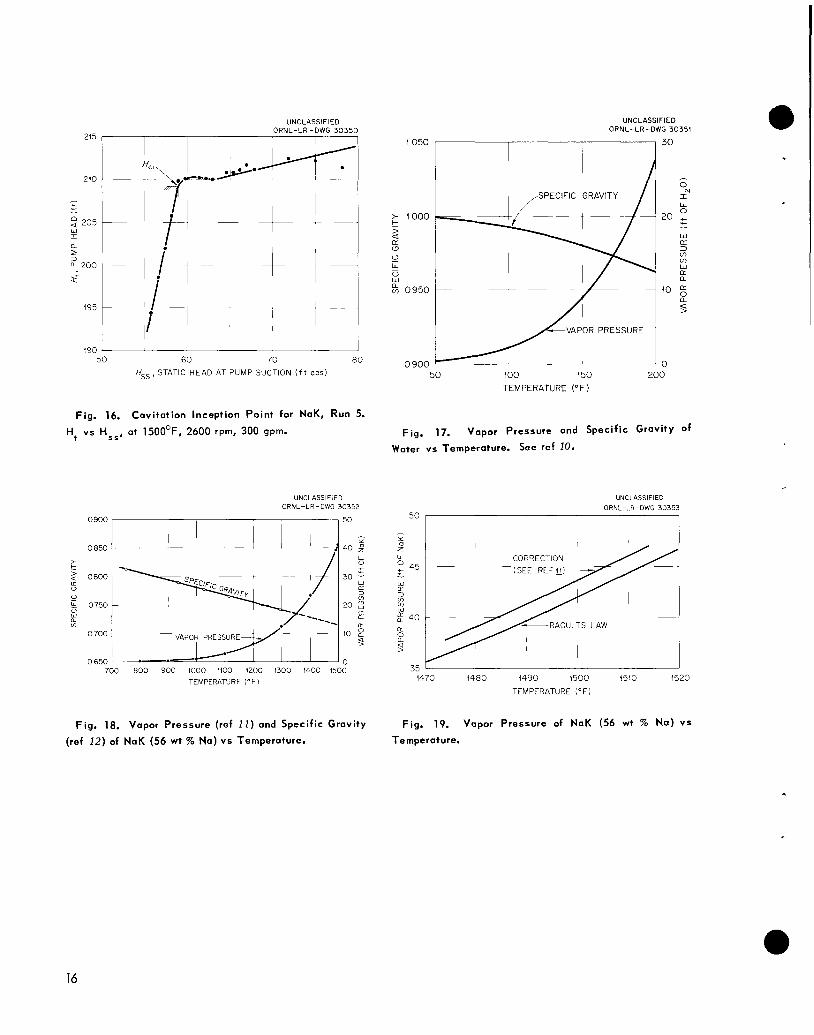
VAPOR PRESSURE AND SPECIFIC GRAVITY OF WATER AND OF NaK
The vapor pressure and the sp gr of water for
the temperature range of interest are presented in
F i g . 17. The values were taken from the standard
reference {10).
The vapor pressure of NaK, as predicted by
Raoul t 's low,and the spec i f i c gravi ty of the a l l oy ,
are presented in F i g . 18. Experimental work by
M i l l e r , Ewing, et al. (11) indicated that the vapor
pressure of the a l loy may be s l i gh t l y higher at a
given temperature than would be predicted by
Raoul t 's law. Figure 19 presents, for a temper
ature range of interest , the vapor pressure of the
a l loy OS predicted by Raoul t 's law and as exper i
mental ly checked by Mi l ler and Ewing (11). For
the purposes of th is correlat ion experiment, the
average of the two values was used. The values
for the sp gr of the a l loy were taken from p 34 of
ref {12).
4

RESULTS AND DISCUSSION
TEST DATA REDUCTION
The water- test data and computat ions for each
run are presented in Tables 2 and 3, respec t i ve ly .
The data for the NaK runs and the computations for
eoch run ore shown in Tables 4 and 5, respec t i ve ly .
Data for the test points (P ) are shown in the
hor izontal rows in Tables 2 and 4 . The f i r s t
hor izontal row of a run presents the data for the
f i r s t point of the run. The computations for each
test point (P , ) are shown in the ver t ica l columns pt
in Tables 3 and 5. The f i r s t ver t i ca l column of a run represents the computations for the f i rs t point
of the run.
For a l l t es ts , the average pump speed for each
run was set forth as the speed of that run, and the
average f low from the noncavi ta t ion region to just
beyond the inception of cav i ta t ion was used as
the f l ow . The corrected temperature was used as
the temperature of the run .
There are many methods of d i sp lay ing cav i ta t ion
data in graphical form, and Steponoff (p 266, 4) and
Church (p 83, 13) have out l ined severa l . The
convent ional methods cons is t in p lo t t ing pump
e f f i c iency vs Thoma's cav i ta t ion factor or
s ta t i c head at pump suc t ion , and pump head vs
Thoma's cav i ta t ion factor or s ta t ic head at pump
suc t i on . These data were plot ted in terms of
pump head vs s ta t ic head at pump suc t i on .
The equations for reducing test data to pump
head and s ta t ic head at pump suct ion are set forth
in Appendix B. The f low rates were ascertained by
using the equations presented in Appendix A and
the temperature mul t ip l ie r values presented in
Table 6.
Pump head vs stat ic head at pump suct ion was
plot ted for each run and is presented in the
Appendix as F igs . 3 through 7, i nc lus ive , for the
water tes ts , and in F i g s . 8 through 16, i nc lus ive ,
for the high-temperature a l loy runs. A smooth
curve was drawn in order to u t i l i ze as many of the
data points of each test as seemed prac t icab le .
Several c r i te r ia for the determinat ion of cav i ta t ion
incept ion are out l ined by Steponoff (p 264, 4).
The cr i ter ion used here involved ident i fy ing the
value of the stat ic head at pump suct ion at which
a continued drop in pump head occurred. Three
cr i ter ion-determining methods were invest igated,
employ ing:
1 . the intersect ion of the tangent to the nearly
hor izontal port ion of the curve w i th the tangent
to the s loping port ion of the curve,
2 . the intersect ion of a hor izontal l ine drawn
through the lowest noncavi tat ing pump-head
data point w i th the s loping portion of the curve,
3 . the intersect ion of a hor izontal l ine drawn 2 f t
below the lowest noncavi tat ing pump-head data
point w i th the s loping port ion of the curve.
The maximum deviat ion among the three methods
for the dif ference between corresponding water
and a l loy cav i ta t ion incept ion points was 0.6 f t
for run No. 1 . The second method was chosen in
order to determine the cav i ta t ion inception point
for each run and is i l lus t ra ted in F i g . 3 .
THE CORRELATION OF DATA FOR WATER AND NaK
The correlat ion cons is ts in a comparison of the
cav i ta t ion incept ion data obtained w i th h igh-
temperature NaK wi th an estimated value for
cav i ta t ion incept ion. The est imated value was
obtained by adding the dif ference in the vapor
pressures of the two l iquids (water and NaK) to
the cav i ta t ion inception value obtained w i th water
at the same condit ions of pump speed and l iquid
f l o w .
Table 1 ident i f ies the pump operating condi t ions
for each run and presents a comparison of the
est imated value for cav i ta t ion incept ion w i th the
experimental values for cav i ta t ion incept ion for
each NaK run.
For run 1 (Table 1), the estimated cav i ta t ion
incept ion value for NaK, 64.3 f t , was obtained by
adding 19.2 f t (the dif ference between the vapor
pressure of water and NaK for th is run) to 45.1 f t
(the cav i ta t ion inception value for water for this
run) . The experimental ly determined cav i ta t ion
incept ion value for NaK is 63.3 f t . Therefore,
the est imate is high by 1 ft for run 1.
DISCUSSION
In th is sec t ion , a coincidence of the largest
di f ferences between estimated and experimental
cav i ta t ion incept ion for NaK wi th the largest
di f ference between the vapor pressures of water
and NaK w i l l be pointed out, and the e f fec t of
temperature change on vapor pressure w i l l be
d i scussed .
5

The average di f ference (between the est imated
and experimental values for cav i ta t ion incept ion
by NaK) a r is ing from the 138°F water- test est imates
as presented in the last column of Tab le 1 was
3.9 f t , and the average di f ference ar is ing from the
188°F water- test est imates was 1.5 f t . The
average di f ference between the vapor pressures of
corresponding water tests and high-temperature
NaK tests was 36.4 f t for 138°F water and 20.1 f t
for 188°F water. The largest di f ference between
vapor pressures is associated w i th the larger
average dif ference of 3.9 f t . Ident ical comments
may be made for the 430 and 300 gpm runs.
Whether th is re la t ionsh ip can be deduced from f low
considerat ions or from thermodynamic properties
other than the vapor pressure of the a l loy and of
the water at 138 and at 188°F, or whether the
CONCLUSIONS
1 . For the centr i fugal pump under inves t iga t ion ,
the s ta t ic head at pump suc t ion , in feet absolu te ,
at cav i ta t ion inception was correlated for water
and for 1500°F NaK on the basis of the di f ferences
of the vapor pressures of the two l i qu ids . The
dif ference between the vapor pressure of water
and NaK, for the same condi t ions of pump speed
and l iquid f low, was added to the water- test
cav i ta t ion incept ion va lue, and th is est imate
proved to be a good approximation to the exper i
mental value found for cav i ta t ion incept ion wi th
NaK.
2. The nine est imated values for cav i ta t ion
inception by 1500°F NoK di f fer from the exper i
mental values over a range of +1 f t to - 4 . 9 f t .
The dif ferences y ie ld a maximum average di f fer
ence of 4.1 f t , which may be expressed as an
fact is o co inc idence, is not known to the author.
Figure 17 shows that a temperature change of
2 ° F changes the vapor pressure of 188°F water
by 1 f t . From F i g . 19 i t can be seen that a temper
ature change of 4 .4°F ef fects a change of 1 ft in
the vapor pressure of 1500°F NaK. The necessi ty
for precise temperature measurement is readi ly
apparent, and although much effort was expended
to obtain sat is factory measurements, the precis ion
required for ident i fy ing a change of 1 f t in vapor
pressure (part icular ly for 1500°F NoK) cannot be
guaranteed for the tes t . The equipment is gross,
cons is t ing of about 35 gal of a l loy in about 1500 lb
of Inconel and requir ing a safety-shie lded volume
of about 1200 f t ^ . The dif ferences noted above
ore not eas i l y subject to exp lanat ion .
average of 5% of the pump suct ion s ta t ic head
values at cav i ta t ion incept ion for the nine NaK
runs.
3 . It is suggested that , for the pump s tud ied ,
cav i ta t ion inception wi th other l iquid metals may
be est imated on the basis of water- test cav i ta t ion
incept ion and vapor pressure data. However, for
other pumps and other l i qu ids , s imi lar experimental
correlat ions should be obta ined.
RECOMMENDATIONS
1 . It is recommended that the temperatures of
the l iquids be more accurately determined in any
future attempt to correlate the data for cav i ta t ion
incept ion by a centr i fugal pump, par t icu lar ly if
any of the l iquids exh ib i t a steep slope of vapor
pressure vs temperature.
2 . It is a lso recommended that the use of
smaller tes t ing f ac i l i t i es be inves t iga ted.
CONCLUSIONS AND RECOMMENDATIONS
6

BIBLIOGRAPHY
( i ) W. B. Hal l and T . I. M. Cro f ts , " T h e Use of Sodium and Sodium-Potassium A l loy
as a Heat Transfer M e d i a , " Atomics 7(8), 273, 290 (1956).
(2) J . M. Trummel, Some Observations Made of Cavitating Sodium Flow in a Venturi, ORNL CF-54-8-225 (Aug. 31 , 1954).
(3) A. J . Steponoff, "Propel ler Pumps for Circulation of Molten S a l t , " Refiner and Natural Gasoline Manufacturer 19(12), 7 4 - 7 6 .
(4) A. J . Steponoff, Centrifugal and Axial Flow Pumps, Wiley, New York, 1948.
(5) Final Report, Development of Hermetically Sealed Centrifugal Pump Units for Liquid Metals, Nuclear Power Section, Allis-Chalmers Manufacturing Co. , Milwaukee, Wis., p 5 9 - 6 3 (June 30, 1953). Subcontract No. 56, under Contract No. W-31-109-ENG-52.
(6) H. C. Young and J . N. Simpson, ORNL CF-57-9-97 (Sept. 1957) (c lass i f ied) .
(7) H. J . Metz, personal communicat ion.
(8) J . N. Simpson, personal communicat ion.
(9) A . L . Southern, personal communicat ion.
{10) J . H. Keenon and F . G. Keyes, Thermodynamic Properties of Steam, Wiley, New York, 1936.
{11) R. R. Miller, C. T. Ewing, R. S. Hartmon, and H. B . Atkinson, J r . , Quarterly Progress Report No. 3 in the Measurement of the Physical and Chemical Properties of the Sodium-Potassium Alloy, Naval Research Laboratory Report No. C-3105, P 9 -12 (April 1947).
{12) Liquid Metals Handbook, 3d e d . , Sodium-NaK Supplement, Atomic Energy Com
miss ion and The Department of the Navy, GPO, Washington, (1955).
{13) A. H. Church, Centrifugal Pumps and Blowers, Wiley, New York, 1944.


APPENDIX A
LIST OF FIGURES
1. Test Loop for Cavitation Inception Tests.
2. Centrifugal Pump and Expansion Tank.
3. Cavitation Inception Point for Water, Run 1.
4. Cavitation Inception Point for Water, Run 2.
5. Cavitation Inception Point for Water, Run 3.
6. Cavitation Inception Point for Water, Run 4.
7. Cavitation Inception Point for Water, Run 5.
8. Cavitation Inception Point for NaK, Run 1.
9. Cavitation Inception Point for NaK, Run 2.
10. Cavitation Inception Point for NaK, Run 3A.
11. Cavitation Inception Point for NaK, Run 3B.
12. Cavitation Inception Point for NoK, Run 3C.
13. Cavitation Inception Point for NaK, Run 4A.
14. Cavitation Inception Point for NoK, Run 4B.
15. Cavitation Inception Point for NaK, Run 4C.
16. Cavitation Inception Point for NaK, Run 5.
17. Vapor Pressure and Specific Gravity of Water vs Temperature,
18. Vapor Pressure and Specific Gravity of NaK vs Temperature.
19. Vapor Pressure of NaK vs Temperature.


UNCLASSIFIED ORNL-LR-DWG 30336
3 - i n PIPE
CALIBRATION THERMOCOUPLE
4 - i n PIPE
THROTTLING VALVE-
VENTUR|--VENTURI PIPE-PRESSURE
-VENTURI THROAT-PRESSURE
Fig. 1. Test Loop for Cavitation Inception Tests.

UNCLASSIFIED ORNL-LR-DWG 33038
PUMP TANK GAS PRESSURE
NORMAL LEAKAGE FLOW
Fig. 2. Centrifugal Pump and Expansion Tank.

370
365
- 360 o < UJ f 355
i 3 5 0
345
3 4 0 4 0
UNCLASSIFIED ORNL-LR-DWG 30337
»c
1 /
/ •
/
^ - • s '
- — — —• -
5 0 6 0 70
H.,, STATIC HEAD AT PUMP SUCTION (ft obs)
80
260
255
250
i - 245
240 30
UNCLASSIFIED ORNL-LR-DWG 30340
H,.
4
V I
^
60 70
Fig . 6. Cavitation Inception Point for Woter, Run 4.
H^ vs H ^ j , at 140°F, 3000 rpm, 430 gpm.
F i g . 3. Cavitation Inception Point for Water, Run 1.
H^ vs H ^ j , at 190°F, 3375 rpm, 300 gpm.
UNCLASSIFIED ORNL-LR-DWG 30341
345
UNCLASSIFIED ORNL-LR-DWG 30338
30 40 50 60 70
Wjg STATIC HEAD AT PUMP SUCTION (f t abs)
F i g . 4. Cavitation Inception Point for Water, Run 2.
Hj vs H ^ ^ , at 140°F, 3375 rpm, 430 gpm.
290
285
280 -
275 -
270 -
265 -
260
UNCLASSIFIED ORNL-LR-DWG 30339
Fig . 7. Cavitation Inception Point for Water, Run 5.
H j vs H ^, at 190°F, 2600 rpm, 300 gpm.
370
UNCLASSIFIED ORNL-LR-DWG 30342
360
355
; "c
_>•!*-••-«.
.'
/ /•
^ _
60 70 80 90
« „5 , STATIC HEAD AT PUMP SUCTION (ft obs)
F ig . 5. Cavitation Inception Point for Water, Run 3.
^t " * ^ s s ' °* I'O""^' 3000 rpm, 300 gpm.
Fig. 8. Cavitation Inception Point for NaK, Run 1 .
Hj vs H^^ , at 1500°F, 3390 rpm, 300 gpm.
13

355
UNCLASSIFIED ORNL-LR-DWG 3 0 3 4 3
UNCLASSIFIED
ORNL-LR-DWG 30345
Fig. 9. Cavitation Inception Point for NaK, Run 2.
H^ vs H^^, at 1500°F, 3380 rpm, 430 gpm.
290
285
UNCLASSIFIED O R N L - L R - D W G 3 0 3 4 4
270
265
280
275
285
280
265 50 60 70 80
/ / g g , STATIC HEAD AT PUMP SUCTION ( f t obs)
F ig . 11 . Cavitation Inception Point for NaK, Run 3B.
H, vs H^^, at 1500°F, 3030 rpm, 300 gpm.
UNCLASSIFIED
ORNL-LR-DWG 30346
GO 70 80 90
H^^ STATIC HEAD AT PUMP SUCTION (ft obs)
F ig . 12. Cavitation Inception Point for NaK, Run 3C.
H^ vs H^^, at 1500°F, 3030 rpm, 300 gpm.
//gg , STATIC HEAD AT PUMP SUCTION ( f t obs)
Fig . 10. Cavitation Inception Point for NaK, Run 3A.
Hj vs H^^, at 1500°F, 3018 rpm, 300 gpm.
14

265
UNCLASSIFIED ORNL-LR-DWG 30347
250
245
Hr.
1 1 1
1
f- — ^ ^ ^
70 80 90 100
/^gg, STATIC HEAD AT PUMP SUCTION ( f t abs)
Fig . 13. Cavitat ion Inception Point for NaK, Run 4A.
H^ vs H , at 1500°F, 3000 rpm, 430 gpm. t ss' ' " ' ""
265
260 -
UNCLASSIFIED ORNL-LR-DWG 30348
< 255
245
265
260
255
250
245
240
i / f • /
/ /
UNCLASSIFIED ORNL-LR-DWG 30349
A
< /
f
'ci
H" 1 •
/ / •
/ /
70 80
«gg , STATIC HEAD AT PUMP SUCTION ( f t obs)
90
Fig . 15. Cavitation Inception Point for NaK, Run 4C.
H^ vs H^^, at 1500°F, 2985 rpm, 430 gpm.
80 90 (00 //gg, STATIC HEAD AT PUMP SUCTION (ft abs)
F ig . 14. Cavitat ion Inception Point for NaK, Run 4B.
H^ vs H , at 1500°F, 3000 rpm, 430 gpm. t s s ' ' ^^
15
UNCLASSIFIED ORNL-LR-DWG 3 0 3 5 0
t050
1000
> <
S 0950
0900
UNCLASSIFIED ORNL-LR-DWG 30351
3 0
1 0 0 1 5 0
T E M P E R A T U R E C F )
Fig. 16. Cavitation Inception Point for NaK, Run 5.
H^ vs H^^, at 1500°F, 2600 rpm, 300 gpm. F ig . 17. Vapor Pressure and Specific Gravity of
Water vs Temperature. See ref 10.
t 0750 -
UNCLASSIFIED ORNL-LR-DWG 30352
800 900 1000 1100 1200
TEMPERATURE (°F)
1300 1400 1500
UNCLASSIFIED
ORNL-LR-DWG 30353
RAOULTS LAW
1 4 9 0 1 5 0 0 1510
TEMPERATURE ( ° F )
1520
F ig . 18. Vapor Pressure (ref 11) and Specific Gravity
(ref 12) of NaK (56 wt % Na) vs Temperature.
F ig . 19. Vapor Pressure of NaK (56 wt % Na) vs
Temperature.
16

APPENDIX B
LIST OF TABLES
1. Comparison of Water and NaK Data for Cavitation Inception by Centrifugal Pump.
2. Cavitation Inception Data for Water Tests.
3. Computations of Cavitation Inception Data Obtained v/ith Water.
4. Cavitation Inception Data for NaK Tests.
5. Computations of Cavitation Inception Data Obtained witfi NaK.
6. Venturi Temperature-Multiplier.
17


Table 1 . Comparison of Water and NaK Data for Cavitation Inception by Centrifugal Pump
Run
No.
1
2
3
4
5
N ov
(rpm)
3375
3374
3003
2999
2603
Water
(gpm)
306
436
306
436
304
Tes ts
T
(°F)
188
138
188
138
188
^ c i (ft abs)
45.1
39.5
43.2
37.0
40.2
H vp (ft)
21.3
6.4
21.3
6.4
21.3
Run
No.
1
2
3A
3B
3C
4A
4B
4C
5
N av (rpm)
3390
3383
3018
3030
3047
3000
3000
2985
2601
*^av (gpni)
308
435
310
305
307
432
432
435
303
Sod
T
(°F)
1490
1501
1502
1497
1500
1493
1503
1503
1481
ium-Potass ium
^ P (ft)
40.5
43.0
43.2
42.1
42.7
41.2
43.5
43.5
38.5
«c
Tes ts
:l (f* " bs)
Est imated A l l oy Test
64.3
76.1
65.1
64.0
64.6
71.8
74.1
74.1
57.4
63.3
79.8
68.0
65.5
65.0
75.4
79.0
77.6
59.0
Dif fer
( f t)
+ 1.0
- 3 . 7
- 2 . 9
- 1 . 5
- 0 . 4
- 3 . 6
- 4 . 9
- 3 . 5
- 1 . 6
ence
(%)
+ 1.6
- 4 . 7
- 4 . 3
- 2 . 3
- 0 . 6
- 4 . 8
- 6 . 2
- 4 . 5
- 2 . 7
Tab le 2. Cav i ta t i on Incept ion Data for Water Tests
Run 1
Dote 1-28-57
Bar. 29.30 i n . Hg
Run 2
Date 12-27-56
Bar. 29.37 i n . Hg
N
(rpm)
3375
3371
3377
3377
3375
3375
3378
3372
3374
3377
3372
3373
3375
3372
3374
3377
3373
3375
3371
3376
3376
T
(°F)
189
189
190
190
190
190
190
190
190
190
141
140
138.5
140
140
140
140
140
140
140
140
^ d (psig)
165.8
158.6
155.4
155.0
153.5
152.9
150.8
148.2
147.0
145.0
154.0
145.7
142.0
139.2
139.3
138.4
138.2
136.2
134.9
131.8
129.0
^ t (psig)
16.7
9.9
7.0
6.0
5.1
4.5
3.9
3.3
3.1
2.7
17.0
9.5
6.5
4 .0
3.4
3.0
2.7
2.0
1.6
1.2
1.0
P
(psi'g)
167.9
160.6
157.7
157.2
155.5
154.9
152.9
150.4
148.9
146.8
159.2
150.8
147.3
144.4
144.5
143.5
143.1
140.9
139.4
136.5
133.9
(psig)
149.4
142.4
139.3
138.8
137.2
136.8
134.8
132.3
130.8
128.7
121.3
112.5
109.4
106.3
106.4
104.8
105.0
102.9
101.6
98.7
95.8
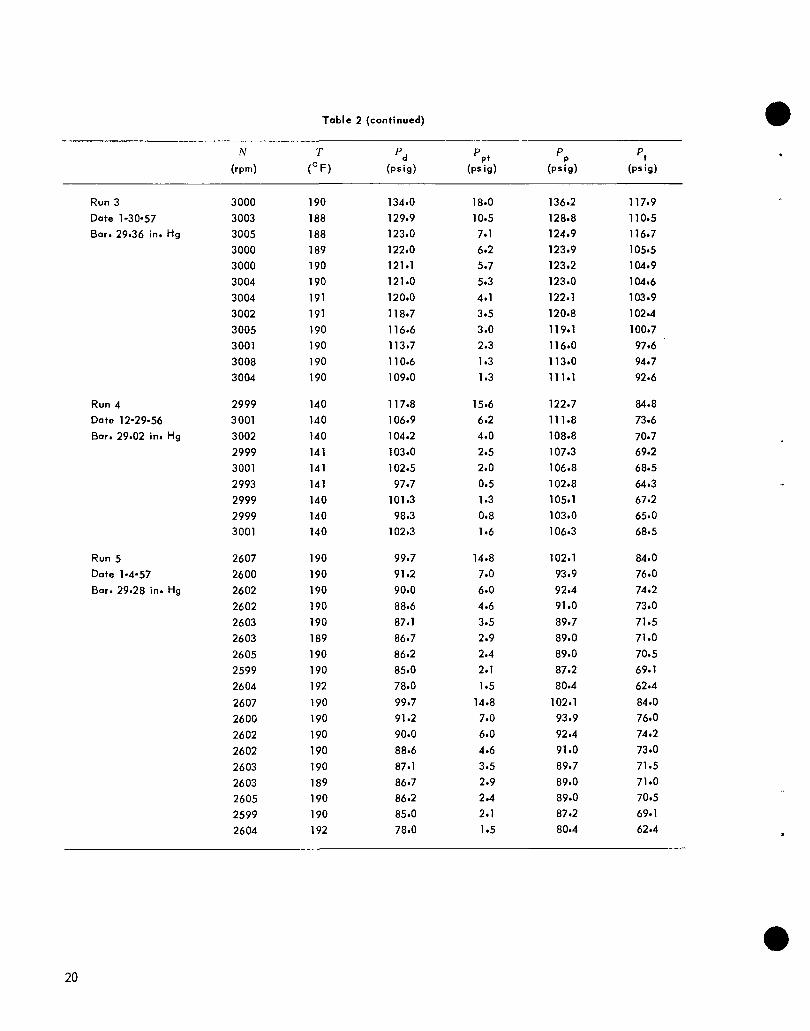
Table 2 (continued)
Run 3
Date 1-30-57 Bar. 29.36 in. Hg
Run 4
Dote 12-29-56 Bar. 29.02 in. Hg
Run 5
Date 1-4-57
Bar. 29.28 in. Hg
N
(rpm)
3000
3003
3005 3000
3000
3004
3004
3002
3005 3001
3008
3004
2999
3001
3002
2999
3001
2993
2999
2999
3001
2607
2600
2602
2602
2603
2603
2605
2599
2604
2607
2600
2602
2602
2603
2603
2605
2599
2604
r (°F)
190
188
188
189
190
190
191
191
190
190
190
190
140
140
140
141
141
141
140
140
140
190
190
190
190
190
189
190
190
192
190
190
190
190
190
189
190
190
192
^6 (psig)
134.0
129.9
123.0
122.0
121.1
121.0
120.0
118.7
116.6
113.7
110.6
109.0
117.8
106.9
104.2
103.0
102.5
97.7
101.3
98.3
102.3
99.7
91.2
90.0
88.6
87.1
86.7 86.2
85.0
78.0
99.7 91.2
90.0
88.6
87.1
86.7 86.2
85.0
78.0
^ t (psig)
18.0
10.5
7.1
6.2
5.7
5.3
4.1
3.5
3.0
2.3
1.3
1.3
15.6 6.2
4.0
2.5 2.0
0.5
1.3
0.8
1.6
14.8
7.0
6.0
4.6
3.5
2.9
2.4
2.1
1.5
14.8
7.0
6.0
4.6
3.5
2.9
2.4
2.1
1.5
P P
(psig)
136.2
128.8 124.9
123.9
123.2
123.0
122.1
120.8
119.1
116.0
113.0
111.1
122.7
111.8
108.8
107.3
106.8
102.8
105.1
103.0
106.3
102.1
93.9
92.4
91.0
89.7
89.0
89.0
87.2
80.4
102.1
93.9
92.4
91.0
89.7
89.0
89.0
87.2
80.4
^t (psig)
117.9
110.5
116.7
105.5
104.9
104.6
103.9
102.4
100.7
97.6
94.7
92.6
84.8
73.6
70.7 69.2
68.5
64.3 67.2
65.0
68.5
84.0
76.0
74.2
73.0
71.5 71.0
70.5
69.1
62.4
84.0
76.0
74.2
73.0
71.5
71.0
70.5
69.1
62.4
20

Table 3. Computations of Cavitation Inception Data Obtained with Water
Run 1
Pj (psig)
Pp, (P^ig)
^ d - ^ , (P^i)
2.31
sp gr ° P'
C + Av2/2g (ft)
H, (ft)
2.31
165.8 158.6 155.4 155.0 153.5 152.9 150.8 148.2 147.0 145.0
16.7 9.9 7.0 6.0 5.1 4.5 3.9 3.3 3.1 2.7
149.1 148.7 148.4 149.0 148.4 148.4 146.9 144.9 143.9 142.3
356.0 355.2 354.5 355.9 354.5 354.5 350.9 346.1 343.7 339.9
7.2 7.2 7.2 7.2 7.2 7.2 7.2 7.2 7.2 7.2
363.2 362.4 361.7 363.1 361.7 361.7 358.1 353.3 350.9 347.1
(Pp,) (ft) 40.0 23.6 16.7 14.3 12.2 10.7 9.3 7.9 7.4 6.4 sp gr
Bar. (ft)
H,s (ft abs)
A P ^ (psi)
Run 2
Pj (psig)
Ppt (P^i9)
P d - P p t ( P - )
2.31
34.4 34.4 34.4 34.4 34.4 34.4 34.4 34.4 34.4 34.4
74.4 58.0 51.1 48.7 46.6 45.1 43.7 42.3 41.8 40.8
18.5 18.4 18.4 18.4 18.3 18.1 18.1 18.1 18.1 18.1
154.0 145.7 142.0 139.2 139.3 138.4 138.2 136.2 134.9 131.8 129.0
17.0 9.5 6.5 4.0 3.4 3.0 2.7 2.0 1.6 1.2 1.0
137.0 136.2 135.5 135.2 135.9 135.4 135.5 134.2 133.3 130.6 128.0
(Pj - P ) (ft) 322.0 320.0 318.5 318.0 319.5 318.2 318.5 315.2 313.0 307.0 301.0 sp gr
C + Av2/2g (ft)
H, (ft)
2.31
17.9 17.9 17.9 17.9 17.9 17.9 17.9 17.9 17.9 17.9 17.9
339.9 337.9 336.4 335.9 337.4 336.1 336.4 333.1 330.9 324.9 318.9
(Ppt) ( f ) sp gr
Bar. (ft)
H^, (ft abs)
^P^ (psi)
Run 3
Pj (psig)
Ppt (psig)
Pd - Pp, (psi)
2.31
39.9 22.3 15.3 9.4 8.0 7.0 6.3 4.7 3.9 2.9 2.3
33.9 33.9 33.9 33.9 33.9 33.9 33.9 33.9 33.9 33.9 33.9
73.8 56.2 49.2 43.3 41.9 40.9 40.2 38.6 37.8 36.8 36.2
37.9 38.3 37.9 38.1 38.1 38.7 38.1 38.0 37.8 37.8 38.1
134.0 126.9 123.0 122.0 121.1 121.0 120.0 118.7 116.6 113.7 110.6 109.0
18.0 10.5 7.1 6.2 5.7 5.3 4.1 3.5 3.0 2.3 1.3 1.3
116.0 116.4 115.9 115.8 115.4 115.7 115.9 115.2 113.6 111.4 109.3 107.7
(Pi~P ,) (ft) 277.4 278.3 277.2 276.9 276.0 276.7 277.2 275.5 271.7 266.4 261.4 257.5 sp gr
C + Av2/2g (ft)
H, (ft)
2.31
sp gr (Pp,) (ft)
7.2 7.2 7.2 7.2 7.2 7.2 7.2 7.2 7.2 7.2 7.2 7.2
284.6 285.5 284.4 284.1 283.2 283.9 284.4 282.7 278.9 273.6 268.6 264.7
43.0 25.1 17.0 14.8 13.6 12.7 9.8 8.4 7.2 5.5 3.1 3.1
21

Table 3 (continued)
Run 3
Bar. (ft)
H^, (ft abs)
A P ^ (psi)
Run 4
Pj (psig)
^ d - ^ p t ( P - )
2.31
sp gr (P , -Pp , ) (ft)
c + AvV2g (ft)
H^ (ft abs)
2.31 (Pp,)(ft)
sp gr
Bar. (ft)
H3, (ft abs)
A P ^ (psi)
Run 5
Pj (psig)
Ppt (P-9)
2.31
sp gr
C + Av/2/2g (ft)
H^ (ft)
2.31 (Ppt) (*•)
sp gr ^
Bar. (ft)
H (ft abs) ss A P (psi)
34.5 34.5 34.5 34.5 34,5 34.5 34.5 34,5 34.5 34.5 34.5 34.5
77.5 59.6 51.5 49,3 48,1 47,2 44,3 42,9 41.7 40.0 37.6 37.6
18.3 18.3 18.2 18.4 18.3 18.4 18.2 18.4 18.4 18,4 18.3 18.5
117,8 106.9 104.2 103.0 102.5 97.7 101.3 98.3 102.3
15.6 6.2 4.0 2.5 2.0 0.5 1.3 0.8 1.6
102.2 100.7 100.2 100,5 100.5 97.2 100.0 97.5 100.7
240.0 236.8 235.5 236.0 236.0 228.4 235.0 229.1 236.8
18.4 18.4 18.4 18.4 18.4 18.4 18.4 18.4 18.4
258.4 255.2 253.9 254.4 254.4 246.8 253.4 247.5 253.2
36.7 14.6 9.4 5.9 4 .7 1.2 2.9 1.8 3.8
33.5
38.2
38.3
33.5
34.7
38.5
33.5
36.4
37.9
33.5
35.3
38.0
33.5
37.3
37.8
33.5 33.5 33.5 33.5
70.2 48.1 42.9 39,4
37.9 38.2 38.1 38.1
99.7 91.2 90.0 88.6 87,1 86.7 86.2 85.0 78.0
14.8 7.0 6.0 4.6 3.5 2.9 2.4 2.1 1.5
84.9 84.2 84.0 84.0 83.6 83.8 83,8 82.9 76.5
. ( P _ p ) ( f t ) 203.0 201.1 200.7 200.7 199.8 200.2 200.2 198.0 182.7 d 1
7.2 7.2 7.2 7.2 7.2 7.2 7.2 7.2 7.2
210.2 208.3 207.9 207,9 207.0 207.4 207.4 205.2 189.9
35.3 16.7 14.3 11.0 8.4 6.9 5.7 5.0 3.6
34.7 34.7 34.7 34.7 34.7 34.7 34.7 34.7 34.7
70.0 51,4 49.0 45.7 43.1 41.6 40.4 39.7 38.3
18.1 17.9 18.2 18.0 18.2 18.0 18.5 18.1 18.0
22

Table 4> Cavitation Inception Data for KaK Tests
Run 1
Date 10-18-57
Bar. 27.17 in. Hg
Run 2
Date 10-26-57
Bar. 29.15 in. Hg
Run 3A
Date 10-17-57
Bar. 29.05 in. Hg
Run 3B
Date 10-17-57
Bar. 29.05 in. Hg
N
(rpm)
3390
3390
3390
3390 3390
3390
3390
3390
3390
3390
3390
3390
3390
3390
3382
3385
3382
3383
3382
3377
3382
3378
3381
3384
3387
3391
3378
3382
3388
3389
3018
3018
3018
3018
3018 3018
3018
3018
3030
3030
3030
3030
3030
3030
r (°F)
1500
1498
1498
1497
1497
1497
1497
1497
1497
1497
1497
1497
1497
1497
1508
1508
1508
1508
1508
1508
1508
1508
1508
1508
1508
1508
1508
1508
1508
1508
1510
1510
1510
1510
1510
1510
1510
1510
1504
1504
1504
1504
1504
1504
^d (psig)
121.0
120.0
1T9.0
118.0
117.6
117.1
116.8
116.5
116.3
116.0
115.6
115.0
114.0
113.0
117.0
115.2
113.1
112.5
112.1
111.8
111.3
111.1
110.7
110.2
109.7
108.2
107.3
107.1
106.0
104.7
93.0
92.2
91.7
90.3
89.3
88.0
87.0
86.0
94.9
94.0
93.5
93.0
92.5
91.8
(psig)
11.0
10.0
9.0
8.0
7.2
6.7
6.5
6.2
6.0
5.7
5.5
5.2
4.9
4.7
16.0
14.5
13.0
12.0
11.7
11.2
11.0
10.7
10.5
10.2
10.0
9.7
9.5
9.5
9.2
9.0
8.6
7.5 7.0
6.5 6.2
6.0
5.7
5.5
9.0
8.0
7.5
7.0
6.5 6.0
P P
(psig)
124.2
123.1
122.1
121.4
120.7
120.3
120.0
119.8
119.6
119.4
118.9
118.4
117.4
116.2
122.7
121.0
119.3
118.3
118.0
117.6
117.4
117.2
116.7
116.4
115.6
113.9
112.9
112.6
111.6
110.4
96.9
96.3
95.7
94.4
93.5 92.2
91.1
90.2
98.8
97.8
97.4
97.0
96.5
95.7
^ t (psig)
110.6
109.6
108.6
108.0
107.3
107.0
106.4
106.4
106.2
106.0
105.6 105.2
104.2
103.2
96.9
94.3
92.6
91.9
91.6
91.2
90.9
90.6
90.2
89.8
89.2
88.2
87.2
87.0
86.2
85.3
83.5
82.8
82.2
81.0
80.4
79.2
78.3
77.2
85.7
84.8
84.3
83.9
83.3
82.6
23

Table 4 (continued)
Run 3B
Date 10-17-57
Bar. 29.05 in. Hg
Run 3C
Date 10-18-57
Bar. 29.17 in. Hg
Run 4A
Date 10-11-57
Bar. 29.3 in. Hg
Run 4B
Date 10-18-57
Bar. 29.17 in. Hg
Run 4C
Date 10-18-57
Bar. 29.17 in. Hg
N
(rpm)
3030
3030
3030
3030
3030
3030
3030
3034
3052
3042
3055
3055
3055
3055
3058
3000
3000
3000
3000
3000
3000
3000
3000
3000
3000
3000
3000
3000
3000
3000
3000
3000
3000
3000
2985
2985
2985
2985
2985
2985
2985
2985
2985
r (°F)
1504
1504
1504
1504
1504
1500
1507
1507
1507
1507
1507
1507
1507
1507
1507
1501
1501
1501
1499
1500
1500
1500
1500
1500
1510
1510
1510
1510
1510
1510
1510
1510
1510
1510
1510
1510
1510
1510
1510
1510
1510
1510
1510
^d (psig)
89.8
88.6
87.4
86.7
84.0
98.3
96.0
94.0
93.1
93.0
92.1
91.6
90.8 89.9
88.7
87.1
85.7
84.5
83.9
82.9
82.4
81.4
79.4
77.8
87.6
86.6
85.4
84.6
83.1
82.7
81.9
80.0
79.0
77.7
85.5
85.0
84.8
84.4
84.1
84.0
83.9
83.7
83.2
(psig)
5.5
5.2
5.0
4.7
4.2
12.2
9.8
8.0
7.0
6.5
6.0
5.7
5.5 5.2
5.0
14.1
13.1
11.8
11.2
10.0
9.5 9.0
8.5
8.1
13.9
13.0
12.0
10.9 10.0
9.7
9.5
9.2
9.0
8.7
12.6
12.1
11.7
11.5
11.2
11.0
10.7
10.5 10.2
P P
(psig)
93.8
92.7
91.4
90.5
87.8
102.2
100.1
98.1
97.2
96.9
96.2
95.6
94.8 94.0
92.7
93.9
92.0
90.8
90.0
89.0
88.0
87.2
85.6
83.0
94.3
93.1
91.8
90.8
89.3
88.7
87.9
86.4
85.4
83.3
91.6
90.9
90.6
90.4
90.1
89.8
89.6
89.4
89.1
^t (psig)
81.0
79.9 78.8
78.1
75.6
88.8
87.0
85.0
84.2
83.9
83.2
82.6
81.8
81.1
80.0
67.8
65.8
64.7
63.8
63.0
62.0 61.3
60.0
57.0
67.6
66.5
65.4
64.3
62.8
62.4
62.0
60.0
59.3
57.5
65.1
64.5
64.0
63.8
63.6
63.3
63.0
62.9
62.4
24

Table 4 (continued)
R u n 4 C
Date 10-18-57
Bar. 29.17 in. Hg
Run 5
Date 10-18-57
Bar. 29.18 in . Hg
N
(rpm)
2985
2985
2985
2985
2985
2985
2985
2985
2600
2600
2600
2600
2600
2603
2603
2603
2603
2603
2603
2603
2603
2603
2603
2603
2603
T
(°F)
1510
1510
1510
1510
1510
1510
1510
1510
1487
1487
1487
1487
1487
1486
1486
1486
1486
1486
1488
1488
1488
1488
1488
1488
1488
^ d (psig)
83.0
82.9
82.2
81.1
79.6
78.6
76.5
74.5
72.4
71.7
70.8
69.1
69.0
68.6
68.2
68.0
67.0
66.8
66.6
66.0
65.7
64.2
62.8
61.5
60.0
^ t (psig)
10.0
9.7
9.5
9.2
9.0
8.7
8.4
8.2
9.9
9.0
8.0
6.7
6.5
6.2
6.0
5.7
5.2
5.0
4.7
4.2
4.0
3.7
3.5
3.2
3.0
P P
(psig)
88.6
88.3
87.8
86.6
85.2
84.4
82.0
80.9
75.0
74.6
73.7
72.2
72.0
71.6
71.3
71.0
70.1
69.8
69.6
69.1
69.0
67.7
65.8
64.5
63.0
(psig)
62.2
61.9
61.5
60.5
59.6
59.0
57.2
55.7
62.5
61.8
60.8
59.4
59.2
58.7
58.6
58.4
57.3
57.0
56.8
56.0
55.7
54.5
53.2
52.1
50.8
25

Table 5. Computations of Cavitation Inception Data Obtained with NaK
Run 1
P dc
(psig) 119.6 118.6 117.6 116.6 116.2 115.7 115.4 115.1 114.9 114.6 114.2 113.6 112.6 111.6
P . (psig) 11.0 10.0 9.0 8.0 7.2 6.7 6.5 6.2 6.0 5.7 5.5 5.2 4.9 4.7 p»
P. - P (psi) 108.6 108.6 108.6 108.6 109.0 109.0 108.9 108.9 108.9 108.9 108.7 108.4 107.7 106.9 dc p r
2.31 - ( P , - P .) (ft) 350.0 350.0 350.0 350.0 351.0 351.0 351.0 351.0 351.0 351.0 350.2 349.9 347.0 342.0
spgr ^= P*
C + Av/^/2g(f t ) 12.4 12.4 12.4 12.4 12.4 12.4 12.4 12.4 12.4 12.4 12.4 12.4 12.4 12.4
H^ (ft) 362.4 362.4 362.4 362.4 363.4 363.4 363.4 363.4 363.4 363.4 363.4 362.3 359.4 354.4
2.31 (P J (ft) 35.4 32.2 29.0 25.8 23.4 21.8 21.0 20.2 19.5 18.5 17.7 16.9 16.0 15.3
pt spgr
Bar. (ft) 46.2 46.2 46.2 46.2 46.2 46.2 46.2 46.2 46.2 46.2 46.2 46.2 46.2 46.2
H (ft abs) 81.6 78.4 75.2 72.0 69.6 68.0 67.2 66.4 65.7 64.7 63.9 63.1 62.2 61.5
A P (psi) 13.2 13.1 13.1 13.0 13.0 12.9 13.2 13.1 13.1 13.1 13.0 12.9 12.9 12.7 ss
vc
Run 2
P dc
(psig) 117.0 115.2 113.1 112.5 112.1 111.8 111.3 111.1 110.7 110.2 109.7 108.2 107.3 107.1 106.0 104.7
P (psig) 16.0 14.5 13.0 12.0 11.7 11.2 11.0 10.7 10.5 10.2 10.0 9.7 9.5 9.5 9.2 9.0 p*
P^ -P (psi) 101.0 100.7 100.1 100.5 100.4 100.6 100.3 100.4 100.2 100.0 99.7 98.5 97.8 97.6 96.8 95.7 dc p t
2.31 (P j - P J (ft) 327.2 326.5 324.0 325.5 325.0 326.0 325.0 325.0 324.6 323.5 323.0 319.0 317.0 316.0 313.5 310.0 dc p t spgr >'
C + ^V^/2g(.h) 25.8 25.8 25.8 25.8 25.8 25.8 25.8 25.8 25.8 25.8 25.8 25.8 25.8 25.8 25.8 25.8
Hj (ft) 353.0 352.3 349.8 351.3 350.8 351.8 350.8 350.8 350.4 349.3 348.8 344.8 342.8 341.8 339.3 335.8
2.31 (P ) (ft) 51.8 47.0 42.1 38.9 38.1 36.4 35.6 34.8 34.0 33.2 32.4 31.6 30.8 30.8 30.0 29.2
pt spgr
Bar. (ft) 46.3 46.3 46.3 46.3 46.3 46.3 46.3 46.3 46.3 46.3 46.3 46.3 46.3 46.3 46.3 46.3
H (ft abs) 98.1 93.3 88.4 85.2 84.4 82.7 81.9 81.1 80.3 79.5 78.7 77.9 77.1 77.1 76.3 75.5 ss
A P (psi) 25.4 26.3 26.4 26.1 26.1 26.1 26.2 26.3 26.2 26.3 26.1 25.4 25.4 25.3 25.1 24.9 vc

Table 5 (continued)
Run 3A
^dc <P^'9>
Ppt (P^'9)
^ d c - ^ t ^ P - )
2.31
( ^ d c - ^ ' p t H f t ) spgr
C + AvV2g (ft)
H (ft)
2.31 ( P p , ) ( f t )
spgr
Bar. (ft)
H (ft abs) ss
A P , , (ps.)
91.9 91.1 90.6 89.2 88.2 87.0 86.0 85.0
8.6 7.5 7.0 6.5 6.2 6.0 5.7 5.5
83.3 83.6 83.6 82.7 82.0 81.0 80.3 79.5
270.0 271.0 271.0 268.0 266.0 262.0 260.0 258.0
12.4 12.4 12.4 12.4 12.4 12.4 12.4 12.4
282.4 283.4 283.4 280.4 278.4 274.4 272.4 270.4
28.0 24.3 22.7 21.0 20.2 19.5 18.7 17.8
46.1 46.1 46.1 46.1 46.1 46.1 46.1 46.1
74.1 70.4 68.8 67.1 66.3 65.6 64.8 63.9
13.2 13.4 13.3 13.2 12.9 12.8 12.6 12.8
Run 3B
^dc <P^'9>
Ppt (P^'9)
P d c - ^ p t ( P - )
2.31
< ^ d c - P p , ) ( f * ) spgr
C+AvV2g( f t )
H, (ft)
2.31 (Pp,) (ft)
spgr
Bar. (ft)
H (ft abs) s s
A P (psi) vc
93.8 92.9 92.4 91.9 91.4 90.7 88.7 87.5 86.4 85.7 83.0
9.0 8.0 7.5 7.0 6.5 6.0 5.5 5.2 5.0 4.7 4.2
84.8 84.9 84.9 84.9 84.9 84.7 83.2 82.3 81.4 81.0 78.8
274.0 274.2 274.2 274.2 274.2 273.5 269.0 266.0 263.0 261.5 254.0
12.4 12.4 12.4 12.4 12.4 12.4 12.4 12.4 12.4 12.4 12.4
286.4 286.6 286.6 286.6 286.6 285.9 281.4 278.4 275.4 273.9 266.4
29.1 25.8 24.2 22.6 21.0 19.4 17.8 17.0 16.2 15.4 13.7
46.1 46.1 46.1 46.1 46.1 46.1 46.1 46.1 46.1 46.1 46.1
75.2 71.9 70.3 68.7 67.1 65.5 63.9 63.1 62.3 61.5 59.8
12.9 12.8 12.9 12.9 13.0 13.0 12.6 12.6 12.4 12.2 12.1
•

00
Run 3C
^dc <P^'9)
Pp,(psig)
^ d c - ^ p , ( P - )
2.31
s p g r ^ ^ - - ^ ' > ^ ' * ^
C + Av/V2g (ft)
H, (ft)
2.31 (P„) (ft)
spgr P*
Bar. (ft)
H^^ (ft abs)
A P , , (psi)
Run 4A
^dc <P^'9)
Pp, (psig)
^ d c - ^ t ( P - )
2.31 / n r» \ / C . \
s p g r ' ^ ^ = ' ^P *^^ ' * '
C + AvV2g (ft)
H, (ft)
2.31 (P ,) (ft)
spgr P*
Bar. (ft)
H^^ (ft abs)
A P , , (ps.)
97.1
12.2
84.9
274.0
12.4
286.4
39.6
46.2
85.8
13.1
86.1
14.1
72.0
232.5
25.8
258.3
45.4
46.5
91.9
25.8
94.8
9.8
85.0
274.5
12.4
286.9
31.8
46.2
78.0
12.9
84.7
13.1
71.6
231.2
25.8
257.0
42.2
46.5
88.7
25.9
92.9
8.0
84.9
274.2
12.4
286.6
25.8
46.2
72.0
12.9
83.5
11.8
71.7
231.4
25.8
257.2
38.2
46.5
84.7
25.8
Table 5 (continued)
92.0
7.0
85.0
274.7
12.4
287.1
22.6
46.2
68.8
12.9
82.9
11.2
71.7
231.5
25.8
257.3
36.1
46.5
82.6
26.0
91.9
6.5
85.4
276.0
12.4
288.4
21.0
46.2
67.2
12.9
81.9
10.0
71.9
232.3
25.8
258.1
32.2
46.5
78.7
25.8
91.0
6.0
85.0
274.7
12.4
287.1
19.4
46.2
65.6
12.8
81.4
9.5
71.9
232.3
25.8
258.1
30.6
46.5
77.1
25.8
90.5
5.7
84.8
273.9
12.4
286.3
18.6
46.2
64.8
12.9
80.4
9.0
71.4
230.8
25.8
256.6
29.0
46.5
75.5
25.6
89.7
5.5
84.2
272.0
12.4
284.4
17.8
46.2
64.0
13.0
78.5
8.5
70.0
226.0
25.8
251.8
27.4
46.5
73.9
25.3
88.8
5.2
83.6
270.0
12.4
282.4
17.0
46.2
63.2
12.7
76.9
8.1
68.8
222.0
25.8
247.8
26.3
46.5
72.8
25.6
87.6
5.0
82.6
267.5
12.4
279.9
16.2
46.2
62.4
11.6

Table 5 (continued)
Run 4B
P j , (psig)
Pp, (psig)
^ d c - ^ t ( P - )
2.31 ( ' ' d c - ^ f ' ^ f t )
spgr - ^ P'
C + Al /2/2g (ft)
H (ft)
2.31 (Pp,) (ft)
spgr P*
Bar. (ft)
H^^ (ft abs)
A P „ (ps.)
Run 4C
P j , (psig)
Pp,(psig)
^ d c - ^ t ( P - )
2.31
.„."•'•-'•"'"•' c + ^v'^/2g (ft)
H, (ft)
2.31 (P„,) (ft)
spgr P*
Bar. (ft)
H (ft abs) ss
A P „ (ps.)
86.6
13.9
72.7
234.9
25.8
260.7
44.9
46.2
91.1
26.4
84.5
12.6
71.9
232.8
25.8
258.6
41.0
46.5
87.5
26.3
85.6 84.4 83.6 82.1 81.7 81.0 79.1 78.1 76.8
13.0 12.0 10.9 10.0 9.7 9.5 9.2 9.0 8.7
72.6 72.4 72.7 72.1 72.0 71.5 69.9 69.1 68.5
234.5 233.9 234.7 232.9 232.5 231.0 225.6 223.2 219.8
25.8 25.8 25.8 25.8 25.8 25.8 25.8 25.8 25.8
260.3 259.7 260.5 258.7 258.3 256.8 251.4 249.0 245.6
42.0 38.7 35.4 32.3 31.5 30.7 29.9 29.1 28.3
46.2 46.2 46.2 46.2 46.2 46.2 46.2 46.2 46.2
88.2 84.9 81.6 78.5 77.7 76.9 76.1 75.3 74.5
26.3 26.1 26.2 26.3 26.1 25.7 26.1 25.8 25.4
84.0 83.8 83.4 83.1 83.1 82.9 82.7 82.2 82.0 81.8 81.2 80.1 78.7 77.7 75.6 73.6
12.1 11.7 11.5 11.2 11.0 10.7 10.5 10.2 10.0 9.7 9.5 9.2 9.0 8.7 8.4 8.2
71.9 72.1 71.9 71.9 72.0 72.2 72.2 72.0 72.0 72.1 71.7 70.9 69.7 69.0 67.2 65.4
232.8 233.5 233.0 232.8 233.2 233.8 234.0 233.1 233.2 233.4 232.2 229.5 226.0 223.5 217.8 211.8
25.8 25.8 25.8 25.8 25.8 25.8 25.8 25.8 25.8 25.8 25.8 25.8 25.8 25.8 25.8 25.8
258.6 259.3 258.8 258.6 259.0 259.6 259.8 258.9 259.0 259.2 258.0 255.3 251.8 249.3 243.6 237.6
39.4 38.1 37.2 36.4 35.6 34.8 34.0 33.2 32.4 31.6 30.8 30.0 29.2 28.4 27.2 26.8
46.5 46.5 46.5 46.5 46.5 46.5 46.5 46.5 46.5 46.5 46.5 46.5 46.5 46.5 46.5 46.5 85.9 84.6 83.7 82.9 82.1 81.3 80.5 79.7 78.9 78.1 77.3 76.5 75.7 74.9 73.7 73.3
26.2 26.4 26.4 26.3 26.3 26.4 26.3 26.5 26.2 26.3 26.2 26.0 25.6 25.4 24.9 25.4

Table 5 (continued)
Run 5
P , (psig) 71.6 70.9 70.0 68.3 68.2 67.8 67.4 67.2 66.3 66.1 65.9 65.3 65.0 63.5 62.1 60.8 59.3 d c
P , (ps.g) 9.9 9.0 8.0 6.7 6.5 6.2 6.0 5.7 5.2 5.0 4.7 4.2 4.0 3.7 3.5 3.2 3.0 pt
P , - P (ps.) 61.7 61.9 62.0 61.6 61.7 61.6 61.4 61.5 61.1 61.1 61.2 61.1 61.0 59.8 58.6 57.6 56.3 dc pt
2.31 ( P j - P J (ft) 199.0 199.7 200.0 198.7 199.3 198.7 198.4 198.4 197.6 197.7 197.8 197.6 197.4 193.4 189.5 186.2 182.2 dc p t spgr
C + A v V 2 g ( f t ) 12.4 12.4 12.4 12.4 12.4 12.4 12.4 12.4 12.4 12.4 12.4 12.4 12.4 12.4 12.4 12.4 12.4
H^ (ft) 211.4 212.1 212.4 211.1 211.7 211.1 210.8 210.8 210.0 210.1 210.2 210.0 209.8 205.8 201.9 198.6 194.6
2.31 (P .) (ft) 32.1 29.0 25.8 21.8 20.9 20.1 19.3 18.5 16.9 16.1 15.3 13.7 12.9 12.1 11.3 10.5 9.7
p t spgr
Bar. (ft) 46.1 46.1 46.1 46.1 46.1 46.1 46.1 46.1 46.1 46.1 46.1 46.1 46.1 46.1 46.1 46.1 46.1
H ^ ( f t abs) 78.2 75.1 71.9 67.9 67.0 66.2 65.4 64.6 63.0 62.2 61.4 59.8 59.0 58.2 57.4 56.6 55.8
A P (ps.) 12.5 12.8 12.8 12.6 12.6 12.7 12.7 12.4 12.7 12.7 12.6 12.9 13.1 13.0 12.4 12.2 12.1 vc '^
Table 6. Venturi Temperature-Multiplier
Temperature, t
(°F)
140
190
1500
TM
0.8414
0.849
1.011
(TAl/TA1,5ooOp) ( ™ / ™ , 5 0 0 ° F ) ^
0,832 0.6922
0.8397 0,7051

APPENDIX C
V E N T U R I METER T E M P E R A T U R E - M U L T I P L I E R
The standard ventur i meter f low-rate equat ion for f low rate at temperature, /, may be
wr i t ten
(1) Qt = k ^/AP7 ,
where
k^ " ' ^ ' T H S ^ 762.37
A l s o the f low rate at a base temperature, bt, may be wr i t ten
(2) Qkt- , v ^ .
Mu l t ip l i ca t ion of equation (1) by unity, which in this case is( 1 , and
regrouping, w i l l g ive
^t V s p g r ^ , A^^
(3) e =__ __k——— ^ , bt V sp gr^ >/sp grj,^
from which
(4) Q, = K(TM) V ^ ,
/h where
kAy^ K = - — — — — , and
/ s p " g i ^
D y \/sp gr^t TM = { . ^
bt ' y s p gr^
From reference (7), and for a base temperature of 1400°F,
K = 84.18 , and
TM = 1.000 .
Table 6 presents several temperature mul t ip l ie rs of interest .

The NaK f low rate should equal a previously estab l ished water f low rate when
TM Y (5) (A^)NOK=1 Yjr~ ^^ - « '
NaK /
where subscr ipt w refers to water and subscr ipt NaK refers to the sodium-potassium a l l oy .
32
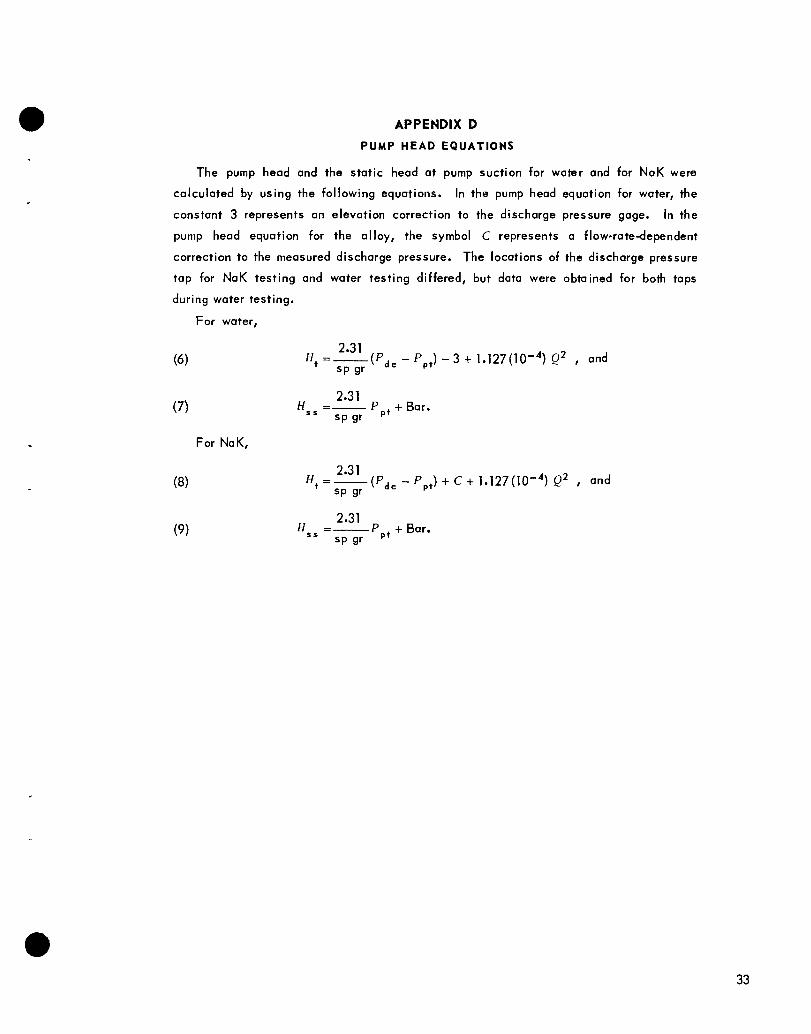
APPENDIX D
PUMP HEAD EQUATIONS
The pump head and the static head at pump suction for water and for NaK were
calculated by using the following equations. In the pump head equation for water, the
constant 3 represents an elevation correction to the discharge pressure gage. In the
pump head equation for the alloy, the symbol C represents a flow-rate-dependent
correction to the measured discharge pressure. The locations of the discharge pressure
tap for NaK testing and water testing differed, but dota were obtained for both taps
during water testing.
For water,
(6) H = _ 1 _ ( P - P ) - 3 + 1.127(10-") e^ , and sp gr •
(7) H = i : ^ P _ ^ ^ + Bar. sp gr P*
For NaK,
(8) «t =— ( P j , - PJ + C + 1.127(10-") Q^ , and sp gr "^ P'
2.31 (9) W „ = Pp, + Bar.
sp gr P'


GLOSSARY
N
Q T
^d
'^dc
P pt
P p
Pt
AP V
AP V C
^ t
H 5 S
H vp
^ c i
c Bar.
sp gr
TtA
c
g
A
D
(i V
pump speed, rpm
pump flow, gpm
temperature of flowing liquid, °F
pump discharge pressure, psig
corrected pump discharge pressure, psig
pump suction static pressure, psig
venturi upstream pressure, psig
venturi throat pressure, psig
venturi differential pressure, psi
corrected venturi differential pressure, psi
pump total head, ft
static head at pump suction, ft abs
vapor pressure of liquid, ft
static head at pump suction at cavitation inception.
pump discharge pressure gage correction, ft
barometric pressure, ft
specific gravity of flowing liquid
venturi temperature multiplier
venturi coefficient-of-discharge
acceleration of gravity, 32.2 ft/sec^
venturi throat area, ft^
venturi throat dia, ft
ratio of venturi throat to pipe diameters
velocity in the suction pipe
ft abs
35


ACKNOWLEDGMENTS
The author wishes to express his appreciat ion to Dr. George F . Wis l i cenus ,
Pennsylvania State Un ivers i t y , for suggest ing the problem and i ts possible va lue.
Special acknowledgment is due H. W. Savage, Reactor Projects D i v i s i on , ORNL, and
to E. R. Dytko.
The author is indebted to Professor W. K. Stair, Mechanical Engineering Department,
Un ivers i t y of Tennessee, for h is counsel and guidance during the course of the problem.
The cont inuing support and the const ruct ive c r i t i c i sm of L . V . Wi lson, Design
Department, Reactor Projects D iv i s ion of Oak Ridge National Laboratory, are gratefu l ly
recognized.
Special recogni t ion is extended to H. C. Young and J . N. Simpson, and to D. L . Gray,
Exper imental Engineer ing Department, Reactor Projects D i v i s i on , for their ass is tance
and cooperation in obta in ing water test and elevated temperature test data.