correlation of floor vibration to human response€¦ · jamesr.shaver centerforbuildingtechnology...
TRANSCRIPT
<^**"°F Co
\
\
J°*£AU 0?
NBS TECHNICAL NOTE 904
U.S. DEPARTMENT OF COMMERCE/ National Bureau of Standards
orrelation of Floor Vibration
to Human Response
QC
100
U5753
no, 904
1976
c.2

NATIONAL BUREAU OF STANDARDS
The National Bureau of Standards 1 was established by an act of Congress March 3, 1901.
The Bureau's overall goal is to strengthen and advance the Nation's science and technology
and facilitate their effective application for public benefit. To this end, the Bureau conducts
research and provides: (1) a basis for the Nation's physical measurement system, (2) scientific
and technological services for industry and government, (3) a technical basis for equity in trade,
and (4) technical services to promote public safety. The Bureau consists of the Institute for
Basic Standards, the Institute for Materials Research, the Institute for Applied Technology,
the Institute for Computer Sciences and Technology, and the Office for Information Programs.
THE INSTITUTE FOR BASIC STANDARDS provides the central basis within the United
States of a complete and consistent system of physical measurement; coordinates that system
with measurement systems of other nations; and furnishes essential services leading to accurate
and uniform physical measurements throughout the Nation's scientific community, industry,
and commerce. The Institute consists of the Office of Measurement Services, the Office of
Radiation Measurement and the following Center and divisions:
Applied Mathematics — Electricity — Mechanics — Heat — Optical Physics — Center
for Radiation Research: Nuclear Sciences; Applied Radiation — Laboratory Astrophysics 2
— Cryogenics 2 — Electromagnetics 2 — Time and Frequency 2.
THE INSTITUTE FOR MATERIALS RESEARCH conducts materials research leading to
improved methods of measurement, standards, and data on the properties of well-characterized
materials needed by industry, commerce, educational institutions, and Government; provides
advisory and research services to other Government agencies; and develops, produces, and
distributes standard reference materials. The Institute consists of the Office of Standard
Reference Materials, the Office of Air and Water Measurement, and the following divisions:
Analytical Chemistry — Polymers — Metallurgy — Inorganic Materials — Reactor
Radiation — Physical Chemistry.
THE INSTITUTE FOR APPLIED TECHNOLOGY provides technical services to promote
the use of available technology and to facilitate technological innovation in industry and
Government; cooperates with public and private organizations leading to the development of
technological standards (including mandatory safety standards), codes and methods of test;
and provides technical advice and services to Government agencies upon request. The Insti-
tute consists of the following divisions and Centers:
Standards Application and Analysis — Electronic Technology — Center for Consumer
Product Technology: Product Systems Analysis: Product Engineering — Center for Building
Technology: Structures, Materials, and Life Safety; Building Environment; Technical Evalua-
tion and Application — Center for Fire Research: Fire Science; Fire Safety Engineering.
THE INSTITUTE FOR COMPUTER SCIENCES AND TECHNOLOGY conducts research
and provides technical services designed to aid Government agencies in improving cost effec-
tiveness in the conduct of their programs through the selection, acquisition, and effective
utilization of automatic data processing equipment; and serves as the principal focus within
the executive branch for the development of Federal standards for automatic data processing
equipment, techniques, and computer languages. The Institute consists of the following
divisions: •
Computer Services — Systems and Software — Computer Systems Engineering — Informa-
tion Technology.
THE OFFICE FOR INFORMATION PROGRAMS promotes optimum dissemination and
accessibility of scientific information generated within NBS and other agencies of the Federal
Government; promotes the development of the National Standard Reference Data System and
a system of information analysis centers dealing with the broader aspects of the National
Measurement System; provides appropriate services to ensure that the NBS staff has optimum
accessibility to the scientific information of the world. The Office consists of the following
organizational units:
Office of Standard Reference Data — Office of Information Activities — Office of Technical
Publications — Library — Office of International Relations — Office of International
Standards.
1 Headquarters and Laboratories at Gaithersburg, Maryland, unless otherwise noted; mailing address
Washington, D.C. 20234.
- Located at Boulder, Colorado 80302.
James R. Shaver
Center for Building TechnologyInstitute for Applied TechnologyNational Bureau of Standards
Washington, D.C. 20234
Sponsored by
Office of Policy Development and ResearchDepartment of Housing and Urban DevelopmentWashington, D.C. 20410
^ °FCo,
Vau of*
£JB3£ABY
Correlation of Floor VibrationJZ 2 *76I ' C-O o
to Human Response
\Q1 <0
C i
'£*
U.S. DEPARTMENT OF COMMERCE, Elliot L. Richardson, Secretary
James A. Baker, III, Under Secretary
Dr. Betsy Ancker-Johnson, Assistant Secretary for Science and Technology
US NATIONAL BUREAU OF STANDARDS, Ernest Ambler, Acting Director\\\
Issued May 1976

National Bureau of Standards Technical Note 904
Nat. Bur. Stand. (U.S.), Tech. Note 904, 29 pages (May 1976)
CODEN: NBTNAE
Supersedes NBSIR 75-951
U.S. GOVERNMENT PRINTING OFFICEWASHINGTON: 1976
For sale by llie Superintendent of Documents, U.S. Government Printing Office, Washington, D.C. 20402
(Order by SD Catalog No. C13.46:904). Price 75 cents (Add 25 percent additional for other than U.S. mailing
TABLE OF CONTENTS
Page
Abstract 1
1. Introduction 1
2
.
Background 2
3. Approach to Problem 3
4. Data Reduction and Analysis 5
5. Damping 8
6. Human Response to Vibration 9
7. Summary 11
8. References 12
9. Appendix A: Field Test 14
10. Appendix B: Computer Program 15


CORRELATION OF FLOOR VIBRATION
TO HUMAN RESPONSE
James R. Shaver
A new approach to the problem of perceptible floor vibrationsis presented based on the assumption that human activity, whichproduces the vibration, and human response to vibration arerandom variables. Techniques for data reduction are discussedand a detailed description of one approach is given along with theassociated computer programs. Data from floor vibrations iscompared with current criteria for human response.
Key words: Analysis; experimental; floor systems; human response;random process; spectral analysis; vibration.
1. INTRODUCTION
Historically, the design of floor systems for serviceability has been
based on limiting the deflection that can occur for a given design load to
prevent structural damage. It was believed by most engineers that this design
procedure indirectly accounted for the effect of human activity on floor
systems which could produce quite perceptible and annoying vibrations for other
human occupants. Research and state-of-the-art studies [1,2,3]— conducted
during the past decade on the various aspects of vibrating floor systems have
increased the awareness of the engineering community to the fact that the traditional
serviceability design procedure does not necessarily lead to floor systems with
satisfactory dynamic characteristics which prevents objectionable vibrations
from the occupant viewpoint when the floor is subjected to human activitv.
Recent efforts [4.5] to study the problem of perceptible floor vibrations
have primarily employed experimental techniques. Results from these studies
have been inconclusive as to what constitutes objectionable floor vibration
from an occupant viewpoint. Questions have been raised about the proper
forcing function to be used in the test to simulate human activity [2,5] and
the lack of information on the human response to this type of vibration [4]
.
The experimental procedures used have been based on the assumption that both
human activity which produces vibration and occupant response to vibration
of a floor system are deterministic variables. However most scientific studies
which deal with human activity and human response as variables treat them as
a random variable rather than a deterministic one.
- Numbers m brackets refer to literature references
This report describes a new approach to the problem of perceptible floor
vibrations based on the assumption that human activity and human response to2/
vibration are random variables. Presented is a random varxable methodology-
based on physical testing and subsequent analysis of the dynamic response of
floor systems subjected to human activity.
2 . BACKGROUND
In order to understand why both human activity and occupant response
should be characterized as random variables, it is necessary to understand
the difference between a deterministic variable and one that is random. A
deterministic variable is one whose value can be calculated or determined
from knowledge of its behavior at any previous instant in time, while a
random variable is one whose instantaneous value cannot be predicted with
complete certainty for any given instant in time. This means that the
instantaneous value for a random variable can only be specified by a proba-
bility distribution function which gives the probable fraction of the total
time that the instantaneous value lies within a specified range.
If one considers all the possible parametric variations that can affect
the instantaneous value of the dynamic loading that occurs from human
activities such as walking, running, jumping, it becomes clear that each
activity is, in itself, a random process composed of many variables. For
example, considering footfall or walking since it is the most prevalent
activity that occurs on a floor system, variations in weight, gait, heel-to-
ball of foot contact and foot wear of individuals will all affect the instan-
taneous value of the dynamic loading that occurs.
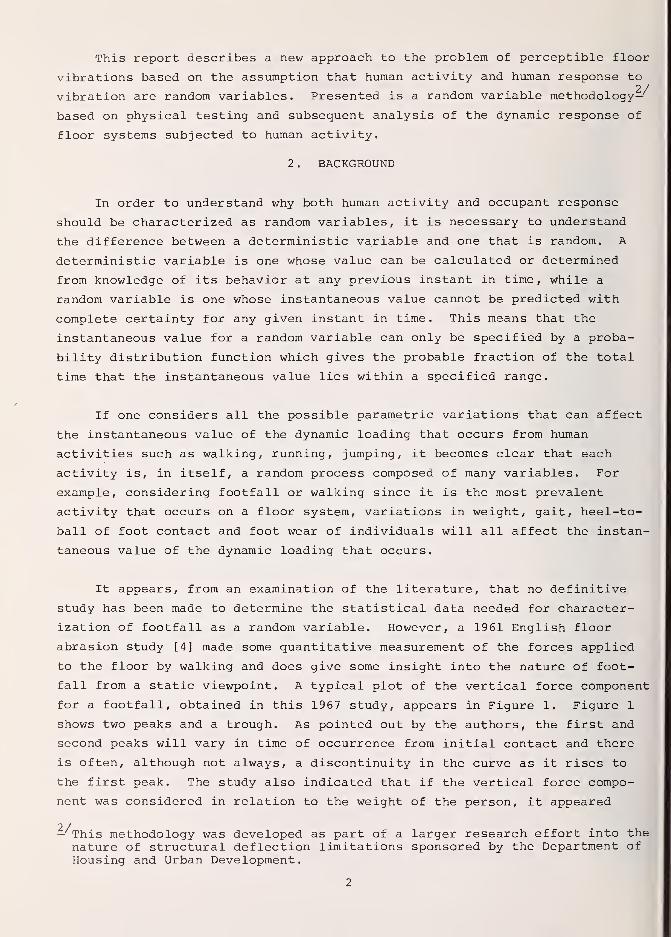
It appears, from an examination of the literature, that no definitive
study has been made to determine the statistical data needed for character-
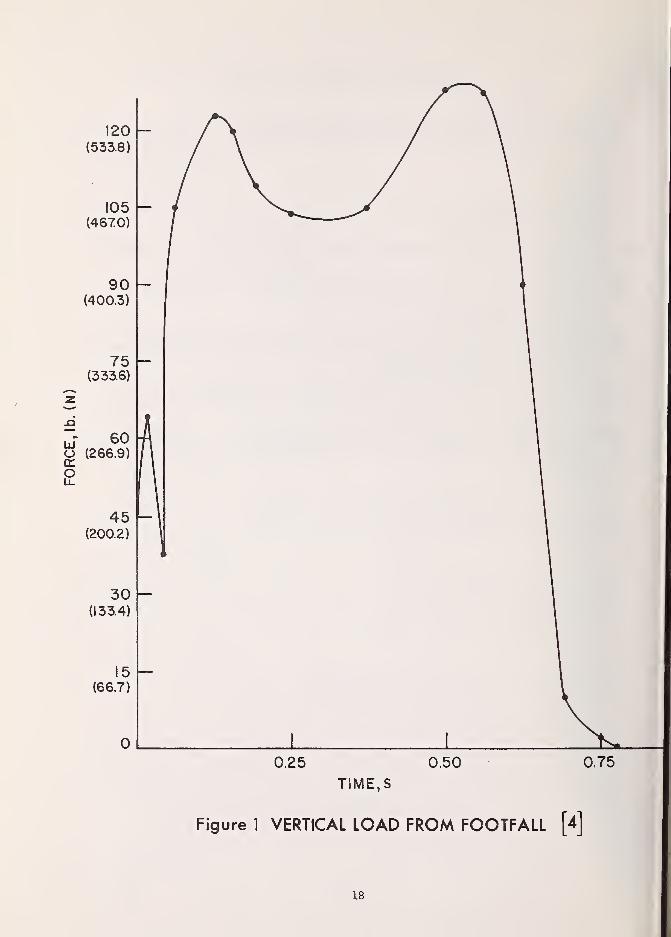
ization of footfall as a random variable. However, a 1961 English floor
abrasion study [4] made some quantitative measurement of the forces applied
to the floor by walking and does give some insight into the nature of foot-
fall from a static viewpoint. A typical plot of the vertical force component
for a footfall, obtained in this 1967 study, appears in Figure 1. Figure 1
shows two peaks and a trough. As pointed out by the authors, the first and
second peaks will vary in time of occurrence from initial contact and there
is often, although not always, a discontinuity in the curve as it rises to
the first peak. The study also indicated that if the vertical force compo-
nent was considered in relation to the weight of the person, it appeared
2/—This methodology was developed as part of a larger research effort into thenature of structural deflection limitations sponsored by the Department ofHousing and Urban Development.
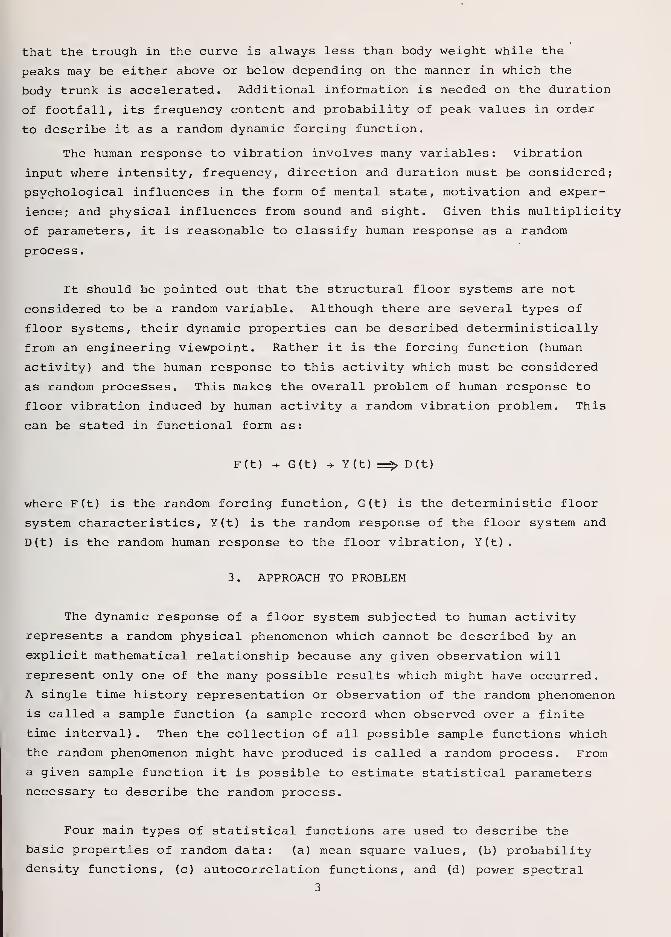
that the trough in the curve is always less than body weight while the
peaks may be either above or below depending on the manner in which the
body trunk is accelerated. Additional information is needed on the duration
of footfall, its frequency content and probability of peak values in order
to describe it as a random dynamic forcing function.
The human response to vibration involves many variables: vibration
input where intensity, frequency, direction and duration must be considered;
psychological influences in the form of mental state, motivation and exper-
ience; and physical influences from sound and sight. Given this multiplicity
of parameters, it is reasonable to classify human response as a random
process
.
It should be pointed out that the structural floor systems are not
considered to be a random variable. Although there are several types of
floor systems, their dynamic properties can be described deterministically
from an engineering viewpoint. Rather it is the forcing function (human
activity) and the human response to this activity which must be considered
as random processes. This makes the overall problem of human response to
floor vibration induced by human activity a random vibration problem. This
can be stated in functional form as:
F(t) + G(t) -> Y(t) =5> D(t)
where F(t) is the random forcing function, G(t) is the deterministic floor
system characteristics, Y(t) is the random response of the floor system and
D(t) is the random human response to the floor vibration, Y(t)
.
3. APPROACH TO PROBLEM
The dynamic response of a floor system subjected to human activity
represents a random physical phenomenon which cannot be described by an
explicit mathematical relationship because any given observation will
represent only one of the many possible results which might have occurred.
A single time history representation or observation of the random phenomenon
is called a sample function (a sample record when observed over a finite
time interval) . Then the collection of all possible sample functions which
the random phenomenon might have produced is called a random process. From
a given sample function it is possible to estimate statistical parameters
necessary to describe the random process.
Four main types of statistical functions are used to describe the
basic properties of random data: (a) mean square values, (b) probability
density functions, (c) autocorrelation functions, and (d) power spectral
3

density functions. The mean square value furnishes a rudimentary description
of the intensity of the data. The probability density function furnishes
information concerning the properties of the data in the amplitude domain.
The autocorrelation function and the power spectral density function furnish
similar information in the time domain and frequency domain, respectively.
While it is possible to determine the required parameters directly
from the time history under certain simplifying assumptions, the majority
of the techniques used to date perform the analysis in the frequency domain.
Analysis in this domain is usually termed spectral decomposition.
There are three reasons for selecting spectral decomposition over time
history to represent one's data. First, spectral decomposition presents
data in a form that is related to quantities familiar to engineers. Many
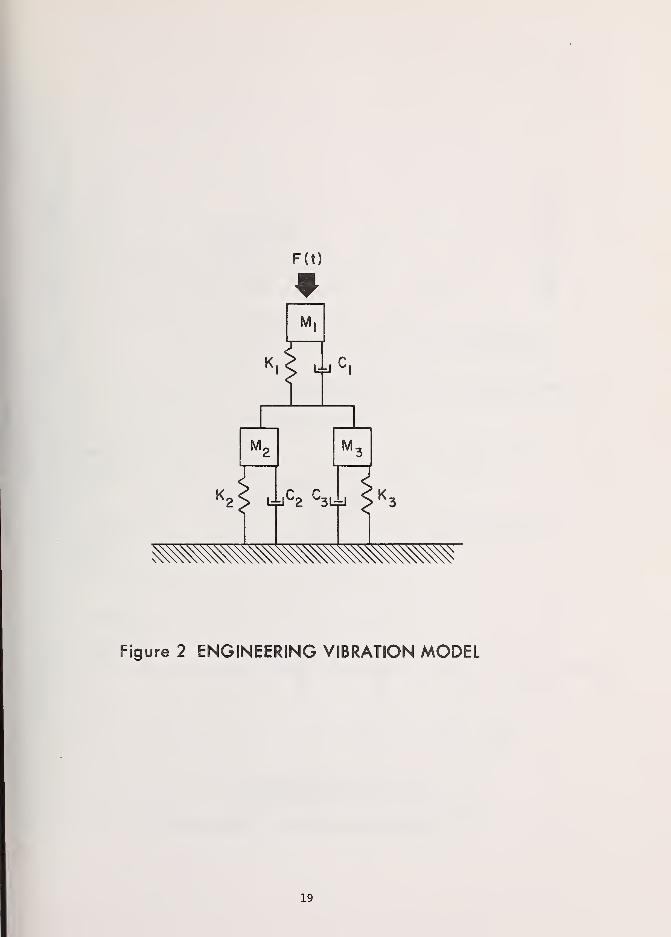
physical systems (including the human body) have been modeled with a fair
degree of success in this domain. Most models, for example, consist of a
set of simple second order oscillators connected in a manner which simulates
the various components of the particular physical systems. Such a model is
shown in Figure 2. Each oscillator has its own oscillatory or resonant
frequency which, in turn, is dependent upon the size, shape and material
of the component it is simulating. Since each oscillator will be
excited primarily by energy at its resonant frequency, the knowledge of the
frequency content of the response provides the key to the determination of
the system response to impulse or shock, such as that produced by footfall.
Generally, the response of a floor system at resonant frequencies will
predominate in the total response. The second reason for utilizing spectral
decomposition is the independence of each frequency component from all
others. This independence in the frequency domain greatly simplifies
analysis. By comparison, the determination of a response in the time
domain at some instant in time is dependent not only on the value of the
excitation at that time but on all previous values of the excitation.
Third, this type of analysis can be used to describe input data, F(f), re-
sponse data, Y(f), or, if the input and response are measured simultaneously,
it can be used to describe the frequency response function, G(f), of the
system as shown in Eq. 3.1. Specifically, given any two of the above
items, the third can be determined.
Y(f) = |G(f)|
2F(f) (3.1)
The primary approach to obtaining a meaningful dynamic response of a
floor system subjected to human activity is to first obtain a time history
and then transform this time history into the frequency domain using Fourier
techniques. In addition, the mean square value and probability density
function should be obtained. It does not appear at this time that the
autocorrelation function or the power spectral density function will provide
any useful information.
4. DATA REDUCTION AND ANALYSIS
Spectral decomposition or analysis using Fourier techniques consists
of decomposing a time history in terms of trigonmetric functions. The
magnitude and phase of each trigonometric term needed to reconstruct the
time history are plotted as a function of frequency. This technique is
simply the evaluation of the finite, Fourier transform of the time history
as expressed by Equation 4.1 where the time history x(t) is multiplied by
the Fourier kernel, a complex exponential containing both the frequency and
time variables, and then integrating this product over the record length;
T/2 ._ -
X(f) = / x(t)e : rtdt (4.1)
-T/2
Using Euler's transformation, the kernel may be expanded so that Eq.
4.1 may be rewritten as,
T/2 T/2X(f) = / x(t) cos 2TTftdt - j / X(t) sin 2iTftdt (4.2)
-T/2 -T/2
This equation shows how spectral analysis can be considered as a decomposition
of the time history in terms of sine and cosine components.
In order to evaluate this integral by digital techniques, one must
solve the discrete, finite Fourier transform which is given as
X(kAf) = AtV X. e-J2^kAfiAt
(4 _ 3)
i=o
where X. is the digital representation of the time history obtained by
sampling the continuous record at At intervals and the natural frequency
spacing for the complete transform is
Af = -i- (4.4)NAt
Then kAf is defined by
kAfNit'
k= °' *' 2 '-- N/2 (4 ' 5)
Equation 4.3 may then be rewritten as
N-l -i2iTikX, = At £ X. e N k = 0, 1, 2,..., N/2 (4.6)K 1
i=o
5
Employing Euler ' s formula again and rewriting, Eq. 4.6 becomes
Xk
= AR
- jBR
k = 0, 1, 2, ..., N/2 (4.7)
where .. ,N-l - .,
A, = At I X. cos =^i^ (4.7a)k . i Ni=o
N-l _ .
,
B. = At Z X. sin fliJS (4.7b)k . l N
i=o
A computer program can be written which will evaluate Eq. 4.7 directly.
However, this program would require a rather large amount of running time
particularly when large volumes of data are being analyzed. Although the
most efficient techniques known to date for evaluating Eq. 4.6 are the Fast
Fourier Transform (FFT) methods, they were not used because these methods
are not straight forward in their application and do require some
special knowledge and experience for proper utilization.
The evaluation procedure employed to evaluate Eq. 4.7, was first
derived by Goertzel [5] and is believed to be the most efficient of the
pre-FFT methods. The method requires the generation of an auxiliary variable
Q as follows:
Qo=0
Qi = Vi
Qi
= (2 cos ^ ) Qi _ 1
-Qi _ 2
+ X -i, i = 2, 3 ,..., N-l (4.8)
Then, A and B in Eqs. 4.7a and 4.7b become
Ak
= At [(cos 2*k,QN_a
-Qn_ 2
+ Xq
]
Bk
= At (sinM) QN-1 , k=0, 1,..., N-2 (4>9)
This technique was utilized in the spectral analysis of the 40 second walking
record obtained using the test procedure given in Appendix A and requiredless than 3 seconds for 12,000 data points on a UNIVAC 1108 with an EXEC 8
system. The computer program is given in Appendix B. It should be remem-
bered that the evaluation of X, by Eqs. 4.8 and 4.9 would require
generally unacceptable amounts of computer running time when extremely
large volumes of data are to be analyzed.

The most useful output from the Fourier spectrum is the modulus. This
modulus is obtained by realizing that the Fourier spectrum can be represented
by a complex expression.
X(f) = |x(f)| e^ 6(f) (4 - 10)
where |x(f)|
is the modulus and e -1 is the phase.
From Eq. 4.7, the expression for the finite Fourier transform, the
modulus is,
ii 2 2 1/2|Xk |
= (A^ + Bj)L/l
(4.11)
The modulus dimensionally represents a pseudovelocity and it can be
shown [6] that this is identical to the relative velocity of the residual
response for a linear undamped single degree-of -freedom system when the
system response is a pure sinusoid. In general, the two will be in close
agreement for any undamped system with the pseudovelocity lower at low
frequencies and higher at high frequencies than the relative velocity
because of its frequency dependence.
The phase presentation of the spectrum may prove to be useful in
determining damping in the system. Again from Eq. 4.7, the phase angle is
given by
-1Bk= tan x ~ (4.12)
Ak
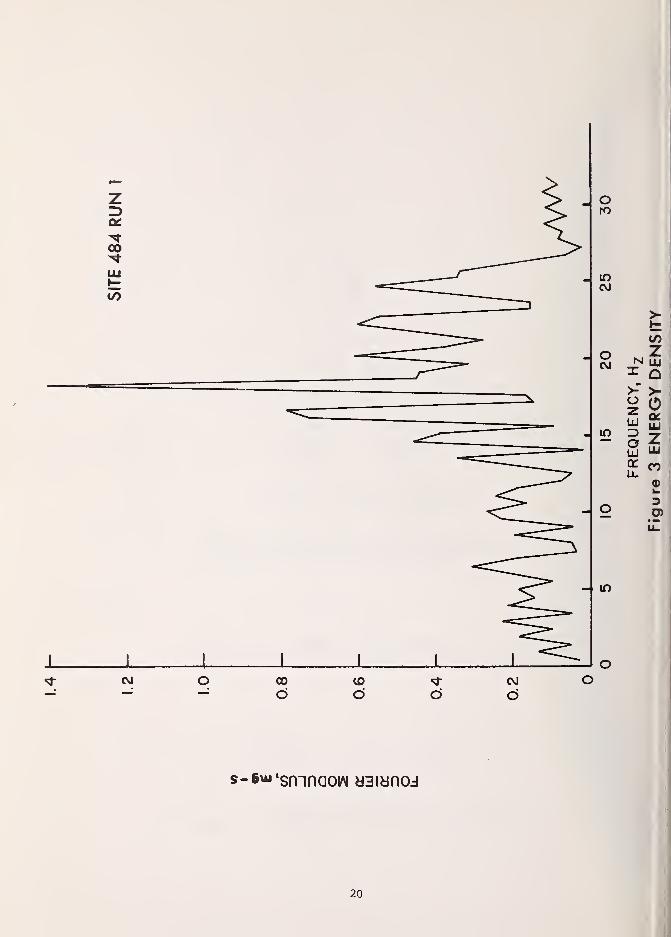
Figure 3 is a plot of the modulus of the spectral decomposition of
the 40 second walking record. The values of this modulus are in mq-s which
is a pseudovelocity in feet per second. This graph is also called an energy
density curve in random data analysis. Due to filters in the acceleration
signal conditioning equipment all input above 2 5 Hz has been removed thus
accounting for the low energy content above this value.
The acceleration record was sampled every 160 ms which is
equivalent, because of a difference in record and playback speed of the
analog data tape, to a 10 ms sampling rate in real time. At the 10 ms real
time sampling rate, 1191 samples were taken thus producing a natural frequency
spacing of 0.084 Hz in the Fourier transform. The modulus of the spectral
decomposition has been plotted at every 0.5 Hz.
An examination of Figure 3 indicates that significant amounts of
energy occurs in the range of 15-25 Hz with a pronounced peak at 18 Hz
which is the fundamental frequency for the floor tested. The existence of
7

energy in this range indicates that a vibrating floor system is capable of
inducing a human response to vibration at frequencies other than the
lowest natural frequency of the system. Thus, test procedures which determine
the vibration level only at the fundamental frequency for the floor system
may exclude significant energy levels at other frequencies.
The missing link at this time is a means of transforming the energy
level at these frequencies to a corresponding root-mean-square (rms) accelera-
tion at the same frequency thereby permitting a comparison with the current
human response criteria. However, it is possible to determine the rms
acceleration for the record and associate it with the lowest natural frequency
for comparison purposes. This is done in section 6.
5. DAMPING
Damping in floor systems is a very complex quantity yet its measurement
is important since it effects the level and duration of vibration. In
addition, it has been suggested that in the case of a single pulse input
the occupants will perceive motion at a lower threshold if the vibration of
the floor does not decay rapidly. Although the scope of the study did not
permit an investigation into more effective means of determining damping
and relating its effect to human response a brief discussion will be given
because of the significant role damping plays in any dynamic problem.
Structural damping that occurs in floor systems is composed of three
primary components: (1) material damping which is the ability of the
materials themselves to dissipate energy, (2) interlayer slip which is
energy dissipation through friction between the subfloor and joist and (3)
end conditions which may damp motion by inducing support vibration or
dissipate energy through friction. Generally, the energy loss from material
damping is small as compared to the amount dissipated by slip and support
effects.
There are six generally accepted mathematical means of representing
damping: (1) logarithmic decrement, (2) amplification factor, (3) quality
factor, (4) equivalent dashpot constant, (5) complex modulus and, (6)
bandwidth. For the simple case of a linear single degree of freedom
system, a relationship can be established between all six definitions, but
for other cases this is no longer necessarily true. When structural damping
is of primary interest any one of the six representations could be used
with some degree of success depending upon the end result desired. Logarith-
mic decrement or decay rate is the simplest to measure experimentally but
8
is difficult to use in design or analysis. The most useful form of presenta-
tion for the designer is specific damping energy, in inch- pounds per
cycle, while for purposes of analysis the equivalent dashpot constant is
most useful.
However, from the viewpoint of the present approach taken in this
methodology and its emphasis on spectral techniques, the use of either the
bandwidth method or quality factor in characterizing the damping of structural
floor systems should lead to a better means cf describing the damping
quality of floors as it relates to human response to vibration. While it
appears feasible at this time to obtain these damping characteristics from
a spectral decomposition, this derivation is beyond the scope of this
report.
6. HUMAN RESPONSE TO VIBRATION
Human body vibration is usually treated as an externally-applied
condition, although it is often self-induced such as during walking or
running. The spectrum of human reaction to vibration is extremely wide
encompassing both "pleasant" effects which range from relaxation to stimula-
tion and "unpleasant" effects which span from discomfort to injury. Much
of the information and literature concerning the effects of vibration on
man is of a provisional, specialized or contradictory nature. This is
particularly true in the area of human response to floor vibrations where
only in the past decade have attempts been made to quantify this response.
Thus, there does not exist, at this time, a consensus standard for deter-
mining whether or not floor vibration induced by human activity is acceptable
from the occupant viewpoint.
This section will present the current state of knowledge on human
reaction to externally applied vertical transient vibration against which
the results of the proposed floor vibration methodology already given might
be compared
.
The current state of knowledge on human reaction to externally-applied
vertical transient vibration is based on a limited number of studies and
represents a wide range of thresholds. However, as basic as it is, this
knowledge is currently the only information on which to base a judgement of
whether or not a floor is acceptable from a human response viewpoint.
The ISO Guide for the Evaluation of Human Exposure to Whole-Body
Vibration ISO/DIS 2631 [7] provides allowable rms accelerations at different
frequencies for various levels of exposure time. It is primarily intended for
periodic (sinusoidal) vibrations in the frequency range from 1 Hz to 80 Hz but
does cover narrow-band or wide-band vibration within this frequency range.
In the case of either wide- or narrow-band random vibration, the allowable
accelerations are based on the limit given for the center frequency in each
third octave band.
Splittgerber [8] has proposed a standard based on the ISO Guide which
provides vibration and shock limits for occupants of buildings. This
proposed standard differentiates between continuous or intermittent vibration
and impulsive shock excitation during either a day or night environment.
It also contains vibration limits for different types of occupancy such as
hospital, residential, office, etc.
A standard acceleration level is specified for each direction of
vibration and then permissable acceleration levels are obtained for the
different types of vibration input, occupant classification, and time
conditions by applying an appropriate weighting factor to the standard.
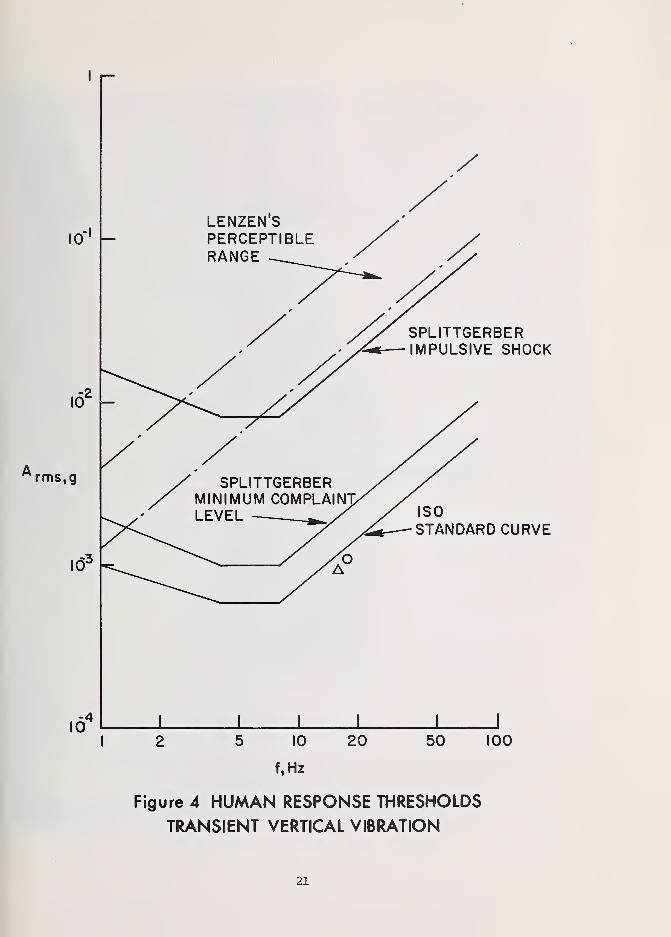
Figure 4 shows the ISO Guide's standard acceleration curve for vertical
vibrations and Splittgerber ' s permissable acceleration level for inter-
mittent vibration in residences during the daytime hours. This daytime
level is based on minimum complaints from the occupants and was obtained by
applying a weighting factor of two to the standard curve.
Plotted on Figure 4 for purposes of comparison is Lenzen's [9] modifica-
tion of the original Reiher and Meister work [10] on steady state vibrations
for transient vibration. Lenzen's modification considers transient vibration
as a vibration which may last only a few seconds but is characterized by a
buildup to a level which is maintained for several cycles. Realistically,
Lenzen's definition fits the vibration produced by a single footfall or
someone jumping with Splittgerber ' s definition fitting the vibration produced
by walking or running. The dashed lines on Figure 4 denote the slightly
perceptible range for Lenzen's modification which is again believed to
represent a minimum complaint level.
Also plotted in Figure 4 is Splittgerber ' s rms acceleration limit for
daytime impulsive shock in residences which he characterizes as a rapid
buildup to a peak followed by decay. It is comparable to Lenzen's definition
for transient vibration. This acceleration limit was obtained by weighting
the standard curve by sixteen. As can be seen from Figure 4 there is good
agreement between these two criteria for f > 8 Hz with a divergence of the
two below this frequency. No definite conclusion can be drawn at this time
on the reason for this divergence in the low frequency range.
10

Plotted as a triangle on Figure 4 is the peak rms acceleration of 0.95
mg as determined from the 40 second continuous walking test record. This value
was obtained using analog techniques with the time constant of the rms meter
and scan rate of the data adjusted so that the uncertainty is less
than 2% and is the peak rms value associated with maximum acceleration.
Since the major energy component in the frequency spectrum occurs at 18 Hz,
in accordance with the ISO Guide, this rms value is plotted at a frequency
of 16 Hz as this is the center frequency for the third octave band in which
18 Hz falls.
A reinterpretation of this rms acceleration with regard to frequency
and type of excitation was also made in order to compare the results with
Lenzen's criteria. Lenzen's criteria would consider it to be a single
pulse at the predominate floor frequency which in this case is 18 Hz. The
maximum rms acceleration is found from the expression:
A = -i- A .
rms /=— peak
and is 1.2 mg . This value is plotted as a circle on the figure.
From the figure it can be seen that the treatment of the walking
record as an intermittent vibration gives a resulting rms acceleration
slightly below the standard curve and well below the minimum complaint
level. Treating the data as being comparable to single footfall or an
impulsive shock which is the case for the plot of the peak rms acceleration
it is obvious that the results are not realistic.
An interview with the occupants of the rlwpll.ina where the test data wereobtained indicated that the vibrations produced by walking were not considered
annoying although at times they were perceptible. It is interesting to
note that a deaf couple living in this housing project used floor vibrations
(which are, in this case, quite low) as a means of sensing the presence of
someone in the room.
7 . SUMMARY
In this report a new approach to the treatment of perceptible floor
vibrations is presented based on the concept that human activity and human
response to this activity are random variables. The reasons for choosing
the random process approach to this floor vibration problem are given along
with an overview of the method in functional form. A description of the
random process and the statistical functions used to treat random data is
presented.
11

Spectral analysis is chosen over time, history, as the method for
analyzing floor vibration data. A computationally efficient procedure for
obtaining the Fourier spectrum is given along with the associated computer
software
.
The current state of knowledge on human reaction to externally applied
vertical transient vibration is discussed. One record of human activity
obtained in a field test is analyzed using the techniques presented in this
report and the results compared with a proposed standard for vibration and
shock limits for occupants of buildings.
8 . REFERENCES
1. Lenzen, K.H., "Vibration of Steel Joist-Concrete Slabs Floor System -
Final Report," Studies in Engineering Mechanics , No. 16, Center for
Research in Engineering Science, the Univ. of Kansas, Lawrence, Kansas,
August, 1962.
2. Onysko, D.M., "Performance of Wood-Joist Floor Systems - A Literature
Review," Forest Products Laboratory, Information Report OP-X-24,
Ottawa, Ontario, Canada, January, 197 0.
3. Glamabos, T.V., Gould, P.L., Ravindra, M.R., Suryoutomo , H., Crist,
R.A., "Structural Deflections - A Literature and State-of-the-Art
Survey," Building Science Series 47, National Bureau of Standards,
Washington, D.C., October, 1973.
4. Harper, F.C., Warlow, W.J., Clarke, B.L., "The Forces Applied to the
Floor by the Foot in Walking," National Building Studies, Research
Paper 32, Building Research Station, Watford, England, January, 1961.
5. Geortzel, G., "An Algorithm for the Evaluation of Finite Trigonmetric
Series," American Mathematical Monthly , Vol. 65, No. 1, January, 1958,
pp. 34-35.
6. Rubin, S., "Concepts in Shock Data Analysis," Shock and Vibration Handbook
(Harris, CM., Crede, C.E., Eds.) Vol.2, Ch . 23, McGraw-Hill Book Co.,
New York, 1961.
7. International Organization for Standardization, "Guide for the Evaluation
of Human Exposure to Whole-Body Vibration," Draft International Standard
ISO/DIS 2631, May, 1972.
12
8. Splittgerber , H., "Vibration and Shock Limits for Occupants of Buildings,"
ISO/TC 108/SC4/WG2, Draft document, June, 1973.
9. Lenzen, K.H., Dorsett, L.P., "Effect of the Variation of Structural
Parameters on the Vibrational Characteristics of Steel Joist-Concrete
Slab Floor Systems and Suggested Designs," Studies in Eng. Mech. No.
32 , Univ. of Kansas, Lawrence, Kansas, August 1968.
10. Reihler, H. , Meister, F.J., "The Sensitivity of Humans to Vibrations,"
Forsc auf den Gebiere des Ingenieureuesens , Vol. 2, No. 11, November,
1931.
13
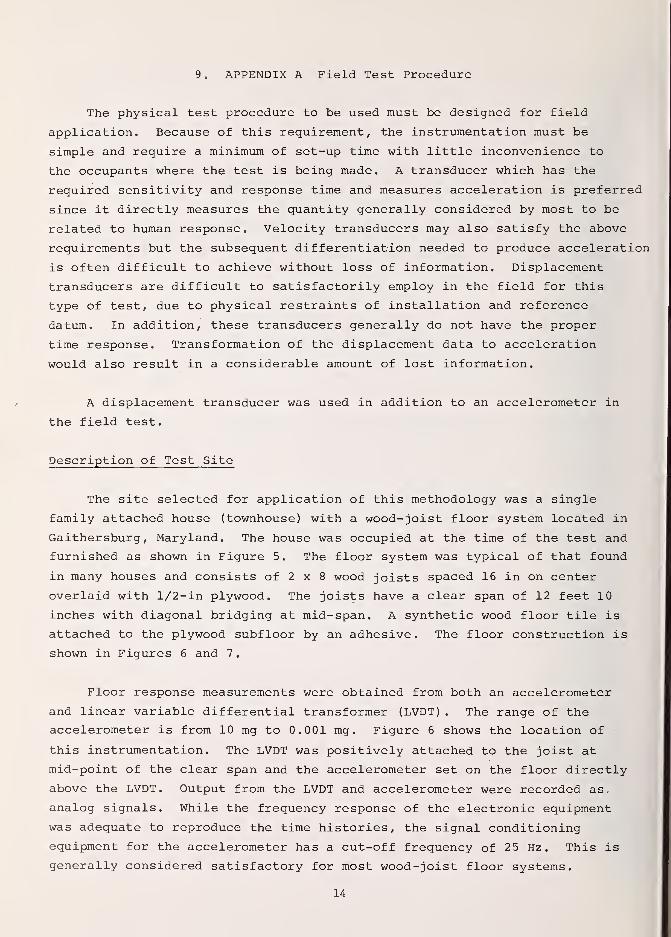
9. APPENDIX A Field Test Procedure
The physical test procedure to be used must be designed for field
application. Because of this requirement, the instrumentation must be
simple and require a minimum of set-up time with little inconvenience to
the occupants where the test is being made. A transducer which has the
required sensitivity and response time and measures acceleration is preferred
since it directly measures the quantity generally considered by most to be
related to human response. Velocity transducers may also satisfy the above
requirements but the subsequent differentiation needed to produce acceleration
is often difficult to achieve without loss of information. Displacement
transducers are difficult to satisfactorily employ in the field for this
type of test, due to physical restraints of installation and reference
datum. In addition, these transducers generally do not have the proper
time response. Transformation of the displacement data to acceleration
would also result in a considerable amount of lost information.
A displacement transducer was used in addition to an accelerometer in
the field test.
Description of Test Site
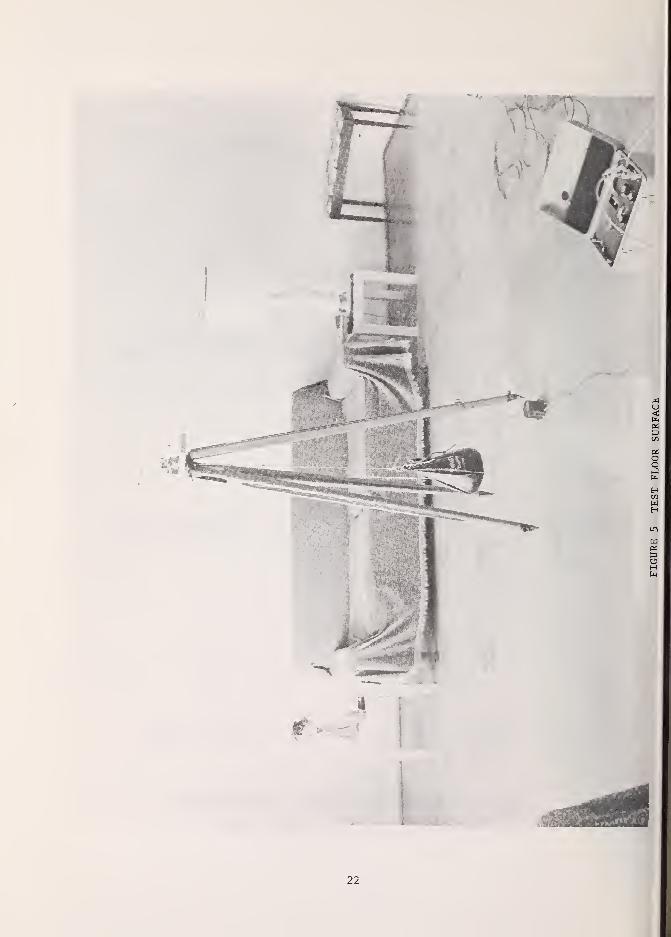
The site selected for application of this methodology was a single
family attached house (townhouse) with a wood-joist floor system located in
Gaithersburg, Maryland. The house was occupied at the time of the test and
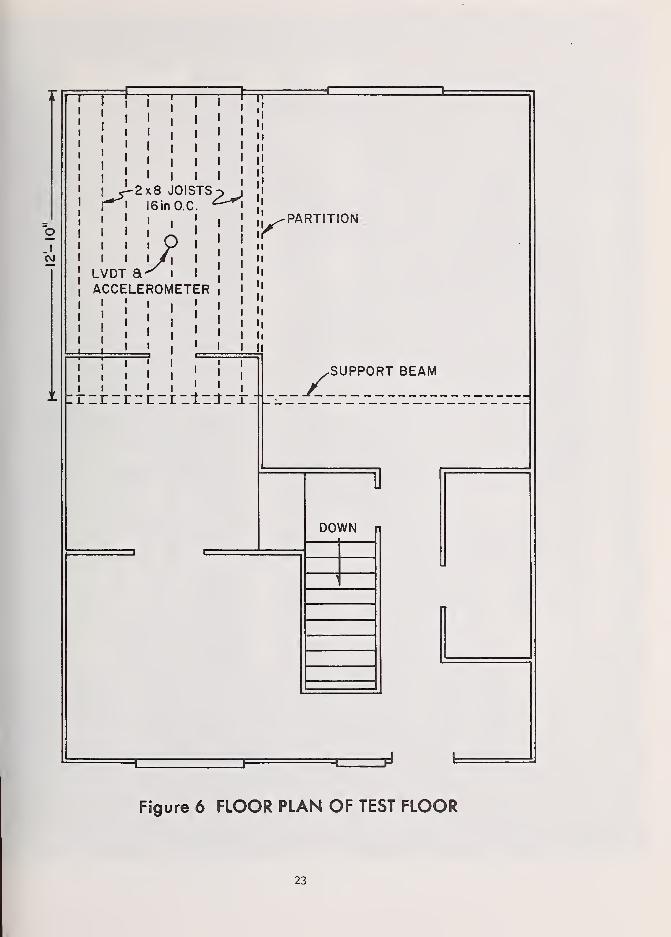
furnished as shown in Figure 5. The floor system was typical of that found
in many houses and consists of 2 x 8 wood joists spaced 16 in on center
overlaid with 1/2-in plywood, The joists have a clear span of 12 feet 10
inches with diagonal bridging at mid-span. A synthetic wood floor tile is
attached to the plywood subfloor by an adhesive. The floor construction is
shown in Figures 6 and 7,
Floor response measurements were obtained from both an accelerometer
and linear variable differential transformer (LVDT) . The range of the
accelerometer is from 10 mg to 0.001 mg. Figure 6 shows the location of
this instrumentation. The LVDT was positively attached to the joist at
mid-point of the clear span and the accelerometer set on the floor directly
above the LVDT. Output from the LVDT and accelerometer were recorded as.
analog signals. While the frequency response of the electronic equipment
was adequate to reproduce the time histories, the signal conditioning
equipment for the accelerometer has a cut-off frequency of 25 Hz. This is
generally considered satisfactory for most wood-joist floor systems.
14
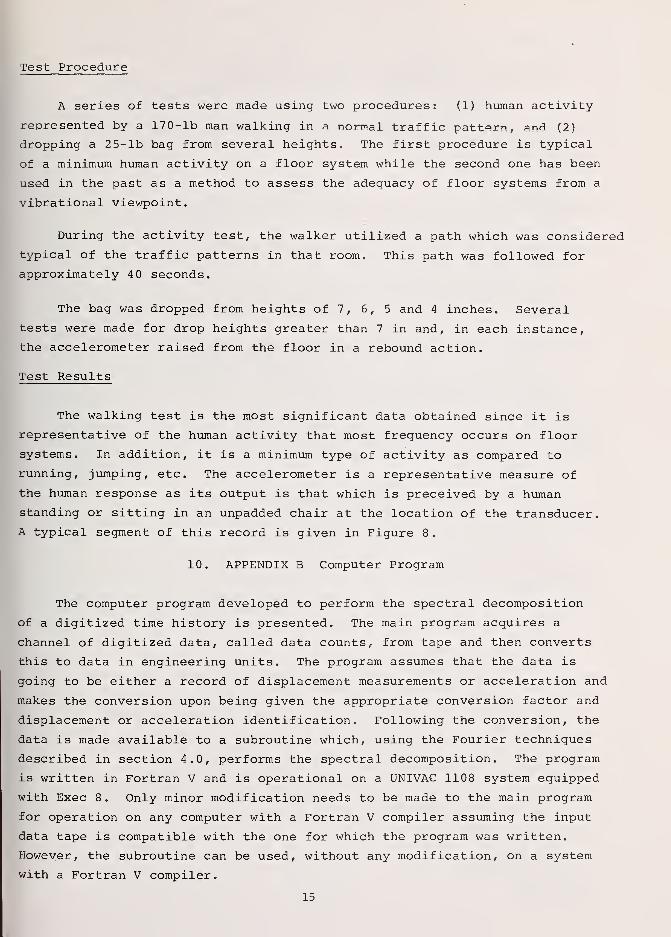
Test Procedure
A series of tests were made using two procedures: (1) human activity
represented by a 170-lb man walking in a normal traffic pattern, and (2)
dropping a 25-lb bag from several heights. The first procedure is typical
of a minimum human activity on a floor system while the second one has been
used in the past as a method to assess the adequacy of floor systems from a
vibrational viewpoint.
During the activity test, the walker utilized a path which was considered
typical of the traffic patterns in that room. This path was followed for
approximately 4 seconds.
The bag was dropped from heights of 7, 6, 5 and 4 inches. Several
tests were made for drop heights greater than 7 in and, in each instance,
the accelerometer raised from the floor in a rebound action.
Test Results
The walking test is the most significant data obtained since it is
representative of the human activity that most frequency occurs on floor
systems. In addition, it is a minimum type of activity as compared to
running, jumping, etc. The accelerometer is a representative measure of
the human response as its output is that which is preceived by a human
standing or sitting in an unpadded chair at the location of the transducer.
A typical segment of this record is given in Figure 8 .
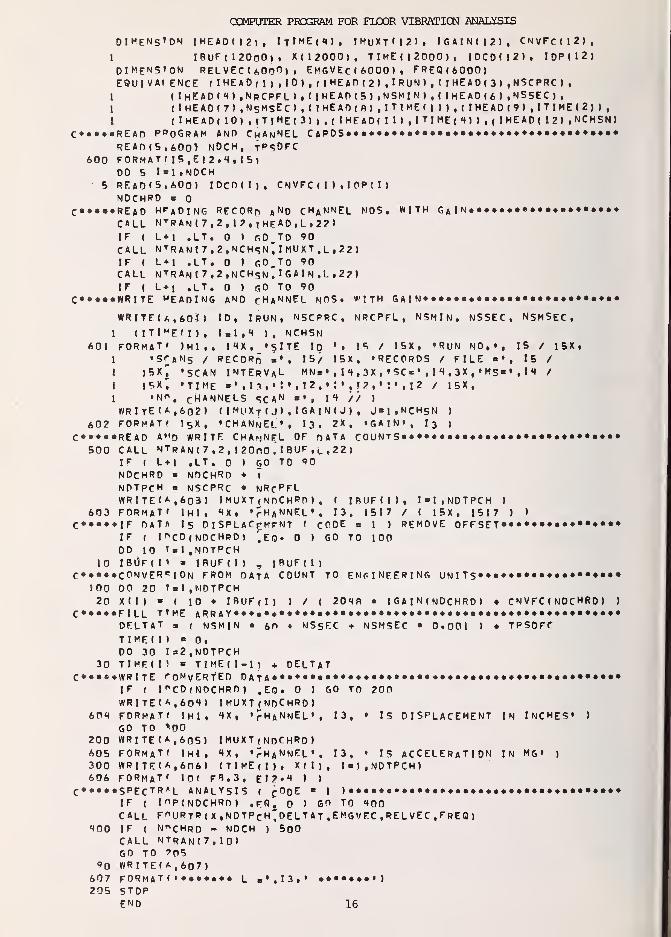
10. APPENDIX B Computer Program
The computer program developed to perform the spectral decomposition
of a digitized time history is presented. The main program acquires a
channel of digitized data, called data counts, from tape and then converts
this to data in engineering units. The program assumes that the data is
going to be either a record of displacement measurements or acceleration and
makes the conversion upon being given the appropriate conversion factor and
displacement or acceleration identification. Following the conversion, the
data is made available to a subroutine which, using the Fourier techniques
described in section 4.0, performs the spectral decomposition. The program
is written in Fortran V and is operational on a UNIVAC 1108 system equipped
with Exec 8 . Only minor modification needs to be made to the main program
for operation on any computer with a Fortran V compiler assuming the input
data tape is compatible with the one for which the program was written.
However, the subroutine can be used, without any modification, on a system
with a Fortran V compiler.
15
COMPUTER PROGRAM FOR FLOOR VIBRATION ANALYSIS
DIMeNs»ON IHEADU2), IjIMEjq), 1MUXTM2), IGA1NU21, CNVFC(12),
I IBUT( 120(30) , XU2000), TlME(l2000), IDCDU2). I0P<12)DIMENSTON REL VEC ( AOnO ) , EMG VEC f 6000 ) , FREQ16000)EQUIVAt ENCE ( I HEAD ( J ) , ID J , ( ! HEAD ( 2 )
. 1 RUN ),
(
l HEAD ( 3 )
,
NSCPRC) ,
1 (!HCAD(H),NRCPFL),(!HEAn(5),NSM!N),<lHEA0(6),NSSEC),I ( I HEAD (7) .NgMsEc) , ( I HEAD ( 8 ) , I T ! ME ( 1 ) ) , ( I HEAD ( 9 > , 1 1 1 ME ( 2 ) »
,
1 ( I HE AD ( 10) , I TIME (3) j ,( I HEAD ( 11) ,!TIME(<4) 1 , ( I HE AD (.12) .NCHSNJC*****READ PROGRAM AND ChAnNEL C
A
RDS •••«•••***•••••*«••••*•••****• •***•READ(5,60o1 NDCH, tPSDFC
600 FORMAT? I5.EJ2.M, 15)DO 5 !! i NDCH
5 READ(5,600) IDCD(!», CN VEC t I ) • I OP < I )
NDCHRDc****»read ht a ding record a n d ch a wnel nos. with gain****** ***•••«»
CALL NTran(7,2, 12, iHFAD.L.2?)IF ( L+| .LT. ) GO TO 90CALL N'»'RANI7,2,NCH«;N^IMUXT,L.22)IF < L+l ,LT. ) f,0.T0 90CALL NTrAn<7,2,NCH S n, IGAIN.L ,2?)IF ( L*| ,LT. ) GO TO 90
C*****WRITE READING AND cHaNNEL NOS. WITH G A I N* • *•••*•••••*•••• • •*•*••*•
WRITE< A, 601) ID, IrUN, NSCPRC, NRCPFL , NSMIN, NSSEC, NSMSEC ,
1 ( ITI M E( I ) , I«l ,<4 ) , NCHSN601 FORMAT' lHl • • » * X , »SlTE ID . 15 / 15X, 'RUN NO.t, 15 / 15X t
1 'STAMS / RECORD = *. 15/ I5X, 'RECORDS / FILE »', 15 /
1 1 5X7 'SCAN INTERVAL MN» • , I H , 3X , • SC« * , I *• , 3X , « MS« • , H /
1 15X^ 'TIME *', l3,» '
• ,12, • :
•
,T2,» :• ,12 / 15X,
1 »N*. CHANNELS SCA N *', I * // )
WRlTE(A,602) (IMUX T ( J) ,IGAIN( J) , J-1.NCH5N )
602 FORMAT? | 5 X, CHANNEL', 13. 2X, ,GA!N«, I 3 )
C*****READ A»'D WRITE CHANNEL OF DATA COUNTS* ***••*•*••»•*•••** »***«*••500 CALL NTran(7,2, 120nO, IBUF,u,22)
IF ( L*l .LT. 1 GO TO 90NDCHRD * NDCHRD + 7
NDTPCH * NSCPRC • NRc p FLWRITER, 6o3> IMUXT(NDCHRD) , ( IBUFU), I I . NDTPCH )
603 FORMAT' 1 H 1 . * X , VHaNNEL', 13, 1517 / ( 15X, 1517 ) >
C***»*IF DATA is DlSPLACpMFNT ( CODE * 1 ) REMOVE OFFSET* •••••*•« ••**•IF j I^CD(NOCHRD) '.E0. ) GO TO 100DO 10 Tal, NDTPCH
10 !B0>( I » > IBUF( I ) „ JBUF( 1 )
C*****CDNVER ,; lON FROM DATA COUNT TO ENGINEERING UN I TS»« •••**••*•*•*•« •*•100 DO 20 T«l , NDTPCH20 X(I) » ( 10 • IBUF(I) ) / ( 20<4fl • IGAIN(NDCHRD) * CNVFC < NDCHRD ) )
C«****FILL TTME ARRAY********«****»»******»****************»*******»*»*»DELTAT 3 ( NSMIN * 6n + NSSFC + NSMSEC * 0.001 ) * TPSDFCTIME( 11 0.DO 30 1=2, NDTPCH
30 TIME(H = T!ME«I-1> DELTaTC*****WRITE CoNvERtED DAtA*«»»«»**«»*«*»»*»«**»»»»*»»»»«*»*»**»**»**»«* #
IF ( I^CD(NDCHRD) .EO. ) GO TO 200WRITE* * ,6Q<4» IMUXTjNDCHRO)
60<4 FORMAT' I H 1 , 1 X , VHaNnEL', 13, « IS DISPLACEMENT IN INCHES* )
GO TO >00200 WRITE(*,6o5) I MUX T
<
NDCHRD )
605 FORMAT' lHl, « X , VH A NNEL', 13, • IS ACCELERATION IN MG» )
300 WRITE(6,606) (TIME(I)i X(I), 1*1, NDTPCH)606 FORMAT' IOC F*.3, E 1 2 • 1 ) )
c ***** S pe: c tral analysis ( c ode » 1 I************************************IF ( I"P(NDCHRD) ,f0. 1 GO TO 400CALL F*URTR(X,NDTPcH"DELTAT,EMGVEC,RELVEC,FREQ)
MOO IF ( NDCHRD - NDCH 1 5oOCALL NTRANJ7.10)GO TO '05
90 WRITE(A,607)607 FORMAT '» ***»**• L =*,ll,' •*•***••)205 STOP
END 16

SUBROUTINE FOR SPECTRAL DECOMPOSITION
SUBROUTINE FOURTRIx.N.DELTATiEMGvEC.RFlVFCtFREQ)DIMENSION RECFOR(3,, REL VEc ( 60Q0 ) , EMG VEC < 6000 ) , FREQ<6000>,
1 X(»2000)L N - I
M N / 2
00 100 K a 0,MOMEGA 6.2831853 • < / N
CS0ME6 » COS(OMEGA)SNOMEG SINIOMEGAJ
C*»*«* EVALU*TE RECURRSIoN FORMULA ••* * •«»•••••••••«RECFORf 1 ) * X(N)RECF0Rf2> X( N-l )
RECF0RI3) X( N-2 ) * 2 . CS0ME6 • RECF0R(2) - RECFOR(l)DO 200 I « 3,LRECFORf I ) « RECF0R(2»RECF0R»2) * RECF0R,3)
200 RECF0R(3) * X( N-I ) 2. • CSOMEG • RECF0R(2) - RECFOR(l)C****« COMPUTE REAL AND IMAGINARY VECTORS ••••••*••»•«••••••*••**•*•
i
FREO(K> » K / f N « OELTAT )
EMGVECfK) REcF0R(3l * SNOMEG • DELTAT100 RELVECfK) * < X(0) RECF0R(3) * CSOMEG - RECF0R(2) > * DELTAT
C*«»*t COMPUTE ABSOLUTE vAlUE ••**•••••*•*••*•••**••••••*••*•••*•<DO 300 K=O.M
300 X(K) SORT( RELVEc«K»»*? EMGVEC(K>»»2 )
WRITEC*,201> < FREg(HT), RE L VEC(k), EMGVEC ( K ) , X ( K> , K»0,M )
201 F0RMATf|Hj, H X , «4F)6.8 / ( 5X, 4F16.8 / ) )
RETURNEND
17
!20(533.8)
105(4670)
90(400.3)
75 r
(333.6)
uT 60o (266.9)
O
45 r
(200.2)
30(133.4)
15(66.7)
Figure 1 VERTICAL LOAD FROM FOOTFALL [f|
18
F(t)
M,
K,
M, M.
Kl±J
C2C3M > K
3
S"
Figure 2 ENGINEERING VIBRATION MODEL
19
z
00
oro
CVJ
>-
o zCM
M UJ_L a>- >OzLJ UJ
l£>
o ZLLi
UJ
cr COL_
4)
O O)
s-^'srnnaow u3iunoj
20
io-' I
—
rms.g
Id3
LENZEN'SPERCEPTIBLERANGE
SPLITTGERBERMINIMUM COMPLAINTLEVEL
110
f,Hz
20
/
SPLITTGERBERIMPULSIVE SHOCK
SOSTANDARD CURVE
50 100
Figure 4 HUMAN RESPONSE THRESHOLDS
TRANSIENT VERTICAL VIBRATION
21
N"
/y.
m
22
I
I I
I i
I I
!
1
II
II I
II I'II
J-2x8 JOISTS
r i !6inO.C. Z^i
! ' .
r a-^ i
i
I
LVDT S^ I
ACCELEROMETERI
II
I
i
I
lzlzizlzl -l-lrr
K PARTITION
^SUPPORT BEAM
DOWN
Figure 6 FLOOR PLAN OF TEST FLOOR
23

Eh
DCmEh
DOEh
H
i.FIGURE 7 TEST FLOOR UNDERSIDE
24

1ft*
-
J----J-
— —l
---
— -: —
-.f
V,>
c*i
--
V
!•
V3 P»
:
;
^j
/
-fv
1
..._.!. 1^3
!
i
- ! -- -.j
i •i
- -'-•f
i
co
Oj
OS
w —
wWCJo 4
w
:| 4—- ^T
-H- -l" -- ~i
\
_-__- j
f"
>
E-
1
I:
i]: Jf |
j
CO J.If
cfc
c2rt
p.
»J-fa^g
i "1 I1 _| .. c
i s:1 JI
__"1
xi
1
^-taL'T"~__ ~-
jp --:
w
wo<:
ftCO
Q

TH6S-1.4A (REV. 7-73)
U.S. DEPT. OF COMM.BIBLIOGRAPHIC DATA
SHEET
1. PUBLICATION OR REPORT NO.
NBS TN-904
2. Gov't AccessionNo.
3. Recipient's Accession No.
4. TITLE AND SUBTITLE
Correlation of Floor Vibration to Human Response
5. Publication Date
May 1976
6. Performing Organization Code
461.01
7. AUTHOR(S)
James R. Shaver8. Performing Organ. Report No.
9. PERFORMING ORGANIZATION NAME AND ADDRESS
NATIONAL BUREAU OF STANDARDSDEPARTMENT OF COMMERCEWASHINGTON, D.C. 20234
10. Project/Task/Work Unit No.
4618381
11. Contract/Grant No.
12. Sponsoring Organization Name and Complete Address (Street, City, State, ZIP)
Office of Policy Development and ResearchDepartment of Housing and Urban DevelopmentWashington, DC 20410
13. Type of Report & PeriodCovered
Final
14. Sponsoring Agency Code
Samp as 1715. SUPPLEMENTARY NOTES
16. ABSTRACT (A 200-word or less factual summary ot most significant information. If document includes a significant
bibliography or literature survey, mention it here.)
A new approach to the problem of perceptible floor vibrations is presented predicatedon the realization that human activity and human response to this activity arerandom variables. Techniques for data reduction are discussed and a detaileddescription of one approach is given along with the associated computer program.
Data from floor vibrations is compared with current criteria for human responseto vibration.
17. KEY WORDS (six to twelve entries; alphabetical order; capitalize only the first letter of the first key word unless a proper
name; separated by semicolons)Analysis; experimental; floor systems; human response;
random process; spectral analysis; vibration.
18. AVAILABILITY [XXUnlimited
For Official Distribution. Do Not Release to NTIS
J Order From Sup. of Doc, U.S. Government Printine OfficeWashington, D.C. 20402, SD Cat. No. CI 3 .46:
I^H Order From National Technical Information Service (NTIS)Springfield, Virginia 22151
19. SECURITY CLASS(THIS REPORT)
UNCLASSIFIED
20. SECURITY CLASS(THIS PAGE)
UNCLASSIFIED
21. NO. OF PAGES
29
22. Price
$0.75
USCOMM-DC 29042-P74
<j U. S. GOVERNMENT PRINTING OFFICE : 1976--210-801/244
NBS TECHNICAL PUBLICATIONS
PERIODICALS
JOURNAL OF RESEARCH reports National Bureau
of Standards research and development in physics,
mathematics, and chemistry. It is published in two sec-
tions, available separately:
• Physics and Chemistry (Section A)
Papers of interest primarily to scientists working in
these fields. This section covers a broad range of physi-
cal and chemical research, with major emphasis on
standards of physical measurement, fundamental con-
stants, and properties of matter. Issued six times a
year. Annual subscription: Domestic, $17.00; Foreign,
$21.25.
• Mathematical Sciences (Section B)
Studies and compilations designed mainly for the math-ematician and theoretical physicist. Topics in mathe-matical statistics, theory of experiment design, numeri-
cal analysis, theoretical physics and chemistry, logical
design and programming of computers and computersystems. Short numerical tables. Issued quarterly. An-nual subscription: Domestic, $9.00; Foreign, $11.25.
DIMENSIONS/NBS (formerly Technical News Bul-
letin)—This monthly magazine is published to informscientists, engineers, businessmen, industry, teachers,
students, and consumers of the latest advances in
science and technology, with primary emphasis on the
work at NBS. The magazine highlights and reviews suchissues as energy research, fire protection, building tech-
nology, metric conversion, pollution abatement, health
and safety, and consumer product performance. In addi-
tion, it reports the results of Bureau programs in
measurement standards and techniques, properties of
matter and materials, engineering standards and serv-
ices, instrumentation, and automatic data processing.
Annual subscription: Domestic, $9.45; Foreign, $11.85.
NONPERIODICALS
Monographs—Major contributions to the technical liter-
ature on various subjects related to the Bureau's scien-
tific and technical activities.
Handbooks—Recommended codes of engineering andindustrial practice (including safety codes) developedin cooperation with interested industries, professional
organizations, and regulatory bodies.
Special Publications—Include proceedings of confer-ences sponsored by NBS, NBS annual reports, and otherspecial publications appropriate to this grouping suchas wall charts, pocket cards, and bibliographies.
Applied Mathematics Series—Mathematical tables,
manuals, and studies of special interest to physicists,
engineers, chemists, biologists, mathematicians, com-puter programmers, and others engaged in scientific
and technical work.
National Standard Reference Data Series—Providesquantitative data on the physical and chemical proper-ties of materials, compiled from the world's literature
and critically evaluated. Developed under a world-wide
program coordinated by NBS. Program under authority
of National Standard Data Act (Public Law 90-396).
NOTE: At present the principal publication outlet for
these data is the Journal of Physical and ChemicalReference Data (JPCRD) published quarterly for NBSby the American Chemical Society (ACS) and the Amer-ican Institute of Physics (AIP). Subscriptions, reprints,
and supplements available from ACS, 1155 SixteenthSt. N. W., Wash. D. C. 20056.
Building Science Series—Disseminates technical infor-
mation developed at the Bureau on building materials,
components, systems, and whole structures. The series
presents research results, test methods, and perform-ance criteria related to the structural and environmen-tal functions and the durability and safety character-
istics of building elements and systems.
Technical Notes—Studies or reports which are completein themselves but restrictive in their treatment of asubject. Analogous to monographs but not so compre-hensive in scope or definitive in treatment of the sub-
ject area. Often serve as a vehicle for final reports of
work performed at NBS under the sponsorship of other'
government agencies.
Voluntary Product Standards—Developed under pro-
cedures published by the Department of Commerce in
Part 10, Title 15, of the Code of Federal Regulations.
The purpose of the standards is to establish nationally
recognized requirements for products, and to provide
all concerned interests with a basis for common under-standing of the characteristics of the products. NBSadministers this program as a supplement to the activi-
ties of the private sector standardizing organizations.
Federal Information Processing Standards Publications
(FIPS PUBS)—Publications in this series collectively
constitute the Federal Information Processing Stand-ards Register. Register serves as the official source of
information in the Federal Government regarding stand-
ards issued by NBS pursuant to the Federal Propertyand Administrative Services Act of 1949 as amended,Public Law 89-306 (79 Stat. 1127), and as implementedby Executive Order 11717 (38 FR 12315, dated May 11,
1973) and Part 6 of Title 15 CFR (Code of FederalRegulations).
Consumer Information Series—Practical information,based on NBS research and experience, covering areasof interest to the consumer. Easily understandablelanguage and illustrations provide useful backgroundknowledge for shopping in today's technological
marketplace.
NBS Interagency Reports (NBSIR)—A special series of
interim or final reports on work performed by NBS for
outside sponsors (both government and non-govern-ment). In general, initial distribution is handled by thesponsor; public distribution is by the National TechnicalInformation Service (Springfield, Va. 22161) in papercopy or microfiche form.
Order NBS publications (except NBSIR's and Biblio-
graphic Subscription Services) from: Superintendent ofDocuments, Government Printing Office, Washington,D.C. 20402.
BIBLIOGRAPHIC SUBSCRIPTION SERVICESThe following current-awareness and literature-surveybibliographies are issued periodically by the Bureau:Cryogenic Data Center Current Awareness Service
A literature survey issued biweekly. Annual sub-scription: Domestic, $20.00; foreign, $25.00.
Liquefied Natural Gas. A literature survey issued quar-terly. Annual subscription: $20.00.
Superconducting Devices and Materials. A literature
survey issued quarterly. Annual subscription : $20.00.Send subscription orders and remittances for thepreceding bibliographic services to National Bu-reau of Standards, Cryogenic Data Center (275.02)Boulder, Colorado 80302.
Electromagnetic Metrology Current Awareness Service
Issued monthly. Annual subscription: $24.00. Sendsubscription order and remittance to ElectromagneticsDivision, National Bureau of Standards, Boulder,Colo. 80302.

U.S. DEPARTMENT OF COMMERCENational Bureau of StandardsWashington. DC. 20234
OFFICIAL BUSINESS
Penalty for Private Use, $300
POSTAGE AND FEES PAIDU.S. DEPARTMENT OF COMMERCE
COM-215
SPECIAL FOURTH-CLASS RATE
BOOK
•oUJTIO/y
*ZS YEARS
1901-197B'^6-l9l fe