correlation of seismic data types across strong motion · pdf filecorrelation of seismic data...
TRANSCRIPT

13th World Conference on Earthquake Engineering Vancouver, B.C., Canada
August 1-6, 2004 Paper No. 2363
CORRELATION OF SEISMIC DATA TYPES ACROSS STRONG MOTION ARRAYS
Lawrence D. PORTER1 and David J. LEEDS2
SUMMARY Strong ground motions from a recent major California earthquake are studied for a station cluster to determine the variation of waveforms as a function of component orientation, data type, epicentral distance and earthquake azimuth. Free field records of the 1994 Northridge event are examined for epicentral distances in the range from 9 to 15 km. Particle motion plots are used to analyze the recorded accelerations together with the velocities and displacements computed from them by integration. The large amplitude lobes of the horizontal displacement orbits which occur shortly after the onset of motion are tracked across an array of closely spaced stations by monitoring the times of their peak amplitudes. The time intervals between successive lobes are assigned arbitrary shadings to aid in analyzing the correlation of the time histories between adjacent stations. Closely spaced stations exhibit correlations for the horizontal components which are most pronounced for the displacements. The correlations of the orbital plots between adjacent stations are less marked for the velocities and weakest for the accelerations. The similarity of the plots from station to station also decreases with increasing distance between stations. This study shows the value of working with shaded plots in tracking the individual segments of the displacement orbits across an array of closely spaced stations. The usefulness of shadings and also color annotation is also apparent because the time histories for the velocities and accelerations can be related directly to the corresponding displacement segments.
INTRODUCTION The 1994 Northridge earthquake triggered approximately 350 strong motion stations within 155 km of the epicenter. Digital records were obtained from over 225 of these stations by the use of standardized processing methods techniques (Porcella [1]., Shakal [2]). Because this earthquake occurred in a densely
1Principal, Geocarte International, PO Box 564, Alamo, CA 94507, Email: [email protected] 2Principal, David J. Leeds Associates, 11972 Chalon Road, Los Angeles, CA 90049, Email: [email protected]

populated area near the city of Los Angeles (Fig. 1), many scientific investigations have been devoted to analysis of the event and its resulting damage.
Figure 1. Map of California and the Van Norman Complex - Sylmar area.
The radii of the concentric circles are 250 and 500 km. The Van Norman Complex - Sylmar area has been a subject of great interest to earthquake engineers because it contains a dense concentration of utilities and lifelines (electricity, gas, oil, water, transportation) which lead to the northwest from Los Angeles (Fig. 2). Many of the facilities related to these vital operations were severely damaged during the 1971 San Fernando earthquake. Following that event the number of seismic instruments in the area was increased, and at the time of the 1994 earthquake 20 recording sites were in operation (Bardet [3]).

Figure 2. Map of the VNC - Sylmar area and the 1994 Northridge earthquake.
The radii of the concentric circles are 3.5 and 7 km.
THE 1994 NORTHRIDGE EARTHQUAKE AND THE VAN NORMAN COMPLEX - SYLMAR AREA
Eight of the sites that were active in the Van Norman Complex - Sylmar area (Fig. 3) during the 1994 Northridge earthquake are classified as either truly free field or nearly so, based on the detailed descriptions of the site conditions and instrument locations (Bardet [3], Davis [4], Porter [5]). As one approaches the epicenter from the northern boundary of this area, a review of the sites (Fig. 3) shows an irregular pattern starting with a free field station in the northeast, then a pair of stations housed in small reinforced concrete structures to the west, a second pair of stations - one over a reinforced concrete valve housing, the other a free field ground surface instrument near a large structure - slightly to the south, a third pair installed in a dam even further south, and finally a second free field station at the southern boundary. The discussion given below obtains when this pattern is repeated with the stations identified by name. The Sylmar County Hospital (SCH), although technically not part of the Van Norman Complex (VNC), lies at northeast corner of the square enclosing the Van Norman Complex - Sylmar area. It is included as a reference point because its recordings were the least complicated and its site is furthest removed from the epicenter (15.3 km). The Jensen Filtration Plant has two stations (JFG and JFA) 260 m apart in the Generator and Administration Buildings, respectively. The Sylmar Converter Station (SCS) and its eastern counterpart (SCSE) straddle the Interstate 5 freeway. The Los Angeles Dam has two stations, one in the

West Abutment (LADW) and the other buried in the foundation (LADF). The Rinaldi Receiving Station (RRS) near the southern boundary is closest to the epicenter (9.4 km).
Figure 3. Map of the VNC - Sylmar area and the eight strong motion seismic stations.
The concentric circles of radii 1, 2, and 3 km are centered midway between the outermost stations.
STRONG-MOTION DATA ANALYSIS
The Van Norman Complex - Sylmar area has been the subject of numerous scientific and engineering investigations ever since the 1971 San Fernando earthquake. Part of this interest was of course stimulated by the spectacular collapse of the Olive View Hospital during that event, but much attention also came directly from the extensive damages sustained by the installations in the Van Norman Complex itself. The 1994 Northridge earthquake brought yet another wave of attention. Previous studies Peak amplitudes studies and maps (Wald [6]) deal with the accelerations recorded at 38 of the close-in stations, including the two free field stations (SCH and RRS) in the Van Norman Complex - Sylmar area. In addition, several papers study the performance of engineered facilities during the 1994 earthquake (Davis [4]), while others direct their attention to the time histories from two adjacent stations and verifying the nonlinear responses attributed to them (Cultrera [7]). A more recent work (Porter [5]) examines the time histories for the eight seismic stations mentioned above using two additional methods of graphical display: 1) panels of the time histories for each data type

arranged from top to bottom in the same order as the stations are located north to south in the Van Norman Complex - Sylmar area, and 2) orbital plot maps with time annotation of the particle paths so that the peak values can be measured not only in amplitude, but also as a function of time and location in the station cluster. Panels of time history plots One panel of eight traces is plotted for each data type (acceleration, velocity and displacement) and component (radial, transverse and vertical). The order of the traces down the panel follows the general north to south pattern of the stations in the area as described above (Table 1). Visual inspection of the nine panels shows the greatest correlation between adjacent stations for the radial component of each data type, followed by the transverse component. The vertical components show the least correlation in the case of each data type. In terms of data type the displacements exhibit the strongest correlation and the accelerations the weakest. The similarity in time histories becomes most pronounced for the radial displacements, as might be expected because of the longer period motions, in contrast to the accelerations.
Table 1. Seismic stations and peaks amplitude times for the horizontal displacement orbits
Station North West Stationb Times - successive peak amplitudes (sec) No. Sym Name Lat. Long. Range Azma horizontal orbital displacements
(deg) (deg) (km) (deg) 1 2 3 4 5 6 Sylmar 1 SYL County 34.32 118.44 15.3 33.6 3.35 4.00 4.40 5.05 5.90 6.90 Hospital Jensen 2 JFG Fil Plant 34.31 118.50 11.8 17.2 2.95 3.75 4.30 5.42 5.95 7.00 Gen Blg Jensen 3 JPF Fil Plant 34.31 118.50 11.8 18.2 3.05 3.95 4.50 5.60 6.20 7.15 Adm Blg Sylmar 4 SCS Converter 34.31 118.49 11.9 20.9 3.05 4.00 4.60 5.65 6.35 7.00 Station Sylmar 5 SCSE Converter 34.31 118.48 12.3 24.3 3.00 3.60 4.35 5.75 6.40 7.00 Station E LA Dam 6 LADW West 34.29 118.48 10.4 27.9 2.60 3.40 4.20 5.50 6.40 8.00 abutment LA Dam 7 LADF Found- 34.29 118.48 10.7 29.4 2.80 3.59 4.40 5.50 6.62 8.20 ation Rinaldi 8 RRS Receiving 34.28 118.48 9.4 34.5 2.00 2.62 3.60 5.00 6.00 8.10 Station
aAzimuth measured in compass coordinates: 0 deg is north, positive rotation is clockwise. bStation azimuth measured from the epicenter of the 1994 Northridge earthquake
(34.211o N, 118.536o W ).

Orbital motion plot maps The same theme is employed in constructing station maps for the orbital motions (Porter [8]). One map is assembled for each data type with the orbital plots centered directly on the station locations or nearby in the case of closely spaced sites. The same comparison pattern is shown by the orbital maps, with the velocity plots starting to show some similarity and the displacement maps showing the greatest correlation overall and especially in the case of station pairs. The acceleration orbits offer the weakest correlations. Special studies The station pair (JFG and JFA) for the Jensen Filtration Plant are located only 260 m apart. The similarity of their orbits becomes slightly apparent for the velocities and only markedly so for the displacements. A possible reason for the difference in the case of the accelerations may be due to the presence of an extensive water treatment facility near one station (JFG) of the pair (Cultrera [7]). The Rinaldi station (RRS) obtained the largest peak velocity (~170 cm/sec) recorded up to 1994. The direction of the lobe for this peak is almost the same as the earthquake azimuth for that station. The largest displacement excursions for the eight stations also show a similar result since they are all in approximate alignment with their corresponding earthquake azimuths (Porter [9], Porter [10]). The southernmost station (Rinaldi [RRS]) is marked by what appears to be a late start, since its orbit begins in the fourth quadrant, while the onsets for the remaining seven stations are all in their third quadrants. There is speculation (Trifunac [11]) that the instrument may have been initially unresponsive due to the freezing temperatures at the time of the earthquake. There is also the question of source complexity in terms of successive ruptures shortly after the main break (Bardet [3]). Current studies The most obvious extension of the previous investigations of this strong motion data set would be to look for further similarities in the records. Two paths are open for further work: 1) spectral plots, and 2) tracking the lobes of the displacement orbits across the station cluster. Both features are examined, but with different levels of success. Spectral plots Tripartite spectra are plotted and examined for the three components at each of the eight stations. Only slight similarities are observed, even for the longer periods at adjacent stations. The short period spectra vary greatly from station to station, with no apparent pattern. The same finding is true for the vertical spectra.. The best comparisons are found for the two horizontal components at the two Los Angeles Dam sites (LADF and LADW) and the 22 degree components at the Jensen Filtration Plant pair (JFG and JFA). Annotated orbital plots The orbits for each data type at the eight stations are plotted with time annotation. The times of the peak amplitudes for the displacements are measured for the first six peaks and then compared for the station cluster. The case of the Rinaldi station (RRS) is shown as an example (Fig. 4).

Figure 4. Orbital displacement plot for the Rinaldi Receiving Station (RRS),
showing the times of the first six peak amplitudes. Time history panel plots with arbitrary shading patterns or colors In this procedure a shading index is assigned to each of the time intervals that lie between the onset of the motion and the last measured peak of the displacement for each station. The selection of the shading indices is arbitrary; for the sake of convenience in this exercise they are incremented through the suite of available shading patterns for each successive time interval. Color indices could also be used along with the changes in shading patterns. The number of peaks is limited to six in this study because subsequent displacements become more complicated and decrease rapidly in amplitude. Use of the peak times for the displacements (Table 1) results in a panel of time history traces with banded backgrounds corresponding to the respective segments of the displacement orbits. The panels are grouped by component in the order radial, transverse and vertical. Three successive groups of panels (Figs. 5, 6, and 7) present the respective data types of acceleration, velocity and displacement for the eight stations in the Van Norman Complex - Sylmar area.
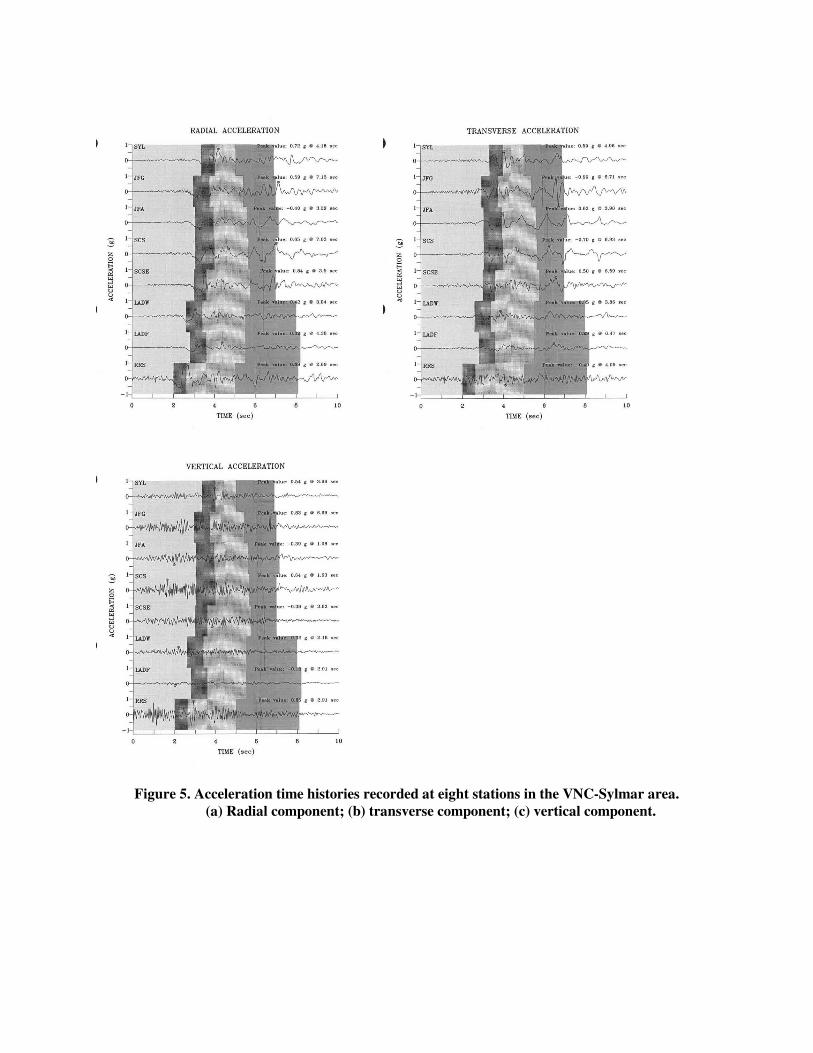
Figure 5. Acceleration time histories recorded at eight stations in the VNC-Sylmar area. (a) Radial component; (b) transverse component; (c) vertical component.

Figure 6. Velocity time histories recorded at eight stations in the VNC-Sylmar area. (a) Radial component; (b) transverse component; (c) vertical component.

Figure 7. Displacement time histories recorded at eight stations in the VNC-Sylmar area. (a) Radial component; (b) transverse component; (c) vertical component.
CONCLUSIONS
Visual inspection of the panels indicates that the horizontal components are most strongly correlated for the displacements, followed by the velocities and then least for the accelerations. Between adjacent stations this correlation relationship with respect to data type is even more pronounced. The station-to-station similarity generally decreases with increasing distance between stations, with the station pairs being immediately apparent for the Jensen Filtration Plant and the Los Angeles Dam. The vertical
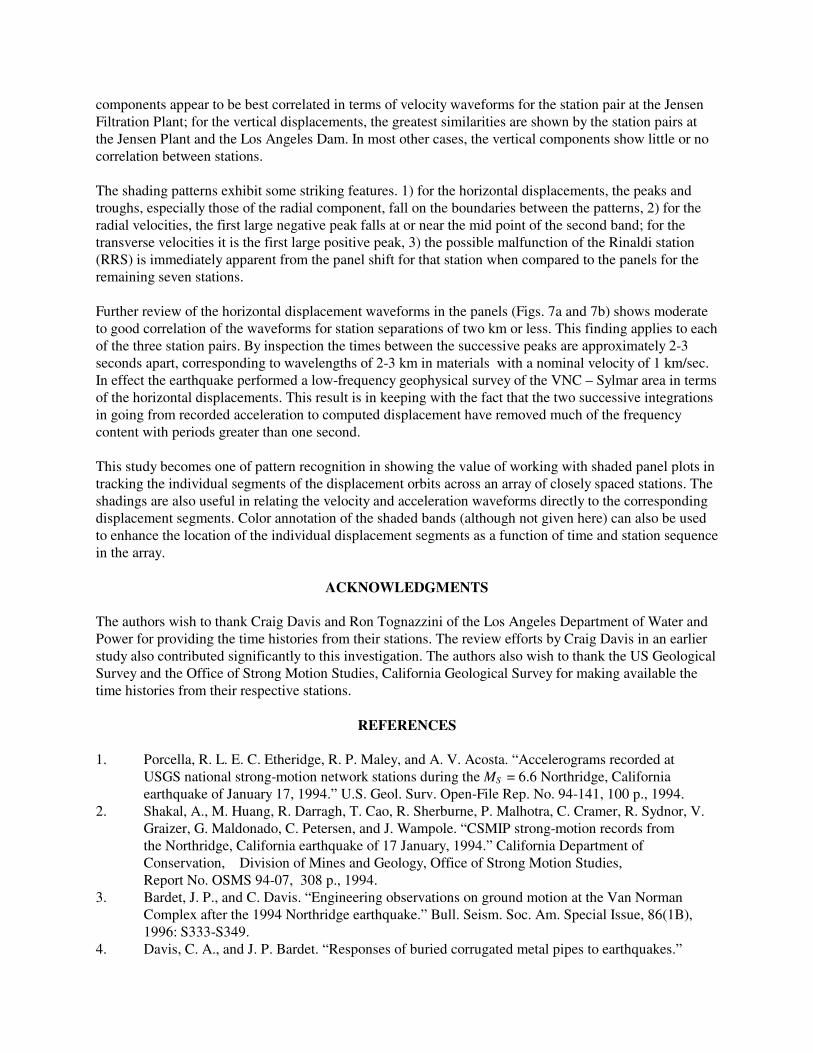
components appear to be best correlated in terms of velocity waveforms for the station pair at the Jensen Filtration Plant; for the vertical displacements, the greatest similarities are shown by the station pairs at the Jensen Plant and the Los Angeles Dam. In most other cases, the vertical components show little or no correlation between stations. The shading patterns exhibit some striking features. 1) for the horizontal displacements, the peaks and troughs, especially those of the radial component, fall on the boundaries between the patterns, 2) for the radial velocities, the first large negative peak falls at or near the mid point of the second band; for the transverse velocities it is the first large positive peak, 3) the possible malfunction of the Rinaldi station (RRS) is immediately apparent from the panel shift for that station when compared to the panels for the remaining seven stations. Further review of the horizontal displacement waveforms in the panels (Figs. 7a and 7b) shows moderate to good correlation of the waveforms for station separations of two km or less. This finding applies to each of the three station pairs. By inspection the times between the successive peaks are approximately 2-3 seconds apart, corresponding to wavelengths of 2-3 km in materials with a nominal velocity of 1 km/sec. In effect the earthquake performed a low-frequency geophysical survey of the VNC – Sylmar area in terms of the horizontal displacements. This result is in keeping with the fact that the two successive integrations in going from recorded acceleration to computed displacement have removed much of the frequency content with periods greater than one second. This study becomes one of pattern recognition in showing the value of working with shaded panel plots in tracking the individual segments of the displacement orbits across an array of closely spaced stations. The shadings are also useful in relating the velocity and acceleration waveforms directly to the corresponding displacement segments. Color annotation of the shaded bands (although not given here) can also be used to enhance the location of the individual displacement segments as a function of time and station sequence in the array.
ACKNOWLEDGMENTS The authors wish to thank Craig Davis and Ron Tognazzini of the Los Angeles Department of Water and Power for providing the time histories from their stations. The review efforts by Craig Davis in an earlier study also contributed significantly to this investigation. The authors also wish to thank the US Geological Survey and the Office of Strong Motion Studies, California Geological Survey for making available the time histories from their respective stations.
REFERENCES 1. Porcella, R. L. E. C. Etheridge, R. P. Maley, and A. V. Acosta. “Accelerograms recorded at USGS national strong-motion network stations during the MS = 6.6 Northridge, California earthquake of January 17, 1994.” U.S. Geol. Surv. Open-File Rep. No. 94-141, 100 p., 1994. 2. Shakal, A., M. Huang, R. Darragh, T. Cao, R. Sherburne, P. Malhotra, C. Cramer, R. Sydnor, V.
Graizer, G. Maldonado, C. Petersen, and J. Wampole. “CSMIP strong-motion records from the Northridge, California earthquake of 17 January, 1994.” California Department of Conservation, Division of Mines and Geology, Office of Strong Motion Studies, Report No. OSMS 94-07, 308 p., 1994.
3. Bardet, J. P., and C. Davis. “Engineering observations on ground motion at the Van Norman Complex after the 1994 Northridge earthquake.” Bull. Seism. Soc. Am. Special Issue, 86(1B), 1996: S333-S349. 4. Davis, C. A., and J. P. Bardet. “Responses of buried corrugated metal pipes to earthquakes.”

J. of Geotech. and Geoenviron. Eng., 126, 2000: 28-39. 5. Porter, L. D., and D. J. Leeds. “Correlation of strong ground for the 1994 Northridge earthquake.”
Geophys. J. Int. 143, 2000: 376-388. 6. Wald, D. J., T. H. Heaton, and K. W. Hudnut. “The slip history of the 1994 Northridge,
California, earthquake determined from strong-motion, teleseismic, GPS, and leveling data.” Bull. Seism. Soc. Am. Special Issue, 86(1B), 1996: S49-S70.
7. Cultrera, G., D. M. Boore, W. B. Joyner, and C. M. Dietel. “Nonlinear soil response in the vicinity of the Van Norman Complex following the 1994 Northridge, California, earthquake.” Bull. Seism. Soc. Am., 89, 1999: 1214-1231.
8. Porter, L. D., and D. J. Leeds. “Maps of orbital motions for the 1994 Northridge earthquake.” Seism. Res. Letters, 70, 1999: 215.
9. Porter, L. D. “The influence of earthquake azimuth on structural response due to strong ground shaking.” Proceedings of the 11th World Conference on Earthquake Engineering, Acapulco, Mexico. Paper no. 1623. Oxford: Pergamon, 1996.
10. Porter, L D, and D J Leeds. “Azimuthal dependence of strong ground motions from three California earthquakes.” Eos Trans. AGU, 84(46), Fall Meet. Suppl., Abstract S51E-0105, 2003.
11. Trifunac, M. D., M. I. Todorovska, and V. W. Lee, “The Rinaldi strong motion accelerogram of the Northridge, California earthquake of 17 January 1994.” Earthquake Spectra 1998, 14:
225-239.