correlations between mercury€in€soils and bottom deposits of...
TRANSCRIPT

Chemistry for Sustainable Development 25 (2017) 191�198 191
Malikova I. N. and Strakhovenko V. D., 2017
UDC 550.42 546.49 571.15
Correlations between Mercury in Soils and Bottom Depositsof Bol�shoye Yarovoye Lake
I. N. MALIKOVA and V. D. STRAKHOVENKO
Institute of Geology and Mineralogy, Siberian Branch, Russian Academy of Sciences,Novosibirsk, Russia
E-mail: [email protected]
(Received February 2, 2016; revised May 13, 2016)
Abstract
It was found that mercury contents in saline soils of Bol�shoye Yarovoye Lake met the average contentin solonetz soils of the steppe zone of Altai Territory. Differences between types of soils are explained by thepeculiarities of solonetz and solonchak processes. The distribution of mercury in bottom deposits is unevenboth along cores on depth of individual wells, and in different wells. The average content of mercury andthe value of the Hg/Al ratio in bottom deposits are significantly higher than their values in soils because oflocal pollution. Low mercury contents and Hg/Al ratios were found in coastal wells only. Factor analysis andpair correlation method detected differences in correlations of mercury between soils and bottom sedimentsboth in granulometric fractions, and the initial samples. Correlation analysis results in the initial samples ofsoils and bottom sediments give the overall picture of mercury distribution in the sedimentation process.Mercury in soils has positive correlations with the terrigenous component that is its major natural source. Anegative correlation with the �carbonate group� (Ñà, Mg, Sr) and antimony is typical. Mercury in bottomdeposits has positive correlations with antimony and manganese, and is bound with the major compositionof precipitates indirectly only. These results argue of a change in the deportment of mercury in the sedi-mentation process, which confirms its local entrance into precipitation from a technogenic source that isaccompanied by antimony.
Key words: mercury, Altai Territory, Bol�shoye Yarovoye Lake, soils, bottom deposits, factor analysis
INTRODUCTION
The study of the distribution of elementsalong the water area of Bol�shoye YarovoyeLake in soils and bottom sediments is of boththeoretical and practical value. The lake is animportant promising source of chemical rawmaterials and the therapeutic sludge, prepa-ration base of valuable biological feed rawmaterials (Artemia salina maxillopod). The lakearea represents a balneological resort area,however, the location on its shore of the Al-taykhimprom JSC, wastes of which containmercury, are hazardous for the environment.Pollution of snow/water slurry, zooplankton,
and local pollution of soils and bottom depositswas detected [1�5].
Bol�shoye Yarovoye Lake is found in the cen-tral part of the Kulunda depression and it isdrainless. Landscape and climatic conditions withlow rainfall levels (250�300 mm a year) and in-creased evaporation are causes of a high de-gree of salinity of the lake water and soils ofits catchment area.
According to mineralization, the lake waterwas assigned to sulphate-chloride type, accord-ing to O. A. Alekin�s classification [6], and bysome data, to sodium chloride [7]. The lake re-ceives water from snow water and ground wa-ter numerous springs. Sandy silts represent bot-

192 I. N. MALIKOVA and V. D. STRAKHOVENKO
Fig. 1. Sampling scheme of Bol�shoye Yarovoye Lake.
tom deposits of the lake. Isolinear maps of gradedistribution of microelements (the Statistica 12 pro-gram) in soils and bottom deposits detected localzones of increased concentrations of mercury asso-ciated with waste area of the chemical combineand wastewater discharges of Yarovoye city [9].
The soils of the area were formed on thebase of integumentary loess-like loams. Complex-mosaic soil cover from more ancient chestnutsoils and black soils of south solonetzic toyounger salines and solonetz. Meadow salineswere formed in the southeastern lowered partof the catchment area. Chestnut soils andsouthern solonetzic chernozems are located atthe elevated areas in the eluvial landscapes.
EXPERIMENTAL
Testing of soils was carried out by genetichorizons in the catchment area up to the sourcerocks in 14 through cuts (74 samples). Bottom
deposits were tested from a catamaran usingspecial samplers in 15 wells (74 samples) todepths to 90 cm (Fig. 1). Samples were collect-ed through each 3 cm and carefully packaged.Granulometric analysis was carried by the elu-triation method in some soil sections and bot-tom sediment cores and fractions for analysis(>0.25, 0.25�0.16, 0.16�0.02 and <0.02 mm) wereisolated. The major part in the mechanic com-position of soils determined by Kachinsky meth-od is represented by a large-silty fraction 0.05�0.01 mm. According to the content of physicalclay (fraction 0.01�<0.001 mm), they refer tolight and medium loam [8].
According to X-ray structural analysis, bot-tom deposits consist of quartz, plagioclase, po-tassium feldspar, calcite, occasionally interlay-ers of mirabilite (Na2SO4 ⋅ 10H2O) and traces ofhalite (NaCl), in addition to organic matter.
Instrumental atomic absorption determina-tion of mercury was carried out by the methodof cold vapour using a ÌÍS-20 mercury hy-

CORRELATIONS BETWEEN MERCURY IN SOILS AND BOTTOM DEPOSITS OF BOL�SHOYE YAROVOYE LAKE 193
dride console to a PerkinElmer device at theSobolev Institute of Geology and Mineralogyof the SB RAS (analytics are Z. O. Badmaeva,N. V. Androsova) according to the accreditedtechnique with a detection limit of 0.01 g/g.The laboratory was accredited by the Associ-ation of Analytical Centers �Analytics� andregistered in the State register No. ROSSRu 0001.510590. In addition to analysis for mer-
cury, another group of macro- and microele-ments was analyzed.
The distribution of elements in bottom depositsand soils of the catchment area is driven by manyfactors, including salinization conditions. To detect theeffect for the distribution of mercury contents of otherelements pair correlation method and factor analysiswere used. They were performed both for the origi-nal samples, and granulometric fractions.
TABLE 1
Average content of mercury (X) and the Hg/Al ratio in soils
Soil types n X, mg/kg Hg/Al, 10�6
Average Variation limits Average Variation limits
Chestnut 5 0.040 0.031�0.047 0.009 0.006�0.012
Chernozems southern solonetzic 15 0.036 0.014�0.097 0.007 0.003�0.019
Solonchaks 8 0.021 0.011�0.033 0.005 0.002�0.008
Solonetzes 20 0.048 0.022�0.071 0.009 0.004�0.016
Saline solonetz 6 0.028 0.019�0.036 0.009 0.003�0.034
Solodized solonetz 5 0.034 0.024�0.045 0.008 0.006�0.062
Solonchak on solonetz 5 0.065 0.041�0.091 � �
Meadow and meadow- marsh solonchaks 10 0.058 0.026�0.12 � �
Average 74 0.040 0.011�0.097 0.008 0.002�0.062
Notes. 1. Here and in Tables 2, 3: n is number of samples. 2. Dash � aluminum in the samples was not determined.
TABLE 2
Average content of mercury (X) and the Hg/Al ratio in bottom sediments
Well No.* n X, mg/kg n Hg/Al, 10�6
Average Variation limits Average Variation limits
Coastal water area
6, 7, 12, 8l 20 0.018 0.010�0.040 12 0.04 0.002�0.009
Northeastern part of water area
8 5 0.052 0.020�0.120 3 0.016 0.005�0.031
73 12 0.233 0.039�0.360 12 0.058 0.010�0.280
Southern part of water area (carbonate coast)
53 14 0.057 0.037�0.083 14 0.009 0.007�0.015
56 6 0.064 0.040�0.110 6 0.015 0.07�0.021
67 6 0.217 0.084�0.360 6 0.038 0.014�0.065
71 11 0.060 0.022�0.120 11 0.011 0.004�0.023
Average 74 0.089 0.010�0.360 52 0.025* 0.004�0.280
Note. For design. see Table 1.
*Coastal wells not considered.

194 I. N. MALIKOVA and V. D. STRAKHOVENKO
RESULTS AND DISCUSSION
Table 1 presents results of mercury deter-mination in various soils of the catchment areaof Bol�shoye Yarovoye Lake. As a whole, mer-cury content in all soils is lower than the aver-age value for soils of Altai Territory [10] andmeets solonetz soils of this landscape zone. Av-erage contents of mercury are close in zonalchestnut soils and southern chernozems. Theformation of solonchaks happens at strong evap-oration under acid conditions. Soil ground wa-ter currents rise up to the surface, where readilysoluble salts are accumulated. This may causea partial transition of mercury into a gas phase,which, apparently, reduces its content in soilsections. In solonetzes, colloids and readily sol-uble salts formed at desalination move down,where an illuvial salt horizon is formed, which,apparently, contributes to the preservation ofmercury in soil section. These peculiarities arereflected in mercury content in soils. Increasedcontents of mercury are typical for meadow andmeadow-marsh solonchaks because of highercontents of organic matter in them. Averagecontents of mercury in granulometric fractionsof chestnut soils are 0.006�0.016 mg/kg. Theyconsiderably increase in solonetzes, especially in<0.02 mm (0.034�0.188 mg/kg) fraction.
The mercury content in bottom deposits isdistinguished by the nonuniformity (Table 2).As a whole, its average content in them is muchhigher than in various soils. The lowest con-tents are typical for coastal wells. This is a con-sequence of the fact that the bulk of the pre-cipitate is formed due to the collapse of soilsand rocks of the coastal area and representedmainly by the macrofragmental component.Wells of the northeastern part of the water areaare found in the zone of meadow-marsh soils,where the contents of organics are elevated andnear the location of wastes of the combine thatare located in the northern part of the catch-ment area. Here, high mercury contents in manyprecipitation depths are a consequence of tech-nogenic pollution. Precipitation of the southernpart of the water area are located in a soil areawith a high content of carbonates. In additionto Ca, the Mn contents are increased inthem; Mn compounds have high sorption capac-
ities. Substantial amounts of Mn were also de-tected in meadow-marsh sediments of the coast-al zone. Thus, mercury enrichment of bottomdeposits is related to their capacity to accumu-late this element from both natural, and tech-nogenic sources.
The primary natural source of mercury ismainly aluminosilicate rocks. Solubility of alu-minium hydroxide compounds is low duringweathering, especially under weakly acidic andweakly basic conditions typical for this region.Consequently, aluminosilicate components main-ly preserve initial aluminium contents, which isalso testified by its insignificant migration intoan aqueous phase: aluminium content in waterof the lake is 0.12�0.25 mg/L. This allows iso-lating its entrance in soils and bottom depositsfrom natural and technogenic sources by an alu-minium normalization of mercury contents (seeTables 1 and 2). Comparison demonstrates thatsoils generally differ much from bottom sedi-ments by this indicator. The average value ofthe Hg/Al ratio in soils is 0.008 ⋅ 10�6, and inbottom sediments, it varies greatly from wellto well, depending on their location and depthof core recovery: from 0.004 ⋅ 10�6 in the coastalpart to (0.038�0.058) ⋅ 10�6 in other parts of thewater area. This is also confirmed by values forgranulometric fractions. Thus, values of Hg/Alratios in bottom sediments in many cases areseveral times higher the ratios in soils. Here-with, mercury can be found both in mineraland organic forms. This is confirmed by the re-sults of calculations for bottom sediments ofmany lakes of Altai Territory and the Novosi-birsk Region: the average value of the Hg/Alratio in bottom sediments of the terrigenouscomposition is 0.005 ⋅ 10�6, and in sediments witha larger content of organics and a lower con-tent of Al, including in sapropels � 0.080 ⋅ 10�6 [12].Here, mercury from the natural and remotenatural and anthropogenic sources is present.The correspondence of the Hg/Al ratio in soilsof the catchment area of Bol�shoye YarovoyeLake to the ratio in terrigenous precipitation oflakes confirms that mercury contents in themare close to background. It is obvious that as awhole, the effect of the technogenic componentin soils due to atmospheric mercury transfer isquite insignificant. Pollution was detected inseveral samples in immediate proximity to the

CORRELATIONS BETWEEN MERCURY IN SOILS AND BOTTOM DEPOSITS OF BOL�SHOYE YAROVOYE LAKE 195
location of combine wastes (taken from the up-per soil horizon and not included in sampling).
The factor analysis results for >0.25 and0.25�0.16 mm fractions of soils demonstratedthe following: the major part of elements exceptfor the carbonate group (Ñà, Mg, Sr) is connect-ed to each other by positive correlations, whichtestifies their entrance mainly to the detrital com-ponent of soil. Thus, one can conclude that mer-cury in these fractions does not enter into it andis probably present mainly as free form Hg0.
Mercury in 0.16�0.02 mm and <0.02 mmfractions has positive correlations with manyelements. Thus, this is polymetal group (Cd, Zn,Cu, Pb), iron group (Fe, Ni, V, Mn, Co) and par-tially feldspathic group (Al, K, Ba, Be). Mercu-ry, like many other elements, has negative cor-relations with Ca, which is part of the carbon-ate group. Thus, mercury in this fraction is apart of the general system of correlations of analuminosilicate matrix. The number of positivecorrelations in mercury in <0.02 mm fractionsdecreases. From polymetal group, positive cor-relations with Cu and Pb are preserved, fromthe second group � with V and Mn, from third �with Al, Na, Be. Mercury has negative correla-tions with Ñà and Sr entering into the carbon-ate group. This result can be interpreted as tran-sition of the bulk of mercury from bonds of themineral part of soil to its organic componentand magnesium isolations. The negative effectof carbonate formation is displayed.
Factor analysis results for fractions givecause to assess mercury behaviour in joint sed-imentation process, Mercury in >0.25 mm frac-tion does not have direct positive correlationswith elements of the aluminosilicate part of pre-cipitation and is connected with it through onlypositive correlations with Mn and Co, forminggroup Hg, Ca, Co, Mn. One can assume this ismainly the detrital carbonate fraction withmanganese crusts. Like most elements, mercu-ry has negative correlations with Na, which tes-tifies the effect of the salinity ofprecipitation. Mercury in 0.25�0.16 mm fractionhas only one positive correlation with Sb thatis connected, in its turn, with the greater partof elements of the aluminosilicate component.The carbonate group is stood apart due to pos-itive correlations of Ca with Mg, Sr and Li.
Most elements in 0.16�0.02 mm granulomet-ric fraction are positively connected, formingthe main composition of the clastic part of pre-cipitation. Mercury and antimony like and inthe previous case having positive correlationsare not directly a part of it. Mercury joins to itas a result of positive correlations with Be andNi. As a result, by connection with one anoth-er, a group of elements is formed: Hg, Cd, Zn,Be, Ni, Sb, Mn, Al, Cr. Most of them are con-nected with the detrital component, which thecarbonate group (Ca, Sr, Mg) is stood apart from.
The granulometric fraction >0.02 mm is gen-erally characterized by a significant decrease inoverall positive correlations among all elementsand an increase in the number of negative. Thereare particular positive correlations with manyothers in a series of elements with positive cor-relations (Fe, Ni, V, Al, Be), among them, corre-lations with Hg, Co, Ba are typical for Ni. Re-sulting from such correlations, group Hg, Cd, Ni,Sb, Mn, Co, Ba is formed, where mercury is di-rectly connected with Sb, Cd, Ni, and Cd � withHg, Mn and Sb. Another series of elements pre-sented by Li, Mg, Sr, Na, to which Ca is adja-cent due to positive correlations with Sr and Na,is completely separated from the first series bynegative correlations. These elements have gen-eral migration ways in the lake system.
Thus, there are differences in correlationsof mercury in soils and bottom deposits. Thereare no correlations in mercury in large fractions.There are positive correlations of mercury withMn and Co in bottom sediments for >0.25 mmfraction, which makes it necessary to considerthe part of manganese isolations in concentrat-ing of Hg and Ñî. Positive correlations of mer-cury and Sb in 0.25�0.16 mm fraction and itsindirect connection with the aluminosilicate com-ponent are of importance. Correlations with Sbin soils for mercury are not observed at all, andthey are preserved in bottom sediments and in0.16�0.02 and <0.02 mm fractions. Mercury in0.16�0.02 and <0.02 mm fractions in bottom de-posits has only indirect correlations with the clas-tic component, and directly enters into it in soils.Positive correlations of mercury in fractions ofbottom sediments <0.02 mm are reduced due tothe carbonate group and Na completely sepa-rated by negative correlations.
196 I. N. MALIKOVA and V. D. STRAKHOVENKO
TABLE 3
Correlation coefficients for mercury in soils and bottom sediments
Elements Soils Bottom sediments
Initial Granulometric fractions, mm Initial Granulometric fractions, mm
>0.25 0.25�0.16 0.16�0.02 <0.02 >0.25 0.25�0.160.16�0.02 <0.02
Li �0.3 �0.2 0.0 0.1 �0.1 0.0 0.3 0.4 0.2 �0.2
Be 0.3 �0.1 0.0 0.7 0.5 0.1 0.2 �0.0 0.4 0.5
Na �0.2 0.1 �0.0 �0.0 0.5 0.2 �0.7 �0.3 �0.0 �0.5
Mg �0.3 �0.1 �0.0 �0.2 �0.3 0.1 0.3 0.3 �0.0 �0.2
Al 0.3 �0.1 0.2 0.6 0.5 0.1 0.4 0.6 0.4 0.2
Sb �0.3 0.1 0.0 0.3 0.3 0.4 0.1 0.7 0.7 0.6
K 0.4 0.0 0.1 0.6 0.4 0.1 0.2 0.2 0.3 �0.1
Ca �0.4 �0.0 �0.1 �0.5 �0.6 0.1 0.8 0.3 �0.1 �0.2
V 0.2 �0.2 0.2 0.6 0.6 0.0 0.4 0.4 0.3 0.2
Cr 0.2 �0.4 �0.6 0.2 0.1 0.0 0.4 0.5 0.4 �0.1
Mn 0.5 �0.1 0.3 0.6 0.5 0.4 0.6 0.1 0.5 0.4
Fe 0.3 �0.1 0.2 0.6 �0.1 0.0 0.4 0.4 0.3 0.0
Co 0.4 �0.1 0.1 0.5 0.4 0.0 0.7 0.5 0.4 0.3
Ni 0.5 �0.2 0.1 0.7 0.3 0.1 0.5 0.6 0.5 0.6
Cu 0.4 �0.1 0.2 0.7 0.7 0.1 0.5 0.5 0.3 �0.2
Zn 0.4 �0.2 0.3 0.7 0.4 0.0 0.4 0.5 0.4 0.5
Sr �0.4 �0.1 �0.0 �0.4 �0.5 0.1 0.3 0.1 �0.1 �0.2
Cd 0.5 �0.3 0.4 0.8 0.3 0.1 0.5 0.5 0.9 0.8
Ba 0.4 �0.1 �0.0 0.4 0.2 0.3 0.3 0.5 0.2 0.2
Hg 1.0 1.0 1.0 1.0 1.0 1.0 1.0 1.0 1.0 1.0
Pb 0.4 0.0 0.1 0.5 0.6 0.2 0.5 0.5 0.2 0.5
Th 0.5 0.0
U 0.1 0.1
n 59 21 63 17
Note. For design. see Table 1.
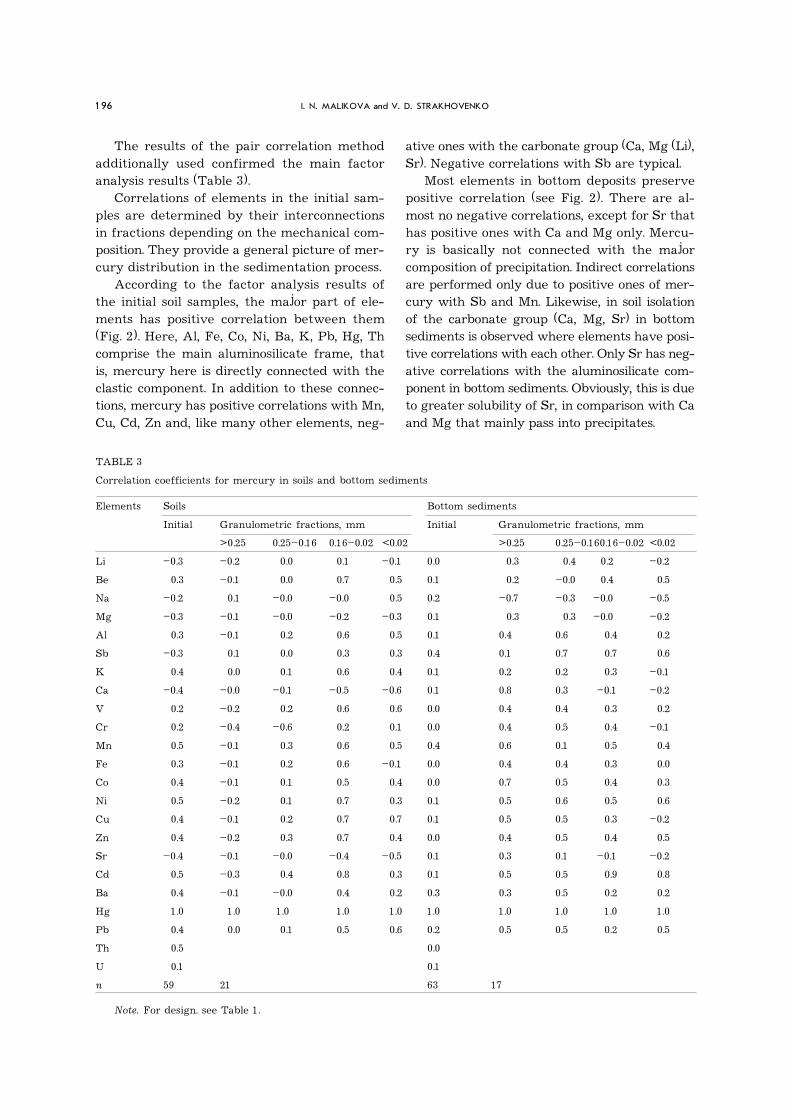
The results of the pair correlation methodadditionally used confirmed the main factoranalysis results (Table 3).
Correlations of elements in the initial sam-ples are determined by their interconnectionsin fractions depending on the mechanical com-position. They provide a general picture of mer-cury distribution in the sedimentation process.
According to the factor analysis results ofthe initial soil samples, the major part of ele-ments has positive correlation between them(Fig. 2). Here, Al, Fe, Co, Ni, Ba, K, Pb, Hg, Thcomprise the main aluminosilicate frame, thatis, mercury here is directly connected with theclastic component. In addition to these connec-tions, mercury has positive correlations with Mn,Cu, Cd, Zn and, like many other elements, neg-
ative ones with the carbonate group (Cà, Mg (Li),Sr). Negative correlations with Sb are typical.
Most elements in bottom deposits preservepositive correlation (see Fig. 2). There are al-most no negative correlations, except for Sr thathas positive ones with Ca and Mg only. Mercu-ry is basically not connected with the majorcomposition of precipitation. Indirect correlationsare performed only due to positive ones of mer-cury with Sb and Mn. Likewise, in soil isolationof the carbonate group (Cà, Mg, Sr) in bottomsediments is observed where elements have posi-tive correlations with each other. Only Sr has neg-ative correlations with the aluminosilicate com-ponent in bottom sediments. Obviously, this is dueto greater solubility of Sr, in comparison with Caand Mg that mainly pass into precipitates.

CORRELATIONS BETWEEN MERCURY IN SOILS AND BOTTOM DEPOSITS OF BOL�SHOYE YAROVOYE LAKE 197
Fig. 2. Dendrograms of R-type cluster analysis of contents of macro- and microelements in soil sectionsand columns of bottom sediments.
Fig. 3. Scheme of mercury correlations in soils (a) and bottom sediments (b).
Thus, differences in correlations of mercuryand other elements in granulometric fractionsled to significant differences of these correla-tions in precipitation from soils (Fig. 3). As shownby comparison the results on fractions and theinitial samples, 0.16�0.02 mm fraction in soilsand 0.16�0.02 and <0.02 mm fractions in bot-tom sediments exert the maximum effect fortotal mercury distribution.
It is noteworthy that contents of organicmatter in soils and bottom deposits were notconsidered in correlation analysis. Strictly speak-ing, the obtained results relate to the mineralpart only, and conclusions on the role of organ-ics are indirect. On average, its content in bot-tom sediments of the lake are about 6 %, ac-
cording to the results of losses determination.Earlier, according t the factor analysis resultsof over 100 lakes and soils of their catchmentareas of Siberia, positive correlations of mercu-ry and cadmium with losses during calcinationwere found [11].
The uneven distribution of mercury in bot-tom sediments at expense of its presence fromthe technogenic source reduces its correlationlevel with the content of other elements. Datain analyses with low mercury contents (at thedetection limits) are the second complicatingfactor, which is especially typical for soils. Thisis found according to the pair correlation data(see Table 2) and clear in appropriate graphs.A trend to the direct correlation of mercury with

198 I. N. MALIKOVA and V. D. STRAKHOVENKO
other elements is most clearly expressed in arange of its contents of 0.03�0.100 mg/kg. Theabsence of correlations in the region of increasedcontents or its second branch testifies a changein deportment form, including the entrance ofmercury from technogenic sources. Thus, thestudy of correlations of mercury detected a se-ries of important peculiarities in the sedimen-tation process.
CONCLUSION
1. Comparison of average mercury contentsin soils of the catchment area and bottom sedi-ments of Bol�shoye Yarovoye Lake demonstratesa significant increase of the mercury content inprecipitation relatively to all types of soils. Val-ues of the Hg/Al ratio that allows assessing thecontribution of the aluminosilicate componentin the total mercury content confirm this.
2. Factor analysis and the pair correlationmethod identified differences in mercury cor-relations between soils and bottom deposits infractions and the initial samples. Mercury in soilsis connected with the clastic part: with alumi-nosilicates and a group of polymetals (Cd, Cu,Zn); negative correlations with a group of Li,Ca, Mg, Sr and Sb. Mercury in bottom sedi-ments has positive correlations with Sb and Mnonly and relates to the main matrix indirectly.This testifies a change in mercury deportmentduring sludge formation, which is mainly causedby the entrance of mercury from a source notconnected with the terrigenous material of soils.
3. The study results of correlations in bot-tom sediments confirm the availability of localtechnogenic mercury pollution that is accom-panied by antimony. Its effect in soils is insig-nificant. Correlation analysis methods can alsobe used when studying other lake systems.
REFERENCES
1 Temerev S. V., Galakhov V. P., Eyrikh A. N., Serykh T. G.,Chem. Sust. Dev., 10, 4 (2002) 483.
URL: http: //www.sibran.ru/en/journals/KHuR2 Shcherbov B. L., Strakhovenko V. D., Malikova I. N.,
Geol. Geofiz., 44, 10 (2003) 1024.3 Leonova G. A., Bobrov V. A., Bogush A. A., Bychinskiy
V. A., Anoshin G. N., Geochim., 100 (2007) 1114.4 Malikova I. N., Ustinov M. T., Anoshin G. N., Badmaeva
Zh. O., Malikov Yu. I., Geol. Geofiz., 49, 1 (2008) 59.5 Malikova I. N., Strakhovenko V. D., Malikova I. N.,
Strakhovenko V. D., Malikov Yu. I., Badmaeva Zh. O.,VI Mezhdunar. Konf. �Tyazhelye Metally i Radionuklidyv Okruzhayushchey Srede� (Proceedings). Semey,Semipalatinsk, 2010, vol. 2, pp. 123�128.
6 Nikol�skaya Yu. P., Protsessy Soleobrazovaniya vOzerakh i Vodakh Kukundinskoy Stepi, Izd-vo SO ANSSSR, Novosibirsk, 1961.
7 Dolmatova L. A., Mir Nauki, Kul�tury, Obrazovaniya, 6(25) (2010) 272.
8 Gerasimov I. P., Glazovskaya M. A., OsnovyPochvovedeniya i Geografiya Pochv, Izd-vo Geograf. Lit-ry, 1960.
9 Malikova I. N., Strakhovenko V. D., Vosel� Yu. S., ChupinaD. Yu., Malikova I. N., Strakhovenko V. D., Vseros.Soveshch. �Sovremennye Problemy Geokhimii�(Proceedings), Izd. In-ta Geogr. SO RAN, Irkutsk, 2012,vol. 1, pp. 179�183.
10 Anoshin G. N., Malikova I. N., Kovalev S. I., Androsova N. V.,Tsibulchik V. M., Sukhorukov F. V., Shcherbov B. L.,Khim. Ust. Razv., 3, 1�2 (1995) 63.
11 Strakhovenko V. D., Malikova I. N., Shcherbov B. L.,Chem. Sust. Dev., 20, 1 (2012) 117.
URL: http://www.sibran.ru/en/journals/KhUR12 Strakhovenko V. D., Taran O. P., Ermolaeva N. I., Geol.
Geofiz., 55. 10 (2014) 1466.