correlations co photorelease and some spectroscopic and ... · mariete b. moreiraa, camila fontes...
TRANSCRIPT

Supplementary Material for
Revisiting oxo-centered carbonyl-triruthenium clusters: investigating
CO photorelease and some spectroscopic and electrochemical
correlations
Mariete B. Moreiraa, Camila Fontes Neves da Silvaa, Rafaela B. P. Pescib, Victor M.
Deflonb and Sofia Nikolaoua*
aDepartamento de Química, Faculdade de Filosofia, Ciências e Letras de Ribeirão
Preto, Universidade de São Paulo, Av. Bandeirantes 3900, 14040-901, Ribeirão Preto-
SP, Brazil, Phone: 55 11 33153748. [email protected]
bInstituto de Química de São Carlos, Departamento de Química e Física Molecular –
Universidade de São Paulo, Av. do Trabalhador São Carlense 400, Centro ZIP- CODE
13560-970, São Carlos-SP, Brazil.
Electronic Supplementary Material (ESI) for Dalton Transactions.This journal is © The Royal Society of Chemistry 2016

Table S1. Crystallographic and refinement data for [Ru3O(CH3COO)6(dmpz)2(CO)]H2O (1H2O), [Ru3O(CH3COO)6(dmap)2(CO)]C2H4Cl2 (7 C2H4Cl2), and [Ru3O(CH3COO)6(4-ampy)2(CO)] (8).
*Supplementary crystallographic data can be obtained free of charge from The Cambridge Crystallographic Data Centre via www.ccdc.cam.ac.uk/structures.
Compound 1H2O 7 C2H4Cl2 8
Empirical formula C25H36N4O15Ru3 C29H42Cl2N4O14Ru3 C23H30N4O14Ru3
Formula weight 935.79 1044.77 889.72Temperature (K) 296(2) 296(2) 296(2)Wavelength (Å) 0.71073 0.71073 0.71073Crystal system Monoclinic Monoclinic OrthorhombicSpace group C2/c P21/n Pnma
Unit cell dimensions
a (Å) = 20.3927(15)b (Å) = 11.1794(8)c (Å) = 17.9721(13)
α (°) = 90°β (°) = 119.214(2)°
γ (°) = 90°
a (Å) = 13.3193(4)b (Å) = 22.2592(8)c (Å) = 14.4161(5)
α (°) = 90ºβ (°) = 111.062(1)°
γ (°) = 90º
a (Å) = 19.2404(4)b (Å) = 19.8237(4)c (Å) = 8.2389(2)
α (°) = 90°β (°) = 90°γ (°) = 90°
Z 4 4 4Density (mg/m3) 1.738 1.740 1.881
Absorption coefficient (mm-1)
1.319 1.321 1.494
F(000) 1864 2088 1760
Crystal size (mm3) 0.300 x 0.100 x 0.070 0.610 x 0.040 x 0.010 0.140 x 0.060 x 0.030Theta range for data
collection (º) 2.151 to 25.249° 1.769 to 26.404° 2.055 to 25.089°
Index ranges -23→h→24, -13→k→13,-21→l→21
-16→h→16, -27→k→27,-18→l→ 17
-16→h→22, -20→k→23,-9→l→5
Reflections collected 18964 72486 17509
Independent reflections 3238 [R(int) = 0.0281] 8157 [R(int) = 0.0879] 2884 [R(int) = 0.0393]
Absorption correction Semi-empirical from equivalentes
Semi-empirical from equivalents
Semi-empirical from equivalents
Tmax/Tmin 0.7454/0.6173 0.7454/0.6950 0.7452/0.6797
Data / restraints / parameters
3238 / 0 / 223 8157 / 0 / 479 2221 / 4 / 227
Goodness-of-fit on F2 1.201 1.020 1.009
Final R indices [I>2σ(I)]
R1 = 0.0446, wR2 = 0.0957 R1 = 0.0428, wR2 = 0.0952 R1 = 0.0275, wR2 = 0.0553
Deposition number* CCDC 1482393 CCDC 1482394 CCDC 1482395

Figure S1. ORTEP plot of complexes [Ru3O(CH3COO)6CO(L)2] where (top) L = 2,6-dimethylpyrazine (dmpz) (complex 1), (middle) L = 4-(dimethyl)aminopyridine (dmap) (complex 7), and (bottom) L = 4-aminopyridine (ampy) (complex 8)

Figure S2.1H NMR spectrum of the complex [Ru3O(CH3COO)6(CO)(dmap)2] in CD3CN at 298 K.
Figure S3. COSY spectrum of the complex [Ru3O(CH3COO)6(CO)(dmap)2] in CD3CN at 298 K.

Figure S4.1H NMR spectrum of the complex [Ru3O(CH3COO)6(CO)(adpy)2] in CD3CN at 298 K.
Figure S5. COSY spectrum of the complex [Ru3O(CH3COO)6(CO)(adpy)2] in CD3CN at 298 K.

Figure S6.1H NMR spectrum of the complex [Ru3O(CH3COO)6(CO)(ampy)2] in CD3CN at 298 K.
Figure S7. COSY spectrum of the complex [Ru3O(CH3COO)6(CO)(ampy)2] in CD3CN at 298 K.

Figure S8.1H NMR spectrum of the complex [Ru3O(CH3COO)6(CO)(dmpz)2] in CD3CN at 298 K.
Figure S9. COSY spectrum of the complex [Ru3O(CH3COO)6(CO)(dmpz)2] in CD3CN at 298 K.

Figure S10.1H NMR spectrum of the complex [Ru3O(CH3COO)6(CO)(acpy)2] in CD3CN at 298 K.
Figure S11. COSY spectrum of the complex [Ru3O(CH3COO)6(CO)(acpy)2] in CD3CN at 298 K.
.

Figure S12.1H NMR spectrum of the complex [Ru3O(CH3COO)6(CO)(tbpy)2] in CD3CN at 298 K.
Figure S13. COSY spectrum of the complex [Ru3O(CH3COO)6(CO)(tbpy)2] in CD3CN at 298 K.

200 400 600 800 1000
0,0
0,5
1,0
1,5
2,0
Abs
orba
nce
Wavelenght (nm)
[Ru3O(CH3COO)6(CO)(4-ampy)2] [Ru3O(CH3COO)6(CO)(adpy)2] [Ru3O(CH3COO)6(CO)(dmap)2] [Ru3O(CH3COO)6(CO)(dmpz)2] [Ru3O(CH3COO)6(CO)(acpy)2] [Ru3O(CH3COO)6(CO)(tbpy)2]
Figure S14. Electronic spectra of compounds of the complexes 1-3 and 6-8 in acetonitrile solutions.
4000 3500 3000 2500 2000 1500 1000 500
20
40
60
80
100
(%) T
rans
mita
nce
Wavenumber (cm-1)
Figure S15. FT-IR spectrum of the complex [Ru3O(CH3COO)6(CO)(dmap)2], collected from KBr pellets.

4000 3500 3000 2500 2000 1500 1000 500
40
60
80
100(%
) Tra
nsm
itanc
e
Wavenumber (cm-1)
Figure S16. FT-IR spectrum of the complex [Ru3O(CH3COO)6(CO)(adpy)2], collected from KBr pellets.
4000 3500 3000 2500 2000 1500 1000 5000
10
20
30
40
50
60
70
80
90
(%) T
rans
mita
nce
Wavenumber (cm-1)
Figure S17. FT-IR spectrum of the complex [Ru3O(CH3COO)6(CO)(ampy)2], collected from KBr pellets.

4000 3500 3000 2500 2000 1500 1000 500
40
60
80
100(%
) Tra
nsm
itanc
e
Wavenumber (cm-1)
Figure S18. FT-IR spectrum of the complex [Ru3O(CH3COO)6(CO)(dmpz)2], collected from KBr pellets.
4000 3500 3000 2500 2000 1500 1000 500
0
20
40
60
80
100
120
(%) T
rans
mita
nce
Wavenumber (cm-1)
Figure S19. FT-IR spectrum of the complex [Ru3O(CH3COO)6(CO)(4-acpy)2], collected from KBr pellets.
4000 3500 3000 2500 2000 1500 1000 5000
20
40
60
80
100
(%) T
rans
mita
nce
Wavenumber (cm-1)
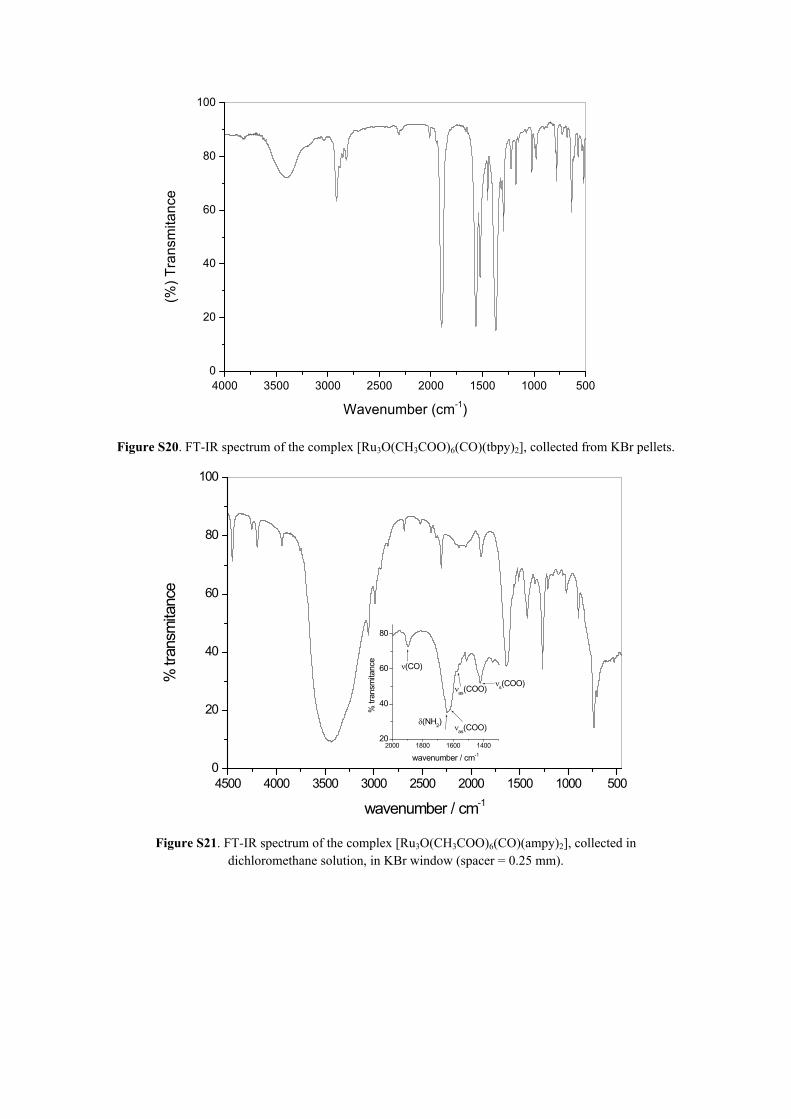
Figure S20. FT-IR spectrum of the complex [Ru3O(CH3COO)6(CO)(tbpy)2], collected from KBr pellets.
4500 4000 3500 3000 2500 2000 1500 1000 5000
20
40
60
80
100
2000 1800 1600 140020
40
60
80
s(COO)as(COO)
as(COO)(NH2)
(CO)
% tr
ansm
itanc
e
wavenumber / cm-1
% tr
ansm
itanc
e
wavenumber / cm-1
Figure S21. FT-IR spectrum of the complex [Ru3O(CH3COO)6(CO)(ampy)2], collected in dichloromethane solution, in KBr window (spacer = 0.25 mm).

Table S2: Tentative assignment of the more relevant peaks observed in the infrared spectra, obtained from KBr pellets.
compound peak
(cm-1)
assignment
1947s ⱱ(CO)1684s ⱱ(C=O) adpy1603s ⱱas(COO) Ac 1566s ⱱas(COO) Ac1421s ⱱs(COO) Ac1347w δ(CH3) Ac1218w δ(CH) py1064w ⱱ(ring)py1029w δ(CH) Ac769w (NH) adpy687m δ(OCO)
[Ru3O(CH3COO)6(CO)(adpy)2]
624m (COO) Ac3377m ⱱ(NH2) ampy1920s ⱱ(CO)1639s δ(NH2) ampy1617s ⱱas(COO) Ac1575s ⱱas(COO) Ac1420s ⱱs(COO) Ac1347 δ(CH3) Ac
1215m δ(CH) py1060w ⱱ(ring) py1024s δ(CH) Ac687w δ(OCO)
[Ru3O(CH3COO)6(CO)(ampy)2]
622w (COO) Ac1927s ⱱ(CO)
1611s ⱱas(COO) Ac1579s ⱱas(COO) Ac1423s ⱱs(COO) Ac1346sh δ(CH3) Ac1227s δ(CH) py1067m δ(CH) py1022s δ(CH) Ac688w δ(OCO) Ac
[Ru3O(CH3COO)6(CO)(dmap)2]
624w (COO) Ac1945s ⱱ(CO)1609s ⱱas(COO) Ac1569s ⱱas(COO) Ac1420s ⱱs(COO) Ac1348w δ(CH3)Ac1253w δ(ring in plane) dmpz1032w δ(CH) Ac772w δ(CH) dmpz732w δ(ring) dmpz688m δ(OCO)
[Ru3O(CH3COO)6(dmpz)2(CO)]
625m (COO)Ac[Ru3O(CH3COO)6(CO)(4-acpy)2(CO)] 1940s ⱱ(CO)
1608s ⱱas(COO) Ac
1569s ⱱas(COO) Ac

1420s ⱱs(COO) Ac
1347w δ(CH3) Ac
1361w δ(CH) py
1058w ⱱ(ring py)
1024w δ(CH) Ac
683m δ(OCO)
623m (COO)Ac
1271s ⱱ(CH3) 4-acpy
1361s δs(CH3) 4-acpy
1694s ⱱ(C=O) 4-acpy
[Ru3O(CH3COO)6(4-tbpy)2(CO)] 1948s ⱱ(CO)
1613s ⱱas(COO) Ac
1574s ⱱas(COO) Ac
1421s ⱱs COO) Ac
1346w δ(CH3) Ac
1273w δ(CH) py
1071w ⱱ(ring) py
1030w δ(CH) Ac
686m δ(OCO)
623m (COO)Ac
2963s δs(CH3) 4-tbpy
2869s- ⱱ (CH3) 4-tbpy
ⱱ = stretching; δ = bending; : rocking; s = symmetrical; as = assimetrycal; s = strong; m = médium; w = weak; sh = shoulder.
-1.5 -1.0 -0.5 0.0 0.5 1.0 1.5 2.0 2.5
-50
0
50
100
150
200
[Ru3O]0/+1[Ru3O]+1/+2
[Ru3O]-1/0
I /
E /V vs. Ag/AgCl
Figure S22. Cyclic voltammogram of compound [Ru3O(CH3COO)6(CO)(dmap)2] in 0,1 mol dm-3
acetonitrile solution TBAPF6. Scan rate 100 mV s-1.

-1.0 -0.5 0.0 0.5 1.0 1.5 2.0-15
-10
-5
0
5
10
15 [Ru3O]+1/+2
[Ru3O]0/+1
[Ru3O]-1/0
I /A
E /V vs. Ag/AgCl
Figure S23. Cyclic voltammogram of compound [Ru3O(CH3COO)6(CO)(adpy)2] in 0,1 mol dm-3
acetonitrile solution TBAPF6. Scan rate 100 mV s-1.
-1.0 -0.5 0.0 0.5 1.0 1.5 2.0
-10
-5
0
5
10 [Ru3O]+1/+2
[Ru3O]0/+1
[Ru3O]-1/0
I /A
E /V vs. Ag/AgCl
Figure S24. Cyclic voltammogram of compound [Ru3O(CH3COO)6(CO)(dmpz)2] in 0,1 mol dm-3
acetonitrile solution TBAPF6. Scan rate 100 mV s-1.
-2,0 -1,5 -1,0 -0,5 0,0 0,5 1,0 1,5 2,0-30
-20
-10
0
10
20
[Ru3O]-2/-1
[Ru3O]+1/+2
[Ru3O]0/+1
I/A
E/V vs. Ag/AgCl
[Ru3O]-1/0
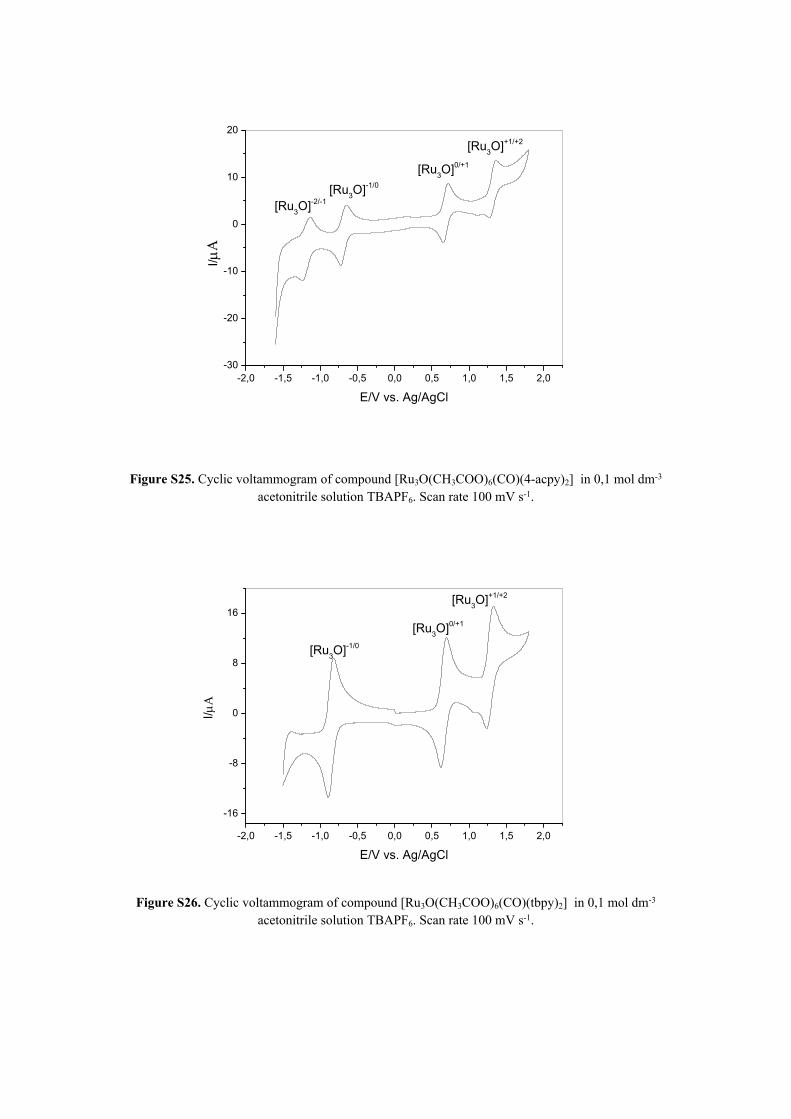
Figure S25. Cyclic voltammogram of compound [Ru3O(CH3COO)6(CO)(4-acpy)2] in 0,1 mol dm-3 acetonitrile solution TBAPF6. Scan rate 100 mV s-1.
-2,0 -1,5 -1,0 -0,5 0,0 0,5 1,0 1,5 2,0
-16
-8
0
8
16[Ru3O]+1/+2
[Ru3O]0/+1
I/A
E/V vs. Ag/AgCl
[Ru3O]-1/0
Figure S26. Cyclic voltammogram of compound [Ru3O(CH3COO)6(CO)(tbpy)2] in 0,1 mol dm-3 acetonitrile solution TBAPF6. Scan rate 100 mV s-1.

400 500 600 700 800 900 1000 11000.0
0.1
0.2
0.3
0.4
0.5Ab
sorb
ance
Wavelength (nm)
Figure S27. Absorption spectra of complex [Ru3O(CH3COO)6(CO)(dmap)2] during photolysis at exc =
377 nm, collected every 5 minutes from acetonitrile solutions (total time of irradiation = 80 minutes)
300 400 500 600 700 800 900 1000 11000.0
0.2
0.4
0.6
0.8
1.0
Abso
rban
ce
Wavelenght (nm)
Figure S28. Absorption spectra of complex [Ru3O(CH3COO)6(CO)(adpy)2]during photolysis at exc = 377
nm, collected every 5 minutes from acetonitrile solutions (total time of irradiation = 80 minutes)

300 400 500 600 700 800 900 1000 11000.0
0.2
0.4
0.6
0.8
1.0
Abso
rban
ce
Wavelenght (nm)
Figure S29. Absorption spectra of complex [Ru3O(CH3COO)6(CO)(ampy)2] during photolysis at exc =
377 nm, collected every 5 minutes from acetonitrile solutions (total time of irradiation = 80 minutes)
400 600 800 10000,0
0,2
Abso
rban
ce
Wavelenght (nm)
Figure S30. Absorption spectra of complex [Ru3O(CH3COO)6(CO)(4-acpy)2] during photolysis at exc =
377 nm, collected every 5 minutes from acetonitrile solutions (total time of irradiation = 80 minutes)

300 400 500 600 700 800 900 1000 11000,0
0,5Ab
sorb
ance
Wavelenght (nm)
Figure S31. Absorption spectra of complex [Ru3O(CH3COO)6(CO)(tbpy)2] during photolysis at exc = 377 nm, collected every 5 minutes from acetonitrile solutions (total time of irradiation = 80 minutes)