correspondence between fmri and electrophysiology … · we show that bold responses under an ......
TRANSCRIPT
Contents lists available at ScienceDirect
NeuroImage
journal homepage: www.elsevier.com/locate/neuroimage
Correspondence between fMRI and electrophysiology during visual motionprocessing in human MT+☆
Anna Gaglianesea,b, Mariska J. Vansteensela, Ben M. Harveyc, Serge O. Dumoulinc,d,Natalia Petridoub,⁎,1, Nick F. Ramseya,1
a Department of Neurosurgery and Neurology, Brain Center Rudolf Magnus, University Medical Center Utrecht, Utrecht, The Netherlandsb Department of Radiology, University Medical Center Utrecht, Utrecht, The Netherlandsc Experimental Psychology, Helmholtz Institute, Utrecht University, Utrecht, 3584 CS, The Netherlandsd Spinoza Center for Neuroimaging, Amsterdam, The Netherlands
A R T I C L E I N F O
Keywords:Electrocorticography (ECoG)Blood Oxygenation Level Dependent (BOLD)3 T fMRIhMT+Neurovascular couplingBrain
A B S T R A C T
Changes in brain neuronal activity are reflected by hemodynamic responses mapped through BloodOxygenation Level Dependent (BOLD) functional magnetic resonance imaging (fMRI), a primary tool tomeasure brain functioning non-invasively. However, the exact relationship between hemodynamics andneuronal function is still a matter of debate. Here, we combine 3 T BOLD fMRI and High Frequency Band(HFB) electrocorticography (ECoG) signals to investigate the relationship between neuronal activity andhemodynamic responses in the human Middle Temporal complex (hMT+), a higher order brain area involved invisual motion processing. We modulated the ECoG HFB and fMRI BOLD responses with a visual stimulusmoving at different temporal frequencies, and compared measured BOLD responses to estimated BOLDresponses that were predicted from the temporal profile of the HFB power change. We show that BOLDresponses under an electrode over hMT+ can be well predicted not only be the strength of the neuronal responsebut also by the temporal profile of the HFB responses recorded by this electrode. Our results point to a linearrelationship between BOLD and neuronal activity in hMT+, extending previous findings on primary cortex tohigher order cortex.
Introduction
Since its invention in the early 1990s (Ogawa et al., 1992, 1990),functional magnetic resonance imaging (fMRI) has become a promi-nent technique to functionally characterize the human brain. FMRIstudies are based on task-related or spontaneous changes in the blood-oxygenation-level-dependent (BOLD) signal that is mapped from thevenous vasculature. Because blood oxygenation levels and cerebralblood flow change rapidly following changes in the neuronal activity ina brain region (the hemodynamic response), fMRI allows to efficiently,although indirectly, measure brain function non-invasively in humans.It remains unclear, however, how exactly hemodynamics relate toneuronal function in the human brain, and this has become a centralissue for the neuroscience community. Invasive animal studies haveshown that fMRI signals are highly correlated with neuronal spikingactivity as well as with Local Field Potentials (LFPs), which aresuggested to reflect input and intracortical processing (Goense et al.,
2012; Logothetis et al., 2001; Niessing et al., 2005). Other animalstudies have shown, however, that BOLD responses are uncoupledfrom neuronal activity under certain experimental conditions (Huoet al., 2014; Norup and Lauritzen, 2001; Swettenham et al., 2013).Notably, the relationship observed in animals does not necessarilyreflect the characteristics of neurovascular coupling in humans, asobserved with fMRI, due to potential differences in cortical anatomy(e.g. cortical folding, Gagnon et al., 2015), vascular anatomy (e.g. vesselgeometry, size, and organization, Hirsch et al., 2012; Gagnon et al.,2015), and experimental conditions such as anesthesia (Liu et al.,2013; Pisaro et al., 2013) and task delivery. A limited number ofstudies have examined the relationship between fMRI and neuronalactivity in humans, predominantly using non-invasive electrophysiolo-gical modalities such electroencephalography (EEG) or magnetoence-phalography (MEG). These studies have shown that spatial maps offMRI BOLD activity in response to different types of sensory stimula-tion roughly correspond to EEG and MEG responses in the respective
http://dx.doi.org/10.1016/j.neuroimage.2017.04.007Received 23 November 2016; Received in revised form 7 March 2017; Accepted 3 April 2017
☆ The authors declare no competing financial interests.⁎ Correspondence to: Department of Radiology, UMC Utrecht, Heidelberglaan 100, P.O. Box 85500 HP E.01.132, 3584 CX Utrecht, The Netherlands.
1 Co-authorship.E-mail address: [email protected] (N. Petridou).
NeuroImage 155 (2017) 480–489
Available online 05 April 20171053-8119/ © 2017 Elsevier Inc. All rights reserved.
MARK
primary sensory cortices (Brookes et al., 2005; Im et al., 2007;Mukamel et al., 2005; Rosa et al., 2010; Singh et al., 2002).However, since the spatial resolution of EEG and MEG is lower thanthat of fMRI measurements, it is difficult to establish a one-to-onerelationship between neuronal and BOLD signals.
Intracranial electrocorticography (ECoG), has recently receivedincreasing attention due to its unique combination of high spatialand temporal resolution. ECoG allows direct measurement of electricalactivity in neuronal populations covering a few millimeters of graymatter, directly underneath the electrode. The spatial resolutionafforded is high, similar to that of fMRI measurements, whichfacilitates direct comparison between the two modalities in the samepatch of cortex. Although ECoG is typically acquired in epilepsypatients, studies have shown that measurements acquired from non-epileptic tissue yield results that are considered normal in terms ofexpected location and functional response to tasks (Jacobs et al., 2010).Furthermore, ECoG provides separable measurements of not onlyneural oscillatory activity but also of changes in high frequencybroadband (HFB) power, which is associated with spiking activity(Miller et al., 2009), with very high sensitivity, although high frequen-cies may also be detected with high density EEG (Onton and Makeig,2009). Combined ECoG-fMRI studies have recently provided evidenceof a direct spatial correlation of BOLD responses with HFB power(Mukamel et al., 2005; Hermes et al., 2012; Siero et al., 2013; Jacqueset al., 2016). However, several factors complicate the comparison ofBOLD responses and neuronal responses measured by ECoG. First,studies have tended to focus on spatial correlation. Spatial correlationalone does not allow for assessment of the exact relationship betweenthe measured fMRI signal and the underlying neuronal activity, leavingopen the question of linearity of this relationship in neurovascularcoupling. Second, BOLD responses are usually modeled followingexperimental design such as stimulus timing, rather than using thetemporal profile of neuronal responses. This may be a suboptimalapproach, as a recent combined 7 T fMRI-ECoG study showed that theexact neuronal responses can predict BOLD responses more accuratelythan a model based on stimulus timing, in the case of increasingfrequency of movement in motor cortex (Siero et al., 2013). Third, therelationship between fMRI activity and neurophysiological recordingshas predominantly been studied in primary sensory and motor cortices,while much of human brain consists of higher order regions of thecortex where stimuli cannot readily be controlled.
The present study was conceived to determine the linearity ofneurovascular coupling in higher order cortex. We focused on thehuman Middle Temporal complex (hMT+), a higher order brain areainvolved in visual motion processing (Amano et al., 2009; Dumoulinet al., 2000; Huk et al., 2002; Tootell et al., 1995). We modulated theECoG and fMRI BOLD responses by engaging subjects in a visual taskconsisting of a moving, high contrast, black and white dartboard, thecontrast of which was reversed at different temporal frequencies. Thistype of stimulus is known to elicit strong activity in hMT+ in bothmodalities (Gaglianese et al., 2015; Harvey et al., 2013; Kastner et al.,2003; Winawer et al., 2013) and to generate distinct and independentresponses in HFB power for each of the spatial and temporalfrequencies of the visual stimuli, as measured with ECoG (Gaglianeseet al., 2016). We used these HFB power changes to predict the relatedBOLD responses and compared the predicted responses with real,measured BOLD responses for the same task and the same subjectsusing 3 T fMRI. We show a close correspondence between thepredicted and measured hemodynamic response functions (HRF) andconclude that there is a linear relationship between the hemodynamicresponses in hMT+ and both the amplitude and the temporal profile ofthe underlying neuronal activity.
Materials and methods
Subjects (three males, one female) were epilepsy patients who
underwent implantation of subdural electrode grids to determine thesite of epileptic foci for the purpose of possible surgical removal of theepileptogenic tissue. Implanted grids extended to healthy tissue in thehMT+ area of the left (n=2) and right (n=2) hemisphere. Before thesubdural electrode implantation, subjects underwent an fMRI scan andwere presented with visual motion stimuli identical to the onesperformed during ECoG measurements, except that the presentationtiming was adjusted to match the timing of the hemodynamic (fMRI)responses. A high resolution (0.5×0.5×1 mm) 3D computed tomogra-phy (CT, Philips TomoscanSR7000) scan was acquired after implanta-tion to localize ECoG grid electrodes on each subject's brain. The studywas approved by the medical ethical board of the Utrecht UniversityMedical Center. All subjects gave their written informed consent toparticipate in the study in compliance with the Declaration of Helsinki2013.
fMRI
fMRI data were acquired on a Philips Achieva 3 T scanner using 3DPRESTO (Neggers et al., 2008; Ramsey et al., 1996; van Gelderen et al.,2012) and a commercial 8-channel head coil. For one subject, 40 sliceswere acquired with a field of view (FOV) of 224×256×160 mm,resulting in a voxel size of 4 mm isotropic. Functional volumes wereacquired every 608 ms with a flip angle of 10 degrees, echo time (TE) of33.2 ms, and repetition time (TR) of 22.5ms. For the other threesubjects the FOV was 99×256×182 mm for a total of 33 slicesencompassing the visual cortex and posterior temporal lobes, andvoxel size 3mm isotropic. Functional volumes were acquired every810 ms with flip angle of 10 degrees, TE of 38.7 ms and TR of 27 ms. Atthe beginning of each experimental session, whole-brain gradient-echoT1-weighted images were acquired at a resolution of 1 mm isotropic,for all subjects.
fMRI stimuliSubjects were presented with a visual stimulus that consisted of a
high-contrast black-and-white dartboard with a fundamental spatialfrequency of 0.33 cycle/deg. During the motion-on condition, visualmotion covering the entire display was shown for 1 s and the dartboardexpanded with a fundamental temporal frequency of 1, 3 or 5 Hz indifferent trials. Each temporal frequency was presented 27 times in asingle run, for a total of three runs. Outside of these motion periods, astationary black-and-white dartboard with spatial frequency of 0.33cycle/deg was presented. The interval between motion periods wasbased on equal distribution of inter-stimulus-intervals (ISI) rangingbetween 6 s and 15 s (2 trials per ISI, in 1 s increments), plus 6 trialswith 19 s and 24 s ISI (3 each). The order of ISIs was pseudo-randomized, and the same order was used for each run. Due to timingconstraints, two subjects were able to perform only two runs (1 and5 Hz condition respectively). Visual stimuli were back-projected on a24 in. display with 1920×1200 pixel resolution inside the MRI bore.Subjects viewed the display through a mirror with a total distance fromthe subject's eyes to the display screen of 90 cm. The scanner room waskept dark. To ensure subjects attended to the stimulus and maintainedaccurate fixation, subjects were instructed to perform a color changedetection task on the fixation dot in the middle of the display, where abutton press was required for every color change of the fixation dot.
fMRI analysisFor each subject, cortical surface estimation was computed by
automatically segmenting the T1-weighted anatomical scan usingFreeSurfer (http://surfer.nmr.mgh.harvard.edu). Gray mattervolumes were then rendered as a smoothed 3D cortical surface.
Functional data were pre-processed using AFNI (http://afni.nimh.nih.gov/afni, Cox 1996). All datasets underwent rigid-body motioncorrection, temporal linear detrending, and alignment of functionaland anatomical data. No spatial smoothing was applied.
A. Gaglianese et al. NeuroImage 155 (2017) 480–489
481
hMT+ localization. For each subject, the location of hMT+ wasidentified with multiple regression analysis. The fMRI runs wereconcatenated, and the analysis was performed by contrasting theresponses of moving (all temporal frequencies combined) versusstationary dartboards (using the 3dDeconvolve function in AFNI),obtained by convolution of the task with a standard hemodynamicresponse model (Boynton et al., 1996). The resulting activation mapwas used to identify the ECoG electrode on hMT+ (see ECoG-fMRI co-localization section). The 6 movement parameters derived from themotion correction (3 translation, 3 rotation) were included asregressors of no interest. Activation maps were visualized on eachsubject's rendered brain surface using the SUrface MApping (SUMA)software in AFNI.
hMT+ responses to different temporal frequencies. Data from eachfunctional scan consisted of 27 trials of a single temporal frequencycondition. The mean hemodynamic response function (HRF) for eachtemporal frequency (1, 3 or 5 Hz), that is, each motion stimuluscondition, was reconstructed for all voxels in the volume imagedusing a deconvolution approach (Dale, 1999). This method does notinfer any a priori model of the HRF response, except for the duration ofthe HRF, which was set to 25 s in accordance with previous studies(Costagli et al., 2014; Gaglianese et al., 2015; Gardner et al., 2005).This type of analysis also provides an r2 and significance value.Significantly activated voxels for each motion stimulus conditionwere based on statistics on the r2 values obtained by a bootstrappingprocedure using a permutation analysis method (Gardner et al., 2005).In short, the r2 values were recomputed 100 times for each voxel usinga randomized version of the stimulus timing presentation to obtain asingle distribution of r2 values representing the distribution expectedby chance. An r2 value at cut-off p-value=0.05 was compared to the r2
value of each voxel in order to detect significant voxels. The analysiswas performed using mrTool (http://gru.stanford.edu/doku.php/shared/home).
ECoG
Implanted grid electrodes had a measurement surface of 2.3 mmdiameter per electrode, with 1 cm inter-electrode spacing, and werepositioned directly on the cortical surface. A reference electrode waspositioned extra-cranially on the mastoid bone. The recording systemwas a 128 channel Micromed system (Treviso, Italy). Data wereacquired with a sampling rate of 512 Hz and band-pass filteredbetween 0.15–134.4 Hz.
ECoG StimuliDuring the ECoG experiment, subjects performed one run, in which
the same visual stimuli as used in the fMRI measurements werepresented. Because of the high temporal resolution of the ECoGrecordings, all temporal frequencies could be presented in a singlerun, with random inter-stimulus intervals ranging between 3 s and4.5 s. Each temporal frequency was shown 18 times. For one subject,temporal frequencies (1 Hz and 5 Hz) were presented in two differentruns. The visual stimulus properties and the room setup were adjustedto be identical to the ones used in the fMRI scans. Stimuli werepresented in a dark room using a Toshiba Tecra S10-101 laptop(Toshiba, Tokyo, Japan) and displayed on a 1024×768 pixel LCDscreen (Samsung Syncmaster 214 T, Seoul, Korea) positioned in frontof the patient at a distance of 75 cm from the eyes. Subjects performedthe same color change detection task as in the fMRI session.
ECoG analysisECoG signal quality was inspected by a neurologist and electrodes
with large epileptic artefacts, flat signal or excessive noise wererejected. The remaining electrodes were re-referenced to the commonaverage of all remaining electrodes. For each electrode and stimulusmotion condition, data were filtered in the HFB (65–95 Hz), alpha (8–14 Hz) and beta (15–25 Hz) bands using a third-order Butterworthfilter in two directions to minimize phase distortion (using the filtfiltfunction in MATLAB; MathWorks). Then, the smoothed log power ofthe analytic amplitude by Hilbert transform was calculated (Hermeset al., 2012). For each temporal frequency condition, motion stimulusrelated epochs were defined as the 1 s periods of motion presentation.Baseline epochs started 1 s after motion offset and lasted 1 s. Meanresponses across the 18 motion stimulus epochs for each temporalfrequency condition were computed for each frequency band and themean of the baseline epochs was subtracted. Finally, the responseswere converted to z-scores by dividing by the standard deviation of themean baseline epoch. In addition, only in the case of the HFB band, wesummarized responses across subjects and temporal frequencies byextracting the area under the corresponding HFB z-score responseprofile during the 1 s of motion plus 500ms to allow the power increaseto return to baseline.
The spectrogram for all temporal frequency conditions was alsocomputed using a multi-taper spectrum function and a moving windowwith time-width of 0.5 s and step size 50ms, as implemented inChronux (chronux.org).
ECoG-fMRI co-localization
Implanted electrodes were automatically localized on the post-operative high resolution CT scan using the 3Dclustering detectionfunction provided by AFNI (Branco et al., 2016). The CT was co-registered and re-sliced to the T1-weighted anatomical scan usingnormalized mutual information (Wells et al., 1996). After co-registra-tion, electrode coordinates were corrected for the brain shift caused bythe surgery (Hermes et al., 2010), then projected onto the nearestcortical surface point in the anatomical MRI. A single ECoG electrodeon hMT+ was identified for each subject, based on the proximity to thesignificant active voxels obtained by the fMRI activation map thatresulted from the multi regression fMRI analysis (p < 0.05). Thelocation of the identified electrode on hMT+ was confirmed anatomi-cally for each subject (the intersection of the junction between theascending limb of the inferior temporal sulcus and the sulcus itself(Dumoulin et al., 2000)). For data matching, fMRI voxels were selectedwithin a radius of 8mm from the center of mass of the selectedelectrode based on previous work (Hermes et al., 2012), provided theywere significant according to the deconvolution analysis, (r2-value P <0.05), and the time courses were averaged to a single fMRI measure.
ECoG-fMRI modeling
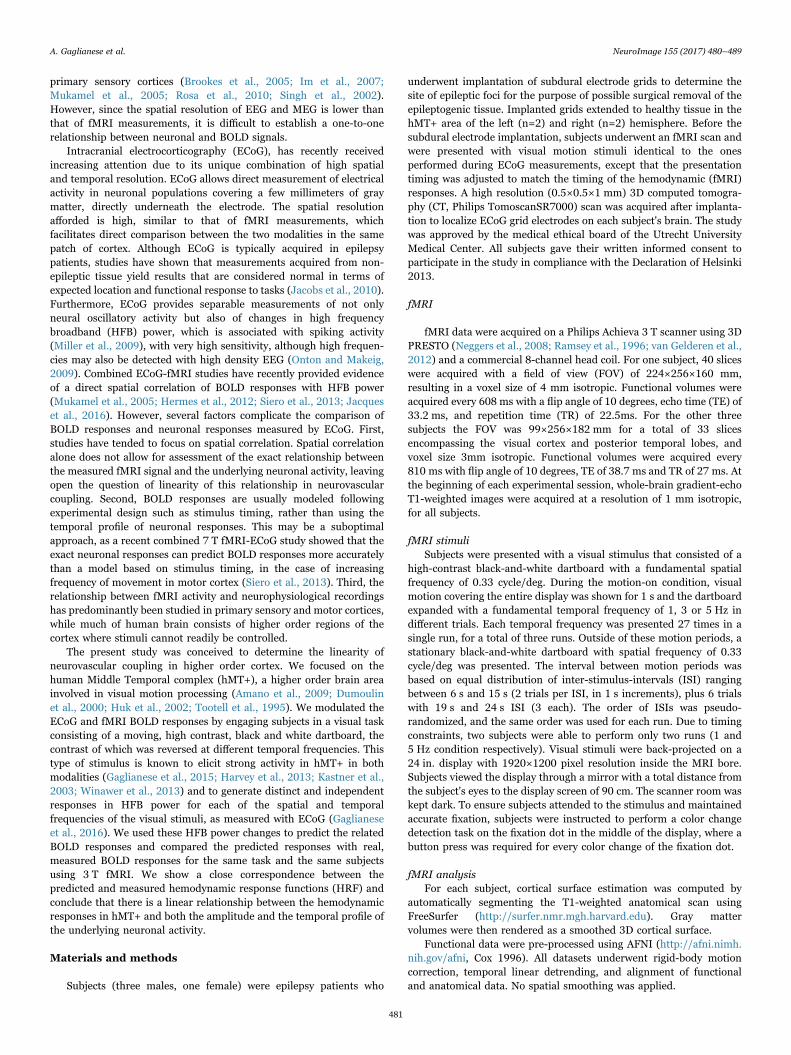
We modeled BOLD responses to each visual motion conditionbased on the temporal profile of the ECoG spectral responses (Fig. 1).ECoG-based BOLD responses were constructed as follows: First, z-scored spectral power changes in HFB were computed for eachelectrode and temporal frequency condition, as described in theECoG analysis section. Second, ECoG-based time-series were simulatedby multiplying the mean z-scored responses for each temporal fre-quency with a boxcar function with duration of 1.5 s and amplitude 1,interleaved by the inter stimulus trial interval used in the fMRIexperiment (Fig. 2A). The time resolution of the entire simulationwas set to 50 ms. Third, the derived ECoG-based time-series wereconvolved with a HRF based on a gamma function (Boynton et al.,1996), giving a prediction of the fMRI time-series. The simulated fMRItime-series were normalized to zero mean and unit variance and weresampled every TR step to match the timing of the signal acquisition bythe scanner (Fig. 2, B-C). The estimated ECoG-BOLDHFB was finallycomputed for each temporal frequency condition by deconvolution of
A. Gaglianese et al. NeuroImage 155 (2017) 480–489
482
each simulated ECoG-based fMRI time-series. The same procedure wasfollowed using ECoG responses in the alpha and beta band to estimateECoG-BOLDalpha and ECoG-BOLDbeta respectively.
Finally, the measured-BOLD responses for the three temporalfrequency conditions were computed for each resultant time-series bydeconvolution (see fMRI analysis section).
ECoG-BOLD vs measured-BOLD responses
To determine whether the estimated ECoG-BOLD responses pre-dicted the measured-BOLD, we first computed for each subject andeach temporal frequency condition the goodness of fit by the root meansquare error (RMS) between the predicted ECoG-BOLD and measured-BOLD response. We then quantified the response to each motionstimulus by extracting the amplitude and the area under the curve ofeach corresponding ECoG-BOLD and measured-BOLD response.Similarity across subjects and temporal frequency conditions wasquantified by correlating ECOG-BOLD and measured-BOLD ampli-tudes and areas under the curve across subjects and temporalfrequency conditions. To test whether alpha and beta frequency bandsexplained additional variance in the BOLD responses, independently ofHFB changes, we computed the partial correlation between themeasured-BOLD and estimated ECoG-BOLDHFB amplitudes and areas,controlling for ECoG-BOLDalpha and ECoG-BOLDbeta values.
Results
FMRI and ECoG activation in hMT+
During visual motion presentation, subjects consistently exhibitedpositive BOLD responses in the human MT complex (hMT+) and earlyvisual cortex (Fig. 3). Only the responses in hMT+ were used forfurther analysis.
The ECoG measurement from the electrode located on hMT+ ofeach subject exhibited a significant spectral power increase in the HFBband (p < 0.05, Bonferroni corrected) during visual motion presenta-tion. This spectral increase was within hMT+, as confirmed by thespatial overlap of the ECoG electrode and the fMRI activation foci(Fig. 3).
ECOG and fMRI responses to different temporal frequencies of thevisual stimuli
Fig. 4 shows the spectral power in frequencies across the 1–100 Hzrange, from stimulus onset (t(0)) to 1 second thereafter, for the threetemporal frequency conditions combined. Each temporal frequencyelicited significant ECoG HFB and BOLD responses in hMT+ (Fig. 5).Interestingly, ECoG (Fig. 5, left columns) and fMRI responses (Fig. 5,right columns) showed a similar pattern of amplitude responses to thedifferent temporal frequencies, per subject, although differences wereobserved between subjects. Moreover, the area under the HFB z-scoredresponses was significantly correlated with the maximum amplitudevalues of each corresponding measured BOLD response (r=0.74,p=0.015).
Linear correspondence between measured-BOLD and predictedECoG-BOLDHFB responses
In order to investigate the relationship between neurophysiologicalactivity and BOLD responses, we predicted the BOLD responses foreach motion stimulus condition based on ECoG spectral power changesin HFB, as well as in alpha and beta bands. Root mean square (RMS)between the two curves indicated a good match between measured andECoGHFB based BOLD responses (Fig. 6).
We summarized the pattern of responses across subjects andtemporal frequency conditions by computing the amplitudes and areasof each measured-BOLD and ECoG-BOLDHFB. ECoG-BOLDHFB ampli-tudes were found to be significantly correlated with measured-BOLDamplitudes (r = .85, p < 0.001, Fig. 7A). Positive correlations indicatethat a positive increase in HFB corresponds to a positive increase in
Fig. 1. ECoG-fMRI modeling and experimental protocol. We recorded neuronal and hemodynamic responses to visual motion stimuli using both ECoG (top left) and fMRI (bottom left)measurements from the hMT+ complex of each subject. The measured HRF (blue curve) was estimated by deconvolution of the fMRI BOLD time series (bottom row). It was compared tothe modeled ECoG HRF (red curve), which was obtained by convolving the ECoG spectral power changes in the high frequency band with a gamma function (top row).
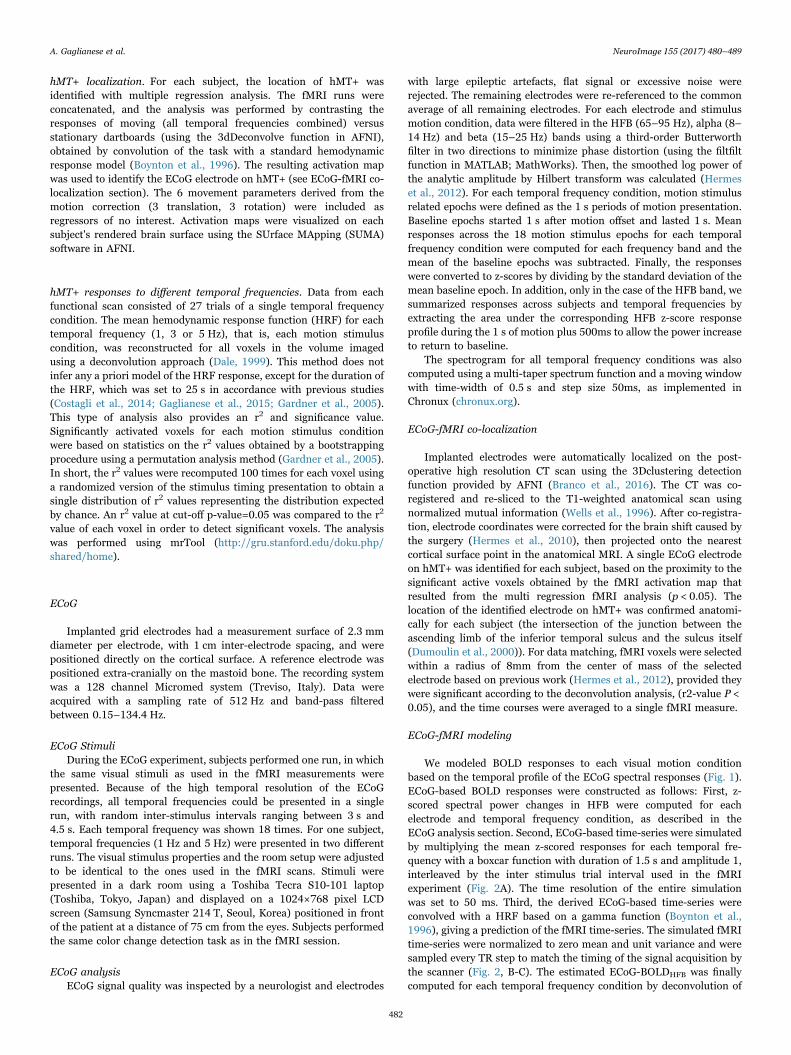
Fig. 2. ECoG HFB power spectral changes predict the BOLD fMRI time series with highaccuracy. A) HFB responses to repetitive presentation of the same 1 s visual motionstimulation. B) Estimated ECoG-fMRI time series computed by convolving the ECoGtime-series (A) with a standard gamma hemodynamic response function and resampledto the fMRI volume acquisition time. C) Measured fMRI time series (blue) to the samevisual motion stimulation of (A) superimposed by the fMRI time series predicted fromthe ECoG response shown in (B) (red). The fMRI time series predicted from the ECoGresponses is consistent with the measured fMRI time series.
A. Gaglianese et al. NeuroImage 155 (2017) 480–489
483
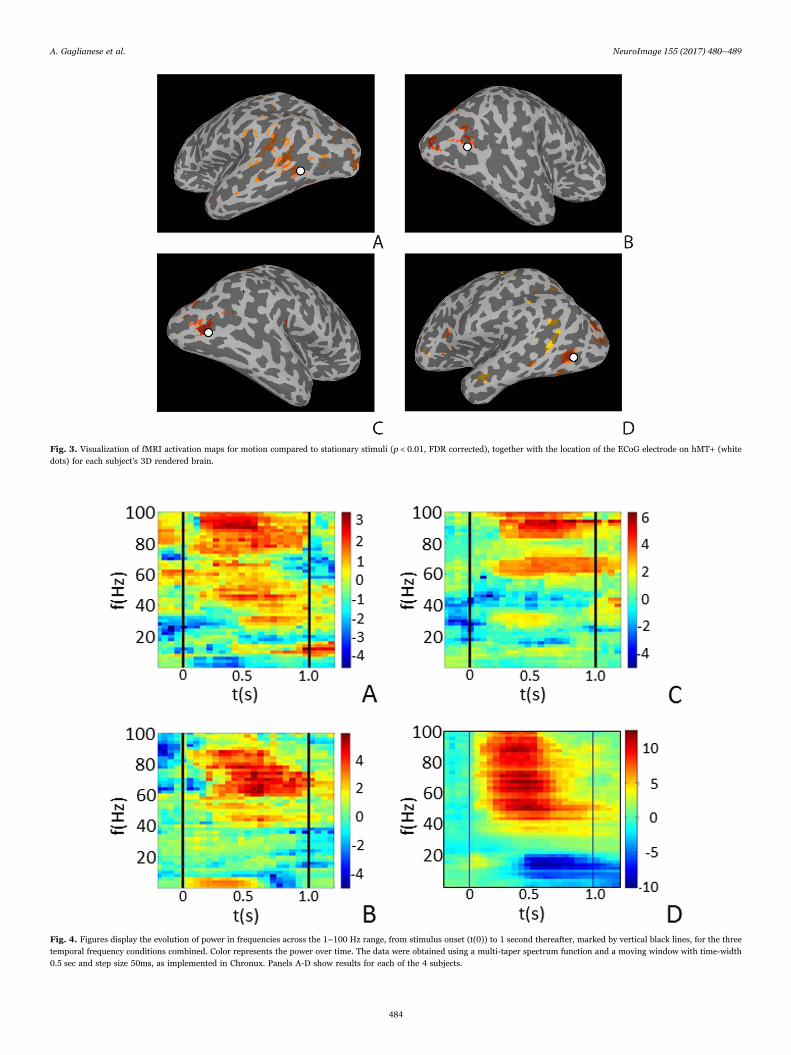
Fig. 3. Visualization of fMRI activation maps for motion compared to stationary stimuli (p < 0.01, FDR corrected), together with the location of the ECoG electrode on hMT+ (whitedots) for each subject's 3D rendered brain.
Fig. 4. Figures display the evolution of power in frequencies across the 1–100 Hz range, from stimulus onset (t(0)) to 1 second thereafter, marked by vertical black lines, for the threetemporal frequency conditions combined. Color represents the power over time. The data were obtained using a multi-taper spectrum function and a moving window with time-width0.5 sec and step size 50ms, as implemented in Chronux. Panels A-D show results for each of the 4 subjects.
A. Gaglianese et al. NeuroImage 155 (2017) 480–489
484
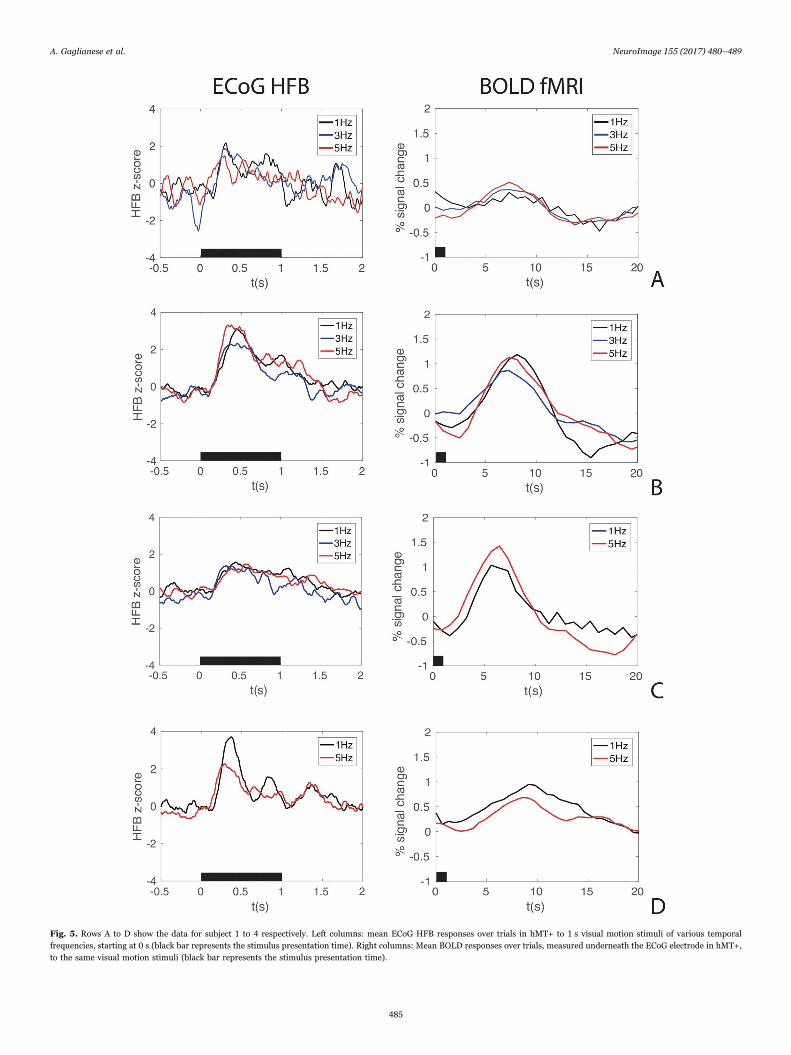
Fig. 5. Rows A to D show the data for subject 1 to 4 respectively. Left columns: mean ECoG HFB responses over trials in hMT+ to 1 s visual motion stimuli of various temporalfrequencies, starting at 0 s (black bar represents the stimulus presentation time). Right columns: Mean BOLD responses over trials, measured underneath the ECoG electrode in hMT+,to the same visual motion stimuli (black bar represents the stimulus presentation time).
A. Gaglianese et al. NeuroImage 155 (2017) 480–489
485
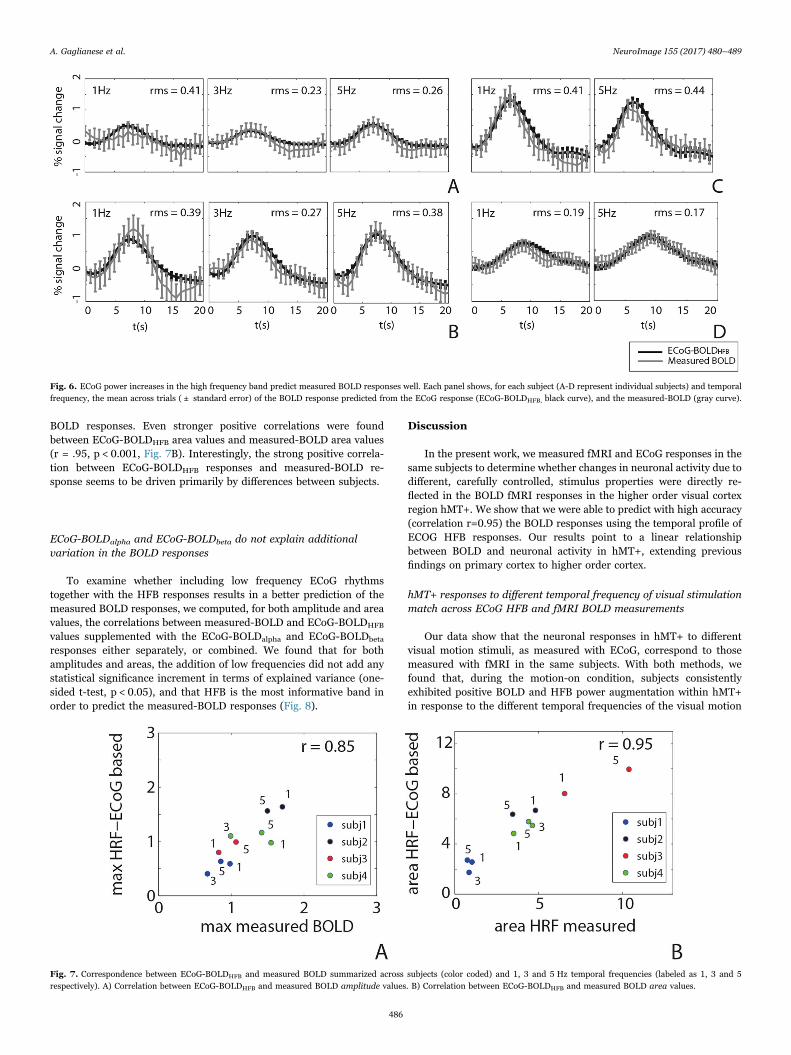
BOLD responses. Even stronger positive correlations were foundbetween ECoG-BOLDHFB area values and measured-BOLD area values(r = .95, p < 0.001, Fig. 7B). Interestingly, the strong positive correla-tion between ECoG-BOLDHFB responses and measured-BOLD re-sponse seems to be driven primarily by differences between subjects.
ECoG-BOLDalpha and ECoG-BOLDbeta do not explain additionalvariation in the BOLD responses
To examine whether including low frequency ECoG rhythmstogether with the HFB responses results in a better prediction of themeasured BOLD responses, we computed, for both amplitude and areavalues, the correlations between measured-BOLD and ECoG-BOLDHFB
values supplemented with the ECoG-BOLDalpha and ECoG-BOLDbeta
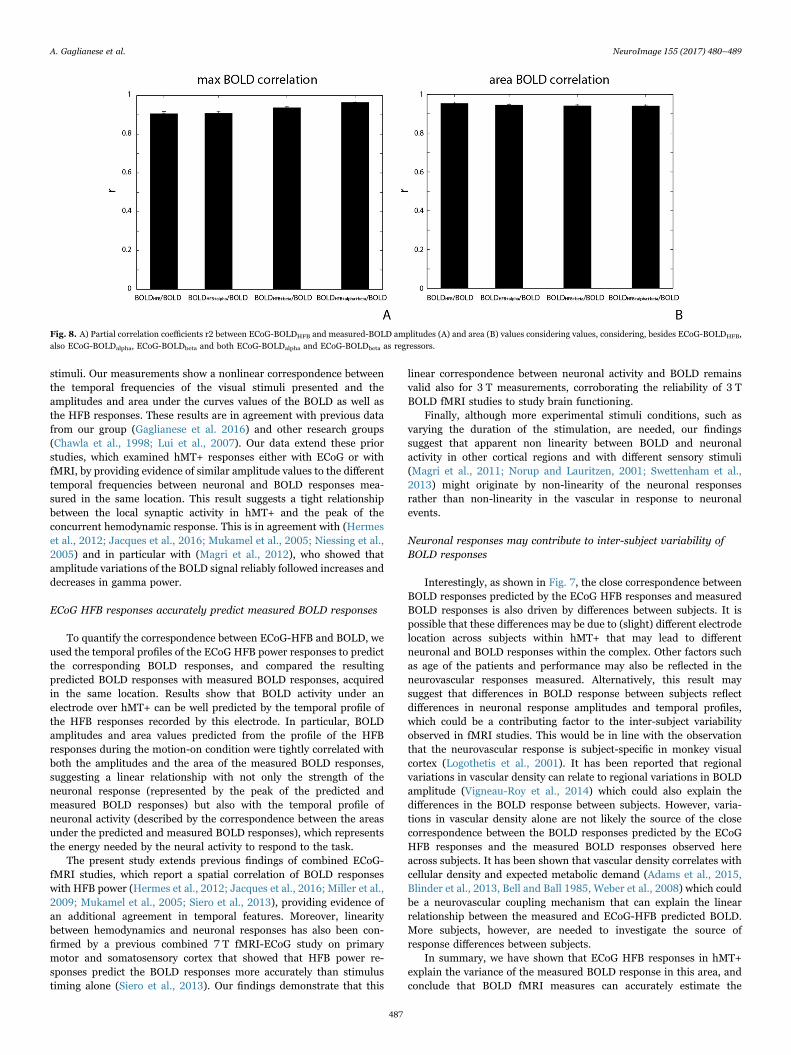
responses either separately, or combined. We found that for bothamplitudes and areas, the addition of low frequencies did not add anystatistical significance increment in terms of explained variance (one-sided t-test, p < 0.05), and that HFB is the most informative band inorder to predict the measured-BOLD responses (Fig. 8).
Discussion
In the present work, we measured fMRI and ECoG responses in thesame subjects to determine whether changes in neuronal activity due todifferent, carefully controlled, stimulus properties were directly re-flected in the BOLD fMRI responses in the higher order visual cortexregion hMT+. We show that we were able to predict with high accuracy(correlation r=0.95) the BOLD responses using the temporal profile ofECOG HFB responses. Our results point to a linear relationshipbetween BOLD and neuronal activity in hMT+, extending previousfindings on primary cortex to higher order cortex.
hMT+ responses to different temporal frequency of visual stimulationmatch across ECoG HFB and fMRI BOLD measurements
Our data show that the neuronal responses in hMT+ to differentvisual motion stimuli, as measured with ECoG, correspond to thosemeasured with fMRI in the same subjects. With both methods, wefound that, during the motion-on condition, subjects consistentlyexhibited positive BOLD and HFB power augmentation within hMT+in response to the different temporal frequencies of the visual motion
Fig. 6. ECoG power increases in the high frequency band predict measured BOLD responses well. Each panel shows, for each subject (A-D represent individual subjects) and temporalfrequency, the mean across trials ( ± standard error) of the BOLD response predicted from the ECoG response (ECoG-BOLDHFB, black curve), and the measured-BOLD (gray curve).
Fig. 7. Correspondence between ECoG-BOLDHFB and measured BOLD summarized across subjects (color coded) and 1, 3 and 5 Hz temporal frequencies (labeled as 1, 3 and 5respectively). A) Correlation between ECoG-BOLDHFB and measured BOLD amplitude values. B) Correlation between ECoG-BOLDHFB and measured BOLD area values.
A. Gaglianese et al. NeuroImage 155 (2017) 480–489
486
stimuli. Our measurements show a nonlinear correspondence betweenthe temporal frequencies of the visual stimuli presented and theamplitudes and area under the curves values of the BOLD as well asthe HFB responses. These results are in agreement with previous datafrom our group (Gaglianese et al. 2016) and other research groups(Chawla et al., 1998; Lui et al., 2007). Our data extend these priorstudies, which examined hMT+ responses either with ECoG or withfMRI, by providing evidence of similar amplitude values to the differenttemporal frequencies between neuronal and BOLD responses mea-sured in the same location. This result suggests a tight relationshipbetween the local synaptic activity in hMT+ and the peak of theconcurrent hemodynamic response. This is in agreement with (Hermeset al., 2012; Jacques et al., 2016; Mukamel et al., 2005; Niessing et al.,2005) and in particular with (Magri et al., 2012), who showed thatamplitude variations of the BOLD signal reliably followed increases anddecreases in gamma power.
ECoG HFB responses accurately predict measured BOLD responses
To quantify the correspondence between ECoG-HFB and BOLD, weused the temporal profiles of the ECoG HFB power responses to predictthe corresponding BOLD responses, and compared the resultingpredicted BOLD responses with measured BOLD responses, acquiredin the same location. Results show that BOLD activity under anelectrode over hMT+ can be well predicted by the temporal profile ofthe HFB responses recorded by this electrode. In particular, BOLDamplitudes and area values predicted from the profile of the HFBresponses during the motion-on condition were tightly correlated withboth the amplitudes and the area of the measured BOLD responses,suggesting a linear relationship with not only the strength of theneuronal response (represented by the peak of the predicted andmeasured BOLD responses) but also with the temporal profile ofneuronal activity (described by the correspondence between the areasunder the predicted and measured BOLD responses), which representsthe energy needed by the neural activity to respond to the task.
The present study extends previous findings of combined ECoG-fMRI studies, which report a spatial correlation of BOLD responseswith HFB power (Hermes et al., 2012; Jacques et al., 2016; Miller et al.,2009; Mukamel et al., 2005; Siero et al., 2013), providing evidence ofan additional agreement in temporal features. Moreover, linearitybetween hemodynamics and neuronal responses has also been con-firmed by a previous combined 7 T fMRI-ECoG study on primarymotor and somatosensory cortex that showed that HFB power re-sponses predict the BOLD responses more accurately than stimulustiming alone (Siero et al., 2013). Our findings demonstrate that this
linear correspondence between neuronal activity and BOLD remainsvalid also for 3 T measurements, corroborating the reliability of 3 TBOLD fMRI studies to study brain functioning.
Finally, although more experimental stimuli conditions, such asvarying the duration of the stimulation, are needed, our findingssuggest that apparent non linearity between BOLD and neuronalactivity in other cortical regions and with different sensory stimuli(Magri et al., 2011; Norup and Lauritzen, 2001; Swettenham et al.,2013) might originate by non-linearity of the neuronal responsesrather than non-linearity in the vascular in response to neuronalevents.
Neuronal responses may contribute to inter-subject variability ofBOLD responses
Interestingly, as shown in Fig. 7, the close correspondence betweenBOLD responses predicted by the ECoG HFB responses and measuredBOLD responses is also driven by differences between subjects. It ispossible that these differences may be due to (slight) different electrodelocation across subjects within hMT+ that may lead to differentneuronal and BOLD responses within the complex. Other factors suchas age of the patients and performance may also be reflected in theneurovascular responses measured. Alternatively, this result maysuggest that differences in BOLD response between subjects reflectdifferences in neuronal response amplitudes and temporal profiles,which could be a contributing factor to the inter-subject variabilityobserved in fMRI studies. This would be in line with the observationthat the neurovascular response is subject-specific in monkey visualcortex (Logothetis et al., 2001). It has been reported that regionalvariations in vascular density can relate to regional variations in BOLDamplitude (Vigneau-Roy et al., 2014) which could also explain thedifferences in the BOLD response between subjects. However, varia-tions in vascular density alone are not likely the source of the closecorrespondence between the BOLD responses predicted by the ECoGHFB responses and the measured BOLD responses observed hereacross subjects. It has been shown that vascular density correlates withcellular density and expected metabolic demand (Adams et al., 2015,Blinder et al., 2013, Bell and Ball 1985, Weber et al., 2008) which couldbe a neurovascular coupling mechanism that can explain the linearrelationship between the measured and ECoG-HFB predicted BOLD.More subjects, however, are needed to investigate the source ofresponse differences between subjects.
In summary, we have shown that ECoG HFB responses in hMT+explain the variance of the measured BOLD response in this area, andconclude that BOLD fMRI measures can accurately estimate the
Fig. 8. A) Partial correlation coefficients r2 between ECoG-BOLDHFB and measured-BOLD amplitudes (A) and area (B) values considering values, considering, besides ECoG-BOLDHFB,also ECoG-BOLDalpha, ECoG-BOLDbeta and both ECoG-BOLDalpha and ECoG-BOLDbeta as regressors.
A. Gaglianese et al. NeuroImage 155 (2017) 480–489
487
underlying neuronal electrophysiological response to stimuli not onlyin primary but also in higher order cortex.
Acknowledgments
This work was supported by the Netherlands Organization forScientific Research (NWO), Vidi Grant number 13339 (N.P.), theEuropean Research Council (ERC) Advanced ‘iConnect’ project, num-ber 320708 (N.F.R.), and the National Institute of Mental Health of theNational Institutes of Health under award number R01MH111417.The authors would like to thank Erik J. Aarnoutse, Frans S.S. Leijten,Cyrille H. Ferrier, Tineke Gebbink and all the clinical neurophysiologyteam for the experimental environment and their help in collecting thedata.
References
Adams, D.L., Piserchia, V., Economides, J.R., Horton, J.C., 2015. Vascular supply of thecerebral cortex is specialized for cell layers but not columns. Cereb. Cortex 25,3673–3681.
Amano, K., Wandell, B.A., Dumoulin, S.O., 2009. Visual field maps, population receptivefield sizes, and visual field coverage in the human MT+ complex. J. Neurophysiol.102, 2704–2718. http://dx.doi.org/10.1152/jn.00102.2009.
Bell, M.A., Ball, M.J., 1985. Laminar variation in the microvascular architecture ofnormal human visual cortex (area 17). Brain Res. 335, 139–143.
Blinder, P., Tsai, P.S., Kaufhold, J.P., Knutsen, P.M., Suhl, H., Kleinfeld, D., 2013. Thecortical angiome: an interconnected vascular network with noncolumnar patterns ofblood flow. Nat. Neurosci. 16, 889–897.
Boynton, G.M., Engel, S.A., Glover, G.H., Heeger, D.J., 1996. Linear systems analysis offunctional magnetic resonance imaging in human V1. J. Neurosci. 16, 4207–4221.
Branco, M.P., Gaglianese, A., Hermes, D., Saad, Z., Petridou, N., Ramsey, N.F., 2016. .Pipeline for ECoG electrode localization on brain surface: towards a one clickapproach, In: Proceedings of the Sixth International Brain-Computer InterfaceMeeting: BCI Past, Present, and Future. Asilomar Conference Center, Pacific Grove,CA USA: Verlag der Technischen Universitaet Graz, p. 154. doi:http://dx.doi.org/10.3217/978-3-85125-467-9-154.
Brookes, M.J., Gibson, A.M., Hall, S.D., Furlong, P.L., Barnes, G.R., Hillebrand, A.,Singh, K.D., Holliday, I.E., Francis, S.T., Morris, P.G., 2005. GLM-beamformermethod demonstrates stationary field, alpha ERD and gamma ERS co-localisationwith fMRI BOLD response in visual cortex. Neuroimage 26, 302–308. http://dx.doi.org/10.1016/j.neuroimage.2005.01.050.
Chawla, D., Phillips, J., Buechel, C., Edwards, R., Friston, K.J., 1998. Speed-dependentmotion-sensitive responses in V5: an fMRI study. Neuroimage 7, 86–96. http://dx.doi.org/10.1006/nimg.1997.0319.
Costagli, M., Ueno, K., Sun, P., Gardner, J.L., Wan, X., Ricciardi, E., Pietrini, P., Tanaka,K., Cheng, K., 2014. Functional signalers of changes in visual stimuli: corticalresponses to increments and decrements in motion coherence. Cereb. Cortex 24,110–118. http://dx.doi.org/10.1093/cercor/bhs294.
Dale, A.M., 1999. Optimal experimental design for event-related fMRI. Hum. BrainMapp. 8, 109–114.
Dumoulin, S.O., Bittar, R.G., Kabani, N.J., Baker, C.L., Le Goualher, G., Bruce Pike, G.,Evans, A.C., 2000. A new anatomical landmark for reliable identification of humanarea V5/MT: a quantitative analysis of sulcal patterning. Cereb. Cortex 10, 454–463.http://dx.doi.org/10.1093/cercor/10.5.454.
Gaglianese, A., Costagli, M., Ueno, K., Ricciardi, E., Bernardi, G., Pietrini, P., Cheng, K.,2015. The direct, not V1-mediated, functional influence between the thalamus andmiddle temporal complex in the human brain is modulated by the speed of visualmotion. Neuroscience 284, 833–844. http://dx.doi.org/10.1016/j.neuroscience.2014.10.042.
Gaglianese, A., Harvey, B.M., Vansteensel, M.J., Dumoulin, S.O., Ramsey, N.F., Petridou,N., 2016. Separate spatial and temporal frequency tuning to visual motion in humanMT 1 measured with ECoG. Hum. Brain Mapp. 38, 293–307. http://dx.doi.org/10.1002/hbm.23361, (2017).
Gagnon, L., Sakadzic, S., Lesage, F., Musacchia, J.J., Lefebvre, J., Fang, Q., Yucel, M.A.,Evans, K.C., Mandeville, E.T., Cohen-Adad, J., Polimeni, J.R., Yaseen, M.A., Lo,E.H., Greve, D.N., Buxton, R.B., Dale, A.M., Devor, A., Boas, D.A., 2015. Quantifyingthe microvascular origin of BOLD-fMRI from first principles with two-photonmicroscopy and an oxygen-sensitive nanoprobe. J Neurosci. 35 (8), 3663–3675.
Gardner, J.L., Sun, P., Waggoner, R.A., Ueno, K., Tanaka, K., Cheng, K., 2005. Contrastadaptation and representation in human early visual cortex. Neuron 47, 607–620.http://dx.doi.org/10.1016/j.neuron.2005.07.016.
Goense, J., Merkle, H., Logothetis, N.K., 2012. High-resolution fMRI reveals laminardifferences in neurovascular coupling between positive and negative BOLDresponses. Neuron 76, 629–639. http://dx.doi.org/10.1016/j.neuron.2012.09.019.
Harvey, B.M., Vansteensel, M.J., Ferrier, C.H., Petridou, N., Zuiderbaan, W., Aarnoutse,E.J., Bleichner, M.G., Dijkerman, H.C., van Zandvoort, M.J.E., Leijten, F.S.S.,Ramsey, N.F., Dumoulin, S.O., 2013. Frequency specific spatial interactions inhuman electrocorticography: v1 alpha oscillations reflect surround suppression.Neuroimage 65, 424–432. http://dx.doi.org/10.1016/j.neuroimage.2012.10.020.
Hermes, D., Miller, K.J., Noordmans, H.J., Vansteensel, M.J., Ramsey, N.F., 2010.
Automated electrocorticographic electrode localization on individually renderedbrain surfaces. J. Neurosci. Methods 185, 293–298. http://dx.doi.org/10.1016/j.jneumeth.2009.10.005.
Hermes, D., Miller, K.J., Vansteensel, M.J., Aarnoutse, E.J., Leijten, F.S.S., Ramsey, N.F.,2012. Neurophysiologic correlates of fMRI in human motor cortex. Hum. BrainMapp. 33, 1689–1699. http://dx.doi.org/10.1002/hbm.21314.
Hirsch, S., Reichold, J., Schneider, M., Sze´kely, G., Weber, B., 2012. Topology andhemodynamics of the cortical cerebrovascular system. J. Cereb. Blood Flow. Metab.32, 952–967.
Huk, A.C., Dougherty, R.F., Heeger, D.J., 2002. Retinotopy and functional subdivision ofhuman areas MT and MST. J. Neurosci. 22, 7195–7205, (doi:20026661).
Huo, B.-X., Smith, J.B., Drew, P.J., 2014. Neurovascular coupling and decoupling in thecortex during voluntary locomotion. J. Neurosci. 34, 10975–10981. http://dx.doi.org/10.1523/JNEUROSCI.1369-14.2014.
Im, C.-H., Gururajan, A., Zhang, N., Chen, W., Hei, B., 2007. Spatial resolution of EEGcortical source imaging revealed by localization of retinotopic organization in humanprimary visual cortex. J. Neurosci. Methods 161 (1), 142–154.
Jacobs, J., Kahana, M.J., 2010. Direct brain recordings fuel advances in cognitiveelectrophysiology. Trends Cogn. Sci. 14 (4), 162–171.
Jacques, C., Witthoft, N., Weiner, K.S., Foster, B.L., Rangarajan, V., Hermes, D., Miller,K.J., Parvizi, J., Grill-Spector, K., 2016. Corresponding ECoG and fMRI category-selective signals in human ventral temporal cortex. Neuropsychologia 83, 14–28.http://dx.doi.org/10.1016/j.neuropsychologia.2015.07.024.
Kastner, S., O’Connor, D.H., Fukui, M.M., Fehd, H.M., Herwig, U., Pinsk, M. a, 2003.Functional imaging of the human lateral geniculate nucleus and pulvinar. J.Neurophysiol. 17, 17. http://dx.doi.org/10.1152/jn.00553.2003.
Liu, J.V., Hirano, Y., Nascimento, G.C., Stefanovic, B., Leopold, D.A., Silva, A.C., 2013.fMRI in the awake marmoset: somatosensory-evoked responses, functionalconnectivity, and comparison with propofol anesthesia. Neuroimage 78, 186–195.
Logothetis, N.K., Pauls, J., Augath, M., Trinath, T., Oeltermann, A., 2001.Neurophysiological investigation of the basis of the fMRI signal. Nature 412,150–157. http://dx.doi.org/10.1038/35084005.
Lui, L.L., Bourne, J.A., Rosa, M.G.P., 2007. Spatial and temporal frequency selectivity ofneurons in the middle temporal visual area of new world monkeys (Callithrixjacchus). Eur. J. Neurosci. 25, 1780–1792. http://dx.doi.org/10.1111/j.1460-9568.2007.05453.x.
Magri, C., Logothetis, N.K., Panzeri, S., 2011. Investigating static nonlinearities inneurovascular coupling. Magn. Reson. Imaging 29, 1358–1364. http://dx.doi.org/10.1016/j.mri.2011.04.017.
Magri, C., Schridde, U., Murayama, Y., Panzeri, S., Logothetis, N.K., 2012. The amplitudeand timing of the BOLD signal reflects the relationship between local field potentialpower at different frequencies. J. Neurosci. 32, 1395–1407. http://dx.doi.org/10.1523/JNEUROSCI.3985-11.2012.
Miller, K.J., Sorensen, L.B., Ojemann, J.G., den Nijs, M., 2009. Power-law scaling in thebrain surface electric potential. PLoS Comput. Biol. 5, e1000609. http://dx.doi.org/10.1371/journal.pcbi.1000609.
Mukamel, R., Gelbard, H., Arieli, A., Hasson, U., Fried, I., Malach, R., 2005. Couplingbetween neuronal firing, field potentials, and FMRI in human auditory cortex.Science 309, 951–954. http://dx.doi.org/10.1126/science.1110913.
Neggers, S.F.W., Hermans, E.J., Ramsey, N.F., 2008. Enhanced sensitivity with fastthree-dimensional blood-oxygen-level-dependent functional MRI: comparison ofSENSE-PRESTO and 2D-EPI at 3 T. NMR Biomed. 21, 663–676. http://dx.doi.org/10.1002/nbm.1235.
Niessing, J., Ebisch, B., Schmidt, K.E., Niessing, M., Singer, W., Galuske, R. a W., 2005.Hemodynamic signals correlate tightly with synchronized gamma oscillations.Science 309, 948–951. http://dx.doi.org/10.1126/science.1110948.
Norup, N., Lauritzen, M., 2001. Coupling and uncoupling of activity-dependent increasesof neuronal activity and blood flow in rat somatosensory cortex. J. Physiol. 533,773–785, doi:PHY_11382 [pii).
Ogawa, S., Lee, T.M., Kay, A.R., Tank, D.W., 1990. Brain magnetic resonance imagingwith contrast dependent on blood oxygenation. Proc. Natl. Acad. Sci. USA 87,9868–9872. http://dx.doi.org/10.1073/pnas.87.24.9868.
Ogawa, S., Tank, D.W., Menon, R., Ellermann, J.M., Kim, S.G., Merkle, H., Ugurbil, K.,1992. Intrinsic signal changes accompanying sensory stimulation: functional brainmapping with magnetic resonance imaging. Proc. Natl. Acad. Sci. USA 89,5951–5955. http://dx.doi.org/10.1073/pnas.89.13.5951.
Onton, J., Makeig, S., 2009. High-frequency broadband modulations ofelectroencephalographic spectra. Front Hum. Neurosci. 3, 61. http://dx.doi.org/10.3389/neuro.09.061.2009.
Pisaro, M.A., Dhruv, N.T., Garandini, M., Benucci, A., 2013. Fast hemodynamicresponses in the visual cortex of the awake mouse. J. Neurosci. 33 (46),18343–18351.
Ramsey, N.F., Tallent, K., Van Gelderen, P., Frank, J.A., Moonen, C.T.W., Weinberger,D.R., 1996. Reproducibility of human 3D fMRI brain maps acquired during a motortask. Hum. Brain Mapp. 4, 113–121. http://dx.doi.org/10.1002/(SICI)1097-0193(1996)4:2 < 113::AID-HBM3 > 3.0.CO;2-6.
Rosa, M.J., Kilner, J., Blankenburg, F., Josephs, O., Penny, W., 2010. Estimating thetransfer function from neuronal activity to BOLD using simultaneous EEG-fMRI.Neuroimage 49, 1496–1509. http://dx.doi.org/10.1016/j.neuroimage.2009.09.011.
Siero, J.C.W., Hermes, D., Hoogduin, H., Luijten, P.R., Petridou, N., Ramsey, N.F., 2013.BOLD consistently matches electrophysiology in human sensorimotor cortex atincreasing movement rates: a combined 7T fMRI and ECoG study on neurovascularcoupling. J. Cereb. Blood Flow. Metab. 33, 1448–1456. http://dx.doi.org/10.1038/jcbfm.2013.97.
Singh, K.D., Barnes, G.R., Hillebrand, A., Forde, E.M.E., Williams, A.L., 2002. Task-related changes in cortical synchronization are spatially coincident with the
A. Gaglianese et al. NeuroImage 155 (2017) 480–489
488

hemodynamic response. Neuroimage 16, 103–114. http://dx.doi.org/10.1006/nimg.2001.1050.
Swettenham, J., Muthukumaraswamy, S., Singh, K., 2013. BOLD responses in humanprimary visual cortex are insensitive to substantial changes in neural activity. Front.Hum. Neurosci. 7, 1–11. http://dx.doi.org/10.3389/fnhum.2013.00076.
Tootell, R.B.H., Reppas, J.B., Kwong, K.K., Rosen, B.R., Belliveaul, J.W., Malach, R.,1995. Functional analysis of human MT and related visual cortical areas usingmagnetic resonance imaging. J. Neurosci. 15 (4), 3215–3220.
van Gelderen, P., Duyn, J.H., Ramsey, N.F., Liu, G., Moonen, C.T.W., 2012. The PRESTOtechnique for fMRI. Neuroimage.. http://dx.doi.org/10.1016/j.neuroimage.2012.01.017.
Vigneau-Roy, N., Bernier, M., Descoteaux, M., Whittingstall, K., 2014. Regional
variations in vascular density correlate with resting-state and task-evoked bloodoxygen level-dependent signal amplitude. Hum. Brain Mapp. 35 (5), 1906–1920.
Weber, B., Keller, A.L., Reichold, J., Logothetis, N.K., 2008. The microvascular system ofthe striate and extrastriate visual cortex of the macaque. Cereb. Cortex 18,2318–2330.
Wells, W.M., III, Viola, P., Atsumi, H., Nakajima, S., Kikinis, R., 1996. Multi-modalvolume registration by maximization of mutual information. Med. Image Anal. 1,35–51.
Winawer, J., Kay, K.N., Foster, B.L., Rauschecker, A.M., Parvizi, J., Wandell, B.A., 2013.Asynchronous broadband signals are the principal source of the BOLD response inhuman visual cortex. Curr. Biol. 23, 1145–1153. http://dx.doi.org/10.1016/j.cub.2013.05.001.
A. Gaglianese et al. NeuroImage 155 (2017) 480–489
489