corresponding author: a.a.chitband@gmail · herbicide in sugar beet ... foliage (abbaspoor and...
TRANSCRIPT
826
AJCS 9(9):826-834 (2015) ISSN:1835-2707
Effect of photosystem II, lipid biosynthesis and auxin inhibitor herbicides on fluorescence
induction curve
Ali Asghar Chitband*1
, Reza Ghorbani1, Mohammad Hassan Rashed Mohassel
1, Rahmat Abbasi
2
1Department of Agronomy, Faculty of Agriculture, Ferdowsi University of Mashhad, Iran
2University of Agricultural Sciences and Natural Resources, Sari, Iran
*Corresponding author: [email protected]
Abstract
Measuring chlorophyll fluorescence is a noninvasive, highly sensitive and fast technique for assaying photosynthetic apparatus status
in plants. Chlorophyll fluorescence measurements were carried out to characterize how the fluorescence induction curve (Kautsky
curve) and its parameters were affected by untreated control and seven doses of desmedipham + phenmedipham + ethofumesate
(photosystem II (PSII) + lipid biosynthesis inhibitors), chloridazon (PSII inhibitor) and clopyralid (plant growth regulator (PGR)
inhibitor) in common lambsquarters (Chenopodium album L.) and black nightshade (Solanum nigrum L.) at Ferdowsi University of
Mashhad Greenhouse during 2013. Altogether, 42 treatments were used for both species with three replications per treatment and a
completely randomized layout. Biomass effective dose (ED50 and/or ED90), based on log-logistic dose–response curves, were more
effective in black nightshade control than common lambsquarters, i.e. the minimum dose required for a satisfactory control with 90%
reduction on black nightshade dry matter (ED90) was 316.60, 1133.16 and 132.40 g ai ha-1 for desmedipham + phenmedipham +
ethofumesate, chloridazon and clopyralid, respectively. The shape of the chlorophyll fluorescence induction curve were changed by
desmedipham + phenmedipham + ethofumesate at doses higher than 308.25 mg ai ha-1 in common lambsquarters and in all doses of
black nightshade at 4 hours after spraying (HAS). In contrast, chlorophyll fluorescence decay was obvious by chloridazon at 72 and
168 HAS in both species. Clopyralid had chlorophyll fluorescence inhibition only in black nightshade at doses higher than 60 mg ai
ha-1. The maximum quantum efficiency (FV/Fm), the relative changes at the J step (Fvj) and area (the area between the Kautsky curve
and maximum fluorescence (Fm)), were affected by desmedipham + phenmedipham + ethofumesate at rates of 51.38 mg ai ha-1 and
up in both species 4 HAS, but FV/Fm was stable for chloridazon and clopyralid in common lambsquarters. A good correlation
(between 0.65 to 0.89) was existed between fluorescence parameters taken 24 hours after spraying and dry matter taken three weeks
after spraying for both species. In conclusion, the chlorophyll fluorescence measurement may be used to shorten the bioassay
screening period is a suitable and cost effective indicator for monitoring PSII and PGR inhibitors.
Keywords: Chloridazon, chlorophyll fluorescence, clopyralid, desmedipham + phenmedipham + ethofumesate, Kautsky curve.
Abbreviations: ABA_abscisic acid; Ai_active ingredient; CHEAL_Chenopodium album L. (Common lambsquarters); ED_effective
dose; HAS_hours after spraying; Log (Kow)_Logarithm K Oil-Water partition coefficient; PGR_plant growth regulator; PSII_
photosystem 2; POST_ post-emergence; QA or QB_quinones A or B; ROS_ reactive oxygen species; SOLNI_Solanum nigrum L.
(Black nightshade); WAS_week after spraying.
Introduction
Desmedipham + phenmedipham + ethofumesate,
phenylcarbamates + benzofuranyl alkanesulfonate herbicides,
is widely used for post-emergence broad-leaved weed control
in sugar beet (Markovska et al., 2012). Chloridazon, a
pyridazinone herbicide, is used as a pre- and post- emergence
herbicide in sugar beet (Rouchaud et al., 1997).
Desmedipham, phenmedipham and chloridazon, are
photosystem II (PSII) inhibitors, their translocation via xylem
are slow, mostly absorbed not only by roots, but also by
foliage (Abbaspoor and Streibig, 2007). Their mode of action
is through the blocking of electron transfer between the
primary and secondary quinones (QA and QB) of PSII by
binding to the QB-binding site and accepting electrons from
QA in the chloroplasts (Govindjee et al., 1997; Hess, 2000;
Ikeda et al., 2003). Consequently, the photosynthetic electron
transport chain is interrupted, and leading to the concomitant
inhibition of ATP production and carbon fixation (Van
Rensen et al., 1999; Hess, 2000; Kohno et al., 2000).
Eventually, plant death is caused by light induced oxidative
stress, initiated via damaging caused by formation of reactive
oxygen species (ROS) near the PSII reaction centers, leading
to lipid peroxidation and proteolysis, as well as breaking off
the protein–pigment complexes of PSII and plant death
(Hess, 2000; Fufezan et al., 2002). Ethofumesate is readily
absorbed by emerging shoots and roots, and is translocated
readily to the foliage. Post-emergence applied ethofumesate
is poorly absorbed by maturing leaves with a well-developed
cuticle (Meyer et al., 2006). Clopyralid a growth regulator
herbicide (PGR) is in the picolinic acid group and readily
translocated apo-symplastic within the plant. It used for post-
emergence broad-leaved weed control in sugar beet.
Clopyralid has no direct impact on photosynthesis function,
but it affects chlorosis and necrosis of the leaves indicating
malfunctioning of the photosynthetic apparatus (Tu et al.,
2001). Measures of changes to the chlorophyll fluorescence
induction curve (Kautsky curve), is a rapid, non-invasive and
simple method for monitoring the physiological status of the
photosynthetic apparatus in plants (Matouskova et al., 1999;
Strasser et al., 2000). It can be used for the study of the effect
of PSII-inhibiting herbicides as well as herbicides with other
modes of action (Percival and Baker 1991; Christensen et al.
2003). Analysis of the chlorophyll fluorescence induction

827
curve (Kautsky curve), means a series of changes in
chlorophyll fluorescence yield are observed in plant leaves
when light is abruptly turned on after a dark period (Maxwell
and Johnson 2000; Baker and Rosenqvist, 2004).
Illumination with 650 nm wavelength of healthy dark-
adapted leaves provides a rise in amounts of chlorophyll
fluorescence emission, with some trait phases. There are
three phases found on the O, J, I and P steps. These phases
primarily point out photochemical events relevant to PSII
(Govindjee, 1995). The three phases are described as follows:
at the O-J phase complete reduction of the primary electron
acceptor QA of PSII takes place from 50 μs to 2 ms, the J-I
phase corresponds to electron transfer from QA to QBhappens
between 2 to 30 ms and the I-P phase corresponds to the
release of fluorescence quenching by the oxidized
plastoquinone pool taking place within 30-500 ms
(Appenroth et al., 2000; Strasser and Stirbet, 2001; Force et
al., 2003) (Fig 1). From the numerous parameters which can
be derived from the OJIP steps of the fluorescence induction
curve, the relative changes at the J step e.g. [Fvj = (Fm –
Fj)/Fm], prove to be a useful parameter to discern effects of
herbicides with different mode of actions (Percival et al.
1992; Christensen et al. 2003; Abbaspoor and Streibig, 2005;
2007) (Fig 1). The shape of the Kautsky curve is affected by
various stress factors, such as ambient illumination, nutrient
supply, temperature and water stress, pathogens and
herbicides (Habash et al., 1985; Bolhar-Nordenkampf and
Oquist, 1993; Daley, 1995). In addition, fluorescence
induction kinetics can be altered by many inhibitors of
metabolic processes that are not directly involved in
photosynthesis (Blowers, 1989; Percival and Baker, 1991;
Crudace, 2000). The shape of the Kautsky curve and derived
fluorescence parameters of Arabidopsis thaliana seedlings
influenced by herbicides Asulam, Bifenox, 2,4-D, Diclofop-
methyl, Glyphosate, and Imazapyr, which do not have a
direct impact on photosynthesis (Barbagallo et al., 2003).
The objectives of this study were to determine how rapidly
three herbicides with different mode of actions affect the
shape of the Kautsky curve, defined by various fluorescence
parameters in weed species, and whether possible herbicide
variation can be observed in the shape of the Kautsky curve
as a function of time after being exposed to herbicides. The
final objective was to relate various fluorescence parameters,
derived from the Kautsky curve, to the dry matter of these
herbicides.
Results
Dose–response assays
A summary of the dose–response curve analysis for dry
matter of common lambsquarters and black nightshade for
the two experiments are shown in Table 1. In both
experiments, desmedipham + phenmedipham + ethofumesate
were more potent than chloridazon and clopyralid against
common lambsquarters and black nightshade and their ED50
and ED90 values were lesser compared with chloridazon and
clopyralid at cotyledon stage in either experiments. However,
a lower dose was also required for 50% or 90% reduction in
total dry matter for black nightshade by desmedipham +
phenmedipham + ethofumesate, chloridazon and clopyralid
application (Table 1). Consequently, we may recommend
using desmedipham + phenmedipham + ethofumesate for
adequate weed control in sugar beet instead of chloridazon
and clopyralid.
Fig 1. Kautsky curve recorded with Handy PEA instrument
in a 30 minutes dark adapted leaf. The Kautsky curve rise
from O to P levels is characterized by the OJIP steps
reflecting PSII electron transport from water to PQ pool.
Chlorophyll fluorescence assays
The Kautsky curves
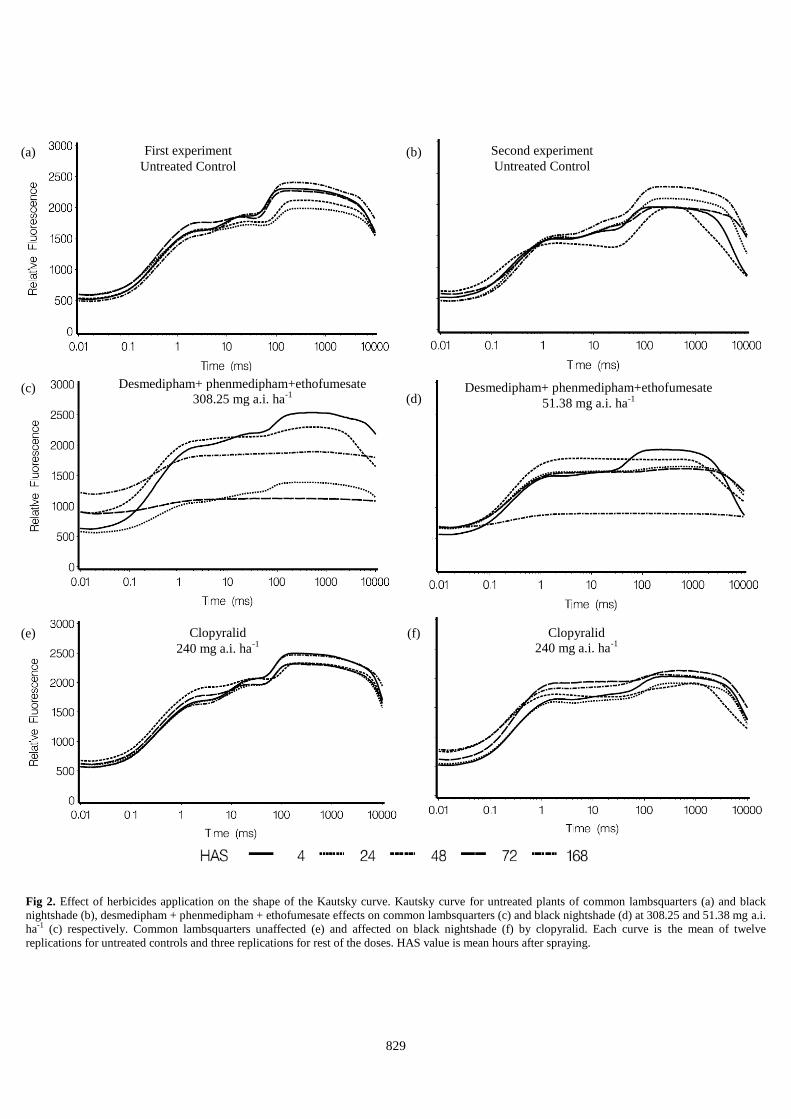
The effects of desmedipham + phenmedipham +
ethofumesate, chloridazon and clopyralid on the shape of the
Kautsky curves for common lambsquarters and black
nightshade leaves are shown in Fig 2. In both experiments, 4
HAS, desmedipham + phenmedipham + ethofumesate
changed the shape of the Kautsky curves, but chloridazon and
clopyralid had no effect on it (Fig. 2).Kautsky curves were
irreversibly affected and altered in an almost horizontal lines
by desmedipham + phenmedipham + ethofumesate in both
weeds species at 4 HAS at doses of 308.25 mg ai ha-1 and
higher in common lambsquarters (first experiment), but all
doses in black nightshade (second experiment) (Fig. 2 a,b),
while chloridazon and clopyralid did not. Black nightshade
was shown more sensitive to desmedipham + phenmedipham
+ ethofumesate application than common lambsquarters and
excluding doses of 51.38 and 102.75 mg ai ha-1 was
completely destroyed in all doses 168 HAS (Fig. 2). It seems
that lag time of 168 HAS at the highest doses, was not
suitable for desmedipham + phenmedipham + ethofumesate
fluorescence measuring due to death of plants and the
fluorescence virtually ceased in black nightshade (Fig. 2).
Chloridazon is a PSII inhibitor however, but had a little
impact on the reduction of species florescence at 4, 24 and 48
HAS, but at 72 and 168 HAS the shape of the Kautsky curves
was changed entirely. Lesser impact of chloridazon than that
of desmedipham + phenmedipham + ethofumesate on
chlorophyll fluorescence reduction of both species may be
due to less solubility and more deposition of chloridazon in
sprayer tank. Clopyralid did not well influence on Kautsky
curves at all doses in common lambsquarters. While in black
nightshade, the shape of Kautsky curves were influenced by
clopyralid as a PGR inhibitor between 60-240 mg ai ha-1 (Fig.
2 f).
The fluorescence parameters
To describe the changes in the shape and form of the Kautsky
curves in Fig. 2, plots of the selected fluorescence parameters
e.g. (FV/Fm, FVj and area) against doses are shown in Fig. 3.
The value of the FV/Fm parameter was close to 0.83 in all
plants and consistent during the experimental period, while
FVj and area somewhat were vacillated during the course of
the experiment (Fig. 1) (Abbaspoor et al., 2006). The detailed
changes of fluorescence parameters in treated plants are
shown in Fig. 3 in both experiments. The herbicides effect on
fluorescence parameters started 4 HAS, particularly for black
nightshade in the second experiment.

828
Table 1. Summary of dose–response analysis of dry matter at 21 days after spray (DAS) (four to six true leaf stage) for both of
experiments. In both experiments the test for lack of fit were not significant, indicating that the logistic model was able to describe
the data better than an ordinary ANOVA
Weed species Herbicide Upper limit
(SE)a
Slope
(SE)
ED50
(SE)b
ED90
(SE)
Lack of fit test
(5%)
First experiment
Common lambsquarters
Desmedipham +
phenmedipham +
ethofumesate
4.13 (±0.71) 1.55 (±0.05) 93.21 (±11.12) 427.77 (±31.11) 0.69 (NS)c
(Chenopodium album L.)
Chloridazon 4.01 (±0.65) 1.19 (±0.05) 387.79 (±60.88) 1361.83 (±134.13) 0.56 (NS)
(CHEAL)
Clopyralid 3.98 (±0.58) 1.18 (±0.05) 17.09 (±2.55) 149.16 (±10.69) 0.27 (NS)
Second experiment
Black nightshade
Desmedipham +
phenmedipham +
ethofumesate
2.68 (±0.07) 1.02 (±0.04) 37.47 (±5.66) 316.60 (±33.81) 0.11 (NS)
(Solanum nigrum L.)
Chloridazon 2.52 (±0.06) 1.26 (±0.05) 198.35 (±24.77) 1133.16 (±140.53) 0.38 (NS)
(SOLNI)
Clopyralid 2.48 (±0.06) 0.94 (±0.03) 12.66 (±2.55) 132.40 (±15.52) 0.97 (NS) a SE = Standard Error, b ED50 or ED90 = Effective Dose at 50 or 90 percent, c NS: not significant at the 5% level, Abbreviations: CHEAL, Chenopodium album L. (common
lambsquarters); SOLNI, Solanum nigrum L. (black nightshade).
Table 2. Assessment of relative potency between PSII + lipid biosynthesis inhibitor and plant growth regulators (PGR) herbicides
Weed species Herbicide Relative potency (RP)
ED50a (SE)b ED90 (SE)
First experiment
Common lambsquarters Desmedipham + phenmedipham + ethofumesate :
Clopyralid 5.45 (±1.48) 2.87 (±0.85)
(Chenopodium album L.) Chloridazon : Clopyralid 22.69 (±6.49) 9.13 (±2.73)
(CHEAL)
Second experiment
Black nightshade Desmedipham + phenmedipham + ethofumesate :
Clopyralid 2.96 (±0.71) 2.39 (±0.62)
(Solanum nigrum L.) Chloridazon : Clopyralid 15.67 (±2.43) 8.56 (±2.94)
(SOLNI) a ED50 or ED90 = Effective Dose at 50 or 90 percent, b SE = Standard Error, Abbreviations: CHEAL, Chenopodium album L. (common lambsquarters); SOLNI, Solanum
nigrum L. (black nightshade).
For desmedipham + phenmedipham + ethofumesate,
significant decreases in parameters were evident at any time
intervals measured after treatment in both species, while this
was not the case with chloridazon and clopyralid (Fig. 3).
Among fluorescence parameters, FV/Fm was stable and not
sensitive enough to trace minor herbicides effects in both
species, but Fvj and area were decreased by desmedipham +
phenmedipham + ethofumesate and chloridazon in all doses
and time periods. In addition, Fvj and area were declined by
clopyralid in black nightshade, whereas in common
lambsquarters only Fvj were influenced by clopyralid, but
FV/Fm and area were consistent (Fig. 3).
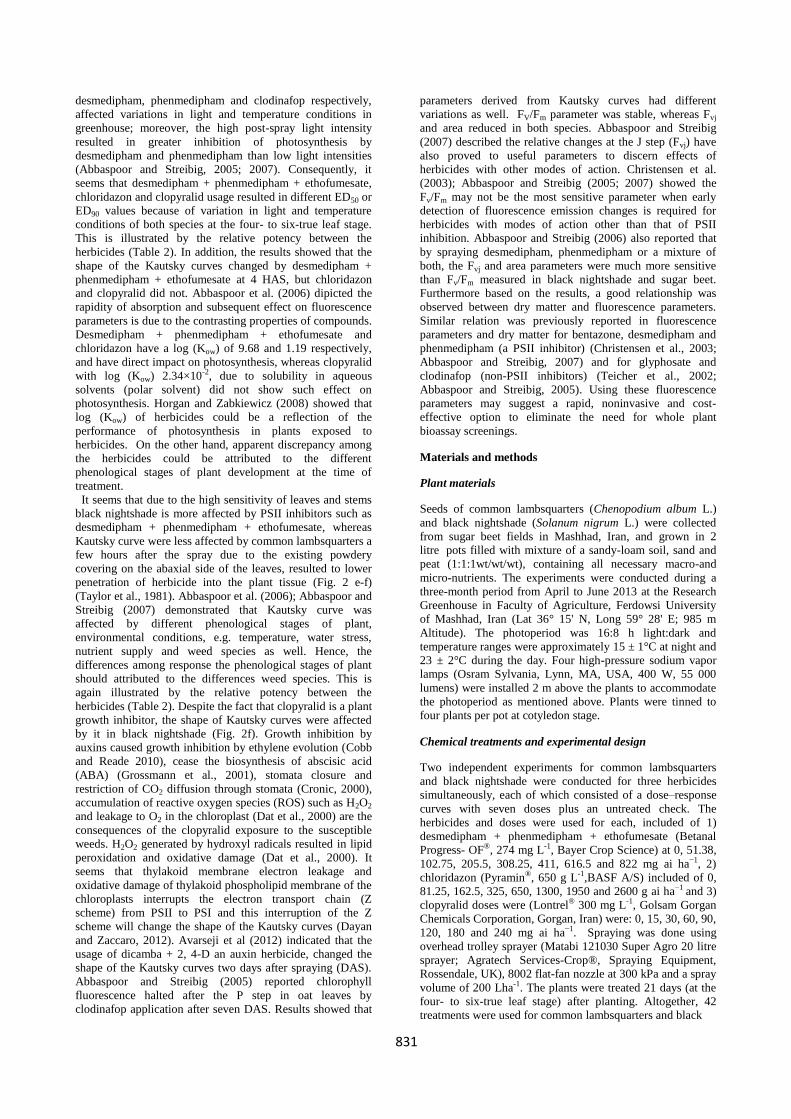
The relationship between fluorescence parameter and dry
weight
The relationship between dry matter, taken 21 DAS by
desmedipham + phenmedipham + ethofumesate and
chloridazon, and the selected fluorescence parameters, taken
24 HAS for common lambsquarters and black nightshade,
respectively (Fig. 4). A linear regression of dry matter on
fluorescence parameters was fitted to the data and the
relationship between fluorescence parameters and dry matter
was evident. The graphs show four HAS, FV/Fm was more
affected by the lipophilic desmediphamand + phenmedipham
+ ethofumesate [log (Kow) = 9.68] and chloridazon [log (Kow)
= 1.19] than by the hydrophilic clopyralid [log (Kow) =
2.34×10⁻²]. It also shows that the plants die in the course of
the experiment.
Discussion
The results of our study showed that desmedipham +
phenmedipham + ethofumesate was more effective on
common lambsquarters and black nightshade control
compared to chloridazon and clopyralid. Starke and Renner
(1996); Bosak et al. (2001); Abdollahi and Ghadiri (2004)
reported that phenmedipham plus desmedipham showed
much better weeds control than mere use of phenmedipham
in sugar beet. Based on the results of the experiment, climatic
conditions, phenological stage of plant and plant species
could be effective on EDx value discrepancy. Abbaspoor and
Streibig (2007) reported that different EDx such as ED50 or
ED90 derived from log-logistic dose-response curves can be
due to different plant growth, phenological stages at the time
of herbicide treatment, weed species as well as climatic
differences in the greenhouse conditions. They also,
described that PSII and ACCase inhibitor herbicides such as
829
Fig 2. Effect of herbicides application on the shape of the Kautsky curve. Kautsky curve for untreated plants of common lambsquarters (a) and black
nightshade (b), desmedipham + phenmedipham + ethofumesate effects on common lambsquarters (c) and black nightshade (d) at 308.25 and 51.38 mg a.i.
ha-1 (c) respectively. Common lambsquarters unaffected (e) and affected on black nightshade (f) by clopyralid. Each curve is the mean of twelve
replications for untreated controls and three replications for rest of the doses. HAS value is mean hours after spraying.
Desmedipham+ phenmedipham+ethofumesate
51.38 mg a.i. ha-1
Desmedipham+ phenmedipham+ethofumesate
308.25 mg a.i. ha-1
Second experiment
Untreated Control
First experiment
Untreated Control (a) (b)
(c) (d)
Clopyralid
240 mg a.i. ha-1
Clopyralid
240 mg a.i. ha-1
(e) (f)

830
Fig 3. Effect of clopyralid on Fv/Fm in common lambsquarters (a), desmedipham + phenmedipham + ethofumesate on Fv/Fm and Fvj in black
nightshade and common lambsquarters, respectively (b-c), chloridazon effect on Fvj in black nightshade (d), and chloridazon effect on area in
common lambsquarters and black nightshade, respectively (e-f). Means values are shown. HAS: hours after spraying, SD: standard deviation.
Black nightshade Common lambsquarters
(a) (b)
(c) (d)
(e) (f)
832
desmedipham, phenmedipham and clodinafop respectively,
affected variations in light and temperature conditions in
greenhouse; moreover, the high post-spray light intensity
resulted in greater inhibition of photosynthesis by
desmedipham and phenmedipham than low light intensities
(Abbaspoor and Streibig, 2005; 2007). Consequently, it
seems that desmedipham + phenmedipham + ethofumesate,
chloridazon and clopyralid usage resulted in different ED50 or
ED90 values because of variation in light and temperature
conditions of both species at the four- to six-true leaf stage.
This is illustrated by the relative potency between the
herbicides (Table 2). In addition, the results showed that the
shape of the Kautsky curves changed by desmedipham +
phenmedipham + ethofumesate at 4 HAS, but chloridazon
and clopyralid did not. Abbaspoor et al. (2006) dipicted the
rapidity of absorption and subsequent effect on fluorescence
parameters is due to the contrasting properties of compounds.
Desmedipham + phenmedipham + ethofumesate and
chloridazon have a log (Kow) of 9.68 and 1.19 respectively,
and have direct impact on photosynthesis, whereas clopyralid
with log (Kow) 2.34×10⁻², due to solubility in aqueous
solvents (polar solvent) did not show such effect on
photosynthesis. Horgan and Zabkiewicz (2008) showed that
log (Kow) of herbicides could be a reflection of the
performance of photosynthesis in plants exposed to
herbicides. On the other hand, apparent discrepancy among
the herbicides could be attributed to the different
phenological stages of plant development at the time of
treatment.
It seems that due to the high sensitivity of leaves and stems
black nightshade is more affected by PSII inhibitors such as
desmedipham + phenmedipham + ethofumesate, whereas
Kautsky curve were less affected by common lambsquarters a
few hours after the spray due to the existing powdery
covering on the abaxial side of the leaves, resulted to lower
penetration of herbicide into the plant tissue (Fig. 2 e-f)
(Taylor et al., 1981). Abbaspoor et al. (2006); Abbaspoor and
Streibig (2007) demonstrated that Kautsky curve was
affected by different phenological stages of plant,
environmental conditions, e.g. temperature, water stress,
nutrient supply and weed species as well. Hence, the
differences among response the phenological stages of plant
should attributed to the differences weed species. This is
again illustrated by the relative potency between the
herbicides (Table 2). Despite the fact that clopyralid is a plant
growth inhibitor, the shape of Kautsky curves were affected
by it in black nightshade (Fig. 2f). Growth inhibition by
auxins caused growth inhibition by ethylene evolution (Cobb
and Reade 2010), cease the biosynthesis of abscisic acid
(ABA) (Grossmann et al., 2001), stomata closure and
restriction of CO2 diffusion through stomata (Cronic, 2000),
accumulation of reactive oxygen species (ROS) such as H2O2
and leakage to O2 in the chloroplast (Dat et al., 2000) are the
consequences of the clopyralid exposure to the susceptible
weeds. H2O2 generated by hydroxyl radicals resulted in lipid
peroxidation and oxidative damage (Dat et al., 2000). It
seems that thylakoid membrane electron leakage and
oxidative damage of thylakoid phospholipid membrane of the
chloroplasts interrupts the electron transport chain (Z
scheme) from PSII to PSI and this interruption of the Z
scheme will change the shape of the Kautsky curves (Dayan
and Zaccaro, 2012). Avarseji et al (2012) indicated that the
usage of dicamba + 2, 4-D an auxin herbicide, changed the
shape of the Kautsky curves two days after spraying (DAS).
Abbaspoor and Streibig (2005) reported chlorophyll
fluorescence halted after the P step in oat leaves by
clodinafop application after seven DAS. Results showed that
parameters derived from Kautsky curves had different
variations as well. FV/Fm parameter was stable, whereas Fvj
and area reduced in both species. Abbaspoor and Streibig
(2007) described the relative changes at the J step (Fvj) have
also proved to useful parameters to discern effects of
herbicides with other modes of action. Christensen et al.
(2003); Abbaspoor and Streibig (2005; 2007) showed the
Fv/Fm may not be the most sensitive parameter when early
detection of fluorescence emission changes is required for
herbicides with modes of action other than that of PSII
inhibition. Abbaspoor and Streibig (2006) also reported that
by spraying desmedipham, phenmedipham or a mixture of
both, the Fvj and area parameters were much more sensitive
than Fv/Fm measured in black nightshade and sugar beet.
Furthermore based on the results, a good relationship was
observed between dry matter and fluorescence parameters.
Similar relation was previously reported in fluorescence
parameters and dry matter for bentazone, desmedipham and
phenmedipham (a PSII inhibitor) (Christensen et al., 2003;
Abbaspoor and Streibig, 2007) and for glyphosate and
clodinafop (non-PSII inhibitors) (Teicher et al., 2002;
Abbaspoor and Streibig, 2005). Using these fluorescence
parameters may suggest a rapid, noninvasive and cost-
effective option to eliminate the need for whole plant
bioassay screenings.
Materials and methods
Plant materials
Seeds of common lambsquarters (Chenopodium album L.)
and black nightshade (Solanum nigrum L.) were collected
from sugar beet fields in Mashhad, Iran, and grown in 2
litre pots filled with mixture of a sandy-loam soil, sand and
peat (1:1:1wt/wt/wt), containing all necessary macro-and
micro-nutrients. The experiments were conducted during a
three-month period from April to June 2013 at the Research
Greenhouse in Faculty of Agriculture, Ferdowsi University
of Mashhad, Iran (Lat 36° 15' N, Long 59° 28' E; 985 m
Altitude). The photoperiod was 16:8 h light:dark and
temperature ranges were approximately 15 ± 1°C at night and
23 ± 2°C during the day. Four high-pressure sodium vapor
lamps (Osram Sylvania, Lynn, MA, USA, 400 W, 55 000
lumens) were installed 2 m above the plants to accommodate
the photoperiod as mentioned above. Plants were tinned to
four plants per pot at cotyledon stage.
Chemical treatments and experimental design
Two independent experiments for common lambsquarters
and black nightshade were conducted for three herbicides
simultaneously, each of which consisted of a dose–response
curves with seven doses plus an untreated check. The
herbicides and doses were used for each, included of 1)
desmedipham + phenmedipham + ethofumesate (Betanal
Progress- OF®, 274 mg L-1, Bayer Crop Science) at 0, 51.38,
102.75, 205.5, 308.25, 411, 616.5 and 822 mg ai ha−1, 2)
chloridazon (Pyramin®, 650 g L-1,BASF A/S) included of 0,
81.25, 162.5, 325, 650, 1300, 1950 and 2600 g ai ha−1 and 3)
clopyralid doses were (Lontrel® 300 mg L-1, Golsam Gorgan
Chemicals Corporation, Gorgan, Iran) were: 0, 15, 30, 60, 90,
120, 180 and 240 mg ai ha−1. Spraying was done using
overhead trolley sprayer (Matabi 121030 Super Agro 20 litre
sprayer; Agratech Services-Crop®, Spraying Equipment,
Rossendale, UK), 8002 flat-fan nozzle at 300 kPa and a spray
volume of 200 Lha-1. The plants were treated 21 days (at the
four- to six-true leaf stage) after planting. Altogether, 42
treatments were used for common lambsquarters and black
831
832
Fig 4. The relationship between dry matter and chlorophyll fluorescence parameters (FV/Fm, FVj and area) at 24 h after spraying
[HAS] in two experiments. (Left, common lambsquarters sprayed by desmedipham + phenmedipham + ethofumesate in the first
experiment; right, black nightshade sprayed by chloridazon in the second experiment).
nightshade with three replications (i.e. totally 126
experimental units including check arranged) in completely
randomized layout.
Chlorophyll fluorescence assays
Chlorophyll fluorescence measurements were carried out on
dark-adapted leaves at the same stages of development
among pots. Fluorescence emissions were measured using a
portable chlorophyll fluorometer (Handy-PEA; Hansatech
Instruments, King’s Lynn, Norfolk, UK), which emits light
of 650 nm wavelength with an intensity of 3000 µmol
photons m−2 s−1 for 10s.
Leaves were dark adapted for a minimum of 30 min prior to
measurement. The fluorescence measurements were taken 4
hours after spraying (HAS) for common lambsquarters and
black nightshade and again at 24, 48, 72 and 168 HAS.
The Kautsky curves were visually examined for the effects of
time and dose (Rodriguez and Strasser, 2002) by the
BIOLYZER program with OJIP steps as fix points. The most
important parameters derived from the Kautsky curve were:
(i) FV/Fm, maximum quantum efficiency of PS II (FV/Fm =
(Fm – Fo)/Fm), (ii) FVj, the relative changes at the J step (Fvj =
(Fm - Fj)/Fm), where Fm was the maximum fluorescence, F0
was ground state fluorescence and Fj was Fluorescence at J
step and (iii) Area (area between Kautsky curve and Fm).
First experiment
Common lambsquarters
Second experiment
Black nightshade

833
Three week after spraying (WAS), plants were harvested and
their dry weights were measured.
Statistical analysis
If a significant dose effect was found, data were described by
a log-logistic dose–response model against dose (Devilliers et
al, 2001; Cedergreen et al., 2005):
50loglogexp1 EDzb
dU
Where U is the dry matter production at dose z, d is the upper
limit where the dose is zero, ED50 denotes the dose required
for reducing dry matter by half and b is proportional to the
slopes of the curves around ED50. The ED50 parameter can be
replaced by any ED level, so the selected model was used to
estimate the dose of herbicides required to obtain 50% and
90% weed control (ED50 and ED90 values) when applied
individually. The goodness-of-fit was assessed by graphical
analyses of residuals and the tests for lack of fit of the
models, and the biomass data were Box-Cox transformed to
obtain variance homogeneity (Streibig et al. 1993). Data were
analyzed by R statistical software (R Development Core
Team, 2011) and the R extension package drc.
Assuming that ZA and ZB are the doses of herbicide A (PS II
inhibitor herbicides) and B (Clopyralid) producing for
example a 50% effect, i.e. the ED50 doses, the relative
potency between the herbicides (function 2) was calculated
as:
B
A
Z
ZR
The relative potency between herbicides A and B expresses
the biological exchange rate between herbicides when
applied separately (Streibig et al. 1993).
Conclusion
In conclusion, various fluorescence parameters can be used to
describe the shape and change of Kautsky curves in different
plant species. In this paper we focused on common
fluorescence parameters for three tested herbicides. The
parameter Fv/Fm seems to be less sensitive to detecting
changes than are Fvj and area. Also, other or a combination of
Kautsky curve parameters can be used for herbicides which
do not directly affect the PSII system (Teicher et al., 2002).
Thus, Fvj and area should be used as an early response
parameter of herbicides action; it must be linked to the dry
matter production used in classic assays, regardless of the
herbicide ratio. In this method, the analysis of the Kautsky
curve could enable weed scientist to increase their knowledge
of the mechanisms of action primary differing inhibitory
herbicides, and it also provides plant physiologists with a
vital tool to widen their understanding of photosynthetic
processes.
Acknowledgments
The authors would like to thank the Faculty of Agriculture,
Ferdowsi University of Mashhad, Mashhad, Iran, for
financial support and providing experimental facilities in this
research. We would like to tank Prof. Mehdi Nassiri
Mahallati for statistical analysis advices and Mrs. Mahbubeh
Nabizade Noghundar who provided valuable assistance in
conducting this research.
References
Abbaspoor M, Streibig JC (2005) Clodinafop changes the
chlorophyll fluorescence induction curve. Weed Sci. 53: 1-
9.
Abbaspoor M, Streibig JC (2007) Monitoring the efficacy
and metabolism of phenylcarbamates in sugar beet and
black nightshade by chlorophyll fluorescence parameters.
Pest Manag Sci. 63: 576-585.
Abbaspoor M, Teicher HB, Streibig JC (2006) The effect of
root-absorbed PSII inhibitors on Kautsky curves
parameters in sugar beet. Weed Res. 46: 226-235.
Abdollahi F, Ghadiri H (2004) Effect of separate and
combined applications of herbicides on weed control and
yield of sugar beet. Weed Technol. 18: 968-976.
Appenroth KJ, Stockel J, Srivastava A, Strasser RJ (2000)
Multiple effects of chromate on the photosynthesis
apparatus of Spirodela polyrhizaas probed by OJIP
chlorophyll A fluorescence measurements. Environ Pollut.
115: 49-64.
Avarseji Z, Rashed Mohassel MH, Nezami A, Abbaspoor M,
Nassiri Mahallati M (2012) Dicamba + 2, 4-D affects the
shape of the Kautsky curves in wild mustard (Sinapis
arvensis). Plant Knowl J. 1: 41-45.
Baker NR, Rosenqvist E (2004) Applications of chlorophyll
fluorescence can improve crop production strategies: An
examination of future possibilities. J Exp Botany. 55: 1607-
1621.
Barbagallo RP, Oxborough K, Pallett KE, Baker NR (2003)
Rapid, non-invasive screening for perturbations of
metabolism and plant growth using chlorophyll
fluorescence imaging. Plant Physiol. 132: 485-493.
Blowers MH (1989) Applications of chlorophyll fluorescence
to study the penetration of herbicides into leaves. Ph.D
thesis. University of Essex, Colchester, United Kingdom.
Bolhar-Nordenkampf HR, Oquist G (1993) Chlorophyll
fluorescence as a tool in photosynthesis research. In: Hall
DO, Scurlock JMO, Bolhar-Nordenkampf HR, Leegood
RC, Long SP (eds) Photosynthesis and production in a
changing environment: a field and laboratory manual,
Chapman and Hall, London, p 193-206.
Bosak P, Lajos K, Lajos M (2001) Phytotoxicity studies in
sugar beet. Novenytermeles. 50: 61-69.
Cedergreen N, Andersen L, Olesena CF, Spliid HH, Streibig
JC (2005) Does the effect of herbicide pulse exposure on
aquatic plants depend on Kow or mode of action? Aquatic
Toxicol. 71: 261-271.
Christensen MG, Teicher HB, Streibig JC (2003) Linking
fluorescence induction curve and biomass in herbicide
screening. Pest Manag Sci. 59: 1303-1310.
Cobb AH, Reade JPH (2010) Herbicides and Plant
Physiology. 2nd edn. Wiley-Blackwell, West Sussex,
United Kingdom.
Cornic G, (2000) Drought stress inhibits photosynthesis by
decreasing stomatal aperture- not affecting ATP synthesis.
Trends Plant Sci. 5: 187-188.
Crudace AJ (2000) The investigation of the in vivo behavior
of a maize herbicide-Isoxaflutole. Ph.D Thesis. University
of Essex. Colchester, United Kingdom.
Daley PF (1995) Chlorophyll fluorescence analysis and
imaging in plant stress and disease. Can J Plant Pathol. 17:
167-173.
Dat J, Vandenabeele S, Vranova E, Van Montagu M, Inze D,
Van Breusegem F (2000) Dual action of the active oxygen
species during plant stress responses. Cell Mol Life Sci. 57:
779-795.
(1)
(2)

833
Dayan FE, Zaccaro ML (2012) Chlorophyll fluorescence as a
marker for herbicide mechanisms of action. Pest Biochem
Physiol. 102: 189-197.
Devilliers BL, Kuds P, Smit JJ, Mathiassen SK (2001)
Tralkoxydim: adjuvant, MCPA and other effects. Weed
Res 41: 547-556.
Force L, Critchey C, Rensen JV (2003) New fluorescence
parameters for monitoring photosynthesis in plants.
Photosynth Res. 78: 17-33.
Fufezan C, Rutherford AW, Liszkaya AK (2002) Singlet
oxygen production in herbicide-treated photosystem II.
FEBS Letters. 532: 407-410.
Govindjee A (1995) Sixty-three years since Kautsky-
chlorophyll-a fluorescence. Aust J Plant Physiol. 22: 131-
160.
Govindjee A, Xu C, Schansker G, Rensen JV (1997)
Chloroacetates as inhibitors of photosystem II: effects on
electron acceptor side. J Photochem Photobiol. 37: 107-
117.
Grossmann K, Kwiatkowski A, Tresch S (2001) Auxin
herbicides induce H2O2 overproduction and tissue damage.
J Exp Botany. 52: 1811-1816.
Habash D, Percival MP, Baker NR (1985) Rapid chlorophyll
fluorescence technique for the study of penetration of
photosynthetically active herbicides into leaf tissue. Weed
Res. 25: 389-395.
Hess FD (2000) Light-dependent herbicides: an overview.
Weed Sci. 48: 160-170.
Horgan DB, Zabkiewicz JA (2008) Fluorescence decline
ratio: comparison with quantum yield ratio for plant
physiological status and herbicide treatment response. NZ
Plant Prot. 61: 169-173.
Ikeda Y, Shinpei O, Kazuya K, Akira T, Hiroyuki W, Hitoshi
K, Van Rensen JJS, Böger P, Wakabayashi K (2003)
Binding site of novel 2-benzylamino-4-methyl-6-
trifluoromethyl-1, 3, 5-triazine herbicides in the D1 protein
of Photosystem II. Photosynth Res. 77: 35-43.
Kohno H, Ohki A, Ohki S, Koizumi K, Van den Noort ME,
Rodrigues G C, Van Rensen JJS, Wakabayashi K (2000)
Low resistance against novel 2-benzylamino-1,3,5- triazine
herbicides in atrazine-resistant Chenopodium album plants.
Photosynth Res. 65: 115-120.
Markovska LV, Ilievska BP, Vodeb L (2012) RP-HPLC-
DAD method for simultaneous determination of
desmedipham, phenmedipham and ethofumesate in a
pesticide formulation. Maced J Chem Eng. 3: 39-46.
Matouskova M, Naus J, Flasarova M (1999) A long-term
response of chlorophyll fluorescence induction to one-shot
application of cyanazine on barley plants and its relation to
crop yield. Photosynth. 37: 281-294.
Maxwell K, Johnson GN (2000) Chlorophyll fluorescence- a
practical guide. J Exp Botany. 51: 59-668.
Meyer JW, Branham BE (2006) Response of four turfgrass
species to ethofumesate. Weed Technol. 20:123-129.
Percival MP, Baker NR (1991) Herbicides and
photosynthesis. In: Baker NR Percival MP (eds)
Herbicides, London, p 1-26.
Percival MP, Blowers MH, Green JW, Baker NR (1992)
Chlorophyll fluorescence- a noninvasive technique for
rapid investigation of the effects of adjuvants on herbicide
and plant growth regular uptake by leaves. In: Foy CF (eds)
Adjuvants for Agrichemicals, CRC Press, London, UK. p
187-193.
R Development Core Team (2011) A Language and
Environment for Statistical Computing. R Foundation for
Statistical computing, Vienna, Austria.
Rodriguez R, Strasser R (2002) The Laboratory of
Bioenergetics. University of Geneva, Switzerland.
http://www.unige.ch/sciences/biologie/bioen/main1.html.
Rouchaud J, Neus O, Hermann O (1997) Influence of
application rate and manure amendment on chloridazon
dissipation in the soil. Weed Res. 37: 121-127.
Starke RJ, Renner KA (1996) Velvetleaf (Abutilon
theophrasti) and sugar beet (Beta vulgaris) response to
triflusulfuron and desmedipham plus phenmedipham.
Weed Technol. 10:121-126.
Strasser RJ, Srivastava A, Tsimilli-Michael M (2000) The
fluorescence transient as a tool to characterise and screen
photosynthetic samples. In: Yunus M, Pathre U, Mohanty P
(eds) Probing Photosynthesis: Mechanisms, Regulation and
Adaptation, Taylor & Francis Press, London, UK, p 445-
483.
Strasser RJ, Stirbet AD (2001) Estimation of the energetic
connectivity of PSII centres in plants using the
fluorescence rise O-J-I-P; fitting of experimental data to
three different PSII models. Math Comput Simulat. 56:
451- 461.
Streibig JC, Rudemo M, Jensen JE (1993) Dose-response
curves and statistical models. In: Streibig JC, Kudsk P (eds)
Herbicide Bioassays. CRC Press, London, UK, p 29–55.
Taylor FE, Davies LG, Cobb AH (1981). An analysis of the
epicuticular wax of Chenopodium album leaves in relation
to environmental change, leaf wet ability and the
penetration of the herbicide bentazone. Annu Appl Biol.
98: 471-478.
Teicher HB, Madsen KH, Jensen JE, Streibig JC (2002)
Rapid assessment of glyphosate translocation by the
fluorescence induction curve. Paper presented at the 10rd
10th IUPAC International Congress on the Chemistry of
Crop Protection, Basel, Switzerland, 4–7 June 2002.
Tu M, Hurd C, Robison R, Randall JM (2001) Clopyralid,
Weed Control Methods Handbook. In: Tu M, Hurd C,
Randall JM (eds) Weed Control Methods Handbook: Tools
and Techniques for Use in Natural Areas, The Nature
Conservancy. Available at: http://tncweeds.ucdavis.edu, p
97-102.
Van Rensen JJS, Xu C, Govindjee A (1999) Role of
bicarbonate in photosystem II, the water-plastoquinone
oxido-reductase of plant photosynthesis. Physiol Plant.
105: 585-592.
834