corrosion fatigue behavior of aisi 4340 steel coated … · this research investigates the...
TRANSCRIPT

i
CORROSION FATIGUE BEHAVIOR OF AISI 4340 STEEL COATED WITH
CADMIUM AND ZINC-NICKEL WITH AND WITHOUT SCRIBED DAMAGE
IN SALTWATER ENVIRONMENT
THESIS
Riyadh A. Alzahrany, Captain, RSAF
AFIT-ENY-MS-17-S-001
DEPARTMENT OF THE AIR FORCE
AIR UNIVERSITY
AIR FORCE INSTITUTE OF TECHNOLOGY
Wright-Patterson Air Force Base, Ohio
DISTRIBUTION STATEMENT A APPROVED FOR PUBLIC RELEASE; DISTRIBUTION UNLIMITED

ii
The views expressed in this thesis are those of the author and do not reflect the official policy or position of the United States Air Force, Department of Defense, or the United States Government. This material is declared a work of the U.S. Government and is not subject to copyright protection in the United States.

iii
AFIT-ENY-MS-17-S-001
APPROVED FOR PUBLIC RELEASE; DISTRIBUTION IS UNLIMITED
CORROSION FATIGUE BEHAVIOR OF AISI 4340 STEEL COATED WITH
CADMIUM AND ZINC-NICKEL WITH AND WITHOUT SCRIBED DAMAGE
IN SALTWATER ENVIRONMENT
THESIS
Presented to the Faculty
Department of Aeronautics and Astronautics
Graduate School of Engineering and Management
Air Force Institute of Technology
Air University
Air Education and Training Command
Riyadh A. Alzahrany
Captain, Royal Saudi Air Force
September
2017
DISTRIBUTION STATEMENT A APPROVED FOR PUBLIC RELEASE; DISTRIBUTION UNLIMITED
iv
AFIT-ENY-MS-17-S-001
CORROSION FATIGUE BEHAVIOR OF AISI 4340 STEEL COATED
WITH CADMIUM AND ZINC-NICKEL WITH AND WITHOUT SCRIBED
DAMAGE IN SALTWATER ENVIRONMENT
Riyadh A. Alzahrany
Captain, Royal Saudi Air Force
Committee Membership:
Dr. Shankar Mall, PhD Chair
Dr. Volodymyr Sabelkin, PhD Member
Dr. Abhendra K. Singh, PhD Member

iv
Abstract
This research investigates the corrosion fatigue behavior of AISI 4340 high-
strength steel coated with electroplated Cadmium and Zinc-Nickel in order to evaluate
the possibilities of replacing Cadmium coating with Zinc-Nickel coating. Also, the
research investigates the possibility of hydrogen re-embrittlement in the material after
scribed damage in the coating layer. The specimens were tested under tension-tension
fatigue conditions with a stress ratio of 0.1 and a load frequency of 10 Hz with and
without scribed damage in coatings under a salt water environment. The salt water
environment consisted of 3.5 wt. % Sodium Chloride at room temperature.
Microstructural analysis of the fractured surfaces was performed in order to understand
the effects of corrosion fatigue on crack initiation and growth. The fatigue life for Zinc-
Nickel coated specimens with and without scribed damage was longer than the fatigue
life for Cadmium coated specimens with and without scribed damage. The corrosion
fatigue performance for Zinc-Nickel coated specimens with and without scribed damage
was better than that of Cadmium coated specimens with and without scribed damage.
There was no difference in the fatigue life between Zinc-Nickel coated specimens with
and without scribe damage for both coatings. The scribed damage in Cadmium coated
specimens and Zinc-Nickel coated specimens did not cause any obvious effect, such as
hydrogen re-embrittlement.

v
Acknowledgments
First of all, I would like to thank Dr. Shankar Mall for his help and guidance as
my thesis adviser during my term at AFIT. Secondly, I would like to thank Dr.
Volodymyr Sabelkin for all his help, especially in the experimental work and thesis
write-up of my research. The knowledge passed on to me by him on how to use the test
machine and preparation and testing of the specimens was of immense help. Last, but not
the least, I would like to thank Dr. Abhendra K. Singh for his insightful ideas on certain
aspects of my research as well as helping in my thesis write-up. Finally, I would like to
thank my family, especially my wife, as without their love, support and patience I would
not have been able to finish my master research successfully.

vi
Table of Contents
Abstract ............................................................................................................................... iv
Acknowledgments................................................................................................................ v
List of Figures ................................................................................................................... viii
List of Tables .................................................................................................................... xiv
List of Symbols .................................................................................................................. xv
List of Acronyms .............................................................................................................. xvi
I. Introduction ............................................................................................................... 17
1.1 Cadmium Coating and Health ................................................................................ 18
1.2 Zinc-Nickel Coating............................................................................................... 19
1.3 The Problem Statement .......................................................................................... 20
II. Background and Literature Review ....................................................................... 21
2.1 Corrosion................................................................................................................ 21
2.2 Corrosion Fatigue................................................................................................... 22
2.3 Corrosion Protecting Coatings ............................................................................... 23
2.4 Hydrogen Embrittlement ....................................................................................... 24
2.5 Previous Research .................................................................................................. 26
III. Material and Test Specimen................................................................................... 28
3.1 Material .................................................................................................................. 28

vii
3.2 Specimen Geometry and Test Matrix .................................................................... 31
IV. Experimental Setup and Test method .................................................................... 32
4.1 Mechanical Testing Equipment ............................................................................. 32
4.2 Preparation of the Specimen .................................................................................. 33
4.3 Mechanical Test Procedures .................................................................................. 35
V. Results and Discussions............................................................................................. 41
5.1 Experimental Results ............................................................................................. 41
5.2 Analysis of the Results........................................................................................... 46
5.2.1 Fatigue data ................................................................................................. 46
5.2.2 Corrosion fatigue behavior ......................................................................... 56
5.2.3 Hydrogen re-embrittlement ......................................................................... 65
5.2.4 Previous research comparisons ................................................................... 69
VI. Conclusions and Recommendation ........................................................................ 75
Appendix A: Additional Fatigue plots .............................................................................. 77
Appendix B: Test Specimens ............................................................................................ 87
Appendix C: Test Equipment............................................................................................ 90
Reference .......................................................................................................................... 94

viii
List of Figures
Figure 1. Steel places in the aircraft structure (Anft, 2007).............................................. 18
Figure 2. Steel percentage in the aircraft materials (Hadcock, 1903). .............................. 18
Figure 3. Cadmium toxicity. ............................................................................................. 19
Figure 4. Corrosion cost in USA....................................................................................... 21
Figure 5. The fatigue crack stages (Totten, 2008). ........................................................... 22
Figure 6. S-N curves of steel subjected to cyclic stresses (Revie & Uhlig, 2008). .......... 23
Figure 7. Electroplating process (Lou & Huang, 1978).................................................... 24
Figure 8. Applied stress versus fracture time diagram for high strength steel during
several bake hours (Rogers, 1968). ................................................................................... 25
Figure 9. Stress range versus number of failure cycles curve for Zinc-Nickel coated
without and with scribed damage and Cadmium coated without and with scribed damage
at 1 Hz and 10 Hz (Sabelkin et al., 2016). ........................................................................ 27
Figure 10. EDM process (Hou, 2014). .............................................................................. 29
Figure 11. Specimen with Zinc-Nickel coating. ............................................................... 30
Figure 12. Specimen with Cadmium coating. ................................................................... 31
Figure 13. The geometry of test specimen. ....................................................................... 31
Figure 14. Test machine components: (1) load cell, (2) passive upper grip, (3) active
lower grip, (4) emergency stop button, (5) grip pressure gauge, (6) grip pressure adjuster,
(7) upper grip controller, (8) lower grip controller, (9) control system, (10) lamp (11)
frame. ................................................................................................................................ 32
Figure 15. File used for scribe damage. ............................................................................ 33

ix
Figure 16. A- Cadmium specimen, B- Zinc-Nickel specimen. ......................................... 33
Figure 17. Specimen preparation: A- Zinc-Nickel coated specimen, B- Cadmium coated
specimen, 1- copper foil pads, 2- environmental box, 3- spill safe container. ................. 34
Figure 18. Specimen installed on the test machine: 1- load cell, 2- specimen ................. 35
Figure 19. Fractured specimens for (a) Cadmium coated specimen and (b) Zinc-Nickel
coated specimen. ............................................................................................................... 41
Figure 20. Stress range versus the number cycles to fail for Cadmium coated without
scribe damage specimens. The small arrows show that specimens did not fail. .............. 42
Figure 21. Stress range versus number of failure cycles for Zinc-Nickel coated specimens
without scribe damage. ..................................................................................................... 43
Figure 22. Stress range versus number of failure cycles for Cadmium coated specimens
with scribe damage. .......................................................................................................... 44
Figure 23. Stress range versus number of failure cycles for Zinc-Nickel coated specimens
with scribe damage (the small arrow shows that specimen was survived). ...................... 45
Figure 24. Cadmium coated specimens without scribe damage at 2 million cycles. ........ 47
Figure 25. Cadmium coated specimens without scribe damage at stress range of 800
MPa. .................................................................................................................................. 47
Figure 26. Zinc-Nickel coated specimens without scribe damage at 2 million cycles. .... 48
Figure 27. Zinc-Nickel coated specimens without scribe damage at stress range of 800
MPa. .................................................................................................................................. 49
Figure 28. Cadmium coated specimens with scribe damage at 2 million cycles. ............. 50
Figure 29. Cadmium coated specimens with scribe damage at stress range of 800 MPa. 50

x
Figure 30. Zinc-Nickel coated specimens with scribe damage at 2 million cycles. ......... 51
Figure 31. Zinc-Nickel coated specimens with scribe damage at stress range of 800 MPa.
........................................................................................................................................... 52
Figure 32. Fatigue life diagram for Cadmium coated specimens at 2 million cycles. ...... 53
Figure 33. Fatigue life diagram for Cadmium coated specimens at stress range of 800
MPa. .................................................................................................................................. 53
Figure 34. Fatigue life diagram for Zinc-Nickel coated specimens at 2 million cycles. .. 54
Figure 35. Fatigue life diagram for Zinc-Nickel coated specimens at stress range of 800
MPa. .................................................................................................................................. 54
Figure 36. Fatigue life diagram for all test specimens. ..................................................... 55
Figure 37. Fatigue life diagram of Zinc-Nickel coated specimens. .................................. 57
Figure 38. Fatigue life diagram for Cadmium coated specimens. .................................... 58
Figure 39. The fatigue life diagram for Cadmium coated specimens with scribe damage
and Zinc-Nickle coated specimens with scribe damage. .................................................. 59
Figure 40. Test specimens for microstructure analysis, A. Cadmium coated, B. Zinc-
Nickel coated. ................................................................................................................... 60
Figure 41. Fracture surface of test specimen at 10 mm zoom focus ................................. 60
Figure 42. Fracture surface for Zinc-Nickel coated specimen without scribe damage
showing (A) fatigue crack growth region, (B) transition region and (C) intergranular
cracking region.................................................................................................................. 61

xi
Figure 43. Fracture surface for Zinc-Nickel coated specimen with scribe damage showing
(A) fatigue crack growth region, (B) transition region and (C) intergranular cracking
region. ............................................................................................................................... 62
Figure 44. The fracture surface of Cadmium coated specimen without scribe damage
showing (A) fatigue crack growth region, (B) transition region and (C) intergranular
cracking region.................................................................................................................. 63
Figure 45. The fracture surface of Cadmium coated specimen with scribe damage (A)
showing fatigue crack growth region, (B) transition region and (C) intergranular cracking
region. ............................................................................................................................... 64
Figure 46. Stress range versus number of failure cycles diagram for Zinc-Nickel coated
specimens. ......................................................................................................................... 66
Figure 47. Stress range versus number of failure cycles diagram for Cadmium coated
specimens. ......................................................................................................................... 66
Figure 48. Specimen with Zinc-Nickel coating. ............................................................... 67
Figure 49. The region between the transition and intergranular cracking, (A) Cadmium
coated specimens without scribe damage, (B) Zinc-Nickel coated specimens without
scribe damage, (C) Cadmium coated specimens with scribe damage and (D) Zinc-Nickel
coated specimens with scribe damage. ............................................................................. 68
Figure 50. The fatigue life diagram for all specimens plotted as stress range at the root of
the notch vs. number of cycles to failure. ......................................................................... 69
Figure 51. The fatigue life diagram plotted as stress range at the root of the notch vs.
number of cycles to fail (Sabelkin et al., 2016). ............................................................... 70
xii
Figure 52. The fatigue life diagram for all specimens plotted as Maximum stress vs. time
to fail diagram. .................................................................................................................. 71
Figure 53. Maximum stress vs. time to fail diagram (Sabelkin et al., 2016). ................... 72
Figure 54. Stress range at the root of the notch versus number of cycles to failure for
stress ratio of -0.3 and 0.1. ................................................................................................ 73
Figure 55. Stress range at the root of the notch versus number of cycles to failure for
specimens at 10 Hz and 1 Hz. ........................................................................................... 74
Figure 56. Maximum stress vs. time to fail diagram for specimens at 10 Hz and 1 Hz. .. 74
Figure 57. Maximum stress vs. number of failure cycle diagram for Zinc-Nickel coated
specimens with and without scribe damage. ..................................................................... 77
Figure 58. Maximum stress vs. number of failure cycle diagram for Cadmium coated
specimens with and without scribe damage. ..................................................................... 78
Figure 59. Maximum stress vs. number of failure cycle diagram for Zinc-Nickel coated
specimens without scribe damage and Cadmium coated specimens without scribe
damage. ............................................................................................................................. 79
Figure 60. Maximum stress vs. number of failure cycle diagram for Zinc-Nickel coated
specimens with scribe damage and Cadmium coated specimens with scribe damage. .... 80
Figure 61. Maximum stress vs. time to fail diagram for Zinc-Nickel coated specimens
with and without scribe damage. ...................................................................................... 81
Figure 62. Maximum stress vs. time to fail diagram for Cadmium coated specimens with
and without scribe damage. ............................................................................................... 82

xiii
Figure 63. Maximum stress vs. time to fail diagram for Zinc-Nickel coated specimens
without scribe damage and Cadmium coated specimens without scribe damage. ........... 83
Figure 64. Maximum stress vs. time to fail diagram for Zinc-Nickel coated specimens
with scribe damage and Cadmium coated specimens with scribe damage. ...................... 84
Figure 65. Maximum stress vs. time to fail diagram for all test specimens. .................... 85
Figure 66. Stress range versus number of failure cycle diagram for all test specimens. .. 86
Figure 67. Cadmium coated specimens. ........................................................................... 87
Figure 68. Zinc-Nickel coated specimens. ........................................................................ 88
Figure 69. Zinc-Nickel coated specimens prepared for SEM analysis. ............................ 89
Figure 70. Cadmium coated specimens prepared for SEM analysis. ............................... 89
Figure 71. MTS 810 servo-hydraulic machine. ................................................................ 90
Figure 72. AQ537L wire electrical discharge machine (EDM): 1- cutting wire 2-
specimen. .......................................................................................................................... 91
Figure 73. External view of Quanta 450 scanning electron microscope (SEM). ............. 92
Figure 74. Internal view of Quanta 450 scanning electron microscope (SEM): 1- test
specimen 2- specimen mount. ........................................................................................... 93

xiv
List of Tables
Table 1. AISI 4340 heat treatment process (Fletcher Building, 2008). ............................ 28
Table 2. Rockwell scale. .................................................................................................. 28
Table 3. Stress concentration factor (Young & Budynas, 2002). ..................................... 37
Table 4. Cadmium coated specimens without scribe damage .......................................... 38
Table 5. Zinc-Nickel coated specimens without scribe damage ....................................... 38
Table 6. Cadmium coated specimens with scribe damage ............................................... 38
Table 7. Zinc-Nickel coated specimens with scribe damage ............................................ 39
Table 8. Test data for Cadmium coated specimens without scribe damage. .................... 42
Table 9. Test data for Zinc-Nickel coated specimens without scribe damage. ................. 43
Table 10. Experimental data for Cadmium coated specimens with scribe damage.......... 44
Table 11. Experimental data for Zinc-Nickel coated specimens with scribe damage. ..... 45

xv
List of Symbols
Symbol Description
t Thickness of specimen (𝑚𝑚𝑚𝑚)
w Width of specimen (𝑚𝑚𝑚𝑚)
σ Stress (MPa)
Kt Stress concentration factor
A Total area (𝑚𝑚𝑚𝑚2)
σnom Nominal stress (MPa)
σmax Maximum stress (MPa)
σmin Minimum stress (MPa)
∆σ Stress range (MPa)
R Stress ratio
Nfail Number of cycles to failure
F Force (kN)

xvi
List of Acronyms
Acronym Description
AISI American Iron and Steel Institute
Cd Cadmium
Zn-Ni Zinc-Nickel
NaCl Sodium chloride
S-N Stress versus number of cycles
SP Shot peening
HE hydrogen embrittlement
H-RE hydrogen re-embrittlement
EDM Electrical discharge machining
UTS Ultimate tensile strength
wt. % Percentage by weight
EDM Electrical discharge machining
SEM Scanning electron microscope

17
CORROSION FATIGUE BEHAVIOR OF AISI 4340 STEEL COATED WITH
CADMIUM AND ZINC-NICKEL WITH AND WITHOUT SCRIBED DAMAGE IN
SALTWATER ENVIRONMENT
I. Introduction
High-strength steel is one of the materials that is used in many engineering applications.
The high-strength steel has a significant hardness which is why it is able to resist abrasion,
penetration, cutting action and permanent distortion. Also, the high-strength steel can resist
deformation and stresses without breaking. However, the high-strength steel cannot resist
corrosion effect by itself but need to be coated with a different material which can resist
corrosion. One of the common coating materials is Cadmium. The high-strength steel (AISI
4340) coated with Cadmium is used in many engineering applications including aircraft landing
gears to prevent detrimental corrosion effects (Sabelkin, Misak, & Mall, 2016). Also, it is used in
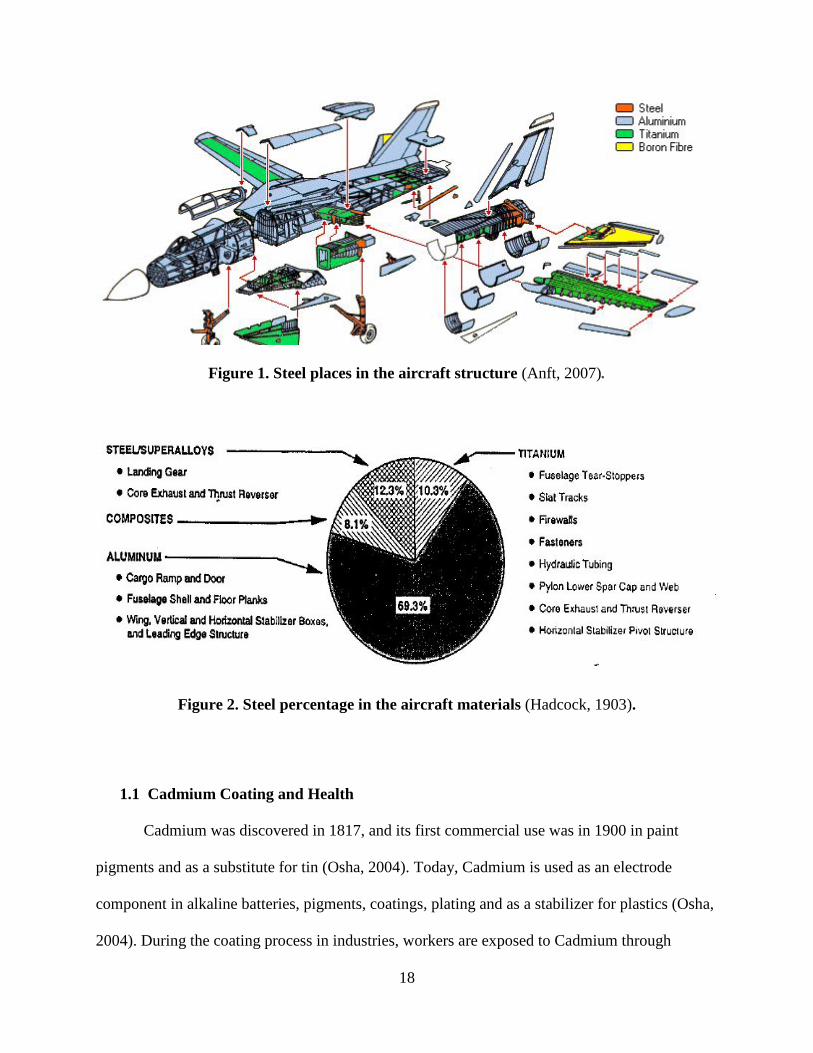
aircraft fasteners and some of the engine components. The high-strength steel locations in the
aircraft structure are shown in Figure 1. The use of steel in aircraft represents more than 12% of
the aircraft materials as is shown in Figure 2.
18
Figure 1. Steel places in the aircraft structure (Anft, 2007).
Figure 2. Steel percentage in the aircraft materials (Hadcock, 1903).
1.1 Cadmium Coating and Health
Cadmium was discovered in 1817, and its first commercial use was in 1900 in paint
pigments and as a substitute for tin (Osha, 2004). Today, Cadmium is used as an electrode
component in alkaline batteries, pigments, coatings, plating and as a stabilizer for plastics (Osha,
2004). During the coating process in industries, workers are exposed to Cadmium through

19
inhalation of dust and fumes, the smelting and refining of metals and the air in industrial plants
(Osha, 2004). The exposure to Cadmium causes lung cancer, prostate cancer, kidney
dysfunction, skin or eye irritation (Osha, 2004) and other issues as presented in Figure 3.
Figure 3. Cadmium toxicity.
The Agency for Toxic Substances and Disease Registry (ATSDR) predicts that more than
500,000 workers in the United States suffer from exposure to Cadmium each year (Osha, 2004).
As an alternative to Cadmium coating on high-strength steel, the Zinc-Nickel coating was the
choice due to its excellent corrosion resistance (Brown & Berman, 2011).
1.2 Zinc-Nickel Coating
Zinc-Nickel coating contained zinc and nickel and used for steel, cast iron, copper, and
brass to prevent corrosion. Zinc-Nickel coating is employed in different industries but most

20
commonly by automotive manufacturers. Zinc-Nickel coating is environmentally safe and has no
harmful impact on human health (Sriraman, Brahimi, Szpunar, Osborne, & Yue, 2013).
1.3 The Problem Statement
Due to the health effects of Cadmium coating on workers and environment, Zinc-Nickel
coating seems to be a good choice to replace Cadmium. In this research, experiments and tests
are done to verify the corrosion resistance and fatigue ability for AISI 4340 high-strength steel
coated with Cadmium and Zinc-Nickel. The research intends to find out whether the Zinc-Nickel
coating is a suitable replacement for Cadmium or not. Another concern is the damages in coating
due to various reasons. For example, the landing gear in an airplane could face a coating damage
due to foreign object hit, then during the aircraft wash, the hydrogen atoms could enter inside the
material and causes hydrogen re-embrittlement. So, in this work some of the test specimens were
scribe damaged, i.e. the coating was completely removed near the stress concentration location
and exposed to the saltwater environment to simulate a realistic behavior under cyclic loading.

21
II. Background and Literature Review
In this section, background information and literature review are presented on the
problem of corrosion of steel, corrosion fatigue and the ways that have been discussed to help
overcome it. The hydrogen embrittlement causes and effects are discussed as well. Also, some of
the previous researches regarding similar problems are considered in this section.
2.1 Corrosion
Corrosion is a phenomenon that occurs naturally and defined as the deterioration of
materials because of a reaction with its environment (Koch, Brongers, & Thompson, 2002). The
corrosion causes the material to lose its mechanical properties such as ductility and strength and
physical properties like electrical conductivity and could lead to fractures and failure of the
elements and whole assemblies. The United State Federal Highway Administration (FHWA)
estimated the total annual direct cost of corrosion in the U.S. by $276 billion which is
approximately 3.1% of the nation’s Gross Domestic Product (GDP) (Koch et al., 2002). Figure 4
shows the corrosion cost for each department in the USA.
Figure 4. Corrosion cost in USA (Koch et al., 2002).

22
There are different ways to prevent corrosion, one way is conditioning the metal by
coating or alloying, and another way is conditioning the environment by removal of the oxygen
or use corrosion inhibitors (Asworth, Booker, Charlton, & Fairhurst, 2012).
2.2 Corrosion Fatigue
Fatigue is a process that causes failure due to cyclic loading. Fatigue was first recognized
in 1800 in Europe after observing the bridge components cracked due to repeated loads
(Campbell, 2008). Fatigue can affect any moving or deformed part, and 90% of all mechanical
failures happened due to fatigue contributions (Campbell, 2008). Fatigue in metallic materials
goes through three stages; crack nucleation, crack propagation and failure (Kus & Diltemiz,
2016) as shown in Figure 5.
Figure 5. The fatigue crack stages (Totten, 2008).
Crack nucleation is the spark of the fatigue mechanism and can easily appear as a result
of environmental impacts (Kus & Diltemiz, 2016) such as corrosion. Corrosion fatigue is the
damage of a metallic structure due to repetitive loading cycles in the presence of a corrosive
environment. When the cyclic loading takes place in the corrosive environment, then the total
damage is much higher than the sum of damaging effects of corrosion and cyclic loading acting

23
separately (Revie & Uhlig, 2008). In a corrosive environment, failure at a given stress level
usually occurs within fewer cycles compared to air as shown in Figure 6 (Revie & Uhlig, 2008).
Figure 6. S-N curves of steel subjected to cyclic stresses (Revie & Uhlig, 2008).
There are different techniques to prevent a structural material from corrosion fatigue such
as shot peening (SP) which produces a thin layer of compressive residual stress near the surface
of the material to improve fatigue life and corrosion resistance (Scheel, Prevéy, & Hornbach,
2010). It is important to avoid notches, dents and the rough surface which leads to accelerating
the corrosion. Also, it is important to apply corrosion protecting coatings and remove
environmental factors that could cause corrosion in order to prevent or minimize corrosion
fatigue.
2.3 Corrosion Protecting Coatings
The coating is a cover applied to the surface of the metal to help protect against
corrosion. There are different coating processes such as vapor phase epitaxy, magnetron

24
sputtering, vacuum deposition and electroplating. Electroplating is an electrodeposition process
to produce a uniform, adherent and sufficiently thick coating (Lou & Huang, 1978). The
electroplating process is used widely in automotive, aerospace and general engineering industries
(Hardisty, Mileham, Shirvarni, & Bramley, 1993). The electroplating process is used for
corrosion prevention and beautiful finishes (Hardisty et al., 1993). Figure 7 shows the
electroplating process by soaking the metal, and the coating material inside a solution, then
applying electric power to them, so the coating material transfers to metal and makes a coating
layer. Electrical current reduces the dissolved metal cations in the plating process to form a
consistent metal coating on an electrode (Wang, 2014).
Figure 7. Electroplating process (Lou & Huang, 1978)
2.4 Hydrogen Embrittlement
The hydrogen embrittlement (HE) is a process that allows for hydrogen atoms to enter
inside a metal which makes it more brittle and sensitive to fracture nucleation. The HE happened
at the time of electroplating process, so it is recommended to apply a heat treatment (baking)

25
after electroplating which eliminates the hydrogen atoms from the metal and prevents HE. Figure
8 shows that the fracture time for high strength steel is delayed due to eliminating the hydrogen
atoms by increasing the bake hours (Rogers, 1968).
Figure 8. Applied stress versus fracture time diagram for high strength steel during several
bake hours (Rogers, 1968).
The hydrogen re-embrittlement (H-RE) happens with metal through its life cycle and
after the heat treatment. Notches, dents, and scratches on the surface of metal could cause the H-
RE. Many reasons cause damages to the coating and accelerate the corrosion such as scribing,
wearing and denting. One of the factors that threaten the aircraft structure are foreign objects
(Rogers, 1968). While flying or taxing those objects could hit the jet and causes damage to the
coating. The H-RE can appear when the metal loses its properties and has an abnormal failure.

26
So the inspection maintenance is critical to discover the damages and fix them before it is too
late. The electroplating process of Zinc-Nickel could cause embrittlement unless reformulated as
low hydrogen embrittlement (LHE) Zinc-Nickel (Brown & Berman, 2011).
2.5 Previous Research
Sriraman et al. (Sriraman et al., 2013)discussed the ability to resist corrosion for both
Cadmium and Zinc-Nickel coating. They applied three different techniques to examine the
corrosion behavior between the Cadmium coating and Zinc-Nickel coating. The first technique
involves measuring the open circuit potential, the second measuring the corrosion current and the
last technique involves measuring the coating resistance by electrochemical impedance
spectroscopy (Sriraman et al., 2013). After the examinations, they summarized that the Zinc-
Nickel coating has a better corrosion protection compared to Cadmium coating (Sriraman et al.,
2013).
Fatigue behavior testing for AISI 4340 coated with Cadmium and Zinc-Nickel in salt
water environment under tension-compression load was performed by Sabelkin et al.(Sabelkin et
al., 2016). The test specimens were categorized into four types: Zinc-Nickel coating without
scribe damage, Zinc-Nickel coating with scribe damage, Cadmium coating without scribe
damage and Cadmium coating with scribe damage. The purpose of scribe damage was to
examine the corrosion effect to the fatigue life and the possible appearance of H-RE. The test
was done under tension-compression load with a stress ratio of -0.3 and 1and a frequency of 10
Hz. The test specimens were exposed to a salt water solution of 3.5 wt. % Sodium chloride
(NaCl) during the experiments done by using MTS 810 servo-hydraulic testing machine. The
result showed that both coatings had provided extended corrosion life and almost similar fatigue
behavior. Also, the result indicates that the scribe damage on the coating had no signs of H-RE
27
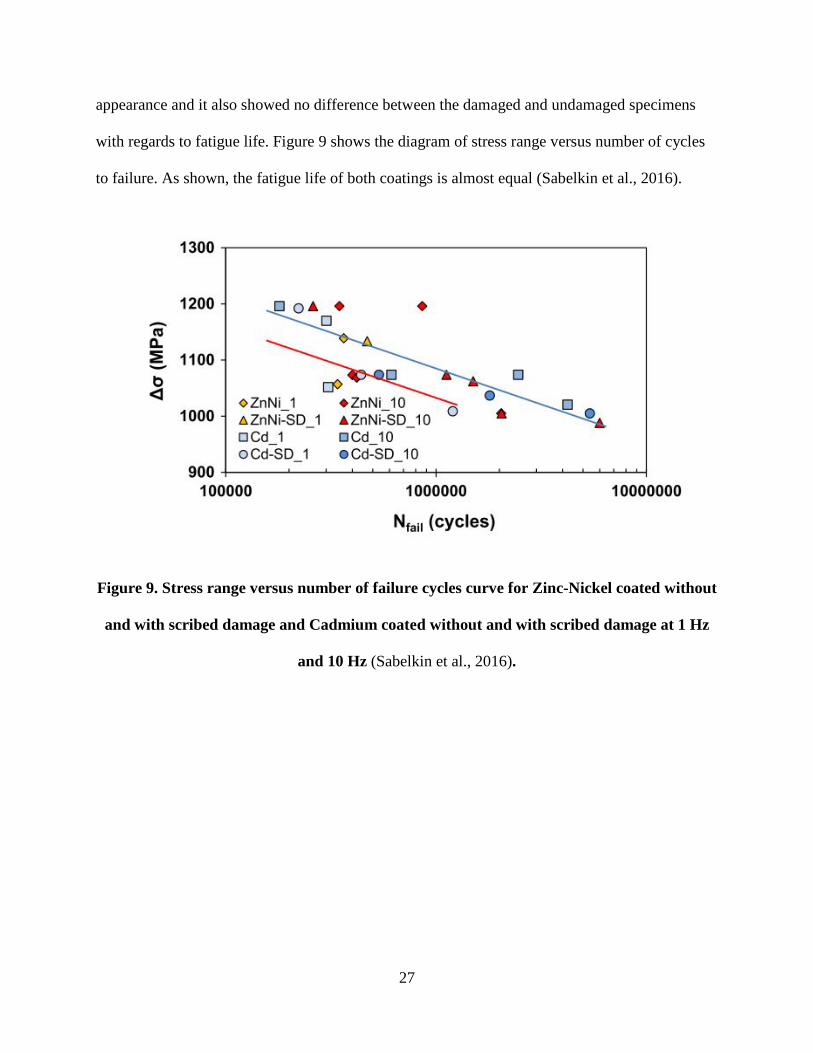
appearance and it also showed no difference between the damaged and undamaged specimens
with regards to fatigue life. Figure 9 shows the diagram of stress range versus number of cycles
to failure. As shown, the fatigue life of both coatings is almost equal (Sabelkin et al., 2016).
Figure 9. Stress range versus number of failure cycles curve for Zinc-Nickel coated without
and with scribed damage and Cadmium coated without and with scribed damage at 1 Hz
and 10 Hz (Sabelkin et al., 2016).

28
III. Material and Test Specimen
3.1 Material
The material of test specimens used in this research was AISI 4340 high-strength steel
coated with Cadmium and Zinc-Nickel. Specimens were heat treated to the hardness of Rockwell
C53 before being machined (Sabelkin et al., 2016). Heat treatment is defined as a combination of
heating and cooling operations applied to metals in the solid form to gain desired properties. The
heat treatment process for AISI 4340 described in Table 1.
Table 1. AISI 4340 heat treatment process (Fletcher Building, 2008).
Rockwell hardness is one of the most common measures of the hardness of metal
(Huyett, 2004). It has different level for various tempering temperatures as shown in Table 2.
Table 2. Rockwell scale.

29
After heat treatment, the electrical discharge machining (EDM) process is used to
machine the specimens to the designed configuration. The EDM is a material removal process by
converting the electrical energy to thermal energy through generated sparks between the tool and
the workpiece that separated by a dielectric fluid as shown in Figure 10 (Fletcher Building,
2008).
Figure 10. EDM process (Hou, 2014).
After EDM, the specimens were flattened with 400 grit abrasive paper before coating
with Zinc-Nickel and Cadmium (Sabelkin et al., 2016). Then, the specimens coating starts using
the electroplated method. Sixteen specimens were prepared; half of them coated with LHE Zinc-
Nickel and the other half with Cadmium. The reason for coating with low hydrogen
embrittlement (LHE) Zinc-Nickel is to avoid any hydrogen embrittlement during the
electroplating process (Brown & Berman, 2011).

30
The Zinc-Nickel electroplating process performed using LHE alkaline Zinc-Nickel. The
process starts with inspecting specimens, then shot-peening which is provided with glass beads at
a compressed air pressure of 275-410 kPa. Then the steps according to specification AMS 2417
Type 2 Certification Rev J were followed for the plating process (Sabelkin et al., 2016). After
that, the specimens baked at 375 ± 25 ºF for 24 hours. Then the specimens were inspected in
accordance to AMS 2417 Type 2 Certification Rev J (Sabelkin et al., 2016). Finally, the Zinc-
Nickel coating was completed with a thickness of 0.01 to 0.015 mm. The amount of nickel is
20% in the coating (Sabelkin et al., 2016). The Zinc-Nickel coating was gray-blue as is shown in
Figure 11.
Figure 11. Specimen with Zinc-Nickel coating.
The Cadmium electroplating process starts with inspecting specimens, then shot-peening
is provided with glass beads at a pressure of 275–410 kPa. Then the steps according to the
specification QQ-P-416 Type 2 Certification Rev F were followed for the plating process
(Sabelkin et al., 2016). After that, the specimens baked at 375 ± 25 ºF for 24 hours. Then the
specimens inspection was provided according to specification QQ-P-416 Type 2 Certification
Rev F (Sabelkin et al., 2016). Finally, the Cadmium coating is completed with a thickness of
0.01 to 0.015 mm (Sabelkin et al., 2016). The coating color was yellow as is shown in Figure 12.

31
Figure 12. Specimen with Cadmium coating.
3.2 Specimen Geometry and Test Matrix
The geometry of the test specimen shown in Figure 13, which is a rectangular shape with
a semi-circular notch on edge. The test specimen has 205 mm length, 25.4 mm width, 3.2 mm
thickness, and 3 mm notch radius. The purpose of the notch is to assign the location of the failure
(Sabelkin et al., 2016).
Figure 13. The geometry of test specimen.
Sixteen specimens were prepared for testing. Eight of them were coated with Cadmium
and eight with Zinc-Nickel. Details on the specimen preparation method are discussed
subsequently.

32
IV. Experimental Setup and Test method
4.1 Mechanical Testing Equipment
The test system is 318.10 MTS 810 servo-hydraulic machine with a 100 kN (22 kips)
load cell. This test equipment is suitable for fatigue and creep tests. The main components of this
machine are shown below in Figure 14.
Figure 14. Test machine components: (1) load cell, (2) passive upper grip, (3) active lower
grip, (4) emergency stop button, (5) grip pressure gauge, (6) grip pressure adjuster, (7)
upper grip controller, (8) lower grip controller, (9) control system, (10) lamp (11) frame.

33
4.2 Preparation of the Specimen
Sixteen specimens were prepared for testing. Eight of them were coated with Cadmium
and eight with Zinc-Nickel. Four specimens with each coating were scribed with a fine diamond
powder impregnated file at the root of the notch. Figure 15 shows the file used for scribing.
Figure 15. File used for scribe damage.
The scribe damage has 0.8 mm width and 3.2 mm length. The coating on the scribe
damage area was completely removed as shown in Figure 16 which enabled the specimen
substrate to be open to the corrosive environment.
Figure 16. A- Cadmium specimen, B- Zinc-Nickel specimen.

34
Before installing the specimen on the test machine, the environmental box contains a salt
water solution of 3.5 wt. % NaCl was mounted on the specimen which enabled simulation of the
corrosion environment. Then, the safe spill container was installed below the environmental box
to avoid spilling of the salt water solution on the test machine while running or after fracture.
Following this, a copper foil pads were mounted around grip parts of the specimen in order to
prevent stress concentration in grip zones. Figure 17 shows the specimen with the environmental
box, spill safe container and copper foil pads.
Figure 17. Specimen preparation: A- Zinc-Nickel coated specimen, B- Cadmium coated
specimen, 1- copper foil pads, 2- environmental box, 3- spill safe container.
35
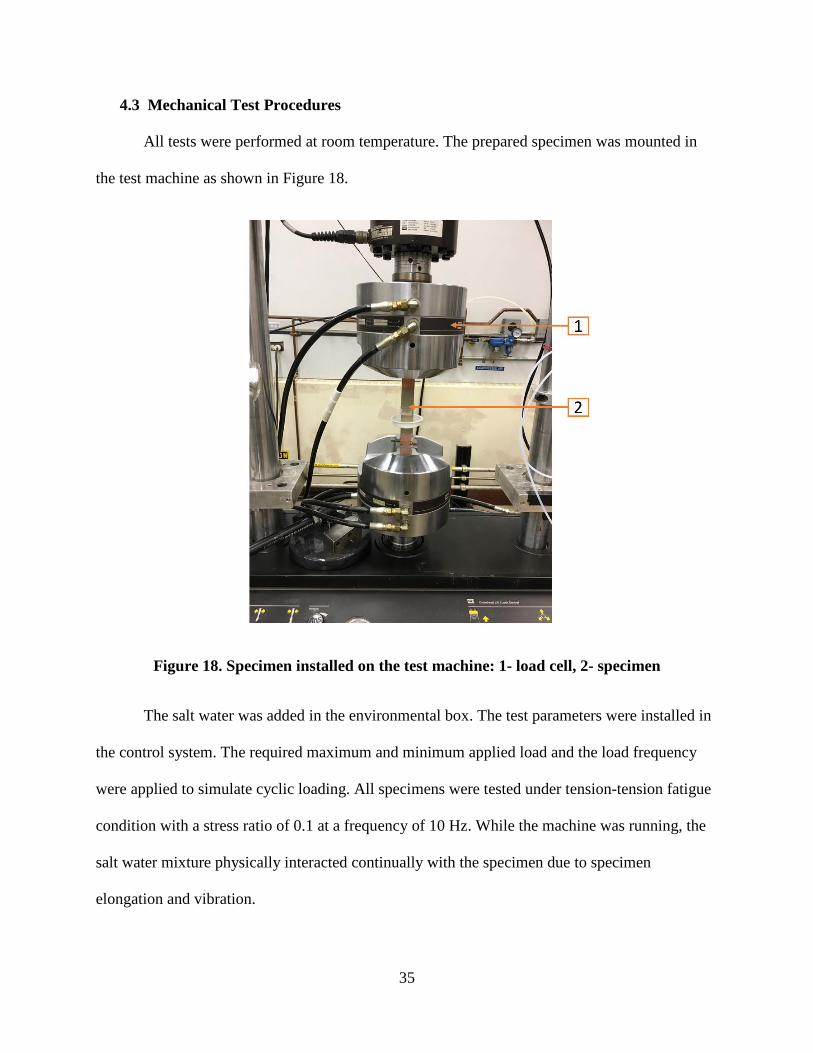
4.3 Mechanical Test Procedures
All tests were performed at room temperature. The prepared specimen was mounted in
the test machine as shown in Figure 18.
Figure 18. Specimen installed on the test machine: 1- load cell, 2- specimen
The salt water was added in the environmental box. The test parameters were installed in
the control system. The required maximum and minimum applied load and the load frequency
were applied to simulate cyclic loading. All specimens were tested under tension-tension fatigue
condition with a stress ratio of 0.1 at a frequency of 10 Hz. While the machine was running, the
salt water mixture physically interacted continually with the specimen due to specimen
elongation and vibration.

36
The applied maximum forces were referenced from the ultimate tensile strength (UTS)
for AISI 4340 which is documented to be between 950 and 1100 MPa (Fletcher Building, 2008).
Due to the geometry of the notch in the actual test specimens, it is expected that localized stress
concentration effects would influence the strength of the test specimens. For this reason, the UTS
of AISI 4340 was adjusted by multiplying the nominal value with the stress concentration factor.
The stress concentration factor (Kt) defined as the ratio of the calculated peak stress to the
nominal stress (Young & Budynas, 2002).
𝐾𝐾𝐾𝐾 =σ maxσ nom
(1)
Stress concentration factor is determined by the geometry of the specimen, and the type of the
used material does not affect the value of Kt (Shigley, Mischke, & Budynas, 2002). Stress
concentration factor can be calculated for structures for which all dimensions are exactly known,
particularly the radius of curvature in regions of high-stress concentration such as the notch in
our specimens (Shigley et al., 2002). The stress concentration factor depends on the geometry of
the specimen and the type of applied load. The specimen had a rectangular shape with a semi-
circular notch, and it is subjected to tensile load. Table 3 shows the suitable way to calculate Kt.
37
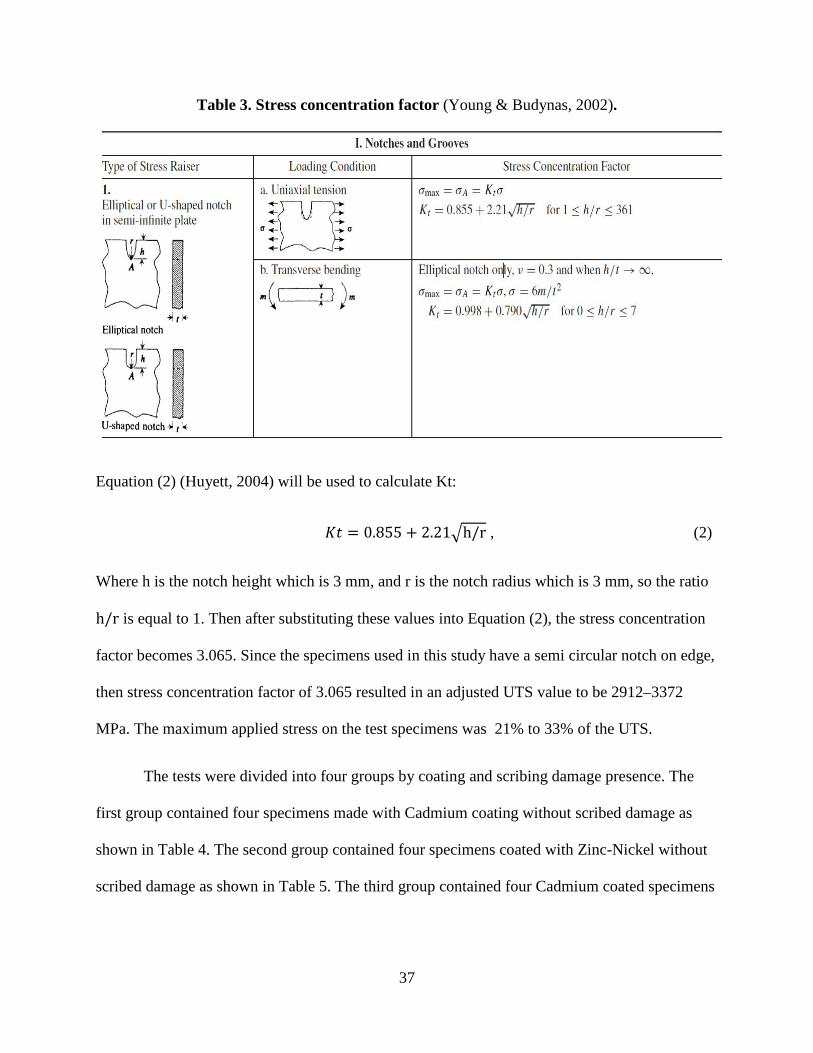
Table 3. Stress concentration factor (Young & Budynas, 2002).
Equation (2) (Huyett, 2004) will be used to calculate Kt:
𝐾𝐾𝐾𝐾 = 0.855 + 2.21�h/r , (2)
Where h is the notch height which is 3 mm, and r is the notch radius which is 3 mm, so the ratio
h/r is equal to 1. Then after substituting these values into Equation (2), the stress concentration
factor becomes 3.065. Since the specimens used in this study have a semi circular notch on edge,
then stress concentration factor of 3.065 resulted in an adjusted UTS value to be 2912–3372
MPa. The maximum applied stress on the test specimens was 21% to 33% of the UTS.
The tests were divided into four groups by coating and scribing damage presence. The
first group contained four specimens made with Cadmium coating without scribed damage as
shown in Table 4. The second group contained four specimens coated with Zinc-Nickel without
scribed damage as shown in Table 5. The third group contained four Cadmium coated specimens

38
with scribed damage as shown in Table 6. The fourth group contained four Zinc-Nickel coated
specimens with scribed damage as shown in Table 7.
Table 4. Cadmium coated specimens without scribe damage
Specimen UTS %
Max. Force (kN)
Min. Force (kN)
Width (𝑚𝑚𝑚𝑚)
Thickness (𝑚𝑚𝑚𝑚)
Area (𝑚𝑚𝑚𝑚2)
Sp-1 33% 29.5 2.95 25.46 3.2 81.47
Sp-2 27% 24 2.4 25.46 3.2 81.47
Sp-3 25% 23 2.3 25.46 3.2 81.47
Sp-4 21% 19 1.9 25.43 3.14 79.85
Table 5. Zinc-Nickel coated specimens without scribe damage
Specimen UTS %
Max. Force (kN)
Min. Force (kN)
Width (𝑚𝑚𝑚𝑚)
Thickness (𝑚𝑚𝑚𝑚)
Area (𝑚𝑚𝑚𝑚2)
Sp-5 31% 28 2.8 25.46 3.2 81.47
Sp-6 27% 24 2.4 25.46 3.2 81.47
Sp-7 25% 23 2.3 25.46 3.2 81.47
Sp-8 23% 20.5 2.05 25.46 3.2 81.47
Table 6. Cadmium coated specimens with scribe damage
Specimen UTS %
Max. Force (kN)
Min. Force (kN)
Width (𝑚𝑚𝑚𝑚)
Thickness (𝑚𝑚𝑚𝑚)
Area (𝑚𝑚𝑚𝑚2)
Sp-9 31% 28 2.8 25.46 3.2 81.47
Sp-10 27% 24 2.4 25.42 3.26 82.87
Sp-11 25% 23 2.3 25.46 3.2 81.47
Sp-12 23% 20.5 2.05 25.48 3.18 81.03

39
Table 7. Zinc-Nickel coated specimens with scribe damage
Specimen UTS %
Max. Force (kN)
Min. Force (kN)
Width (𝑚𝑚𝑚𝑚)
Thickness (𝑚𝑚𝑚𝑚)
Area (𝑚𝑚𝑚𝑚2)
Sp-13 31% 28 2.8 25.39 3.25 82.52
Sp-14 27% 24 2.4 25.46 3.2 81.47
Sp-15 25% 23 2.3 25.46 3.2 81.47
Sp-16 23% 20.5 2.05 25.46 3.2 81.47
The gross cross-section area for each specimen was calculated by using Equation (3).
𝐴𝐴 = 𝑤𝑤 ∗ 𝐾𝐾 (3)
Where (w) is the total width and (t) is thickness.
The nominal applied stress (σnom) is the applied maximum force divided by the area. It
was calculated using Equation (4).
𝜎𝜎 𝑛𝑛𝑛𝑛𝑚𝑚 =
𝐹𝐹𝐴𝐴
(4)
The maximum stress (σmax) is the nominal stress multiplied by the stress concentration
factor (Kt). It was calculated for each specimen using Equation (5).
𝜎𝜎 𝑚𝑚𝑚𝑚𝑚𝑚 = 𝜎𝜎 𝑛𝑛𝑛𝑛𝑚𝑚 ∗ 𝐾𝐾𝐾𝐾 (5)
The stress range (∆𝜎𝜎) is defind as the difference between the maximum and minimum
stress. It was calculated for each specimen using Equation (6).
∆𝜎𝜎 = 𝜎𝜎 𝑚𝑚𝑚𝑚𝑚𝑚 − 𝜎𝜎 𝑚𝑚𝑚𝑚𝑛𝑛 (6)

40
The stress ratio (𝑅𝑅) can be defined as the ratio of the minimum stress to maximum stress.
In this research, a stress ratio of 0.1 was applid to all test specimens. The stress ratio can be
calculated using Equation (7).
𝑅𝑅 =𝜎𝜎 𝑚𝑚𝑚𝑚𝑛𝑛𝜎𝜎 𝑚𝑚𝑚𝑚𝑚𝑚
(7)

41
V. Results and Discussions
5.1 Experimental Results
For the specimens tested in fatigue, most of them failed due to crack initiation at the root
of the notch. Once the crack initiated, catastrophic failure took place immediately. Thus, the
crack growth data could not be analyzed. Figure 19 shows the fractured specimens for both
Cadmium and Zinc-Nickel coated cases.
Figure 19. Fractured specimens for (a) Cadmium coated specimen and (b) Zinc-Nickel
coated specimen.
The test data for each group contains the maximum and minimum stress, the stress range,
the number of cycles before failure and the run-time. Fatigue life diagrams were plotted as stress
range versus number of cycles to failure for all groups.
In the first group which has four Cadmium coated without damage specimens, two
specimens failed due to fracture at the notch, and two specimens survived up to six million cycle
without failure. Table 8 shows the experimental data for the first group that has four specimens
coated with Cadmium without scribe damage.

42
Table 8. Test data for Cadmium coated specimens without scribe damage.
Specimen Max. Force (kN)
Area (𝑚𝑚𝑚𝑚2)
Max. Stress (MPa)
Min. Stress (MPa)
Stress range (∆𝜎𝜎)
Number of failure cycle (𝑁𝑁𝑁𝑁)
(cycles)
Running time (sec)
Sp-1 29.5 81.47 1110 111 999 74435 7443.5
Sp-2 24 81.47 903 90.3 813 332886 33288.6
Sp-3 23 81.47 883 88.3 795 6762559+ 676255.9
Sp-4 19 79.85 715 71.5 643 6094499+ 609449.9
Figure 20 shows fatigue life diagram, i.e. stress range versus number of cycles to failure
for the first group.
Figure 20. Stress range versus the number cycles to fail for Cadmium coated without scribe
damage specimens. The small arrows show that specimens did not fail.
Table 9 shows the test data for the second group that has four specimens coated with
Zinc-Nickel coating without scribe damage. All specimens in this group had failed as expected.
600
700
800
900
1000
1100
1200
0 2000000 4000000 6000000 8000000
Δσ
(MPa
)
Nfail (cycles)
Cd coated specimens without scribe damage

43
Table 9. Test data for Zinc-Nickel coated specimens without scribe damage.
Specimen Max. Force (kN)
Area (𝑚𝑚𝑚𝑚2)
Max. Stress (MPa)
Min. Stress (MPa)
Stress range (∆𝜎𝜎)
Number of failure cycle (𝑁𝑁𝑁𝑁)
(cycles)
Running time (second)
Sp-5 28 81.47 1053 105.3 948 74368 7436.8
Sp-6 24 81.47 903 90.3 813 146323 14632.3
Sp-7 23 81.47 865 86.5 779 2442889 244288.9
Sp-8 20.5 81.47 771 77.1 694 4112887 411288.7
Figure 21 shows fatigue life diagram, i.e. stress range versus number of cycles to failure
for the second group.
Figure 21. Stress range versus number of failure cycles for Zinc-Nickel coated specimens
without scribe damage.
Table 10 shows the test data for the third group that has four specimens coated with
Cadmium and with scribed damage. All specimens in this group had failed as expected.
600
700
800
900
1000
1100
1200
0 2000000 4000000 6000000
Δσ
(MPa
)
Nfail (cycles)
Zn-Ni coated specimens without scribe damage

44
Table 10. Experimental data for Cadmium coated specimens with scribe damage.
Specimen Max. Force (kN)
Area (𝑚𝑚𝑚𝑚2)
Max. Stress (MPa)
Min. Stress (MPa)
Stress range (∆𝜎𝜎)
Number of failure cycles (𝑁𝑁𝑁𝑁)
(cycles)
Running time (sec)
Sp-9 28 81.47 1053 105.3 948 64203 6420.3
Sp-10 24 82.87 869 86.9 782 1097546 109754.6
Sp-11 23 81.47 865 86.5 779 1769435 176943.5
Sp-12 20.5 81.03 775 77.5 698 3865392 386539.2
Figure 22 shows fatigue life diagram, i.e. stress range versus number of cycles to failure
for the third group.
Figure 22. Stress range versus number of failure cycles for Cadmium coated specimens
with scribe damage.
Table 11 shows the test data for the fourth group that has four specimens coated with
Zinc-Nickel with scribed damage. Three specimens were fractured as expected and one specimen
was survived up to six million cycles.
600
700
800
900
1000
1100
1200
0 2000000 4000000 6000000
Δσ
(MPa
)
Nfail (cycles)
Cd coated specimens with scribe damage

45
Table 11. Experimental data for Zinc-Nickel coated specimens with scribe damage.
Specimen Max. Force (kN)
Area (𝑚𝑚𝑚𝑚2)
Max. Stress (MPa)
Min. Stress (MPa)
Stress range (∆𝜎𝜎)
Number of failure cycle (𝑁𝑁𝑁𝑁)
(cycles)
Running time (sec)
Sp-13 28 82.52 1040 104.0 936 597623 59762.3
Sp-14 24 81.47 903 90.3 813 3361243 336124.3
Sp-15 23 81.47 865 86.5 779 195893 19589.3
Sp-16 20.5 81.47 771 77.1 694 6762559+ 676255.9
Figure 23 shows fatigue life diagram, i.e. stress range versus number of cycles to failure
for the fourth group.
Figure 23. Stress range versus number of failure cycles for Zinc-Nickel coated specimens
with scribe damage (the small arrow shows that specimen was survived).
600
700
800
900
1000
1100
1200
0 2000000 4000000 6000000 8000000
Δσ
(MPa
)
Nfail (cycles)
Zn-Ni coated specimens with scribe damage

46
5.2 Analysis of the Results
5.2.1 Fatigue data
The fatigue life diagrams for all specimens (four Cadmium coated specimens without
scribe damage, four Cadmium coated specimens with scribe damage, four Zinc-Nickel coated
specimens without scribe damage and four Zinc-Nickel coated specimens with scribe damage)
were shown in Figure 20, Figure 21, Figure 22 and Figure 23, respectively. Those diagrams were
compared and analyzed in three categories. The first category included specimens from both
coatings without scribe damage. The second category included specimens from both coatings
with scribe damage. The third category has all specimens regardless the scribe damage.
5.2.1.1 Specimens without scribe damage
This category included eight specimens, four specimens were Cadmium coated without
scribe damage, and four specimens were Zinc-Nickel coated without scribe damage. The fatigue
performance is discussed in what follows for both coatings at a constant stress range value and a
constant number of failure cycles. The stress range value was chosen to be 800 MPa, as this
value is the average for both coatings. The number of failure cycles was selected to be 2 million
cycles.
The stress range value for Cadmium coated specimens without scribe damage at 2 million
cycles is 760 MPa as shown in Figure 24.

47
Figure 24. Cadmium coated specimens without scribe damage at 2 million cycles.
The number of failure cycles for Cadmium coated specimens without scribe damage at
stress range of 800 MPa is nearly 1 million cycles as shown in Figure 25.
Figure 25. Cadmium coated specimens without scribe damage at stress range of 800 MPa.
600
700
800
900
1000
1100
1200
0 2000000 4000000 6000000 8000000
Δσ
(MPa
)
Nfail (cycles)
Cd coated specimens without scribe damage
600
700
800
900
1000
1100
1200
0 2000000 4000000 6000000 8000000
Δσ
(MPa
)
Nfail (cycles)
Cd coated specimens without scribe damage
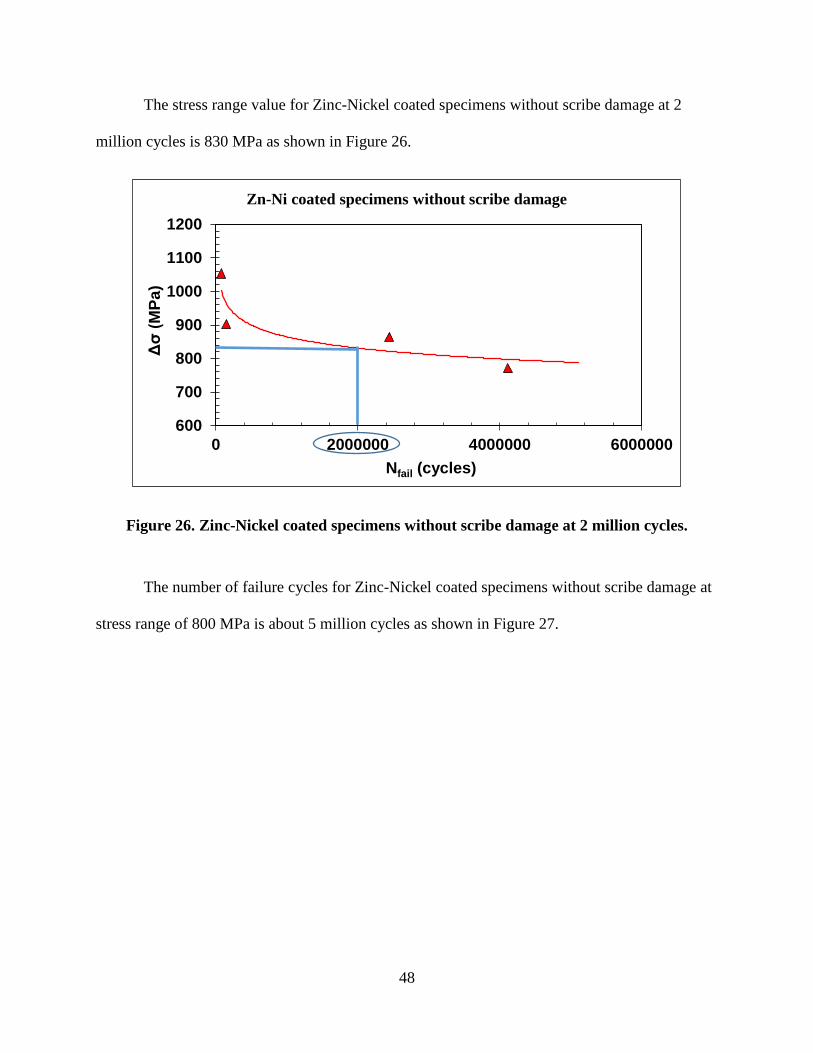
48
The stress range value for Zinc-Nickel coated specimens without scribe damage at 2
million cycles is 830 MPa as shown in Figure 26.
Figure 26. Zinc-Nickel coated specimens without scribe damage at 2 million cycles.
The number of failure cycles for Zinc-Nickel coated specimens without scribe damage at
stress range of 800 MPa is about 5 million cycles as shown in Figure 27.
600
700
800
900
1000
1100
1200
0 2000000 4000000 6000000
Δσ
(MPa
)
Nfail (cycles)
Zn-Ni coated specimens without scribe damage

49
Figure 27. Zinc-Nickel coated specimens without scribe damage at stress range of 800 MPa.
After analyzing the diagrams, it is evident that the life of Zinc-Nickel coated specimens
without scribe damage at stress range of 800 MPa is more than that of Cadmium coated
specimens without scribe damage. Also, the fatigue limit of Cadmium coated specimens without
scribe damage at 4 million cycles is lower than that of Zinc-Nickel coated specimens without
scribe damage.
5.2.1.2 Specimens with scribe damage
The total number of specimens with scribe damage were eight of which four specimens
were Cadmium coating and four specimens were Zinc-Nickel coating. The comparison between
both coating diagrams was also made at constant stress range value of 800 MPa and constant
failure cycles of 2 million.
The stress range value for Cadmium coated specimens with scribe damage at 2 million
cycles is 750 MPa as shown in Figure 28.
600
700
800
900
1000
1100
1200
0 2000000 4000000 6000000
Δσ
(MPa
)
Nfail (cycles)
Zn-Ni coated specimens without scribe damage

50
Figure 28. Cadmium coated specimens with scribe damage at 2 million cycles.
The number of failure cycles for Cadmium coated specimens with scribe damage at stress
range of 800 MPa is nearly 900 thousand cycles as shown in Figure 29.
Figure 29. Cadmium coated specimens with scribe damage at stress range of 800 MPa.
600
700
800
900
1000
1100
1200
0 2000000 4000000 6000000
Δσ
(MPa
)
Nfail (cycles)
Cd coated specimens with scribe damage
600
700
800
900
1000
1100
1200
0 2000000 4000000 6000000
Δσ
(MPa
)
Nfail (cycles)
Cd coated specimens with scribe damage

51
The stress range value for Zinc-Nickel coated specimens with scribe damage at 2 million
cycles is 780 MPa as shown in Figure 30.
Figure 30. Zinc-Nickel coated specimens with scribe damage at 2 million cycles.
The number of failure cycles for Zinc-Nickel coated specimens without scribe damage at
stress range of 800 MPa is about 1.2 million cycles as shown in Figure 31.
600
700
800
900
1000
1100
1200
0 2000000 4000000 6000000 8000000
Δσ
(MPa
)
Nfail (cycles)
Zn-Ni coated specimens with scribe damage

52
Figure 31. Zinc-Nickel coated specimens with scribe damage at stress range of 800 MPa.
Specimens with Zinc-Nickel coating with scribe damage has longer life at stress range of
800 MPa than specimens with Cadmium coating with scribe damage. Also, Zinc-Nickel coated
specimens with scribe damage has a higher stress range value at 2 million cycles when compared
to Cadmium coated specimens with scribe damage.
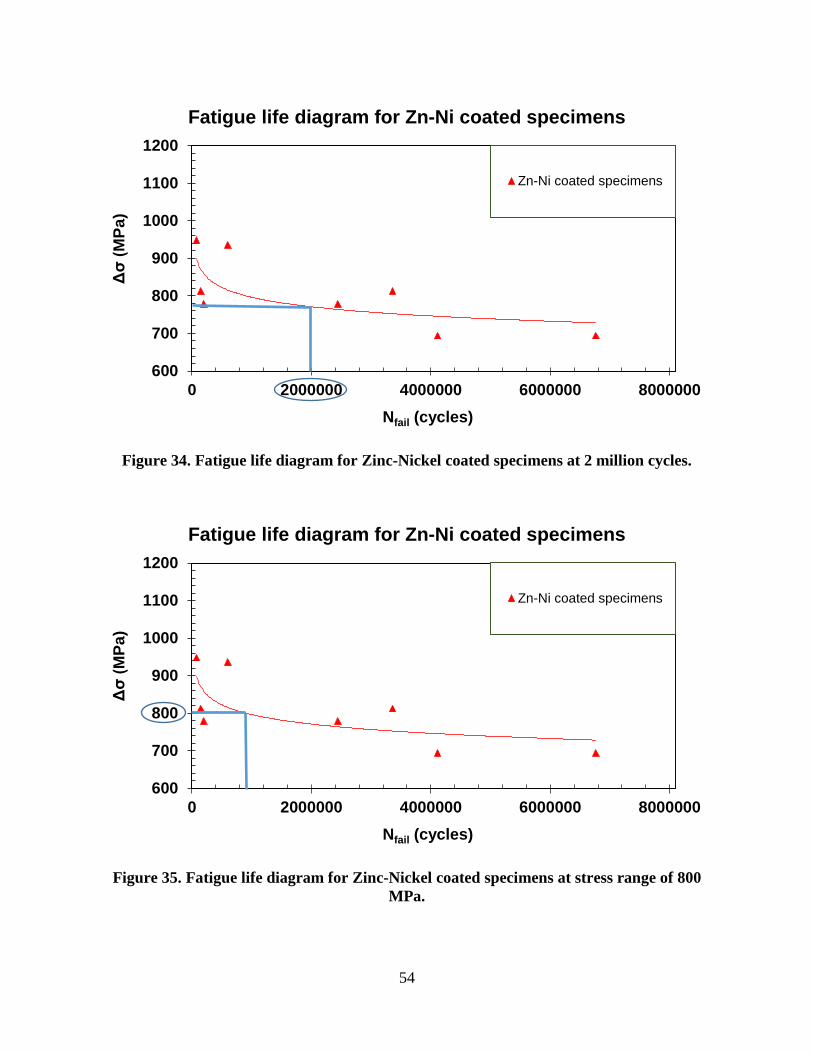
5.2.1.3 Both coatings regardless the damage:
After comparing the fatigue life diagram for specimens with scribe damage and
specimens without scribe damage, a comparison was made for both coatings regardless of
damage to the coating. The comparison between both coatings was at stress range of 800 MPa
and two million cycles to failure. The fatigue life diagram for Cadmium coating at 800 MPa and
two million cycles are shown in Figure 32 and Figure 33, respectively. The fatigue life diagram
for Zinc-Nickel coating at 800 MPa and two million cycles was indicated in Figure 34 and
Figure 35, respectively.
600
700
800
900
1000
1100
1200
0 2000000 4000000 6000000 8000000
Δσ
(MPa
)
Nfail (cycles)
Zn-Ni coated specimens with scribe damage

53
Figure 32. Fatigue life diagram for Cadmium coated specimens at 2 million cycles.
Figure 33. Fatigue life diagram for Cadmium coated specimens at stress range of 800 MPa.
600
700
800
900
1000
1100
1200
0 2000000 4000000 6000000 8000000
Δσ
(MPa
)
Nfail (cycles)
Fatigue life diagram for Cd coated specimens
Cd coated specimens
600
700
800
900
1000
1100
1200
0 2000000 4000000 6000000 8000000
Δσ
(MPa
)
Nfail (cycles)
Fatigue life diagram for Cd coated specimens
Cd coated specimens
54
Figure 34. Fatigue life diagram for Zinc-Nickel coated specimens at 2 million cycles.
Figure 35. Fatigue life diagram for Zinc-Nickel coated specimens at stress range of 800 MPa.
600
700
800
900
1000
1100
1200
0 2000000 4000000 6000000 8000000
Δσ
(MPa
)
Nfail (cycles)
Fatigue life diagram for Zn-Ni coated specimens
Zn-Ni coated specimens
600
700
800
900
1000
1100
1200
0 2000000 4000000 6000000 8000000
Δσ
(MPa
)
Nfail (cycles)
Fatigue life diagram for Zn-Ni coated specimens
Zn-Ni coated specimens

55
According to Figure 32 and Figure 33, the stress range of Cadmium coated specimens at
two million cycles is 760 MPa and the number of cycles to failure at 800 MPa is 900 thousand
cycles. Zinc-Nickel coated specimens according to Figure 34 and Figure 35 have stress range of
780 MPa at two million cycles and slightly more than 900 thousand cycles at 800 MPa.
Therefore it can be stated that at constant stress value, the life of Zinc-Nickel coated specimens
is more than that of Cadmium coated specimens. Also, at two million cycles, the stress range
value for Zinc-Nickel coated specimens is higher than that of Cadmium coated specimens.
Figure 36 shows the fatigue life diagram for all tested specimens where the blue line
represents the Zinc-Nickel coated specimens and the red line represents the Cadmium coated
specimens.
Figure 36. Fatigue life diagram for all test specimens.
According to Figure 36, it can be noted that Zinc-Nickel coated specimens have longer fatigue
life than Cadmium coated specimens at lower stress level.
600
700
800
900
1000
1100
1200
0 2000000 4000000 6000000 8000000
Δσ
(MPa
)
Nfail (cycles)
Fatigue life diagram for all tested specimens
Cd coated specimens
Zn-Ni coated specimens

56
5.2.2 Corrosion fatigue behavior
The study of corrosion fatigue behavior includes the ability to sustain cycle loads and
capacity to resist corrosion. All specimens were tested under cyclic loading in a salt water
solution of 3.5 wt.% NaCl to represent the corrosion environment. The coating on eight of the
test specimens had scribed damage, so it is important to know whether this damage accelerated
the corrosion or not. Therefore the study of corrosion fatigue behavior was divided into graphical
analysis and microstructure analysis.
5.2.2.1 Graphical analysis
Graphical analysis is a method of analysis performed to study and analyze graphs created
from the result tables. Starting with the fatigue life diagram of Zinc-Nickel coated specimens to
study whether the scribe damage have a clear effect on the corrosion fatigue behavior or not. The
fatigue life diagrams of Zinc-Nickel coated specimens with and without scribe damage are
presented in Figure 37. The Zinc-Nickel coated specimens with scribe damage presented with the
blue line and the Zinc-Nickel coated specimens without scribe damage presented with a red line.

57
Figure 37. Fatigue life diagram of Zinc-Nickel coated specimens.
Figure 37 shows that Zinc-Nickel coated specimens with scribe damage have a better
corrosion fatigue behavior than Zinc-Nickel coated specimens without scribe damage which
indicates that the scribe damage on coating does not accelerate the corrosion fatigue.
The fatigue life diagram for Cadmium coated specimens presented in Figure 38 shows
that the corrosion fatigue behavior for Cadmium coated specimens with scribe damage was
almost similar to the corrosion fatigue behavior for Cadmium coated specimens without scribe
damage. It can be stated that the scribe damage on Cadmium coated specimens does not impact
the corrosion fatigue behavior.
600
700
800
900
1000
1100
1200
0 2000000 4000000 6000000 8000000
Δσ
(MPa
)
Nfail (cycles)
Fatigue life diagram of Zn-Ni coated specimens
ZnNi
ZnNi - With scribe damage

58
Figure 38. Fatigue life diagram for Cadmium coated specimens.
The corrosion fatigue behavior for specimens with scribe damage in both coating can be
compared using the graphical analysis. The comparison process was to create a fatigue life
diagram that combines the test results for specimens with scribe damage in both coatings. Figure
39 shows the fatigue life diagram, i.e. stress range versus number of cycles to failure for
Cadmium coated specimens with scribe damage and Zinc-Nickel coated specimens with scribe
damage. The blue color presented Zinc-Nickel coated specimen and the red color presented
Cadmium coated specimens. The graphical analysis summarized that Zinc-Nickel coated
specimens with scribe damage have better corrosion fatigue behavior as compared to Cadmium
coated specimens with scribe damage.
600
700
800
900
1000
1100
1200
0 2000000 4000000 6000000 8000000
Δσ
(MPa
)
Nfail (cycles)
Fatigue life diagram for Cadmium coated specimens
Cd
Cd - With scribedamage

59
Figure 39. The fatigue life diagram for Cadmium coated specimens with scribe damage and
Zinc-Nickle coated specimens with scribe damage.
5.2.2.2 Microstructure analysis
Microstructure analysis is to study and analyze the small scale structure of the material.
The analysis was based on studying the fracture surface of test specimens and the structural
differences between both coatings. The test specimens were cut into small pieces using AQ537L
wire electrical discharge machining (EDM), to be fitted under micro structure analysis machine.
Figure 40 shows the specimens after cutting where height was 25.4 mm, and width was 3 mm.
600
700
800
900
1000
1100
1200
0 2000000 4000000 6000000 8000000
Δσ
(MPa
)
Nfail (cycles)
Zn-Ni and Cd coated specimens with scribe damage
Cd - With scribe damage
ZnNi - With scribedamage

60
Figure 40. Test specimens for microstructure analysis, A. Cadmium coated, B. Zinc-Nickel
coated.
The fracture surface was pictured using optical microscope ZEISS as shown in Figure 41.
The fracture surface was similar for all the test specimens. The white arrow in Figure 41 shows
the crack initiated from a corner of the test specimen. The dotted black line represents the
transition from corrosion assisted fracture to overload fracture. The black arrow shows the
direction of crack propagation, i.e. from left to right.
Figure 41. Fracture surface of test specimen at 10 mm zoom focus
The fracture surface had four distinct regions near the crack initiation area involving
fatigue crack growth region, transition region, intergranular cracking region, and final rapid
fracture region (Sabelkin et al., 2016). Further microstructure analysis was done using Quanta
450 scanning electron microscope (SEM) to get a closer look of the fractured surface. SEM was
used to image the fracture surface after failure with an acceleration voltage of 10 kV.

61
The fracture surfaces of Zinc-Nickel coated specimens with and without scribe damage
are shown in Figure 42 and Figure 43, respectively. The fracture surfaces of Cadmium coated
specimens with and without scribe damage are shown in Figure 44 and Figure 45, respectively.
Figure 42. Fracture surface for Zinc-Nickel coated specimen without scribe damage
showing (A) fatigue crack growth region, (B) transition region and (C) intergranular
cracking region.

62
Figure 43. Fracture surface for Zinc-Nickel coated specimen with scribe damage showing
(A) fatigue crack growth region, (B) transition region and (C) intergranular cracking
region.

63
Figure 44. The fracture surface of Cadmium coated specimen without scribe damage
showing (A) fatigue crack growth region, (B) transition region and (C) intergranular
cracking region.

64
Figure 45. The fracture surface of Cadmium coated specimen with scribe damage (A)
showing fatigue crack growth region, (B) transition region and (C) intergranular cracking
region.
The overall look of fracture surface as shown in Figure 42, Figure 43, Figure 44 and
Figure 45 was almost the same for all specimens. By looking into the fatigue crack growth
region in these figures, it shows that each type of specimen has different structure in this region

65
which makes it difficult to tell the possibility of corrosion effect. However, the transition region
depending on its size and its structure can indicate the corrosions effect. After comparing the
transition region between Cadmium coated specimen without scribe damage and Zinc-Nickel
coated specimen without scribe damage, it was discovered that the transition region size was
identical for both coatings and the smoothness of the surface of that region was almost similar.
Then by comparing Cadmium coated specimen with scribe damage and Zinc-Nickel coated
specimen with scribe damage, it was detected that the structure surface looks similar for both
coatings, but the transition region size was bigger in Cadmium coated specimen than that of
Zinc-Nickel coated specimen. A bigger transition region implies that there is more corrosion in
that area. Therefore Zinc-Nickel coated specimen with scribe damage has better corrosion
fatigue behavior than Cadmium coated specimen with scribe damage. It can be summarized that
the corrosion fatigue behavior was better for Zinc-Nickel coated specimens than that of
Cadmium coated specimens.
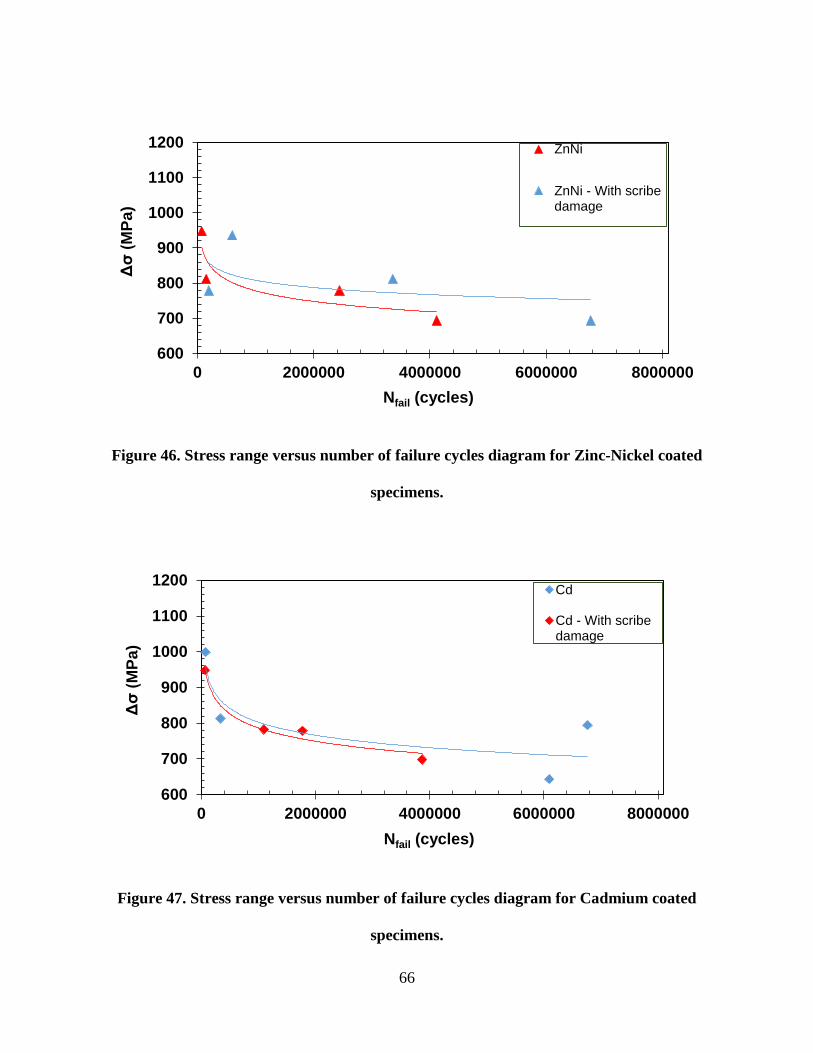
5.2.3 Hydrogen re-embrittlement
One of the objectives of this research was to study the possible occurrence of hydrogen
re-embrittlement due to the scribe damage on the specimen. The study was based on the
comparison of corrosion fatigue behavior between specimens with and without scribe damage
with the same coating. The test results for Zinc-Nickel coated specimens were plotted using
stress range versus number of failure cycles diagram as shown in Figure 46. Also, the test results
for Cadmium coated specimens were plotted using stress range versus number of failure cycles
diagram as shown in Figure 47.
66
Figure 46. Stress range versus number of failure cycles diagram for Zinc-Nickel coated
specimens.
Figure 47. Stress range versus number of failure cycles diagram for Cadmium coated
specimens.
600
700
800
900
1000
1100
1200
0 2000000 4000000 6000000 8000000
Δσ
(MPa
)
Nfail (cycles)
ZnNi
ZnNi - With scribedamage
600
700
800
900
1000
1100
1200
0 2000000 4000000 6000000 8000000
Δσ
(MPa
)
Nfail (cycles)
Cd
Cd - With scribedamage

67
Figure 46 shows that Zinc-Nickel coated specimens with scribe damage have better
corrosion fatigue behavior than Zinc-Nickel coated specimens without scribe damage which
indicated that the scribe damage on Zinc-Nickel coated specimens did not cause any hydrogen
re-embrittlement. Figure 47 shows that the corrosion fatigue behavior for Cadmium coated
specimens was almost similar between specimens with and without scribe damage which
revealed that there is no sign of hydrogen re-embrittlement on Cadmium coated specimens.
Figure 48 shows one of the Zinc-Nickel coated specimen with scribe damage which survived at
more than six million cycles without failure.
Figure 48. Specimen with Zinc-Nickel coating.
Using micro structure analysis for the pictures provided by SEM, the region between the
transition and intergranular cracking for Zinc-Nickel coated specimens and Cadmium coated
specimens with and without scribe damage was shown in Figure 49. The fracture surface in this
region was almost similar between all four types of specimens which show that there is no sign
of hydrogen re-embrittlement.

68
Figure 49. The region between the transition and intergranular cracking, (A) Cadmium
coated specimens without scribe damage, (B) Zinc-Nickel coated specimens without scribe
damage, (C) Cadmium coated specimens with scribe damage and (D) Zinc-Nickel coated
specimens with scribe damage.
The above indicated that the scribed damage in Cadmium coated specimens and Zinc-
Nickel coated specimens did not cause any obvious effect, such as hydrogen re-embrittlement.

69
5.2.4 Previous research comparisons
The test results for this research were compared to the research performed by Sabelkin et
al. (Sabelkin et al., 2016). Their research was about the same topic with different stress ratio and
load frequency. The comparisons were divided into three categories, namely fatigue data, stress
ratio, and load frequency.
5.2.4.1 Fatigue data
The fatigue life diagram was created for all specimens as stress range at the root of the
notch versus number of cycles to failure as shown in Figure 50. The trend line was drawn in this
figure to show the amount of scatter in fatigue data.
Figure 50. The fatigue life diagram for all specimens plotted as stress range at the root of
the notch vs. number of cycles to failure.
Figure 51 shows stress range at the root of the notch versus number of cycles to failure
diagram for the previous research.
600
700
800
900
1000
1100
1200
0 2000000 4000000 6000000 8000000
Δσ
(MPa
)
Nfail (cycles)
Fatigue life diagram
Cd
ZnNi
Cd - With scribe damage
ZnNi - With scribe damage

70
Figure 51. The fatigue life diagram plotted as stress range at the root of the notch vs.
number of cycles to fail (Sabelkin et al., 2016).
Figure 52 shows the fatigue life diagram for maximum stress versus time to failure.

71
Figure 52. The fatigue life diagram for all specimens plotted as Maximum stress vs. time to
fail diagram.
Figure 53 shows maximum stress versus time to failure diagram for the previous research
done by Sabelkin et al. (Sabelkin et al., 2016).
600
700
800
900
1000
1100
1200
0 200000 400000 600000 800000
σ max
(MPa
)
T (sec)
Cd
ZnNi
Cd - with scribe damage
ZnNi - with scribe damage

72
Figure 53. Maximum stress vs. time to fail diagram (Sabelkin et al., 2016).
It can be noted from Figure 50, Figure 51, Figure 52 and Figure 53 that there is a similar
amount of scatter in fatigue data for all four diagrams.
5.2.4.2 Stress ratio
The second set of comparisons was done based on the stress ratio. The stress ratio is the
ratio of minimum stress to the maximum stress. In the study by Sabelkin et al. (Sabelkin et al.,
2016), it was -0.3. This meant that the load was applied in both tension and compression. For the
present study in this research, the stress ratio was 0.1 which means that the applied load was
tension-tension. Figure 54 shows the diagram of stress value at the root of the notch versus
number of cycles to failure for stress ratios of -0.3 and 0.1.

73
Figure 54. Stress range at the root of the notch versus number of cycles to failure for stress
ratio of -0.3 and 0.1.
Figure 54 shows that the stress range at stress ratio of -0.3 was higher than the stress
range at stress ratio of 0.1. The number of cycles to failure was greater for stress range of 0.1
comparing to stress range of -0.3. Therefore it can be stated that as the stress ratio decrease the
stress range increase but the number of cycles to failure decrease.
5.2.4.3 Load frequency
The third set of comparisons was done based on the load frequency. The load frequency
was 1 Hz for the research by Sabelkin et al. (Sabelkin et al., 2016) and 10 Hz in this research.
For these two different frequencies, a comparison was made using the diagram of stress range at
the root of the notch versus number of cycles to failure and the diagram of maximum stress vs.
time to failure. Both diagrams are presented in Figure 55 and Figure 56, respectively. The
number of cycles to failure at 1 Hz for all types of specimens at a given applied stress range is in
general less than number of cycles to failure at 10 Hz. The time to failure at 10 Hz given at
600700800900
10001100120013001400
0 2000000 4000000 6000000 8000000
Δσ
(MPa
)
Nfail (cycles)
R = -0.3-CdR = -0.3-ZnNiR = 0.1-CdR = 0.1-ZnNiR = 0.1-Cd-SDR = 0.1-ZnNi-SD

74
applied stress range is overall less than time to failure at 1 Hz. So it can be summarized that the
corrosion fatigue behavior of all specimens was a combination of cycle and time dependent
phenomena.
Figure 55. Stress range at the root of the notch versus number of cycles to failure for specimens at 10 Hz and 1 Hz.
Figure 56. Maximum stress vs. time to fail diagram for specimens at 10 Hz and 1 Hz.

75
VI. Conclusions and Recommendation
The corrosion fatigue behavior of Cadmium and Zinc-Nickel coated high-strength steel
AISI 4340 was investigated in this research. Sixteen specimens were investigated: four Cadmium
coated specimens without scribe damage, four Cadmium coated specimens with scribe damage,
four Zinc-Nickel coated specimens without scribe damage and four Zinc-Nickel coated
specimens with scribe damage. The damage was in the form of small scribed area with removed
coating. The specimens were exposed to a salt water solution of 3.5 wt.% during the test. The
test was under tension-tension cyclic loading with a stress ratio of 0.1 at frequency of 10 Hz. The
major research findings can be summarized as follows:
i. The fatigue life for Zinc-Nickel coated specimens with and without scribe damage was
longer than the fatigue life for Cadmium coated specimens with and without scribe
damage.
ii. The corrosion fatigue performance for Zinc-Nickel coated with and without scribe
damage was better than that of Cadmium coated specimens with and without scribe
damage.
iii. There was no significant difference in the fatigue life between Zinc-Nickel coated
specimens with and without scribe damage.
iv. There was no difference in the fatigue life between Cadmium coated specimens with and
without scribe damage.
v. Microstructural analysis showed a larger transition region in the Cadmium coated
specimens with scribed damage in comparison to Zinc-nickel coated specimen with
scribed damage, implying Zinc-Nickel coating to be more corrosion resistant than
Cadmium coating.

76
vi. The scribed damage in Cadmium coated specimens and Zinc-Nickel coated specimens
did not cause hydrogen re-embrittlement.
Based on this study and considering health effect of Cadmium coating, replacing
Cadmium coating with Zinc-Nickel coating is proposed. Also, to understand this problem
further, additional tests at different stress ratios and frequencies are recommended.

77
Appendix A: Additional Fatigue plots
Figure 57. Maximum stress vs. number of failure cycle diagram for Zinc-Nickel coated
specimens with and without scribe damage.
600
700
800
900
1000
1100
1200
0 2000000 4000000 6000000 8000000
σ max
(MPa
)
Nfail (cycles)
ZnNi
ZnNi - With scribedamage
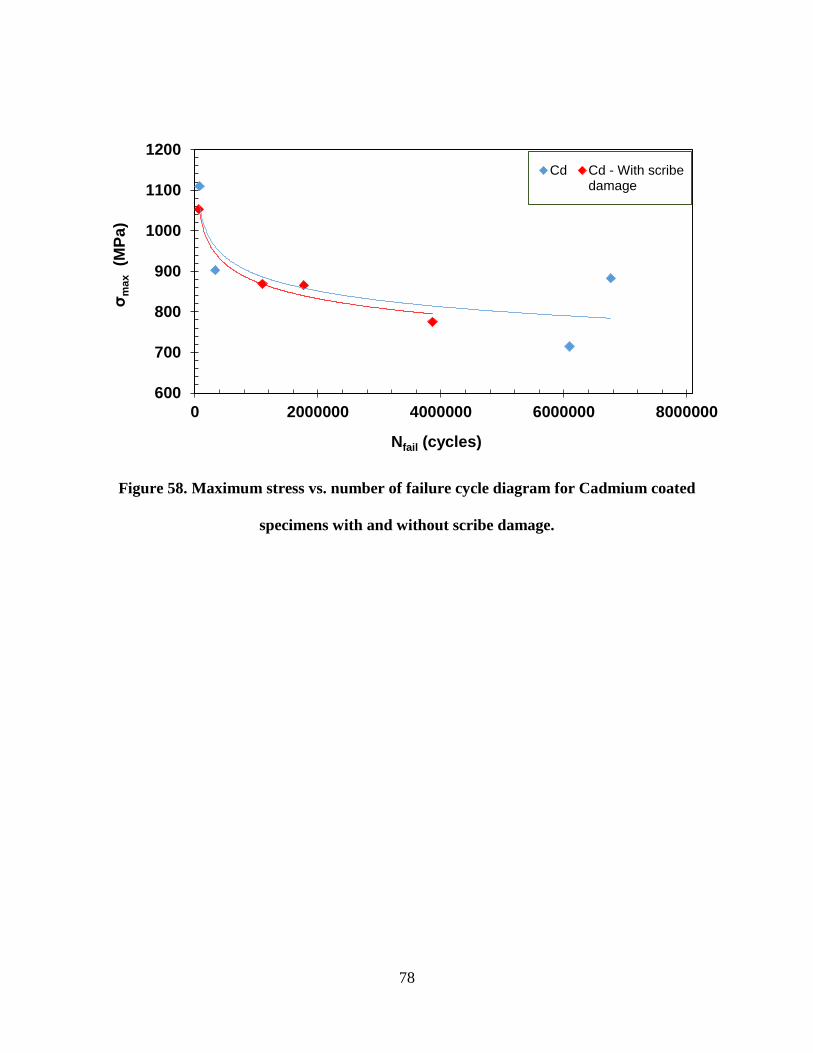
78
Figure 58. Maximum stress vs. number of failure cycle diagram for Cadmium coated
specimens with and without scribe damage.
600
700
800
900
1000
1100
1200
0 2000000 4000000 6000000 8000000
σ max
(MPa
)
Nfail (cycles)
Cd Cd - With scribedamage
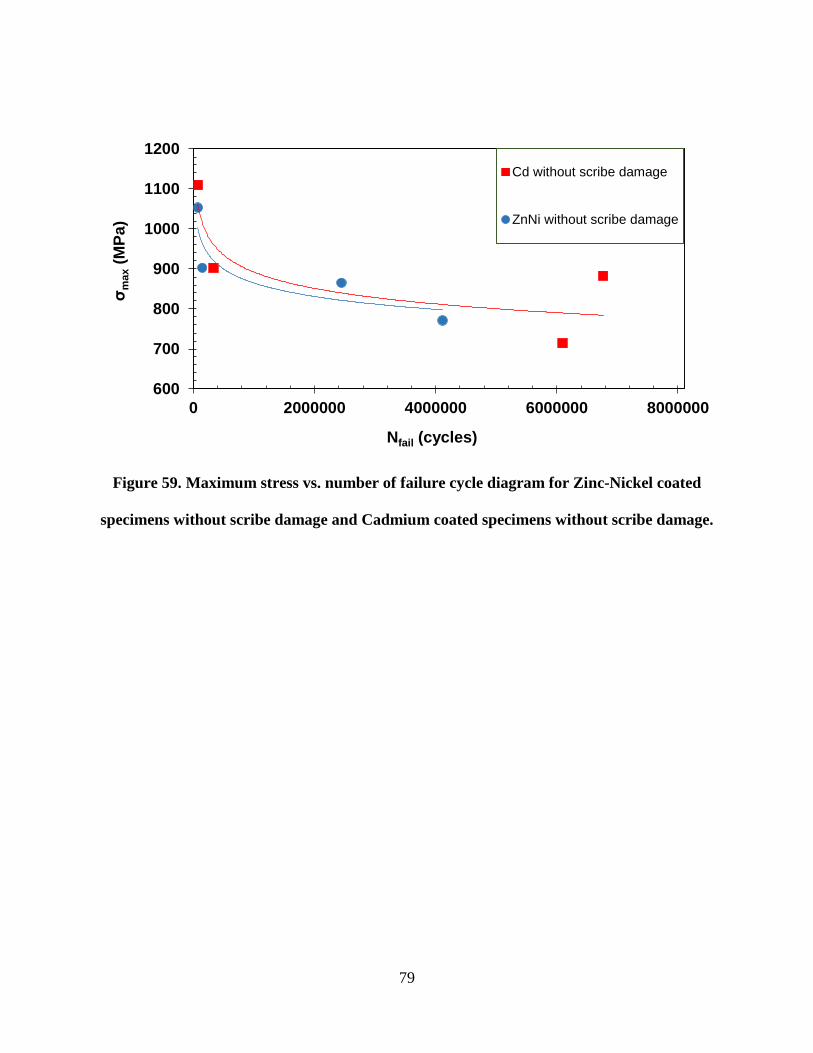
79
Figure 59. Maximum stress vs. number of failure cycle diagram for Zinc-Nickel coated
specimens without scribe damage and Cadmium coated specimens without scribe damage.
600
700
800
900
1000
1100
1200
0 2000000 4000000 6000000 8000000
σ max
(MPa
)
Nfail (cycles)
Cd without scribe damage
ZnNi without scribe damage
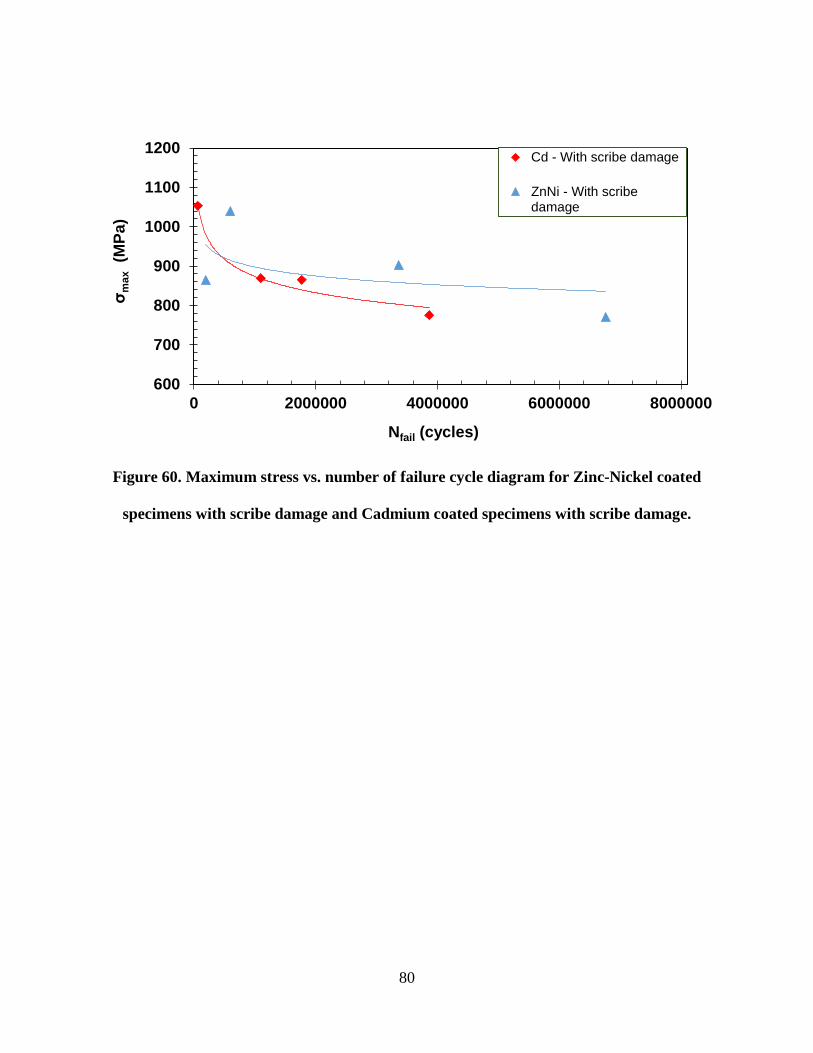
80
Figure 60. Maximum stress vs. number of failure cycle diagram for Zinc-Nickel coated
specimens with scribe damage and Cadmium coated specimens with scribe damage.
600
700
800
900
1000
1100
1200
0 2000000 4000000 6000000 8000000
σ max
(MPa
)
Nfail (cycles)
Cd - With scribe damage
ZnNi - With scribedamage
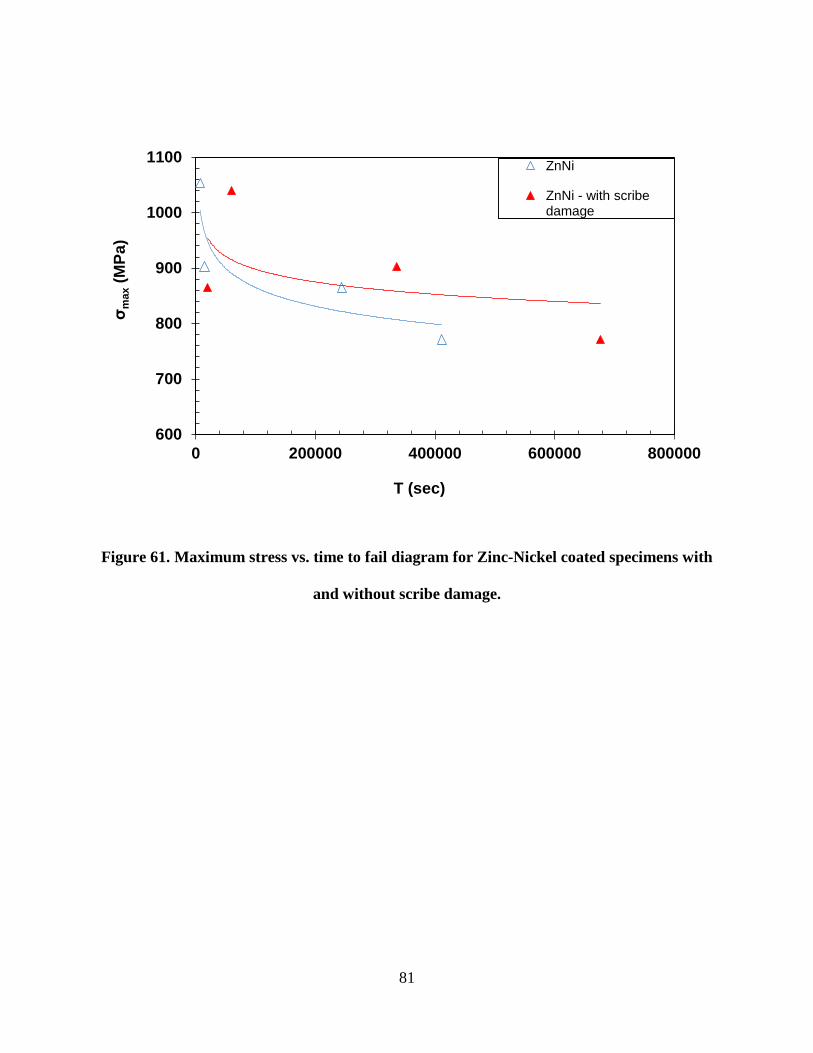
81
Figure 61. Maximum stress vs. time to fail diagram for Zinc-Nickel coated specimens with
and without scribe damage.
600
700
800
900
1000
1100
0 200000 400000 600000 800000
σ max
(MPa
)
T (sec)
ZnNi
ZnNi - with scribedamage

82
Figure 62. Maximum stress vs. time to fail diagram for Cadmium coated specimens with
and without scribe damage.
600
700
800
900
1000
1100
1200
0 200000 400000 600000 800000
σ max
(MPa
)
T (sec)
Cd
Cd - with scribedamage
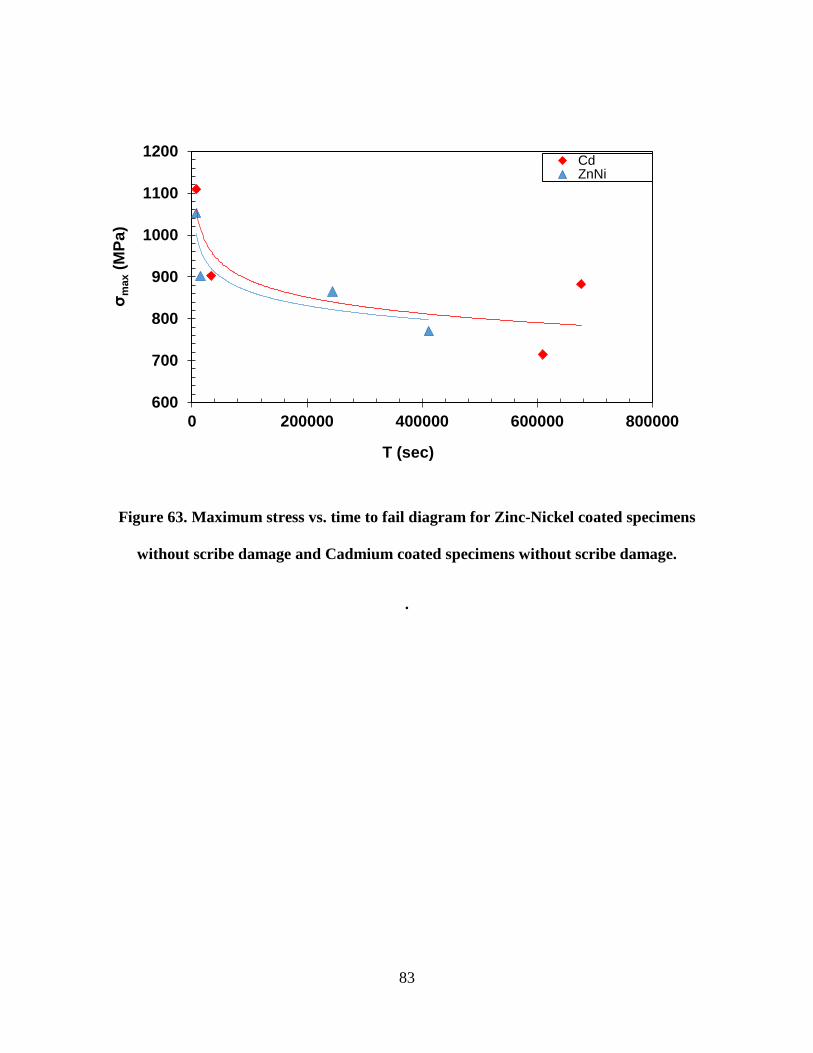
83
Figure 63. Maximum stress vs. time to fail diagram for Zinc-Nickel coated specimens
without scribe damage and Cadmium coated specimens without scribe damage.
.
600
700
800
900
1000
1100
1200
0 200000 400000 600000 800000
σ max
(MPa
)
T (sec)
CdZnNi
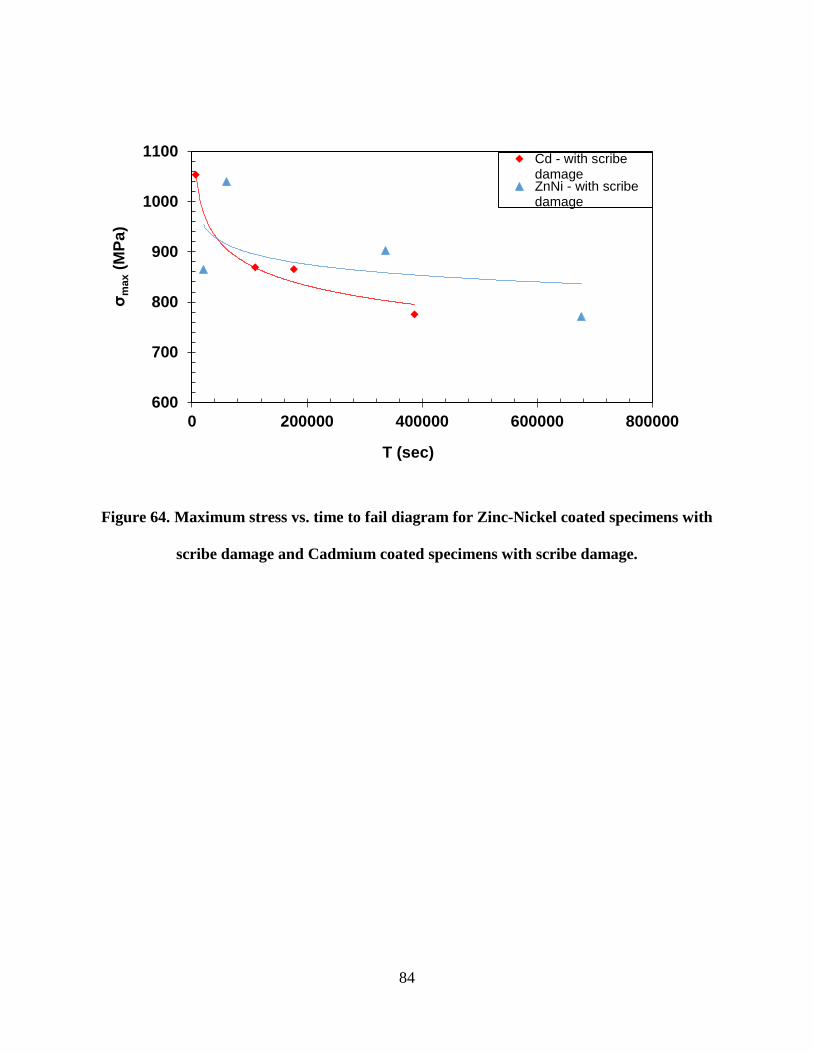
84
Figure 64. Maximum stress vs. time to fail diagram for Zinc-Nickel coated specimens with
scribe damage and Cadmium coated specimens with scribe damage.
600
700
800
900
1000
1100
0 200000 400000 600000 800000
σ max
(MPa
)
T (sec)
Cd - with scribedamageZnNi - with scribedamage

85
Figure 65. Maximum stress vs. time to fail diagram for all test specimens.
600
700
800
900
1000
1100
1200
0 200000 400000 600000 800000
σ max
(MPa
)
T (sec)
Cd
ZnNi
Cd - with scribe damage
ZnNi - with scribe damage

86
Figure 66. Stress range versus number of failure cycle diagram for all test specimens.
600
700
800
900
1000
1100
1200
0 2000000 4000000 6000000 8000000
Δσ
(MPa
)
Nfail (cycles)
Cd
ZnNi
Cd - With scribe damage
ZnNi - With scribe damage

87
Appendix B: Test Specimens
Figure 67. Cadmium coated specimens.

88
Figure 68. Zinc-Nickel coated specimens.

89
Figure 69. Zinc-Nickel coated specimens prepared for SEM analysis.
Figure 70. Cadmium coated specimens prepared for SEM analysis.

90
Appendix C: Test Equipment
Figure 71. MTS 810 servo-hydraulic machine.

91
Figure 72. AQ537L wire electrical discharge machine (EDM): 1- cutting wire 2- specimen.

92
Figure 73. External view of Quanta 450 scanning electron microscope (SEM).
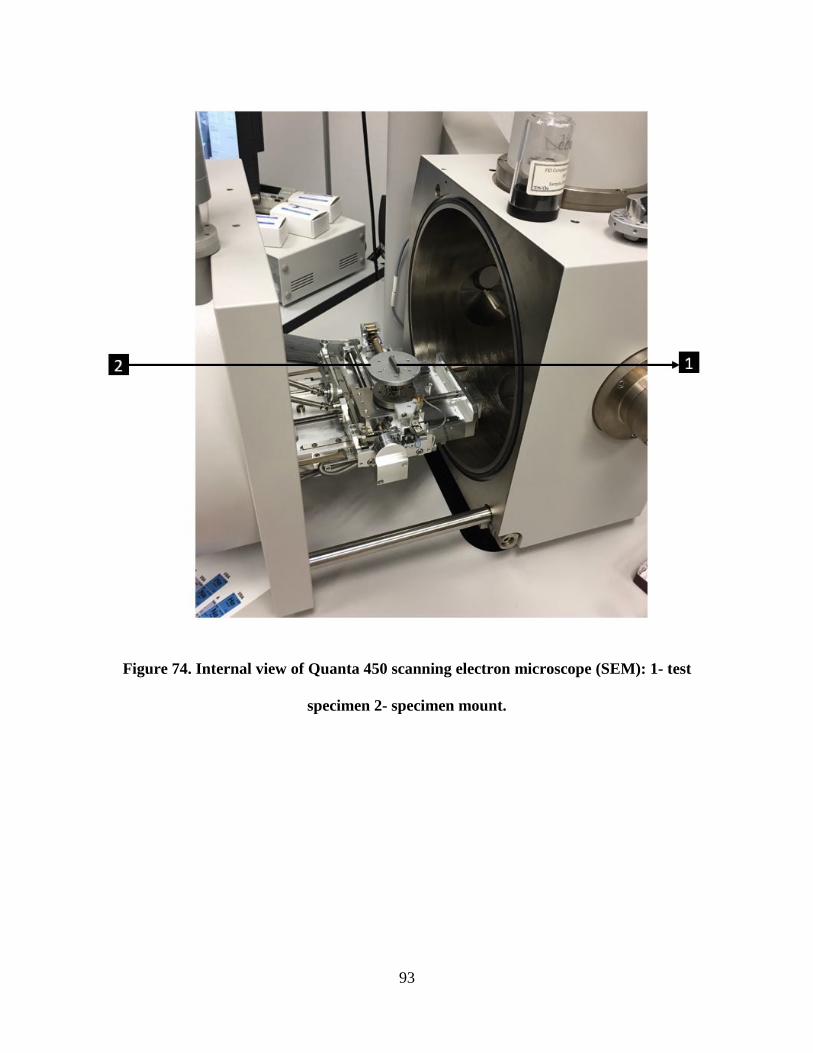
93
Figure 74. Internal view of Quanta 450 scanning electron microscope (SEM): 1- test
specimen 2- specimen mount.

94
Reference
Anft, T. (2007). Material Distribution of F-14. Retrieved from http://www.anft.net/f-14/f14-
detail-material.htm
Asworth, V., Booker, C., Charlton, H., & Fairhurst, J. (2012). a Short Introduction To Corrosion
and Its Control Corrosion of Metals and Its Prevention. Corrosion&Protection, 1–9.
Brown, S. A., & Berman, E. (2011). Cadmium alternatives for high-strength steel. Retrieved
from http://www.dtic.mil/dtic/tr/fulltext/u2/a575286.pdf
Campbell, F. C. (2008). Elements of Metallurgy and Engineering Alloys. ASM International.
Retrieved from www.asminternational.org
Fletcher Building. (2008). Fletcher Easysteel. Retrieved from
http://www.easysteel.co.nz/site_files/8545/upload_files/EasysteelSpecialSteelbook.pdf
Hadcock, R. N. (1903). Materials in the Current Air Force. In Aircraft Applications (pp. 13–28).
Springer Science & Business Media Dordrecht. Retrieved from
https://link.springer.com/chapter/10.1007%2F978-1-4615-6389-1_49
Hardisty, H., Mileham, A. R., Shirvarni, H., & Bramley, A. N. (1993). A Finite Element
Simulation of the Electrochemical Machining Process. CIRP Annals - Manufacturing
Technology, 201–204. Retrieved from
http://linkinghub.elsevier.com/retrieve/pii/S0007850607624251
Hou, G. (2014). Substrate Patterning by Nanomachining for Controlled Carbon Nanotube
Growth. University of Cincinnati.
Huyett, G. L. (2004). Engineering Handbook (p. 95). Retrieved from

95
http://www.isibang.ac.in/~library/onlinerz/resources/Enghandbook.pdf
Koch, G. H., Brongers, M. P. H., & Thompson, N. G. (2002). Corrosion costs and preventive
strategies in the United States. NACE International, 1–12.
Kus, M. C., & Diltemiz, S. F. (2016). Fatigue failure in aircraft structural components. In
Handbook of Materials Failure Analysis with Case Studies from the Aerospace and
Automotive Industries.
Lou, H. H., & Huang, Y. (1978). Electroplating. Taylor & Francis. Retrieved from
http://www.getcited.org/pub/101767684
Osha. (2004). Cadmium. U.S. Department of Labor. Retrieved from
https://www.osha.gov/Publications/osha3136.pdf
Revie, R. W., & Uhlig, H. H. (2008). Corrosion and Corrosion Control: An Introduction to
Corrosion Science and Engineering (4th ed.). A John Wiley & Sons, Inc. Retrieved from
http://onlinelibrary.wiley.com/book/10.1002/9780470277270
Rogers, H. C. (1968). Hydrogen Embrittlement of Metals. Science. Retrieved from
http://science.sciencemag.org/content/159/3819/1057
Sabelkin, V., Misak, H., & Mall, S. (2016). Fatigue behavior of Zn-Ni and Cd coated AISI 4340
steel with scribed damage in saltwater environment. International Journal of Fatigue, 90,
158–165. Retrieved from http://dx.doi.org/10.1016/j.ijfatigue.2016.04.027
Scheel, J. E., Prevéy, P. S., & Hornbach, D. J. (2010). The Effect of Surface Enhancement on the
Corrosion Properties, Fatigue Strength, and Degradation of Aircraft Aluminium. NACE
International, 1–15.

96
Shigley, J. E., Mischke, C. R., & Budynas, R. G. (2002). Mechanical Engineering Design. Mc
Graw Hill.
Sriraman, K. R., Brahimi, S., Szpunar, J. A., Osborne, J. H., & Yue, S. (2013). Characterization
of corrosion resistance of electrodeposited Zn-Ni Zn and Cd coatings. Electrochimica Acta,
314–323. Retrieved from http://dx.doi.org/10.1016/j.electacta.2013.05.010
Totten, G. E. (2008). Fatigue Crack Propagation. Advanced Material & Processes, 39–41.
Wang, X. (2014). Electroplated micro- and nanoscale strucutres for emitters and sensors.
University of Central Florida Orlando.
Young, W. C., & Budynas, R. G. (2002). Stress Concentration. In Roarks’s Formulas for Stress
and Strain (7th ed.).

97
REPORT DOCUMENTATION PAGE Form Approved OMB No. 0704-0188
The public reporting burden for this collection of information is estimated to average 1 hour per response, including the time for reviewing instructions, searching existing data sources, gathering and maintaining the data needed, and completing and reviewing the collection of information. Send comments regarding this burden estimate or any other aspect of this collection of information, including suggestions for reducing the burden, to Department of Defense, Washington Headquarters Services, Directorate for Information Operations and Reports (0704-0188), 1215 Jefferson Davis Highway, Suite 1204, Arlington, VA 22202-4302. Respondents should be aware that notwithstanding any other provision of law, no person shall be subject to any penalty for failing to comply with a collection of information if it does not display a currently valid OMB control number. PLEASE DO NOT RETURN YOUR FORM TO THE ABOVE ADDRESS. 1. REPORT DATE (DD-MM-YYYY)
15-09-2017 2. REPORT TYPE
Master's Thesis 3. DATES COVERED (From - To)
September 2015 – September 2017 4. TITLE AND SUBTITLE Corrosion Fatigue Behavior of AISI 4340 Steel Coated With Cadmium and Zinc-Nickel With and Without Scribed Damage in Saltwater Environment
5a. CONTRACT NUMBER
5b. GRANT NUMBER
5c. PROGRAM ELEMENT NUMBER
6. AUTHOR(S) Alzahrany, Riyadh Abdullah, Captain, Royal Saudi Air Force
5d. PROJECT NUMBER
5e. TASK NUMBER
5f. WORK UNIT NUMBER
7. PERFORMING ORGANIZATION NAME(S) AND ADDRESS(ES) Air Force Institute of Technology Graduate School of Engineering and Management (AFIT/EN) 2950 Hobson Way Wright-Patterson AFB OH 45433-7765
8. PERFORMING ORGANIZATION REPORT NUMBER
AFIT-ENY-MS-17-S-001
9. SPONSORING/MONITORING AGENCY NAME(S) AND ADDRESS(ES) Intentionally Left Blank
10. SPONSOR/MONITOR'S ACRONYM(S)
11. SPONSOR/MONITOR'S REPORT NUMBER(S)
12. DISTRIBUTION/AVAILABILITY STATEMENT Distribution Statement A. Approved For Public Release; Distribution Unlimited.
13. SUPPLEMENTARY NOTES This work is declared a work of the U.S. Government and is not subject to copyright protection in the United States.
14. ABSTRACT This research investigates the corrosion fatigue behavior of AISI 4340 high-strength steel coated with electroplated Cadmium and Zinc-Nickel in order to evaluate the possibilities of replacing Cadmium coating with Zinc-Nickel coating. Also, the research investigates the possibility of hydrogen re-embrittlement in the material after scribed damage in the coating layer. The specimens were tested under tension-tension fatigue conditions with a stress ratio of 0.1 and a load frequency of 10 Hz with and without scribed damage in coatings under a salt water environment. The salt water environment consisted of 3.5 wt. % Sodium Chloride at room temperature. The corrosion fatigue performance for Zinc-Nickel coated specimens with and without scribed damage was better than that of Cadmium coated specimens with and without scribed damage. There was no difference in the fatigue life between Zinc-Nickel coated specimens with and without scribe damage for both coatings. The scribed damage in Cadmium coated specimens and Zinc-Nickel coated specimens did not cause any obvious effect, such as hydrogen re-embrittlement. 15. SUBJECT TERMS Corrosion, Fatigue, Fracture Mechanics, hydrogen re-embrittlement, Cadmium coating, Zinc-Nickel coating
16. SECURITY CLASSIFICATION OF: 17. LIMITATION OF ABSTRACT
UU
18. NUMBER OF PAGES 98
19a. NAME OF RESPONSIBLE PERSON Shankar, Mall, Ph. D. (ENY) a. REPORT
U
b. ABSTRACT
U
c. THIS PAGE
U 19b. TELEPHONE NUMBER (Include area code)
(937) 255-6565, ext 4587; [email protected]