corrosion testing of several waterwall coatings history... · corrosion testing of several...
TRANSCRIPT

Corrosion Testing of Several Waterwall Coatings
Prepared for Dominion Power
April 15, 2013
Prepared by John N. DuPont, PhD
Energy Research Center
Lehigh University
Bethlehem, PA 18015
Objective:
The objective of this project was to determine the corrosion resistance of three different
Emisshield coatings (M1, M2, M6) relative to bare steel and a commercially available coating
(45CT).
Testing Procedure
The samples were provided in the ready-to-test condition by Dominion Power. All samples were
½” x ½” x ¼” and were coated on all sides. The samples were corrosion tested at 600 oC in a
tube furnace using a simulated combustion gas of the following composition (by volume): N2-
10%CO-5%CO2-2%H2O-0.12%H2S. A gas flow rate of 250 cc/min was used, and two samples
of each coating and bare steel were placed into the furnace at the start of the test. Weight gain
and post-test examinations by light optical microscopy (LOM) were used as indicators of
corrosion resistance. Each set of samples was removed after the first 250 hours of testing and
weighed. One sample set was then returned to the furnace for an additional 250 hours of
exposure. Upon completion of the second 250 hour exposure, the second set of samples was
removed and weighed. Each sample was placed in a separate crucible during the tests. The
crucible and sample were weighed before and after testing to measure the weight gain of the
sample associated with each exposure time. The crucibles were used to collect any corrosion
scale that spalled from the sample during the test.
The specimens were mounted in epoxy directly after testing to maintain the integrity of the
corrosive scales and subsequently cross-sectioned with a high speed abrasive saw. Ethanol was
used as the lubricant during the cutting process to preserve the corrosion scale. The samples were
then remounted to produce full-size metallographic samples for microstructural observation by
LOM. Metallographic preparation was performed using an ATM Saphir automated grinding and
polishing machine. Grinding was performed using 320, 400, 600, 800 and 1200 grit SiC

metallographic paper for a total of approximately 2 minutes at each grit size. A saturated solution
of paraffin wax in kerosene was used in place of water as a lubricant during all grinding steps to
prevent any water soluble corrosion products from dissolving. Polishing to 1µm and 0.25µm was
done by hand using an aerosol diamond spray as the polishing medium in combination with an
alcohol based lubricant.
Additional specimens (M1, M6, and uncoated) in the as-received condition were prepared for
microhardness testing and microstructural investigation. The samples were mounted in bakelite
and ground and polished to a 0.05µm finish using standard metallographic procedures. Five
1000g Vickers hardness indents were made in each sample at randomly selected locations.
Hardness measurements were performed using image analysis software. After microhardness
testing, the samples were etched in 2% picric acid in ethanol for 20 seconds followed by etching
in 2% nitric acid in ethanol for 30 seconds to reveal the microstructure of the steel substrate.
Results
Figure 1 shows photographs of each sample prior to testing. Figure 2 shows the weight gain of
each sample after the first 250 hour exposure. There is very good agreement between the same
types of samples. At this point, the M1 and M6 coatings showed negligible (undetectable) weight
gain, while the M2 and bare sample exhibited very high weight gains indicative of extensive
corrosion. (The minimum detectable weight change with the scale used for these measurements
was 0.2 mg.) The thermal spray coating exhibited a small amount of weight gain. Photographs of
the samples after the first 250 hour exposure are provided in Figures 3 and 4.
Figure 5 shows the weight gain results for the first and second 250 hour exposures. The trends
observed after 500 hours are consistent with those that were observed after 250 hours. The
uncoated and M2 samples have continued to exhibit significant weight gain. There is only
modest weight gain on the thermal spray sample, and the M1 and M6 samples again showed no
detectable weight gain. Photographs of the samples after the 500 hour exposure are provided in
Figures 6 and 7.
Figures 8 through 10 show LOM photomicrographs of the samples (in cross-sectional view) at
various magnifications after the first 250 hour exposure. Similar LOM photomicrographs are
shown for the samples after 500 hours of exposure in Figures 11 through 13. These results are
consistent with the weight gain measurements. Note that the corrosion scale on the uncoated
sample is relatively thick and is similar to that observed on sample M2. Also not that both
corrosion scales have separated from the underlying steel sample, indicating poor adherence.
Based on results of previous tests conducted at Lehigh, these scales appear to be iron sulfides,
which are known to provide negligible protection. The thermal spray coating exhibits a modest
amount of corrosion product on the surface that is most evident at the highest magnifications.
The M1 and M6 coatings may exhibit a minor amount of corrosion product that is barely visible
at higher magnifications. An example of this is shown in Figure 14. The size of this scale,

together with the slight edge rounding that occurred at the surface during sample preparation,
make it difficult to identify this as a corrosion scale for certainty. Scanning electron microscopy
coupled with energy dispersive spectroscopy would be needed to clarify this.
There were occasional locations of the M1 and M6 coating that exhibited porosity. The presence
of porosity may be a concern because these coatings are thin relative to other coating types.
Examples of this are shown in Figure 15, where pores are shown that occupy a large fraction of
the coating thickness. These were almost always observed at sample corners. An isolated region
was also observed where the M2 coating was breached and therefore exhibited localized
corrosion at the breach (Figure 16). Lastly, There were areas within the thermal spray coating
that appeared to exhibit localized corrosion along the substrate/coating interface (Figure 17).
This is interfacial corrosion is attributed to rapid diffusion of the corrosive gas through splat
boundaries and porosity. Final coating failure often then occurs via failure along the corroded
interface.
Figures 18 and 19 show LOM photomicrographs of the steel substrate for the uncoated samples
and the M1 and M6 coated samples. The substrate for each sample consists primarily of ferrite
with a small amount of pearlite, which is typical of a low carbon steel. Abnormal grain growth
was observed near the edge of each substrate. The cause(es) of this are not known from this
work. Since the grain growth is also observed on the uncoated sample, it cannot be attributed to
the coating process. Table 1 shows the hardness results. The uncoated and M6 coated sample
substrates have very similar hardness values, while the substrate from the M1 coated sample is
slightly harder. In general, the coating process did not appear to have any significant effect on
the substrate microstructure or hardness.
Conclusion
Based on these results, coatings M1 and M6 appear to provide very good corrosion resistance in
the atmosphere tested. The performance is slightly better than the 45CT thermal spray coating.
Coating M2 provided negligible protection. Attention should be paid to possible defects in
coatings M1 and M6, since the samples are thin relative to other commonly used protective
coatings. The coating process did not appear to have any significant effect on the substrate
microstructure or hardness.

Figure 1: Corrosion coupons before testing
M2
Thermal
Spray
M1
M6
Uncoated
M1
M6
Uncoated
M2
Thermal
Spray

Figure 2: Coating corrosion performance after 250 hours
0.00
0.02
0.04
0.06
0.08
0.10
0.12
0.14
0.16
M1 M2 M6 Thermal Spray
Uncoated
We
igh
t G
ain
(g)
Coating Performance
250hrs

Figure 3: Corrosion coupons after 250 hour exposure
M2
Thermal
Spray
M1
M6
Uncoated
M1
M6
Uncoated
M2
Thermal
Spray

Figure 4: Corrosion coupons after 250 hour exposure
M2 Thermal
Spray M1
M6 Uncoated M1
M6 Uncoated
M2 Thermal
Spray

Figure 5: Coating corrosion performance after 500 hours
0.00
0.05
0.10
0.15
0.20
0.25
0.30
0.35
M1 M2 M6 Thermal Spray
Uncoated
We
igh
t G
ain
(g)
Coating Performance
250hr Avg 500hrs

Figure 6: Corrosion coupons after 500 hour exposure
M2
Thermal
Spray
M1
M6
Uncoated

Figure 7: Corrosion coupons after 500 hour exposure
M1 Uncoated M6
Thermal
Spray M2

M1 M2 M6
Thermal Spray Uncoated
Figure 8: Light optical micrographs of the
corrosion scale developed on coating surfaces
after 250hr exposure.

M1 M2 M6
Thermal Spray Uncoated
Figure 9: Light optical micrographs of the
corrosion scale developed on coating surfaces
after 250hr exposure.

M1 M2 M6
Thermal Spray Uncoated
Figure 10: Light optical micrographs of the
corrosion scale developed on coating surfaces
after 250hr exposure.

M1 M2 M6
Thermal Spray Uncoated
Figure 11: Light optical micrographs of the
corrosion scale developed on coating surfaces
after 500hr exposure.

M1 M2 M6
Thermal Spray Uncoated
Figure 12: Light optical micrographs of the
corrosion scale developed on coating surfaces
after 500hr exposure.

M1 M2 M6
Thermal Spray Uncoated
Figure 13: Light optical micrographs of the
corrosion scale developed on coating surfaces
after 500hr exposure.

Figure 14: Possible signs of corrosion scale buildup on coating M1
Figure 15: Defects in coatings (A) M1 and (b) M6 at sample corners
Figure 16: Breach in coating M2

Figure 17: Development of corrosion product at coating-substrate interface due to penetration of test gas
through thermal spray coating
Table 1: 1000g Vicker microhardness of selected specimens
Uncoated
M1
M6
Field 1 132.55
Field 1 151.92
Field 1 131.06
Field 2 133.46
Field 2 150.45
Field 2 131.35
Field 3 135.3
Field 3 153.03
Field 3 131.65
Field 4 131.95
Field 4 148.64
Field 4 130.76
Field 5 140.75
Field 5 148.64
Field 5 133.46
Average 134.8 ± 3.6
Average 150.5 ± 2.0
Average 131.7 ± 1.1
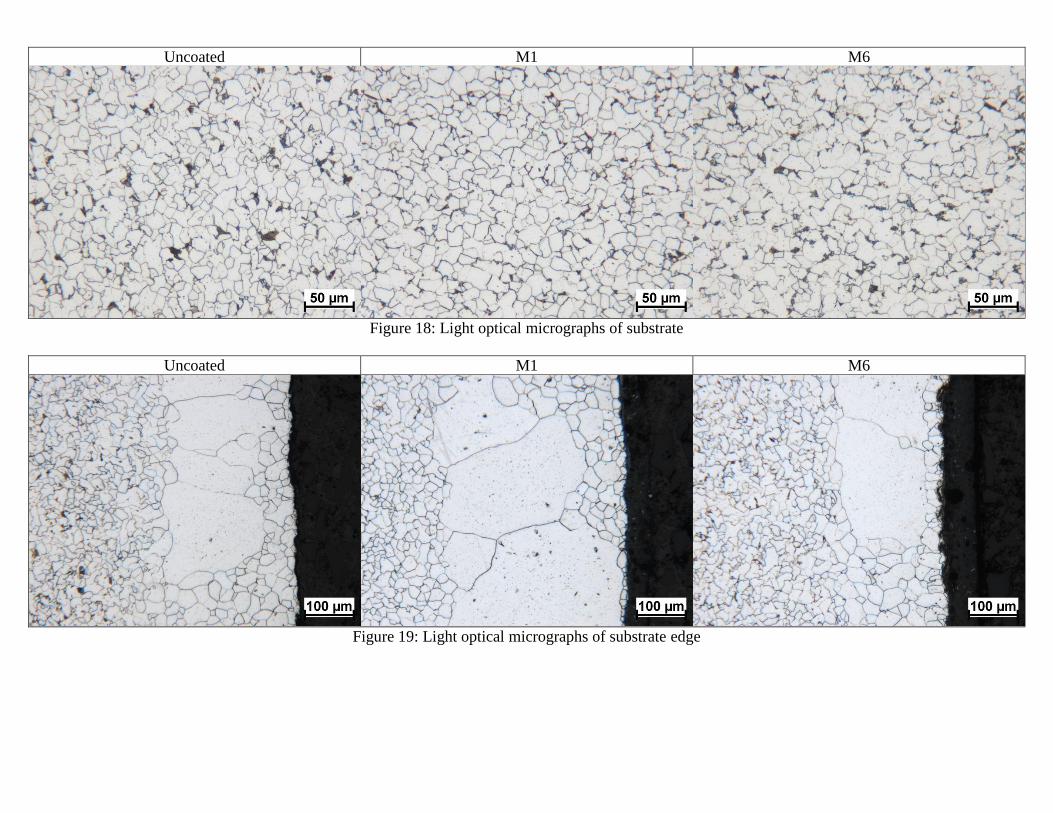
Uncoated M1 M6
Figure 18: Light optical micrographs of substrate
Uncoated M1 M6
Figure 19: Light optical micrographs of substrate edge