corruption and inefficiency: theory and evidence from …webfac/bardhan/e271_f06/bo.pdfantonio...
TRANSCRIPT

Corruption and Inefficiency: Theory and Evidence from Electric Utilities*
* First version: January 2004. Ernesto Dal Bó: [email protected]. Martín Rossi: [email protected]. We thank two anonymous referees, Steve Bond, Severin Borenstein, Simon Cowan, Rafael Di Tella, Antonio Estache, Paul Gertler, David Levine, Pablo Spiller, Catherine Wolfram, and participants at various seminars and conferences for valuable comments.
Ernesto Dal Bó University of California-Berkeley
Martín A. Rossi Universidad de San Andrés
July 2006
Abstract
We investigate the determinants of the efficiency of firms with a focus on the role of
corruption. We construct a simple theoretical model where corruption increases factor
requirements of firms because it diverts managerial effort away from factor coordination. We
then exploit a unique dataset comprising firm-level information on 80 electricity distribution
firms from 13 Latin American countries for the years 1994 to 2001. As predicted by the
model, we find that more corruption in the country is strongly associated with more
inefficient firms, in the sense that they employ more inputs to produce a given level of output.
The economic magnitude of the effects is large. The results hold both in models with country
and firm fixed effects. The results survive several robustness checks, including different
measures of output and efficiency, and instrumenting for corruption. Other elements
associated with inefficiency are public ownership, inflation, and lack of law and order, but
corruption appears to play a separate and more robust role.
JEL Classification: D21, L94, D78.
Keywords: corruption, efficiency, regulatory capture, electricity, public vs. private.
1
1. Introduction We investigate the connection between corruption and the efficiency of
electricity distribution firms in Latin America. Studying the determinants of the
efficiency of firms is important because the ability of firms to transform inputs into
outputs will affect the economic performance of nations. We take advantage of a
unique dataset comprising a panel of 80 electricity distribution firms from 13 Latin
American countries for the years 1994 to 2001.2 Our data on corruption were provided
by International Country Risk Guide and Transparency International.
We begin by constructing a simple theoretical model to crystallize our
explanation for how corruption could affect firm efficiency. Our root assumption is
that in corrupt environments the fate of firms is not tightly related to managerial
efforts devoted to supervising and coordinating the use of productive factors. Thus,
corruption diverts managerial effort away from the productive process, and the way
for firms to meet their service obligations is to use more inputs.3 Thus, the model
predicts that more corrupt countries will have less efficient firms. The model is
agnostic regarding the impact of corruption on profits, and it is compatible with
stories of regulatory extortion against firms, regulatory capture, and internal
corruption in firms. We then take the model to the data, and find that more corruption
in a country is strongly associated with inefficiency, in the sense that firms employ
more inputs to produce a given level of output. The economic magnitude of the effect
is large. For example, if the median country in our sample (Brazil) had the corruption
level of the least corrupt country in the sample (Costa Rica), the firms in the former
country would use 18% fewer workers. We also find that private firms use
significantly less labor than public ones.
Our main focus is on labor efficiency, so our default empirical strategy is to
estimate a parametric labor requirement function to analyze the various determinants
of labor use. Our result that corruption raises labor requirements holds under a variety 2 The dataset was constructed using the Regional Electric Integration Commission (CIER) reports, which are based on firm surveys. We complemented the CIER reports with information provided directly by regulators and governmental agencies. See Section 3 for more detail. 3 The presence of service obligations reflects specific features of electricity distribution. The idea that corruption diverts managerial effort away from productive tasks resonates with classic rent-seeking arguments. Besides the fact that our model is also compatible with stories other than rent-seeking, we take a step forward by specifying the internal reaction of firms. Rent-seeking is compatible with firms duplicating a few managerial positions (some managers will lobby, and others will supervise factor use). This, however, is unlikely to have empirically discernible effects on the overall number of

2
of controls beyond basic firm features such as the size of output and capital inputs.
Such controls include firm ownership type and the level of development in the
country (as approximated by GNP per capita). Apart from year dummies, our default
specification includes country dummies in order to deal with the possibility that
corruption and inefficiency may be jointly determined by some omitted country-
specific time-invariant variable. To further probe the connection between efficiency
and corruption, we estimate specifications with firm fixed effects, and find that the
association is still significant.
The characteristics of the industry and the countries in our sample favor
comparability. Electricity distribution involves a mature technology that does not
differ significantly across countries. Moreover, all the firms in our sample are from
Latin American countries having the same colonial origins, relatively similar
regulatory regimes, the same legal origins, and quite homogeneous cultural features.4
Nevertheless, our econometric specification includes controls varying by country and
time such as the prevalence of law and order and indicators of macroeconomic
instability. These controls help to disentangle the effects that corruption may have
from those of other forces that may also affect efficiency. Corruption remains
significant after including all of these controls. Inflation, inflation variation, and
deficiencies in law and order appear themselves to be associated with greater
inefficiency, especially in the firm fixed effects specification. This is interesting
because it suggests that corruption plays a separate role that is distinct from the
impact of a highly unstable or insecure environment. Of all the factors varying by
country and time that we analyze, corruption is the only one that is both invariably
significant across specifications and economically important.
To check our focus on labor efficiency, we also estimate a model where we
measure efficiency in terms of operation and maintenance expenditures, rather than in
terms of labor. The significant negative association between corruption and efficiency
persists. We also address several potentially serious problems for our estimation, such
as the possibility of survey selection bias or results being driven by heterogeneity in
employees. Our model isolates a (complementary) firm reaction that is likely to have empirically discernible effects: more workers are used to make up for worse supervision. See Section 2. 4 The importance of elements such as colonial and legal origin in the determination of economic and political performance has been stressed, for instance, by Acemoglu, Johnson, and Robinson (2001) and La Porta et al. (1998). The only country with different language and colonial origin in our sample is Brazil (a former Portuguese, rather than Spanish, colony). The exclusion of Brazilian firms from the regressions does not alter the results.
3
degrees of vertical integration. We find no evidence that any of these elements drives
results. A crucial aspect in the measurement of efficiency in energy distribution is the
measurement of output. Our default measure of output is energy sales (in gigawatts
hour�GWh). If energy theft is higher in more corrupt countries, the use of energy
sales to measure output would make firms in more corrupt countries appear less
efficient than they are. We provide a different treatment using sales plus losses as the
output variable (which includes stolen energy) and find again that corruption is
significantly associated with inefficiency.5
A relevant concern with corruption studies is whether results are affected by
an endogeneity bias. In Section 6 we argue that our use of corruption data at the
country level in combination with firm-level efficiency data can be exploited to
reduce the chances of an endogeneity problem, given that our controls cover effects
specific to country, year, and country-year combinations. Additionally, when we run
an instrumental variable specification using openness to trade as instrument,
corruption remains significantly associated with firm inefficiency.
There are a number of studies addressing the consequences of corruption at the
macro level, including Mauro (1995) and Ades and Di Tella (1997).6 Work examining
consequences at the micro level should be important because it will help pin down the
ways in which corruption damages the economic performance of countries. Work on
corruption using micro data is rare either in connection with the causes or the
consequences of corruption. In connection with the causes of corruption, Svensson
(2003) studies characteristics of firms that pay bribes, Clarke and Xu (2004) study the
characteristics of firms that pay bribes to utilities, and the characteristics of utilities
whose employees collect bribes from customers. Di Tella and Schargrodski (2003)
analyze the role of wages and monitoring in the context of hospital procurement.
Fisman (2001), in turn, studies the value of political connections at the firm level, and
Khwaja and Mian (2004) analyze the provision of loans to politically connected firms.
We still rely on country-level corruption indices, which is less desirable than
having a more objective measure of corruption affecting each firm. However, the use
of such indices facilitates conducting our study on a continental scale, which has some 5 We also used the percentage of lost energy as a regressor in order to proxy for the seriousness of energy theft (which could require extra employment to combat illegal use). This did not alter the results either.

4
interest for external validity reasons. The use of firm-level data, in turn, allows us to
avoid relying solely on national accounts data where valuation issues and public
sector participation make it more difficult to assess the channels through which
corruption affects economic performance. The measurement of the magnitudes in our
firm-level data is fairly uncontroversial (mostly physical units), allowing us to address
empirically a hypothesis that to our knowledge remains untested: corruption destroys
wealth because it is associated with firms that are technically inefficient. This finding
is distinct from the more vague statement that corruption will cause managers to
engage in non-productive activities. Courting officials could help firms circumvent
unreasonable regulations, allowing firms to be more, not less, efficient.
The plan for the paper is as follows. The next section presents our simple
theoretical model. Section 3 describes our data. Section 4 describes the electricity
distribution industry, defines our measure of efficiency, and presents the econometric
model. Section 5 shows our empirical results, and provides evidence of their
robustness. Section 6 presents further checks on robustness. Section 7 concludes.
2. The Model All firms in our sample are either publicly or privately owned, and are all
engaged in a regulatory relationship with a governmental agency. In the case of
private firms, they are regulated by an agency that is typically specific to the industry
(electricity) or the sector (energy). In the case of publicly owned firms, they are under
the oversight of a ministry-type governmental agency. The firms in our sample have
the obligation to provide the service of electricity distribution to a given number of
customers in a given geographical area. For modeling purposes, we will assume that
firms are requested to produce an output of fixed size Q , which here is assumed to be
a positive real number.
The provision of this service requires the use of labor, capital, and managerial
effort in the form of coordination and supervision of the use of labor and capital.
Managers are able to improve the technology of the firm by exerting effort, in the
sense that they can increase the rate at which capital and labor are transformed into
6 These papers study the association between corruption and national growth and investment. Lambsdorff (2003) looks the association between corruption and capital to GDP ratios at the national level.
5
output. Capital inputs are tightly dependent upon the extent of service, and treated in
the literature on electricity distribution as exogenous in the short run (see Neuberg,
1977; and Kumbakhar and Hjalmarsson, 1998). For example, the firm�s
transformation capacity and the extension of its network are tightly related to the
number and type of customers to be served and the area over which they are scattered.
Thus, variations in efficiency are largely connected with the use of labor. Unless
stated otherwise, we say a firm is inefficient when it is not minimizing labor use given
its output and capital stock. Given the exogeneity of capital, to save on notation we
will consider the following production function,
),()( lfeAQ s=
where es�the managerial effort devoted to supervision and coordination�has the
effect of raising total productivity A(.). The amount of labor used is denoted by l. We
assume 0seA > , 0
s se eA < , 0lf > , and 0llf < (subscripts next to functions indicate
arguments of differentiation throughout). The rationale for this formulation is that,
given the number of workers, managers that tightly coordinate and supervise workers
will elicit better performance and more output. Another view is that more workers
might be required to make up for less attentive supervision. For example, a manager
that devotes all his time to overseeing employees can receive information on the state
of different transformers and connections from many inspectors scattered on the field.
He can then direct a single repair team to each location that comes to need attention.
A manager that is not available to receive information and give orders may have to
rely on associating repairmen to each one of the inspectors, so that they can execute
repairs if needed (thus raising the number of employed repairmen). With variations,
this basic story can be told to capture what happens at different levels of the hierarchy
in an electric utility.
It is important to note that, given the contractual obligation to provide Q units
of output, the use of l units of labor will imply that managers must provide exactly
−
)(1
lfQA units of supervision effort. This is an important part of our model: a
feature specific to the industry analyzed (an exogenous service obligation) determines
the relationship between supervision and labor use. Another important part of the
model is managerial payoffs. We assume that managers care about their total material
rewards y and about the total effort e they exert:

6
),(ey ψ− (1)
where the cost of effort (.)ψ is increasing and convex.7 As will be explained shortly,
the total effort e is the sum of effort deployed in various activities.
The total rewards y to those running the firm stem from various sources.
Managers are typically not the owners of the firm, but they can be expected to care
about profits if higher profits trigger higher compensation and perks. Often managers
may also pursue objectives that do not generate profit, like rendering services to a
political party. In the discussion at the end of the section, we explain how such
objectives can be incorporated in the model. For expositional reasons, here we adopt
the simplest model possible that captures the effect of interest. So for now, we assume
that managers have a stake in profits. Even in public firms where managerial
incentives may be less high-powered�and conditional on the pursuit of other
objectives�higher profits are likely to benefit managers, if only because higher
profits allow more latitude in pursuing other goals. Given this, and to maximize
simplicity, we will now abstract from the difference between managers and owners,
and suppose that managers care directly about profits (in the discussion at the end of
the section we explain how to reintroduce the distinction between owners and
managers in the model). Thus, we will write π=y . Profits, in turn, are given by,
wlQcep p −= ),(π , (2)
where w are wages paid to workers, and p(.) is the price of a unit of service. This
formulation captures the fact that the price charged by the firm may depend on its
efforts ep at negotiating with the government and on the degree of corruption in the
country. In non-corrupt countries prices are seen as being close to what industry
jargon calls the �technical price�, and efforts devoted to moving the price away from
the technical benchmark are largely irrelevant. When regulators can be captured
instead (or they can blackmail firms), such negotiation efforts are likely to matter.
Similarly, p(.) can be seen as a price net of certain costs over which procurement
managers of the firm have power. When procurement managers can collude with
providers and overcharge the firm, top managers of the firm may want to devote more
7 The utility from material rewards can be made concave without affecting the analysis.
7
effort at curbing overcharging and improving the net price for the firm.8 Thus, our
model is compatible with at least two ways in which corruption can damage the
efficiency of firms. One concerns external corruption�or the possibility that public
officials are corrupt. The other concerns internal corruption�as when procurement by
the firm is subject to abuse.
Our key assumption is,
Assumption 1: Higher corruption in the country increases the marginal return to effort
in activities different from factor coordination (i.e. 2
0pe c
p
d ppde dc
≡ > ).
This assumption captures the central element of our theory of diversion of
managerial effort: in more corrupt countries, tasks that do not help the productive
process are more rewarding at the margin.9 Note that corruption, however, need not
lower nor raise profits (or other sources of managerial payoffs) for a given level of
effort. When corruption takes the form of regulatory extortion or internal procurement
abuse, profits will tend to suffer unless managers devote significant efforts to courting
regulators or monitoring procurement officers. In other circumstances, such as those
associated with active rent-seeking, corruption may mean that the regulator can be
captured easily. In this case, for any level of effort, the firm�s profits are likely to be
higher than otherwise. We remain agnostic regarding the effects of corruption on the
level of profits. To abstract from these differences, we assume that, around
equilibrium,
Assumption 2: Corruption does not directly raise nor lower profits (i.e. 0=cp ).
This assumption is mainly made for simplicity. Our results go through when
corruption has both a negative and a not strongly positive level effect on managerial
payoffs. Thus, our theory is compatible with firms in more corrupt environments
making both more or less money (in other words, the theory can accommodate rent-
seeking and extortion or internal corruption stories). We also assume that both forms
8 See Laffont and Martimort (1999) for a model in which the way to limit collusion in a hierarchical agency is to separate powers. To the extent to which duplicating procurement officials is expensive, top managers can be expected not only to separate powers but also to increase their monitoring of those employees, which will detract from the ability top managers have to oversee the productive process. 9 Corruption may have additional effects to those captured by Assumption 1. For example, it may increase workers� predisposition to shirk, which would in turn affect managers� incentives to monitor workers. Our assumption captures a sufficient condition for increases in corruption to lead to worse managerial supervision. Thus, our assumption is complementary to additional effects from corruption further increasing inefficiency.

8
of effort face decreasing marginal returns (so on top of A(.) being concave, we have
0<ppeep ).
In the world we have characterized, managers allocate effort and choose the
labor requirements of the firm to solve (using (2) into (1), the equality π=y , and
recalling that es=
−
)(1
lfQA ),
[ ]
+−− −
)(),( 1
, lfQAewlQcepMax pplep
ψ . (3)
The first-order conditions for this problem are,
0=− ee Qpp
ψ
0)((.) 2
1
=+−−
lff
ddAQw l
eψ ,
where subscripts next to functions indicate the argument of differentiation. The
second-order conditions for a maximum are shown in the Appendix. These two first-
order conditions characterize solutions ep*, and l*. Given the obligation of service
provision at level Q , the amount of labor chosen is inversely related to the amount of
effort provision in supervision and coordination es*. Our focus is now on how
corruption affects the level of price negotiation effort ep*, labor use l*, and effort es
*,
in order to derive the effects of corruption on firm efficiency.
Proposition 1: Firms in more corrupt environments will be more inefficient: their
managers will exert more effort at improving prices, less effort at coordinating the use
of factors, and as a consequence they will employ more labor to produce a given level
of output (i.e. ,0*
>dc
dep ,0*
<dc
des and 0*
>dcdl ).
The proof to this proposition is in the Appendix and contains the formal
details of the comparative static exercise involved. The intuition for the result is that
managers placed in more corrupt environments do not see their rewards tied to the
efficiency of the productive process. Therefore, corruption causes an increase in
forms of effort that do not help production. Because all effort is costly to managers,
they find it optimal to reduce the effort they put into overseeing production. Although
9
this might seem a very general intuition, note that in our model it is associated to a
specific feature of the industry we study. The way to make up for diverted managerial
effort is to hire more workers because firms face a service target obligation. Hence,
production being fixed, excess employment is unambiguously inefficient.
Discussion
Our modeling strategy avoids precisions on the sources of discretion that firms
and regulators must have in order to, for example, negotiate a price of service that is
not what consumers, the ultimate principal, would desire. Our model is compatible
with introducing more structure and deriving this behavior as a response to various
distortions. One of these is asymmetric information; another is badly functioning
institutions that, even under symmetric information, hinder accountability.10 Our
current model can be seen as a reduced form for a model of regulatory capture in the
spirit of Laffont and Tirole (1993), where informational asymmetries are central. But
it is also compatible with other sources of power for those who end up participating in
corrupt transactions.
Our model can also accommodate more classic accounts of the way corruption
operates, such as in rent-seeking models (see for instance Krueger, 1974). In this
literature, the presence of a distortion (such as an importing quota) provides agents
with incentives to lobby officials, which is an unproductive activity. This type of
account, however, does not explain what may occur inside firms. Lobbying is
typically a task performed by managers at the very top of an organization. A manager
that must spend time lobbying may produce less, or hire another manager just like
himself to oversee production. In electricity distribution, producing less is not an
option. As a result, managerial positions may be duplicated, but it is unlikely that the
duplication of managerial positions at the top would have easily discernible effects on
the overall size of the workforce. Our conjecture�captured in our modeling
approach�is that managers also respond by over-employing factors. In the case of
labor this would include workers and perhaps middle and low level managers, so we
expect to see clearly discernible effects on labor requirements.
10 In fact, some of the countries in our sample have not had very healthy democracies during the sample period. Presumably, imperfectly functioning democracies yield unchecked power to regulators, as their political bosses do not face very stringent controls from citizens.

10
Lastly, this model can be enriched to consider the possibility that (i) managers
are different from owners, and that (ii) managers pursue objectives different from
profit generation. The first point implies that managers care about profits only to the
extent to which these affect their compensation. A way to study this possibility is to
assume that profits affect managerial compensation according to some �compensation
package� function m(π ). What is required for our results to go through is just that this
function is not too convex.
Regarding non-profit objectives, it is possible that by devoting effort en to
practices such as nepotism or other types of private agendas, managers can obtain
rewards n(en,c). These rewards are likely to depend on managerial effort and on the
level of corruption in the country (for example, the extent to which a public company
may be used to pursue employment objectives may be related to the level of
accountability at all levels in the hierarchy formed by managers, politicians, and,
ultimately, citizens).
In this more complex world, assume managers care about total rewards
according to the concave utility function U(.). Managers will then solve the following
problem,
[ ]{ }
++−+− −
)(),(),( 1
,, lfQAeecenwlQcepmUMax npnplee np
ψ
Under the assumption that managerial incentives m(.) are not too convex in
profits, the solution to this problem is analogous to the simpler one we have exposed.
An increase in corruption will not necessarily raise all forms of non-productive effort,
but it will raise at least one, while decreasing effort devoted to running production,
causing inefficiency.
3. The Data We use three different sets of data. We use country-level data on corruption,
firm-level data on inputs and outputs of electricity distribution, and a number of
control variables that can fall into either the country or firm level categories.
Our firm-level data correspond to 80 Latin American firms between 1994 and
2001. Data on firms were collected from several sources. Data for South America in
the period 1994-2000 were mostly compiled from reports produced by CIER
(Comisión de Integración Energética Regional, a commission that coordinates the

11
different participants in the electricity sector in South America). The reports used are:
Datos Estadísticos. Empresas Eléctricas. Año 1994; Datos Estadísticos. Empresas
Eléctricas. Años 1995-1996-1997; Información Económica y Técnica de Empresas
Eléctricas. Datos 1998-1999; and Información Económica y Técnica de Empresas
Eléctricas. Datos 2000. Data for Argentina in the year 2001 were provided by
ADEERA (Asociación de Distribuidores de Energía Eléctrica de la República
Argentina, an institution that coordinates firms in the Argentine electricity sector).
Other South American data corresponding to the year 2001 were obtained from firms�
balance sheets. Data for Costa Rica were provided by the energy department of
ARESEP (Autoridad Reguladora de los Servicios Públicos, the regulator of public
services in Costa Rica). Data for Panama were obtained from the firm�s balance sheet.
Data for Mexico were provided by CFE (Comisión Federal de Electricidad, the
authority in charge of the electricity sector in Mexico).
Most of the data were verified using information provided by regulators and
governmental agencies. In this respect, we used information provided by ADEERA,
ENRE (Ente Nacional Regulador de la Electricidad, the regulator of the electricity
sector in Argentina), ANEEL (Agência Nacional de Energia Elétrica, the regulator of
the electricity sector in Brazil), CONELEC (Consejo Nacional de Electricidad de
Ecuador, governmental agency in charge of the electricity sector in Ecuador), CTE
(Comisión de Tarifas Eléctricas, an agency in charge of setting electricity prices in
Peru), and URSEA (Unidad Reguladora de Servicios de Energía y Agua, regulator of
the water and energy services in Uruguay).
The database includes the following variables: sales to final customers, in
GWh; number of final customers; service area, in square kilometres; total distribution
lines, in kilometres (including high and low voltage power lines); total transformer
capacity, in mega-volt-ampere, MVA; and number of employees. Given our empirical
strategy, an important input measure for firms is employed labor. Labor is measured
as the number of full-time equivalent employees. We constructed this measure using
raw information on full-time employees, part-time employees, and employees under
temporary contracts.11 We included the latter to account for the possibility of different
subcontracting practices.
11 Part-time employees and employees under temporary contracts were counted as half-time employees. In vertically integrated firms, the number of employees of firm j was calculated as follows:

12
Our sample is representative of the electricity distribution sector in the region.
It covers the following countries: Argentina (29 firms supplying electricity to
approximately 80% of the total number of customers in the country), Bolivia (2,
31%), Brazil (4, 19%), Chile (2, 18%), Colombia (4, 30%), Costa Rica (4, 91%),
Ecuador (12, 61%), Mexico (1, 79%), Panama (1, 62%), Paraguay (1, 100%), Peru
(11, 97%), Uruguay (1, 100%), and Venezuela (8, 92%). Summary statistics of the
unbalanced panel are presented in Table 1. A total of 352 observations are available
for estimation.
Our measure of corruption is the Corruption Index produced by International
Country Risk Guide (ICRG) in December of each year. This index is widely used in
the economics literature (going back to, for example, Knack and Keefer, 1995). The
ICRG corruption index is meant to capture the likelihood that government officials
will demand special payments, and the extent to which illegal payments are expected
throughout government tiers as ranked by panels of international experts. The index is
specifically designed to allow for cross-country comparability and is therefore
particularly suited to our approach. The ICRG index ranges between six (highly
clean) and zero (highly corrupt), so note that a higher corruption index corresponds to
a less corrupt country. Summary statistics of the ICRG corruption index are presented
in Table 1.
4. Efficiency in Electricity Distribution: Background,
Definition, and Econometric Model Electricity distributors use their network and transformer capacity, together
with labor, to deliver energy to a specified set of customers in a given geographical
area. Our econometric model of electricity distribution reflects this: it includes a labor
input (the number of employees), two capital inputs (transformer capacity and
kilometers of distribution network), and three outputs (the number of final customers,
the total energy sold to final customers, and the service area).12
2 4
51 1
1 2 ,kj kj jk k
j j j l l ll l l= =
= + + ∑ ∑ where 1 jl = distribution (proper); 2 jl = billing and collection; 3 jl =
generation; 4 jl = transmission; and 5 jl = administrative and general. 12 Jamasb and Pollitt (2001) review the different input and output variables used in models of electricity distribution. They find that the most frequently used outputs are units of energy delivered, number of customers, and the size of the service area, whereas the most widely used physical inputs are number of

13
As observed by Kumbhakar and Hjalmarsson (1998), while productivity in
electricity generation is mainly determined by technology, productivity in distribution
is, to a large extent, driven by management and efficient labor use.13 Accordingly,
unless stated otherwise, the concept of efficiency used throughout the paper is labor
efficiency: a firm X is inefficient relative to a firm Y if, given the capital inputs, X
uses more labor than Y to produce a given output bundle. Labor is measured as the
number of full-time equivalent employees, as described in the previous section. Our
goal, then, is to produce a model that can explain the determinants of labor use,
including a variety of technological factors, the characteristics of service, corruption,
and a set of controls.
Latin American electricity distribution firms have the obligation to meet
demand; therefore we consider the amount of electricity sold to final customers (in
gigawatt hours, GWh) and the number of final customers served as exogenous
outputs. We include the service area (in square kilometers) as an output, since an
increase in the service area either increases the use of resources or reduces the supply
of other products (Førsund and Kittelsen, 1998). Although there is an occasional
redrawing of service area boundaries due to mergers or takeovers, for practical
purposes each firm has little direct control over the size of its service territory; hence,
the service area may be considered an exogenous variable.
As noted by Neuberg (1977), Kumbakhar and Hjalmarsson (1998), and Hattori
(2002), distributors have limited control over the length of distribution lines, since the
amount of capital embodied in the network reflects geographical dispersion of
customers rather than differences in productive efficiency. And this is also the case,
although perhaps to a lesser degree, for transformer capacity (in mega-volt-amper,
MVA). Therefore, we treat distribution lines (in kilometers) and transformer capacity
as exogenous capital variables representing the characteristics of the network.14
Following the above considerations, our approach to studying the determinants
of labor use in electricity distribution is to estimate a parametric labor requirement
employees, transformer capacity, and network length. Our measure of energy supplied to customers is actually energy sold to them, which does not include technical energy losses or energy theft. This omission is potentially important so we will also estimate an alternative specification including energy losses, which is an alternative measure for the actual output of the firm. 13 Typically, the labor cost share in generation amounts to less than 10% while in distribution the figure is around 50%. 14 The Dutch regulator also specifies network length and transformer capacity as exogenous to the firm (DTe, 2000). The DTe argues that network length and transformer capacity can be seen as variables for customer dispersion.

14
function.15 We use a translog functional form because it provides a good second-order
approximation to a broad class of functions, and admits the Cobb-Douglas as a special
case. A translog labor requirement model with three outputs and two exogenous
capital inputs, for a panel of 1,...,i N= firms producing in 1,...,c C= countries, and
observed over 1,...,t = Τ periods, may be specified as 3 3 3 2 2 2
, , , , , , ,
1 1 1 1 1 1
2 3, , , , ,
1 21 1
1 12 2
,
i t i t i t i t i t i t i tc t m m mn m n k k kj k j
m m n k k j
i t i t c t i t i tkm k m
k m
l y y y x x x
x y Corruption DPub v
α α ψ ϖ ϖ β β
κ λ λ
= = = = = =
= =
= + + + + + + +
+ + + +
∑ ∑∑ ∑ ∑∑
∑∑ (4)
where 1 2 3 1 2, , , , , and l y y y x x are the natural logarithms of labor, sales, customers,
area, lines� length, and transformer capacity, DPub is a public ownership dummy
variable, and v is the random error term. To account for time effects in a flexible way
we include year fixed-effects ( )tψ . The year fixed-effects measure the efficiency
impact of sector-level shifts over time, such as secular technology trends,
international macroeconomic fluctuations or energy price shocks. To control for
potential biases caused by any omitted variables that are country specific and time
invariant, we include country fixed-effects ( )cα . We also estimate an alternative
specification with firm fixed-effects rather than country fixed-effects. In order to test
the model derived in Section 2 we include the corruption index corresponding to the
country in which the firm operates. In terms of the model in equation (4), Proposition
1 predicts 1 0λ < (firms operating in more corrupt environments are more
inefficient).16
A usual approach in efficiency studies employs stochastic frontiers, which
allow for the measurement of the level of inefficiency in each firm (a magnitude we
do not focus on). See Kumbhakar and Lovell (2000) for a discussion of stochastic
frontier techniques; for applications taking into account firm heterogeneity, see for
instance Orea and Kumbhakar (2004), El-Gamal and Inanoglu (2005) and Greene
(2005). Because we are only interested in testing the comparative static effects of
corruption on efficiency�not on the level of efficiency per se�, and the stochastic
frontier approach requires further distributional assumptions, we do not rely on it. The
15 The idea of input requirement functions goes back to Diewert (1974). For an application, see Kumbhakar and Hjalmarsson (1995). 16 Recall that higher values of the corruption index imply a lower level of corruption.

15
concept of inefficiency we use is broad: any environmental factors that, given output
and technical characteristics, raise labor requirements will be said to cause
inefficiency. The reason is that, absent those factors, the firm would utilize fewer
resources to produce the same output. The extra use of resources due to adverse
environmental conditions is a waste given what is technically feasible, and we
therefore call it inefficiency. Note that managers may be devoting a lot of effort to
tasks that are necessary to keep the firm successful. In this sense, inefficiency may be
unrelated to shirking by workers or managers, but be instead a reflection of a bad
business climate.
5. Empirical Results Ordinary least squares (OLS) estimates of the labor requirement function
model are reported in Table 2. A concern in this type of study is that the shocks
affecting all firms in a given country in the same year may be correlated, thus biasing
standard error estimates. To address this issue, all standard errors are clustered on
country-year combinations.
We begin by reporting some estimates regarding technological parameters.
The time dummies are significant in all models we estimated and imply labor
productivity growth of about 5% per year�the null hypothesis of no technical change
is rejected at the 1% level, according to a likelihood ratio (LR) test.17 These results are
similar to those reported in the specialized electricity literature (see Rudnick, 1998;
Fischer and Serra, 2000; Rudnick and Zolezzi, 2001). We test the null hypothesis of a
Cobb-Douglas specification against the more general translog using a LR test and we
are able to reject the null at the 1% level. This result is also in line with conventional
wisdom. In summary, the estimation of the technological parameters conforms to
expectations.
As shown in column (1) of Table 2, the coefficient of the corruption variable
is negative and significant at the 1% level, suggesting that firms operating in countries
with lower levels of corruption use fewer employees to produce a given bundle of
outputs than distributors operating in more corrupt environments. This is the result
17 The likelihood ratio (LR) statistic is defined by LR = 2[LU � LR], where LR is the log likelihood of the restricted model and LU is the log likelihood of the unrestricted model. Under the null hypothesis, LR is asymptotically distributed as a chi-square with degrees of freedom equal to the number of restrictions involved.

16
predicted by Proposition 1. The economic magnitude of the effect is large: an
improvement in one point in the corruption index is associated to a 10% decrease in
the use of labor, ceteris paribus.18 This result obtains in a specification which, as said
before, includes fixed effects by country. Notably, the results do not change when
omitting country fixed effects. Including lagged corruption (one and two year lags)
does not affect the results, in the sense that current corruption continues to be
significant. The first lag is also significant and its coefficient has a smaller absolute
value.
In order to control for ownership type we include an indicator variable that
takes the value of one if the firm is public and zero otherwise.19 The coefficient on the
public dummy is positive and significant at the 1% level, indicating that private firms
outperform public firms. The coefficient associated with the public firm dummy is
also significant in economic terms: public firms use about 41% more labor to produce
a given bundle of outputs, conditional on corruption and the capital inputs. We
experimented with the interaction between corruption and the public dummy, but
found no consistently significant effects across the estimated models.
In order to avoid possible omitted variable biases caused by country-year
unobserved heterogeneity, we extend our baseline model by including GNP per
capita, which varies over time and across countries and should control for
productivity shocks at the national level.20 In column (2) of Table 2 we report the
results of including GNP per capita in our model. GNP per capita is not significant at
any of the usual confidence levels and it appears not to have any impact on the sign or
significance of other coefficients. In particular, corruption remains negatively
associated with efficiency, and private firms appear significantly more efficient than
public firms.21
18 A note of caution is needed in the interpretation of these results. As pointed out by Mauro (1995), when using perception indexes it is unclear whether the difference between a grade of one and two is the same as that between four and five, which leads to difficulties in the interpretation of the coefficients. 19 Information on ownership type comes from CIER reports and was checked by asking directly to regulators. 49% of the observations correspond to public firms. Corruption and ownership seem to be orthogonal to each other in our sample. The correlation between the ICRG corruption index and the share of private sector participation in the distribution activity�a proxy for ownership at the country level, is equal to -0.10, a figure that is not significantly different from zero at the usual confidence levels. 20 GNP per capita (US Dollars) is in purchasing power parity units, as obtained from the World Bank database (for details, see the technical notes to the World Development Reports). 21 Similar results are obtained when corruption is included in the model in natural logarithms rather than in original units.

17
Other controls varying across countries and time. Apart from GNP per capita,
we experimented with several other potential explanatory variables that vary across
countries and time, including average wages at the country level. To avoid the
possibility that the corruption measure simply picks up the insecurity of property
rights or a more chaotic environment, we included a measure of law and order, and
measures of macroeconomic instability, namely inflation and inflation variation.22
The estimates, including all the additional controls, are reported in column (3)
of Table 2. Inflation, inflation variation, and law and order have the expected signs in
terms of our theoretical model. These are forces that could also divert managerial
efforts and raise factor use. However, the law and order variable does not appear to
play a statistically significant role; inflation and inflation variation, although
significant, do not have large economic effects. Including these variables in the
model does not significantly affect the relationship between corruption and labor
requirements.23
The problem of energy theft. Our use of energy sold as a measure of output
could bias our corruption estimate. If the countries that are more corrupt are also the
poorest, such countries are likely to have a more serious problem of energy theft
(because of higher criminality and lower enforcement capabilities). Thus, firms in
those countries would appear to be less efficient, because part of the energy they
effectively distribute gets stolen, rather than sold. A second possibility is that firms
facing more energy theft may have to use inputs to combat it.
As pointed out by Bagdadioglu, Waddams Price, and Weyman-Jones (1996),
network losses reflect the quality of the network system in terms of how much power
is lost in the transformers and during distribution, and how much power is uncounted
due to other reasons, such as illegal use. Technical losses are strictly related to the
square of the distance transmitted, and hence our econometric model captures them.
Our main concern is related to non-technical losses associated to illegal use. In order
22 The source of countries� average wages, inflation, and inflation variation is ECLAC (Economic Commission for Latin America and the Caribbean). We use a Law and Order index in order to proxy the country�s respect for property rights. In the Law and Order index, law and order are assessed separately, with each sub-component comprising zero to three points. The Law sub-component is an assessment of the strength and impartiality of the legal system, while the Order sub-component is an assessment of popular observance of the law. The source for the Law and Order index is International Country Risk Guide (ICRG). Recall that a high value of the index means that the country in question has �good� institutions. 23 The coefficients on corruption and the public dummy are also significant when country dummies are not included in the regression model.
18
to address the problem of whether or not including network losses as part of output
has any impact on the estimated coefficients, we replace �sales� by �sales + energy
losses�. As shown in column (4) of Table 2, corruption is still significantly associated
to higher labor requirements.24 The same applies to public ownership.
In another specification (not reported) we included the percentage of energy
sales that are lost as an independent regressor. This would proxy for the relative
seriousness of the theft problem, which could induce the use of more employees to
combat it. The results were unchanged.
We now address some concerns that are specific to the type of data we use and
the problem we investigate.
Survey bias and vertical integration. As described in Section 3, our data
comes from two types of sources: survey responses by the firms and information
collected directly by regulators and governmental agencies. First, we consider the
possibility that survey responses by firms may suffer from a selection bias�i.e.
perhaps only the most efficient firms may be willing to answer a survey. To determine
how sensitive the results are to this potential bias, we constructed a source dummy
variable that takes the value of one when the observation comes from survey data and
zero otherwise. The source dummy is not significant, indicating that there are no
systematic differences in efficiency between the firms that answered the survey and
the other firms in our sample.
Second, some firms in our sample are vertically integrated�i.e., they produce
and transport electricity, and they also distribute it. To explore the possibility that
labor productivity might be correlated with different degrees of vertical integration,
we added a dummy variable for vertically integrated firms. The vertically integrated
firm dummy has a positive and significant coefficient, suggesting that vertically
integrated firms use more labor, ceteris paribus, than the other firms in our sample.
The inclusion of the vertically integrated dummy, however, does not have any impact
on the value or significance of other coefficients. Hence, the negative and significant
association between corruption and efficiency is not driven by varying vertical
integration patterns across firms in the power industry.25
24 Due to lack of data on network losses for some firms, including losses in the model reduces the number of observations to 340�instead of 352; the mean of network losses (in percentage of energy sold) is 15%, with a standard deviation of 8%.
19
In summary, our empirical findings indicate that corruption at the country
level is negatively associated with the labor productivity of firms. Additionally, we
find that private firms have higher labor productivity than public firms. Other features
of the macroeconomic and institutional environment facing firms, such as
macroeconomic instability and the prevalence of law and order, play a separate role.
6. Robustness Checks To further address the validity of the results we estimate four alternative
specifications. In specification (A) we use operating and maintenance expenditures
instead of employed labor as dependent variable; in (B) we use an instrumental
variable specification; in (C) we use an alternative corruption index; in (D) we include
firm fixed effects instead of country fixed effects; and in (E) we examine the
possibility that adding data on the quality of service would alter our results.
A. Operating and maintenance expenditures
We estimate an alternative model in which the dependent variable is the firms�
operating and maintenance (O&M, in thousands of US Dollars) expenses instead of
the number of employees.26 Using O&M expenses as the dependent variable has the
advantage of including expenditures for work contracted outside the firm, thus
making the measure of variable inputs more comparable between firms with different
levels of horizontal integration. In many cases, labor compensation packages have
allowed privatized firms to outsource labor intensive services (e.g., cleaning services),
which is not an option to most state owned firms due to the power of unions. The
O&M data also allow us to address some potential substitution effects between labor
and maintenance expenditures.
In order to harmonize O&M expenses over time and across countries, our
approach was to convert O&M expenses into 2001 price levels and express them in
terms of purchasing power parity (PPP).
Our data on O&M expenses was obtained mainly from CIER reports. In
vertically integrated firms, O&M expenses for firm j were calculated as
25 The three checks just described involve regressions that are unreported but available upon request. 26 The simple correlation between number of employees and O&M expenditures is 0.88.
20
2 4
1 2 51 1
& & & & & & ,j j j kj kj jk k
O M O M O M O M O M O M= =
= + + ∑ ∑ where 1& jO M
= distribution (proper); 2& jO M = billing and collection; 3& jO M = generation;
4& jO M = transmission; and 5& jO M = administrative and general. We have a total
of 210 observations corresponding to 73 firms operating in 10 countries�we do not
have O&M data from Panama, Costa Rica, and Mexico. Summary statistics of O&M
expenses are reported in Table 1.
Results corresponding to the O&M specification are reported in columns (1)
and (2) of Table 3. The coefficient on corruption is negative and significant at the
10% level, thus providing additional support to the hypothesis that higher corruption
at the country level has a negative impact on firms� efficiency. The absolute value of
the coefficient is substantially higher than in the labor requirement specifications
suggesting that corruption has a higher impact on O&M costs than on labor
requirements. An improvement in one point in the corruption index is associated to a
25% decrease in the O&M costs, ceteris paribus. The coefficient on the public
dummy is not significant in this specification. This might indicate that public and
private firms have different degrees of horizontal integration; public firms might
contract fewer activities outside the firm, thus appearing more inefficient in
regressions where labor is the dependent variable.27 Results are unchanged when
wages are included as a control in the O&M specification.
B. Instrumental variables
We will argue that our use of corruption data at the national level together
with firm-level data from one particular industry can be exploited to avoid
endogeneity problems. Although it is likely that corruption at the country level may
affect the efficiency of a subset of its firms, it is less likely that the inefficiency of a
few firms in one industry will affect the country�s overall corruption level. The use of
micro data corresponding to one industry, however, does not eliminate the possibility
that the efficiency of all firms in the country might be correlated, so that reverse
causation from firm efficiency to corruption cannot be ruled out. This problem is
27 Using the reduced sample�210 observations, 73 firms, 10 countries�the public dummy is positive and significant at the 1% level in a labor requirement specification. This suggests that the drop in the significance level in the ownership dummy is due to changing the dependent variable, and not to a sample bias.
21
addressed in our empirical strategy. If there are country specific elements that affect
both corruption and the efficiency of all firms in the country, they should be captured
by the country dummies we include as controls. If there are year-specific elements
affecting both corruption and the efficiency of firms, they should be captured by the
time dummies we include. And if there are shocks affecting both corruption and
nationwide firm efficiency that differ by country and year, they should have an impact
on GDP per capita for the corresponding country and year, which is also included as a
control.
Still, we report Instrumental Variables (IV) estimates which might help not
only because corruption might be endogenous, but also because subjective indexes of
corruption are probably measured with error. Hence, IV estimations can help
ameliorate attenuation bias.
In order to run the IV specification we need to identify factors determining
corruption that do not enter the labor requirement function for our sample of
electricity distribution firms. We have data for the share of imports in GDP, which
proxies a country�s openness to trade. This variable has been shown to play an
important explanatory role in corruption regressions (Ades and Di Tella, 1997; Gatti,
1999), and can be expected not to enter directly into the labor requirement regression.
As suggested in Shea (1997), we test the relevance of the instrument by means of the
partial R-squared between the ICRG corruption index and the share of imports in
GDP. Testing the relevance of the instrument is important because if the instruments
exhibit only weak correlation with the endogenous regressor, the normal distribution
provides a very poor approximation to the true distribution of the IV estimator, even if
the sample size is large (Verbeek, 2004, Chapter 5).
After controlling for all exogenous variables, the partial R-squared between
the ICRG corruption index and the share of imports in GDP is 0.28. The F-statistic
associated to the coefficient of the share of imports in GDP in a regression of
corruption on all the exogenous variables is equal to 36. According to Stock and
Watson (2003, Chapter 10) an F-statistic that exceeds 10 suggests that the instrument
is not weak. Yet this variable can be assumed to be exogenous to electricity
distribution firms� performance.28
28 Openness to trade is not significant when included in the labor requirement specification. This holds regardless of whether GNP per capita, the public dummy, or any combination of these, are included in the regression.
22
Results from the IV specification are shown in columns (3) and (4) of Table 3.
The coefficient on corruption remains negative and significant at the 5% level. Its
value, however, is higher than in previous specifications suggesting that measurement
error might be present in the corruption index.
We also test the hypothesis of exogeneity of the corruption measure by means
of a version of the Hausman (1978) test proposed by Davidson and MacKinnon
(1989), which consists in obtaining the residuals from a first-stage regression�a
regression of corruption on all the exogenous variables�and then testing whether
those residuals are significant in the original OLS equation of interest. If they are not
significant, then exogeneity cannot be rejected. In the first-stage regression the
coefficient on the instrument has the expected sign and is significant at the 1% level.
Since the residuals corresponding to the first stage regression are not significant when
included in the second stage regression�the p-value is 0.71�we cannot reject the
hypothesis that country-level corruption is exogenous in our firm-level specification.
C. Alternative corruption index
We want to make sure our results are not an artifact of a particular measure of
corruption. Therefore, we now report results using the Corruption Perceptions Index
(CPI) provided by Transparency International (TI). This index captures the
perceptions of business people, academics, and risk analysts. This index is less
consistent than the one we have used so far, because it relies on different sources for
different years. Therefore, the index is not strictly comparable along the years, which
is important in a panel setting where the within country variation over time plays a
key role. It is for this reason that we do not use the TI index as our main measure.
However, because the TI index is a composite of a wide array of corruption measures,
it would be reassuring if we could replicate our basic regressions and obtain
somewhat similar results. The exercise would allay fears that our results may be an
artifact of a corruption measure that is at odds with most other accepted measures.
The CPI ranges between ten (highly clean) and zero (highly corrupt). Since
there are no data for the CPI in 1994, and there are also no data for the CPI of Costa
Rica in 1995, Ecuador (1996), Panama (1995-1999), Paraguay (1995-1996 and 1999-
2000), Peru (1995-1996), and Uruguay (1995-1996 and 1999), the sample is reduced
from 352 to 270 observations. The sample has now only 7 time periods (1995-2001),
12 countries (we lost the observations for Panama), and 78 firms (instead of the 80

23
firms used in the previous section). Summary statistics of the CPI are presented in
Table 1. The simple correlation between the CPI and the ICRG index is 0.60, which
already tells us that the main index we have used is highly correlated with the more
widely sourced TI index.
OLS estimates of the average labor requirement function using the TI
corruption measure are reported in columns (5) and (6) of Table 3. In the basic
specification controlling for ownership type and development level, the coefficient on
corruption is negative and significant at the 5% level, indicating that higher corruption
has a negative impact on efficiency. The coefficient on the public dummy remains
positive and significant at the 1% level, again suggesting that public firms are less
efficient than private firms.29 When we add further controls for wages, law and order,
inflation, and inflation variation the coefficient on corruption remains almost the
same, although a higher standard error takes the p-value of the coefficient to 11%. It
is noteworthy that none of the added controls are themselves significant.
The issues of intertemporal comparability of the TI index prevent us from
reading too much into these results. Those issues notwithstanding, we believe that the
exercise contained in this subsection can be seen to support our initial findings. The
results using the TI index tend to go in the same direction as our initial results using
the ICRG index, suggesting that the latter results were not an artifact of a particular
corruption measure.
D. Firm fixed effects. Each of our previous specifications has established a
negative association between corruption and efficiency when controlling for country
fixed effects. These models assume that time invariant effects are uniform across
firms within the same country. In Table 4 we replicate the estimates provided in Table
2, this time replacing country fixed effects with firm effects. In all models the
coefficients on corruption and the public dummy keep their signs and remain
statistically significant. In the firm effects specification the coefficient on corruption
is smaller than reported in Table 2, but still economically relevant. This may reflect
the fact that firms in the same country have different vulnerabilities to corruption.
Once firm effects are accounted for, inflation and inflation variation retain
their (expected) sign and significance. However, the economic relevance of 29 The coefficients on corruption and the public dummy are also highly significant when country dummies are not included in the regression model.
24
macroeconomic instability appears tiny in comparison with that of corruption. Law
and order, which was not significant in the specification with country fixed effects,
becomes strongly significant, economically relevant, and has the expected sign:
countries with less law and order have more inefficient firms. We believe it is
noteworthy that corruption appears to play a separate role from that of variables
capturing the general traits of the environment facing firms (law and order, macro
instability), and that the effect of corruption is more robust across specifications.
E. Quality of service
Thus far, the only variable related to quality of service included in the model
is energy losses. We could not systematically include other measures of quality of
service in our model because there is not enough comparable data across countries.
However, we are interested to know whether it is likely that the absence of data on
quality of service may affect our estimate of corruption.
To do this, we take advantage of some information available for a widely used
measure of quality of service: mean frequency of interruptions per customer (FC),
defined as 1
n
ii
CaFC
Cs==∑
(where iCa is the number of customers affected by
interruption i, Cs is the total number of customers, and n is the total number of
interruptions). Table 5 presents sample summary statistics, by country, for FC.30
To address the potential impact on the corruption coefficient of the omission
of quality of service variables from the model, we provide the simple correlation
between corruption and FC. The correlation of the ICRG index of corruption with FC
is equal to 0.12, a number that is not significantly different from zero; thus, we cannot
reject the hypothesis that this measure for quality of service is orthogonal to the
corruption variable and therefore that the coefficient of the latter should not be
significantly biased due to the omission of FC from the model.31
30 In order to maximize the sample size, we include in Table 4 information on quality of service for some firms that were not in our original sample. 31 We ran a regression adding FC to the model in column (2) in Table 2. The coefficient on corruption is negative and significant at the 20% level and the coefficient on the public dummy is positive and significant at the 1% level. These results, however, have to be interpreted with great care. Given that we have information on quality of service for some firms for which we do not have information on transformer capacity, we only have 83 observations when FC is included in the regression model.
25
7. Conclusions We have presented what we believe is the first attempt at using firm-level data
to test a theory of how corruption affects the technical efficiency of firms. We derived
a testable hypothesis from a simple model in which corruption causes a diversion of
managerial effort away from the supervision and coordination of the productive
process. Firms then employ more factors in order to make up for the poorer
coordination of their use, and this extra use of resources constitutes an inefficiency.
Our main finding is that corruption is strongly associated with inefficiency at
the firm level in the sense that in more corrupt countries more labor is used to produce
a given level of output. We also find that public firms are substantially less efficient in
their use of labor than private firms. The estimated effects are large in economic
terms.
The association we identify between corruption and firm efficiency is robust.
To deal with problems of omitted variable bias we controlled for GNP per capita, time
effects, country or firm effects, as well as a set of country-specific time-varying
regressors. This set includes measures of prevailing wages, law and order prevalence,
and macroeconomic instability. The association between corruption and inefficiency
remains significant in the presence of all of these variables, which are particularly
significant in the firm fixed effects specification. Inflation, inflation variation, and
deficiencies in law and order appear themselves to be associated with greater
inefficiency, but their inclusion does not affect the significance of corruption. This is
interesting because it suggests that corruption plays a separate role that is distinct
from the impact of an unstable or insecure environment. Of all factors varying by
country and time that we analyze, corruption is the one that is invariably significant
and economically relevant across specifications, which we believe is noteworthy. The
effect of corruption remains significant when taking into account problems like firm
size heterogeneity and energy theft.
We use national level data on corruption while efficiency is tied to input-
output data at the firm level from a single industry. When combined with our set of
controls, the type of data we have used makes it unlikely that an endogeneity bias is
present in our estimate of how corruption affects firm efficiency. Still, because of any
remaining concerns with endogeneity, as well as concerns with attenuation bias, we
used a standard instrument for corruption, namely openness to trade as proxied by the

26
ratio of imports to GDP. We found that the instrumental variable estimate of the effect
of corruption on efficiency is significant.
In order to check our focus on labor use, we investigated the effects of
corruption using a measure of efficiency based on operation and maintenance
expenditures. We found that public firms do not appear to be less efficient, while they
appeared so in term of labor use. This divergence might reflect differences in
subcontracting practices across private and public firms. However, corruption is
significantly associated with inefficiency for all firms. Although the use of country-
level corruption indices may not be as desirable as having firm-level data on how
corrupt is the environment facing firms, we believe the stability of our findings is
noteworthy, as is the external validity of a study on a continental scale.

27
Appendix Second order conditions for the manager�s problem. The Hessian matrix has
typical element aij in row i and column j. The sufficient second order condition for a
maximum states that the principal minors should have the following signs,
1H =a11<0, H =a11a22-a21a12>0. In our model, the elements of the Hessian are:
011 <−= eeee Qpapp
ψ , 1
12 21 2 0(.)
lee
QfdAa ad f
ψ−
= = > ,
and 2 2 2 21 2 1 1
22 2 2 2 4
( 2 ) 0(.) (.) (.)
l l ll lee e e
Q f Q f f f f fdA d A dAa Qd f d f d f
ψ ψ ψ− − − −= − − + <
.
The first principal minor is then clearly negative. The second can be seen to be
positive: 21
22 22 2 0.(.)p p
le e ee ee
Q fdAH p Qa ad f
ψ ψ−
= − + >
Proof of Proposition 1. The first order conditions to problem (3) satisfy the
conditions for the implicit function theorem. Then the comparative static effects of c
on ep*, and l* can be written as,
*1 22 12 2pde b a a b
dc H−=
*1 21 2 11b a b adl
dc H− += ,
where b1= Qp cep− <0 and b2=0 capture the direct effects of corruption on the first
order conditions for ep and l respectively. We then obtain, *
1 22 0pde b adc H
= > and *
1 21 0b adldc H
−= > ,
which in turn implies *
0sdedc
< , concluding the proof.

28
References
Acemoglu, D., S. Johnson, and J. Robinson. �The Colonial Origins of Comparative
Development: An Empirical Investigation.� American Economic Review,
2001, 91 (5), 1369-1401.
Ades, A. and R. Di Tella. �National Champions and Corruption: Some Unpleasant
Interventionist Arithmetic.� Economic Journal, 1997, 107 (443), 1023-42.
Bagdadiouglu, N., C. Waddams Price, and T. Weyman-Jones. �Efficiency and
Ownership in Electricity Distribution: A Non-Parametric Model of the Turkish
Experience.� Energy Economics, 1996, 18 (1-2), 1-23.
Clarke, G. and L. Xu. �Ownership, Competition, and Corruption: Bribe Takers versus
Bribe Payers.� Journal of Public Economics, 2004, 88 (9-10), 2067-2097.
Davidson, R. and J. MacKinnon. �Testing for Consistency using Artificial
Regressions.� Econometric Theory, 1989, 5, 363-384.
Di Tella, R. and E. Schargrodsky. �The Role of Wages and Auditing During a
Crackdown on Corruption in the City of Buenos Aires.� Journal of Law and
Economics, 2003, 46 (1), 269-292.
Diewert, E. �Functional Forms for Revenue and Factor Requirements Functions.�
International Economic Review, 1974, 15 (1), 119-130.
DTe. �Choice of Model and Availability of Data for the Efficiency Analysis of Dutch
Network and Supply Businesses in the Electricity Sector.� Background
Report, Netherlands Electricity Regulatory Service, February 2000.
El-Gamal, M. and H. Inanoglu. �Inefficiency and Heterogeneity in Turkish Banking:
1990-2000.� Journal of Applied Econometrics 20 (2005), 641-664.
Fischer, R. and P. Serra. �Regulating the Electricity Sector in Latin America.�
Economia, Fall 2000, 155-218.
Fisman, R. �Estimating the Value of Political Connections,� American Economic
Review, 2001, 91(4), 1095-1102.
Førsund, F. and S. Kittelsen. �Productivity Development of Norwegian Electricity
Distribution Utilities.� Resource and Energy Economics, 1998, 20 (3), 207-
224.
Gatti, R. �Explaining Corruption: Are Open Countries Less Corrupt?� Mimeo, World
Bank, 1999.

29
Greene, J. �Reconsidering Heterogeneity in Panel Data Estimators of the Stochastic
Frontier Model.� Journal of Econometrics 126 (2005), 269-303.
Hattori, T. �Relative Performance of U.S. and Japanese Electricity Distribution: An
Application of Stochastic Frontier Analysis.� Journal of Productivity Analysis,
2002, 18, 269-284.
Hausman, J. �Specification Tests in Econometrics.� Econometrica, 1978, 46 (6),
1251-1272.
Jamasb, T., and M. Pollitt. �International Benchmarking and Yardstick Regulation:
An Application to European Electricity utilities.� DAE Working Paper
No.01/15, Department of Applied Economics, University of Cambridge, 2001.
Khwaja, A. and A. Mian. �Do Lenders Favor Politically Connected Firms? Rent
provision in an Emerging Financial Market.� Quarterly Journal of Economics
120(4), 1371-1411.
Knack, S. and P. Keefer. �Institutions and Economic Performance: Cross-Country
Tests using Alternative Institutional Measures.� Economics and Politics, 1995,
7 (3), 207-227.
Knittel, C. �Alternative Regulatory Methods and Firm Efficiency: Stochastic Frontier
Evidence from the U.S. Electricity Industry.� The Review of Economics and
Statistics, 2002, 84 (3), 530-540.
Krueger, A. �The Political Economy of the Rent Seeking Society.� American
Economic Review, 1974, 64(3), 291-303.
Kumbhakar, S. and C.A. Knox Lovell. Stochastic Frontier Analysis. Cambridge
University Press, 2000.
Kumbhakar, S. and L. Hjalmarsson. �Labour-Use Efficiency in Swedish Social
Insurance Offices.� Journal of Applied Econometrics, 1995, 10 (1), 33-47.
Kumbhakar, S. and L. Hjalmarsson. �Relative Performance of Public and Private
Ownership under Yardstick Competition: Electricity Retail Distribution.�
European Economic Review, 1998, 42 (1), 97-122.
La Porta, R., F. Lopez de Silanes, A. Shleifer, and R. Vishny. �Law and Finance.�
Journal of Political Economy, 1998, 106 (6), 1113-1155.
Laffont, J.-J. and D. Martimort. �Separation of Regulators Against Collusive
Behavior.� Rand Journal of Economics, 1999, 30 (2), 232-262.
Laffont, J.-J. and J. Tirole. A Theory of Incentives in Procurement and Regulation.
MIT Press, 1993.

30
Lambsdorff, J. �How Corruption Affects Productivity.� Kyklos 2003, 56(4), 457-74.
Mauro, P. �Corruption and Growth.� Quarterly Journal of Economics, 1995, 110 (3),
681-712.
Morrison-Paul, C., W. Johnston, and G. Frengley. �Efficiency in New Zealand Sheep
and Beef Farming: The Impacts of Regulatory Reform.� The Review of
Economics and Statistics, 2000, 82 (2), 325-337.
Neuberg, L. �Two Issues in the Municipal Ownership of Electric Power Distribution
Systems.� Bell Journal of Economics, 1977, 8 (1), 303-323.
Orea, L. and S. Kumbhakar. �Efficiency Measurement Using a Latent Class
Stochastic Frontier Model.� Empirical Economics 2004, 29, 169-183.
Rudnick, H. �Restructuring in South America � Successes and Failures.� Power
Economics Restructuring Review, June 1998, 37-39.
Rudnick, H. and J. Zolezzi. �Electric Sector Deregulation and Restructuring in Latin
America: Lessons to be Learnt and Possible Ways Forward.� IEE
Proceedings, 2001, 148 (2), 180-184.
Shea, J. �Instrument Relevance in Multivariate Linear Models: A Simple Measure.�
The review of Economics and Statistics, 1997, 79 (2), 348-352.
Stock, J. and M. Watson. Introduction to Econometrics. Addison-Wesley, Boston,
2003.
Svensson, J. �Who Must Pay Bribes and How Much? Evidence from a Cross Section
of Firms.� The Quarterly Journal of Economics 118(1), 2003, 207-30.
Verbeek, M. A Guide to Modern Econometrics. John Wiley & Sons, 2004.

31
Table 1: Summary Statistics Inputs and Outputs Mean Standard
deviation Maximum Minimum
Number of employees 2151 5929 41063 95 Sales (in GWh) 5962 21628 175498 61
Number of customers 868290 2592453 19760000 17782 Service area (in km2) 107558 302328 1889910 78
Distribution lines (in km) 29748 89861 595170 380 Transformer capacity (in MVA) (Number of observations = 352) 1790 4475 33078 38
O&M expenses (000 US Dollars, PPP) (Number of observations = 210) 154628 251376 1833086 695
International Country Risk Guide Corruption Index
Mean Standard deviation
Maximum Minimum
Argentina 2.69 0.46 3.00 2.00 Bolivia 2.88 0.35 3.00 2.00 Brazil 2.88 0.35 3.00 2.00 Chile 3.75 0.46 4.00 3.00
Colombia 2.13 0.64 3.00 1.00 Costa Rica 4.75 0.71 5.00 3.00
Ecuador 2.94 0.68 4.00 1.50 Mexico 2.75 0.71 4.00 2.00 Panama 2.00 0.00 2.00 2.00
Paraguay 1.88 0.35 2.00 1.00 Peru 3.00 0.53 4.00 2.00
Uruguay 3.00 0.00 3.00 3.00 Venezuela 2.88 0.35 3.00 2.00
Full Sample 2.88 0.85 5.00 1.00 Corruption Perception Index�
Transparency International Mean Standard
deviation Maximum Minimum
Argentina 3.41 0.80 5.24 2.80 Bolivia 2.52 0.50 3.40 2.00 Brazil 3.65 0.54 4.10 2.70 Chile 7.11 0.59 7.94 6.05
Colombia 3.01 0.60 3.80 2.20 Costa Rica 5.26 0.74 6.45 4.50
Ecuador 2.50 0.36 3.19 2.20 Mexico 3.31 0.31 3.70 2.66 Panama 3.35 0.49 3.70 3.00
Paraguay 1.73 0.25 2.00 1.50 Peru 4.30 0.23 4.50 4.00
Uruguay 4.73 0.43 5.10 4.30 Venezuela 2.60 0.17 2.80 2.30
Full Sample 3.72 1.49 7.94 1.50 Note: all data correspond to December of each year.
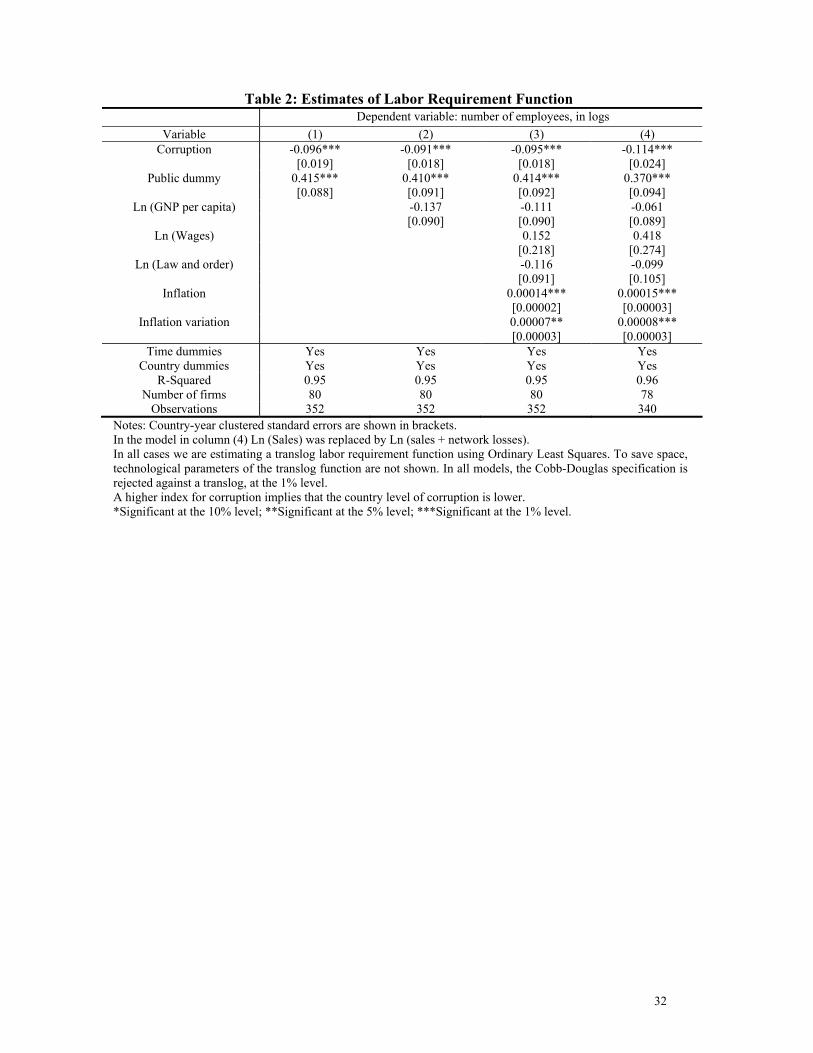
32
Table 2: Estimates of Labor Requirement Function Dependent variable: number of employees, in logs
Variable (1) (2) (3) (4) Corruption -0.096*** -0.091*** -0.095*** -0.114***
[0.019] [0.018] [0.018] [0.024] Public dummy 0.415*** 0.410*** 0.414*** 0.370***
[0.088] [0.091] [0.092] [0.094] Ln (GNP per capita) -0.137 -0.111 -0.061
[0.090] [0.090] [0.089] Ln (Wages) 0.152 0.418
[0.218] [0.274] Ln (Law and order) -0.116 -0.099
[0.091] [0.105] Inflation 0.00014*** 0.00015***
[0.00002] [0.00003] Inflation variation 0.00007** 0.00008***
[0.00003] [0.00003] Time dummies Yes Yes Yes Yes
Country dummies Yes Yes Yes Yes R-Squared 0.95 0.95 0.95 0.96
Number of firms 80 80 80 78 Observations 352 352 352 340
Notes: Country-year clustered standard errors are shown in brackets. In the model in column (4) Ln (Sales) was replaced by Ln (sales + network losses). In all cases we are estimating a translog labor requirement function using Ordinary Least Squares. To save space, technological parameters of the translog function are not shown. In all models, the Cobb-Douglas specification is rejected against a translog, at the 1% level. A higher index for corruption implies that the country level of corruption is lower. *Significant at the 10% level; **Significant at the 5% level; ***Significant at the 1% level.
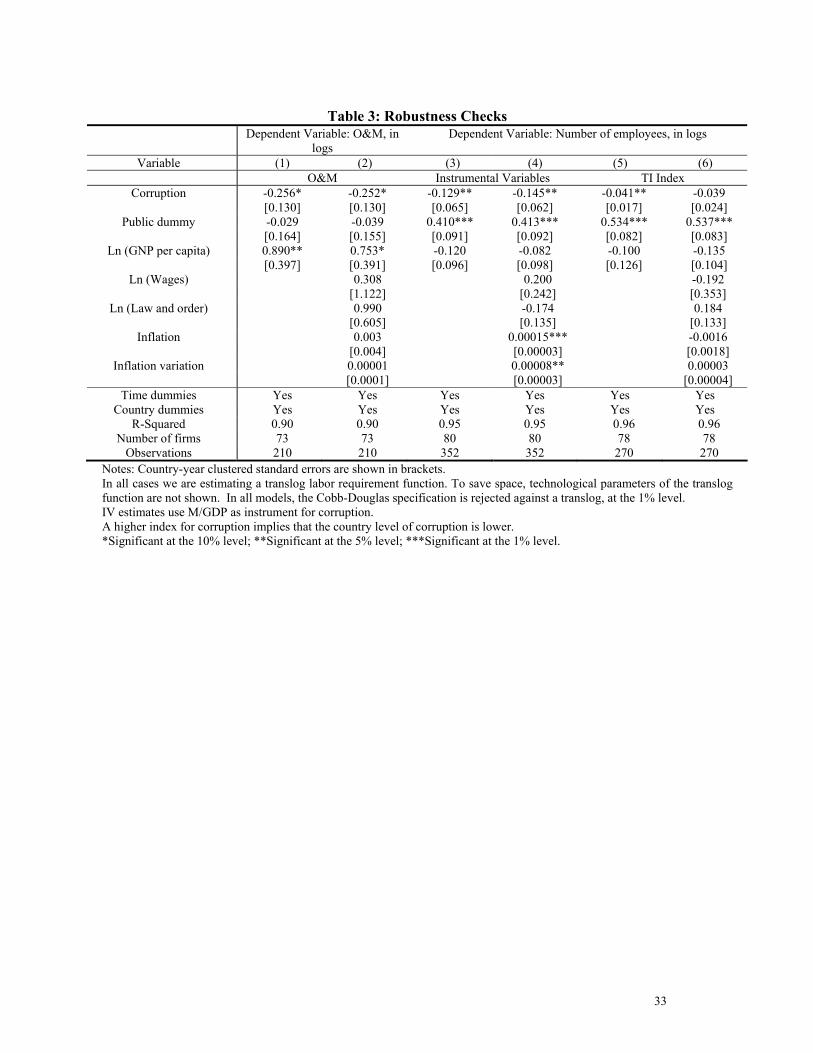
33
Table 3: Robustness Checks
Dependent Variable: O&M, in logs
Dependent Variable: Number of employees, in logs
Variable (1) (2) (3) (4) (5) (6) O&M Instrumental Variables TI Index
Corruption -0.256* -0.252* -0.129** -0.145** -0.041** -0.039 [0.130] [0.130] [0.065] [0.062] [0.017] [0.024]
Public dummy -0.029 -0.039 0.410*** 0.413*** 0.534*** 0.537*** [0.164] [0.155] [0.091] [0.092] [0.082] [0.083]
Ln (GNP per capita) 0.890** 0.753* -0.120 -0.082 -0.100 -0.135 [0.397] [0.391] [0.096] [0.098] [0.126] [0.104]
Ln (Wages) 0.308 0.200 -0.192 [1.122] [0.242] [0.353]
Ln (Law and order) 0.990 -0.174 0.184 [0.605] [0.135] [0.133]
Inflation 0.003 0.00015*** -0.0016 [0.004] [0.00003] [0.0018]
Inflation variation 0.00001 0.00008** 0.00003 [0.0001] [0.00003] [0.00004]
Time dummies Yes Yes Yes Yes Yes Yes Country dummies Yes Yes Yes Yes Yes Yes
R-Squared 0.90 0.90 0.95 0.95 0.96 0.96 Number of firms 73 73 80 80 78 78
Observations 210 210 352 352 270 270 Notes: Country-year clustered standard errors are shown in brackets. In all cases we are estimating a translog labor requirement function. To save space, technological parameters of the translog function are not shown. In all models, the Cobb-Douglas specification is rejected against a translog, at the 1% level. IV estimates use M/GDP as instrument for corruption. A higher index for corruption implies that the country level of corruption is lower. *Significant at the 10% level; **Significant at the 5% level; ***Significant at the 1% level.

34
Table 4: Robustness Checks � Firm Fixed Effects Dependent Variable: Number of employees, in logs
Variable (1) (2) (3) (4) Corruption -0.036* -0.034 -0.046** -0.045***
[0.022] [0.022] [0.019] [0.018] Public dummy 0.305*** 0.299*** 0.260*** 0.158*
[0.078] [0.080] [0.084] [0.085] Ln (GNP per capita) -0.053 -0.003 0.009
[0.077] [0.084] [0.076] Ln (Wages) 0.363 0.484
[0.298] [0.326] Ln (Law and order) -0.416*** -0.392***
[0.120] [0.116] Inflation 0.0001*** 0.0001***
[.00004] [.00004] Inflation variation 0.00008** 0.00007**
[.00003] [.00003] Time dummies Yes Yes Yes Yes Firm dummies Yes Yes Yes Yes
R-Squared 0.99 0.99 0.99 0.99 Number of firms 80 80 80 80
Observations 352 352 352 352 Notes: Country-year clustered standard errors are shown in brackets. In all cases we are estimating a translog labor requirement function. To save space, technological parameters of the translog function are not shown. In all models, the Cobb-Douglas specification is rejected against a translog, at the 1% level. In the model in column (4) Ln (Sales) was replaced by Ln (sales + network losses). A higher index for corruption implies that the country level of corruption is lower. *Significant at the 10% level; **Significant at the 5% level; ***Significant at the 1% level.

35
Table 5: Summary statistics of quality of service
Mean frequency of interruption per customer (FC) Country Number of observations Sample mean
Argentina 22 6.98 Bolivia 7 11.23 Brazil 113 21.08 Chile 0
Colombia 6 9.00 Ecuador 4 24.63 Paraguay 0 Uruguay 2 17.58
Venezuela 6 6.42 Peru 4 22.15
Costa Rica 15 15.02 Panama 0 Mexico 0 Total 179 17.62
Public firms 107 19.11 Private firms 72 15.41