corruption and medicine quality in latin america: a pilot …. introduction fake and substandard...
TRANSCRIPT

Corruption and Medicine Quality in Latin
America: A Pilot Study
Corruption and Medicine Quality in Latin America: A Pilot Study
Roger Bate, American Enterprise Institute
Aparna Mathur, American Enterprise Institute
Abstract
Fake and substandard medicines are a significant problem in developing nations, and a
growing problem in developed ones too. There have been assessments of basic medicine quality
from many countries and regions across the world but almost none in Central and South America.
Over the past decade, as part of our research, we have collected over ten thousand samples of
medicines from 22 cities in emerging markets, but the only one from the Latin region was Sao
Paolo in Brazil. We have now rectified this gap, at least for one critical medicine, the broad
spectrum antibiotic ciprofloxacin. Using original, self-collected data from ten countries in Latin
America, we test whether the samples of 518 Ciprofloxacin drugs pass the Global Pharma Health
Fund e.V. Minilab® protocol to identify substandard or counterfeit medicines. In terms of quality,
93 percent of drugs were good quality. Within the drugs that failed the quality test, the majority
were substandard rather than fake. About 26.5% of the poor quality drugs were fake i.e had zero
active pharmaceutical ingredient (API), while the rest were substandard i.e. they had less than 80%
API. In line with results from our earlier studies, we find that products that were locally registered,
as well as those with SRA or WHO pre-qualification, were more likely to pass the test. A new
finding in this paper is the role of corruption in influencing the quality of drugs. As highlighted in
the literature, corruption can play a large, negative role in the healthcare system, particularly
adversely impacting those with very low incomes. Bribery of regulators and public officials can
affect the procurement process for drugs and allow counterfeit producers to supply low quality
drugs without facing the consequences. Our study finds that corruption is strongly correlated with
poor quality drugs. Less corrupt countries on the other hand, had higher levels of passing drugs.
While our sample size is currently inadequate to allow large scale generalizations about the role
of corruption in driving the quality of drugs in these countries, it does suggest that this is an avenue
for further research and exploration.

1. Introduction
Fake and substandard medicines are a significant problem in developing nations, and a
growing problem in developed ones too. There have been assessments of basic medicine quality
from many countries and regions across the world (Institute of Medicine 2013), but almost none
in Central and South America. Over the past decade, as part of our research, we have collected
over ten thousand samples of medicines from 22 cities in emerging markets, but the only one from
the Latin region was Sao Paolo in Brazil. We have now rectified this gap, at least for one critical
medicine, the broad spectrum antibiotic ciprofloxacin. We have undertaken considerable research
on Cipro before (Bate, Jin & Mathur 2015; Bate, Jin, Mathur & Attaran 2016), and it is the one
drug we have found in every city and most pharmacies within each city. We therefore expected to
be able to find it in each of the nine Latin cities (in addition to Sao Paolo) we sampled, which
include Asuncion, Buenos Aires, Caracas, Guatemala City, Guayaquil, La Paz, Lima, Montevideo,
Sao Paolo and Tegucigalpa.
A study by the Pharmaceutical Security Institute ranked Latin America second (Mackey,
Liang, York & Kubic 2015), after Asia, as the region with the highest level of pharmaceutical
counterfeiting and theft.1 The likely reasons include decades of political unrest that have resulted
in economic depression and the import and export of fake products, lack of judicial action against
counterfeiters due to corruption and bribery of officials and weak laws, and finally poverty itself,
which has led to people demanding cheaper, poorer quality products in place of genuine, expensive
1 In 2004, in Argentina, several women died after receiving a fake iron-based medicine to treat anemia. In 2009,
Pfizer seized 8.5 million fake pills bound for Latin America. In Venezuela, Primaquine tablets were found to contain
low levels of Primaquine, and one patient developed Plasmodium Vivax malaria after taking Primaquine containing
46% of the active ingredient.

ones.2 Of course, it is also true that people who buy these drugs don’t have perfect information
about quality. Therefore, it is hard to tease out whether it is poverty or lack of information that is
fueling demand for these drugs.3 According to another study, Mexico is a major global source of
fake medicines with a sales value of $650 million per year, about 10 percent of total drug sales in
the country (Morris & Stevens 2006). Furthermore, Brazil is one of the most developed nations in
South America, and is widely seen as having the best medicine regulator, yet it still has significant
flaws in medicine oversight (Pugatch, Tortensson & Laufer 2015).
Our study uses a sample of 518 Ciprofloxacin treatments from ten Latin American cities
(including Sao Paolo). Using the Global Pharma Health Fund e.V. Minilab protocol®, we test for
drug quality, and link drug quality to local indicators of drug regulation, demographics,
distribution channels and price. At the same time, other studies have highlighted factors such as
the degree of corruption in procurement and enforcement systems, lack of training and
professionalism and pressure to buy from local suppliers rather than procuring drugs from good
quality supply chains (Tortensson & Pugatch 2010). Therefore, the contribution of this paper is
that it is the first to systematically study fake and substandard drugs in Latin America, but also one
of the first to specifically study the role of corruption in influencing drug quality in Latin America.
Corruption in healthcare systems is of particular concern in developing economies where public
resources are scarce and health service provision is compromised, particularly negatively affecting
low-income individuals (Vian 2002). This can lead to poor quality treatments and care and also an
2 http://www.grr.com/download/dmmasintellectualpropertymagazine2010.pdf. Statements made by Katharine
Murphy of the Patients Association and Julian Harris of the International Policy Network suggest that consumers
often purchase fake drugs because they are cheaper and more conveniently available. However, people are also
unaware of the risks of consuming these drugs and think of counterfeiting as a “victimless crime”. In his book,
Phake, Roger Bate presents several pieces of anecdotal evidence that people will often buy what they can even if
they suspect the products won’t work as well (Bate 2012). 3 As per a Gallup survey, 10% of Americans thought corrupt police were a major reason behind the increase in
counterfeiting and 30% blamed the high prices of genuine drugs for counterfeiting practices.

increase in the cost of care. Moreover, corruption in healthcare is likely reflective of the tolerance
of corruption in other aspects of the economy. Dora Akunyili, the head of Nigeria’s National
Agency for Drug and Food Administration and Control and winner of Transparency International’s
2003 integrity award, says in the Global Corruption Report 2006 produced by Transparency
International "Drug counterfeiting, facilitated by corruption, kills en masse and anybody can be a
victim" (Akunyili 2006). The authority she then ran found cases of water being substituted for
adrenaline and of active ingredients being diluted by counterfeiters. Rose-Ackerman (2015)
highlights the role of corruption in the Chinese healthcare system which affects the procurement
of drugs, the regulation of drug safety and monitoring processes and bribe-taking by doctors and
healthcare providers. A study by the International Monetary Fund (Davoodi, Gupta & Tiongson
2000) shows that higher levels of corruption are associated with higher rates of infant and child
mortality. Hunt (2007) finds evidence of bribery in healthcare in Peru and Uganda.
Since information on corruption in health care systems is usually highly specific and not
comparable across countries, we use a general corruption perception index indicator (CPI)
developed by Transparency International to proxy for this. Corruption in health systems in Latin
American countries affect the procurement of drugs, their delivery, regulations relating to drugs,
and accountability of public health officials. By some estimates, about $28 billion are stolen or
diverted from health systems per year in Latin America (Savedoff 2007). One prominent reason
for this is hypothesized to be the bribes paid to government officials to prevent or avoid
regulations, leading to an increase in fake drugs both in Latin America as well as around the world.
For instance, a recent paper on the Colombian health system found that bribe taking by government
officials had resulted in widespread problems in the health system and prices of pharmaceutical
products being so high that it resulted in a major public health crisis (Webster 2012). Another
report highlights several instances of abuse by public officials (Global Health Intelligence 2016).
In Honduras, the vice-president was charged with having links to a company that embezzled the
state by selling poor quality medicines at inflated prices. In Guatemala, political corruption in the
health system leads to a loss of life for at least five patients with kidney failure. The general link
between corruption and health is also established in a few papers (see Afzar & Gurgur 2008, Rose
2006). A study by the IMF showed that countries with a higher incidence of corruption have higher
rates of infant mortality.4
In an earlier paper (Bate, Jin & Mathur 2012), we differentiated fake and substandard
drugs as follows. We classify drugs with zero active ingredient as “counterfeits5” while those with
some but less than 80% active ingredient as “substandard”. All other drugs are considered to be
“passing” i.e. they pass the quality test. This definition focuses on the amount of active ingredient
because it is much more likely that a drug with zero active ingredients has worse health outcomes
than a drug with lower amounts of the active ingredient6. Also, in our earlier work (Bate et al.
2015), we find that pricing of counterfeits and substandards varies significantly. On average,
substandard drugs are priced lower than comparable generics in the same city, while there is no
significant difference between the price of counterfeits and the genuine targeted drugs. Finally,
targeting counterfeit and substandard drugs requires different strategies. Substandard drugs arise
from the poor production techniques by legitimate manufacturers and therefore can be addressed
through better regulations and manufacturing standards (Caudron et al. 2008). In contrast,
4 https://www.imf.org/external/pubs/ft/wp/2000/wp00116.pdf 5 We use the word counterfeit in this paper since it is the most familiar to economists, but the term of art preferred
today in medical circles is “falsified”, which denotes a product that is misidentified, whereas counterfeit remains the
term of art for intellectual property violations (IOM 2013). The two perfectly overlap in our sample because all
falsified medicines also had fake identifiers on the packaging, however, some were not passing themselves off as a
particular generic or branded medicine, so in some instances no specific IP holder was harmed. 6 However, substandard medicines with some but not enough active ingredient may actually drive resistance to even
the best quality medicines by “selecting” the most robust and dangerous pathogens.
counterfeit drugs with zero active ingredient requires arresting criminal activity through better law
enforcement and prosecution (Cockburn et al. 2005). Our definition is different from that of World
Health Organization (WHO) which defines counterfeit medicines as “medicines that are
deliberately and fraudulently mislabeled with respect to identity and/or source”. This definition
emphasizes the intent to deceive as the primary characteristic of a counterfeit drug, which as an
empirical matter is hard to prove. However, it is extremely rare for counterfeit medicines to contain
the correct active ingredients, so our definition is a reasonable proxy (Bate 2012).
II. Methodology
We instructed covert shoppers from the region to randomly walk into pharmacies and claim
that a family member needed ciprofloxacin. To mimic real patients as much as possible, the covert
shoppers did not present a doctor’s prescription and always purchased the pharmacist-suggested
brand. Shoppers moved from pharmacy to pharmacy until the allocated budget was used up. In
most cities every pharmacy stocked Cipro, but in Caracas six did not.
Informal drug vendors (bus vendors, mobile carts, etc.) occur in some locations, but to be
able to compare across all locations, our shoppers only visited pharmacies with a regular storefront.
As a result, our samples are likely to understate the problem of poor-quality drugs, given the
expectation and existing evidence that informal vendors sell worse drugs (Institute of Medicine
2013).
All medicines were assessed following the Global Pharma Health Fund (GPHF) e.V.
Minilab® protocol to identify substandard or falsified medicines (Jähnke et al. 2001). The key test
for our sample is the semi-quantitative thin-layer chromatography (TLC), which assesses the
presence and concentration of active ingredient in a test sample as compared to the reference
standard. A sample is referred to as falsified if it contains zero correct API , and referred to as
substandard if it contains some correct API but the amount of API is under-dosed (below 80%).
This technique has been used for the past decade by our team in every sampling. All tests were
conducted within 60 days after purchase, following the classification in Bate et al. (2015).
It is important to note that medicines can be substandard and still pass TLC, since they may
not be soluble or be poorly formulated in other ways. As a result our assessments are likely to
underestimate the number of poor quality medicines7.
As acknowledged in other studies (Attaran et al. 2012), the legal distinction between
falsified and substandard products is one of intention: both sorts of compromised medicines are
not as labeled and violate the relevant technical standards, but substandard medicines are
compromised accidentally or negligently, while falsified medicines are compromised
intentionally, with this difference not always being apparent from the content of the medicine. In
other words, legally speaking, falsified products are the product of organized criminal intent, but
substandard medicines are wrongfully produced by otherwise legitimate, law-abiding
manufacturers. However, this legal distinction breaks down when a legitimate manufacturer cuts
corners and produces poorly formulated medicines, or if it buys cheaper ingredients that may not
be robust. And it may even intentionally cheat, knowing it is buying inferior ingredients, or
skipping key production processes, which make a known substandard product. In light of the
difficulty to detect the intent of manufacture, this paper distinguishes substandard and falsified
drugs by API only.
7 In ongoing investigations 27 treatments were tested with more sophisticated techniques, and three medicines which
passed TLC failed these tests and were substandard, so our data almost certainly underestimates the rate of
substandard medicines in the market.
To assess the quality of Ciprofloxacin drugs in Latin America, we bought a total of 518
drugs across the cities of Asuncion, Buenos Aires, Caracas, Guatemala, Guayaquil, La Paz, Lima,
Montevideo, Sao Paolo and Tegucigalpa. Table 1 presents the summary statistics. In terms of
quality, 93 percent of drugs were good quality. Within the drugs that failed the quality test, the
majority were substandard rather than fake. About 26.5% of the poor quality drugs were fake (i.e
had zero active ingredient), while the rest were substandard (i.e. they had less than 80% API). The
cities that we cover in our sample are generally high income with an average adult literacy rate of
93%. Most of our sample comes from large chain pharmacies (79%), 86.5% of drugs are locally
registered while 5% are innovator brands.
Table 2 shows the distribution of the sample across different cities. Nearly 22 percent of
the sample came from Sao Paolo, and none of these drugs were counterfeits. Only about 3.5%
were substandard. Another 10 percent each came from Asuncion, Guatemala and Lima. Nearly 87
percent were bought in 2016, while the rest represent samples from earlier years. The failure rate
of drugs was relatively high in Asuncion and Caracas, and among failing drugs there were more
counterfeits in Asuncion and more substandards in Caracas. Buenos Aires had the highest rate of
passing drugs.
Table 3 shows where the drugs came from or were made based on what was listed on the
packaging. Overall, a large share of poor quality drugs listed that they were made in India (44%),
followed by China (17.6%) and Brazil (20.6%). Within these drugs that failed the test, 44% of the
counterfeits were labeled as made in Brazil. Within substandard drugs, 56% of drugs were
reportedly manufactured in India.

In line with our earlier study, we find that all products in our sample registered by western
regulators or the World Health Organization pass, except for one. For locally registered products,
the failure rate was 3%.
An area of interest for our study was to explore the link between price and quality of drugs.
In our earlier paper (Bate et al. 2015), we found significant price differences across passing and
failing drugs. Within failing drugs, counterfeit drugs were more likely to mimic prices of genuine
drugs while the price of substandards was significantly lower than the price of comparable
generics. These findings hold in this sample as well. Table 4 shows that the price of counterfeits
is identical to that of the genuine drug that they are trying to mimic. The price of substandards
relative to the generics in the same city-year varies a lot, but is in all cases significantly lower than
for the passing generic.
Table 5 reports the correlation between the corruption perception index (CPI), the logistics
performance index (LPI) and the quality of drugs. Data on CPI are obtained from Transparency
International. The CPI ranks countries on a scale from 0 to 100, where 0 implies most corrupt and
100 refers to least corrupt. The index is constructed through expert assessments and opinion
surveys that reflect opinions about the public sector in each country (Transparency International
2015). We use this as a proxy for corruption in the delivery of healthcare as well as healthcare
systems.
The first row shows that the average CPI in countries (cities) with passing drugs was
relatively higher than for those with substandard drugs. However, the CPI for countries with
substandard drugs was relatively higher than for those with counterfeit drugs. Therefore, on
average, low levels of corruption correlate with better quality drugs.
Another variable that we use is the LPI. In our sample, drugs were listed as being
manufactured not just locally within the city or country of purchase but were listed as being
manufactured in UK, USA, Europe, India and China. Therefore, to see if the quality of imported
drugs was affected by any type of border enforcement mechanism, we use two sub-measures from
the LPI index. The LPI is an index produced by the World Bank (World Bank 2016). It is based
on an assessment of professionals working inside the country and it provides two useful measures
that might influence or directly reflect the quality of drugs coming into the country. The first is the
percent of shipments receiving physical inspection and the second is the shipments meeting quality
criteria. The former may impact the ease with which poor quality drugs can be brought into the
country and is therefore likely a good predictor of the supply of counterfeit drugs in each country.
The latter is more likely to be correlated with the supply of counterfeits in the country. In other
words, if a higher percentage of shipments meets the quality criteria, it is less likely that poor
quality drugs are coming into the country. Unfortunately, neither of these measures is available for
Paraguay and Venezuela. The table shows a negative correlation between drug quality and these
two measures. In general, for countries with high levels of counterfeit drugs (or worse quality
drugs), the physical inspections of shipments are higher and the quality of shipments is lower. In
general, countries with low levels of corruption (high CPI) also tend to have fewer physical
inspections of shipments (correlation = -0.44) and higher quality of shipments (correlation = 0.36).
III. Regression Analysis
To see whether drug quality is a function of price and non-price factors, we regressed drug
quality on variables such as the city GDP, as a proxy for average incomes, adult literacy rates, the
maximum penalty for drug counterfeiting expenses (in months), whether the country has price
regulations and indicators for corruption and border enforcement.
Our variables can be separated into city-specific and drug-specific. The drug-specific
variables were collected for each drug sample tested. We use several indicators, including for
whether the drug has been registered with the stringent regulatory authority (sra_whopq); whether
the drug being tested is an innovator brand or a generic brand (innovator); whether the drug has
been registered with the local regulatory authority (prodregis); As shown in Oxfam (2011) and
Bate, Putze, Naoshy, McPherson & Mooney (2010), local drug registration is a relatively basic
regulation on legitimate drugs but its availability and implementation vary greatly across countries.
Using drug registration data collected in Bate et al. (2010) and Bate, Mooney & Hess (2010), we
created a dummy variable equal to one if a drug has been registered in the purchase country at the
purchase time.
International authorities also take actions to address drug quality. For example, if a
manufacturer in Brazil or India wishes to sell products in Nigeria or China, buyers in these latter
countries may want proof of quality that the products achieve high standards, and may not accept
registration in India and Brazil as proof. The company can choose to register these products in a
western country with a stringent drug regulatory authority to establish quality, but this is
expensive, time consuming, and rarely done if the company does not intend on selling in western
nations.8 To assist such producers, as well as donors that might wish to buy quality generics, the
WHO established a prequalification program, where generics producers could at a much lower
cost establish higher levels of quality control than regulatory authorities in emerging countries
could achieve.
8 In our data, registration with a stringent regulatory authority in a western country is perfectly collinear with
whether the drug sample carries an innovator brand.

It is commonly believed that approval by a western country with stringent standard
(referred to as SRA approved) and WHO prequalification, is more stringent than registering locally
in a low-to-middle-income purchase country.
We recorded the original transaction price in local currency, and then translated it into US
dollars by exchange rate at the time of purchase. These nominal prices were then deflated using
US CPI data. In the tables, all prices are real price in US dollars as of January 2016.9 We choose
to standardize price by exchange rate instead of PPP because PPP is not available for the most
recent (and largest) round of sample collection (2016).
We also collected city-specific data. América Economía, the first Latin American business
magazine, conducts research and rankings on major topics relevant to business and economics in
Latin American countries (Echeverría 2016); we use their data on city GDP per capita in Latin
America (gdp_city). The year- and city-specific GDP per capita data are denominated in US$ of
purchasing power parity (PPP). We also used the adult literacy rate from UNESCO (literacy); the
percent of shipments receiving physical inspection (phys_inspect) and meeting local quality
criteria (q_criteria) from the World Bank’s Logistics Performance Index; the Corruption
Perception Index for 2015 from Transparency International (cpi).
We also hand-collected information on whether a country has drug price regulations
(pricereg). Drug regulations focus on issues other than drug safety, for example the purchase
country could issue price ceilings, mandatory retail price, and price guidance. We hand collected
these regulations from each country’s most recent government documents. Given the wide variety
of price regulations, we define a binary variable equal to one if a country has adopted any price
regulation on pharmaceuticals in the data collection year and zero otherwise.
9 Deflated according to the US Census Consumer Price Index for all urban consumers.

Another variable we use is the maximum penalty in months for producing or selling
counterfeit medicine (max_penalty). We proxy it by the number of months a person will be
sentenced in prison if he is found guilty for counterfeiting drugs. We hand collected minimum and
maximum penalty from the latest legal documents we can find in each country.
Finally, we also have information on whether the drugs were purchased from a large chain
pharmacy, and how our shoppers ranked these pharmacies based on their general appearance and
location.
All medicines were assessed following the Global Pharma Health Fund e.V. Minilab®
protocol to identify substandard or counterfeit medicines. The first test is a visual inspection of
packaging and pills for correctness. Depending on the drug being analyzed this can be followed
by dye tests for presence of active ingredient and a disintegration test for basic solubility, but by
far the most important test, and the key test for our sample, is the semi-quantitative thin-layer
chromatography (TLC) for assessing the presence and relative concentration of active ingredient.
All the tests were conducted with the Africa Fighting Malaria Minilab in the United Kingdom
within 60 days of purchase.
Minilab tests were run in duplicate, with the generous assumption that the result more
consistent with the reference standard Cipro (provided by GPHF) was recorded. Quality control of
the Minilab was performed daily prior to testing and consisted of performing TLC on Minilab-
reference samples for the medicine classes being analyzed. In addition, Minilab reagents were
quality control tested using reference samples when a new lot was introduced. The Minilab
protocol awards medicines a “pass” for active ingredient (by TLC) if they have 80% or more of
the labeled active ingredient(s).
Table 6 presents probit regressions of quality. In column (1), we include all the explanatory
variables aside from price that are specific to the city in which the drugs are bought as well as
characteristics relating to the drug as well. Our results show that countries with low levels of
corruption are more likely to have higher quality drugs. Drugs that are locally registered and
countries with more regulated prices are significantly more likely to have higher quality drugs.
Further, when pharmacies are assessed to be good quality by our covert shoppers, this also implies
better quality drugs. These results generally hold across different specifications. In an earlier paper
we found that large chain pharmacies were more likely to stock good quality, locally registered
products. In column (2), (3) and (4), we include an indicator for whether the drug was purchased
from a large chain pharmacy. However, while the effect is positive, it is not statistically significant
suggesting that either chain pharmacies don’t matter or that since chain pharmacies typically store
locally, registered products, the effects are not significant controlling for registration. In
regressions not shown here, we do find that if we drop product registration variables, then large
chain pharmacies are associated with a marginally higher likelihood of passing drugs. In Column
(3), we include one of our LPI indicators, the percentage of shipments that undergo physical
inspection. In Column (4), we include an indicator for the share of shipments that meet the quality
criteria. Neither of these is significant, even though we exclude CPI from these regressions. In
Column (5), we include variables that are drug-specific but not city specific. We then add country
fixed effects to account for the other city-specific variables. We continue to find that low levels of
corruption, product registration and the assessment of the pharmacy by covert shoppers all
correlate with a higher likelihood of passing drugs.
Another finding that stands out in these regressions is that the quality of drugs is better
when the drug labels show that the drugs are coming from China and India. This may seem
surprising given that both these countries are large producers of generics but that they are also
known to supply drugs of poor quality. This result may largely be driven by the fact that the omitted
category for this variable is drugs made in Latin America. In our sample, all the drugs that were
labeled as having been manufactured in UK, USA or Europe, proved to be passing drugs.
Therefore, when we tried to control for this variable in the regression, observations relating to
drugs manufactured in these countries were being dropped from the regression since they predicted
success perfectly. Therefore, the only omitted category is drugs made in Latin America. Hence the
correct interpretation of our results is that relative to drugs manufactured in Latin America, the
drugs coming from India and China were more likely to be passing drugs.
Table 7 regresses drug price on drug quality, drug-specific variables and other local
variables. Column (1) reproduces results from our earlier papers, that higher drug quality is
associated with higher drug prices. Also, product certification (SRA) and local product
registration, large chain pharmacies and GDP are associated with better quality products. Higher
levels of corruption (higher CPI) and higher literacy rates lead to lower prices. These results hold
generally across all columns. In column (5), we exclude city-specific variables and put in country
fixed effects. Our results are robust to this specification. In addition, when we include an indicator
variable for whether the drug was listed as manufactured in India or China, we find that these drugs
tend to be priced lower relative to drugs manufactured in our omitted category Latin America.
Again, this could signal that better quality drugs coming from these countries tend to be priced
lower overall than poorer quality drugs coming from within Latin America.
Some discussion of the effect of corruption on drug prices is warranted here. Corruption in
the healthcare system can lead to the proliferation of counterfeit producers who are not regulated
and who pay bribes to government officials to avoid discovery and prosecution. They bypass
regulations (like product registration), avoid penalties if caught and avoid other types of price
controls as well. This increases the supply of fake drugs10 which as we saw earlier may lead to
high prices because counterfeiters are more likely to price their products almost exactly identical
to the high quality generics in the local market. At the same time, if regulators receive kickbacks
to procure poor quality drugs from the counterfeiters, this might reduce the supply of good quality
drugs in the local market which may in turn drive up prices even more. As noted in a 2007 World
Bank article, procurement is one area that is most prone to corruption (Cohen 2005).11 That’s
because regulators have to make many subjective decisions regarding the volume of drugs to be
purchased, the monitoring of drug quality and the prices at which the drugs can be purchased.
Hence our results suggest that corruption leads to higher prices of drugs possibly because of one
or more of these factors. These high prices unfortunately further encourage the entry of more
counterfeiters into these markets.
IV. Discussion
The United States Trade Representative publishes special 301 reports on intellectual
property violations. Nations of highest concern are placed on its priority watch list. Of the dozen
nations on the most recent watch list two, Argentina and Venezuela, are covered by our research.
While this is a general listing not specific to medicines, it is an important indication of
counterfeiting problems in the region (U.S. Trade Representative 2016). Furthermore, Paraguay is
one of the world centers for counterfeiting consumer products, most of which do not find their way
into US markets and hence are less of concern to USTR. Organized criminals in Paraguay are
10 It may also increase the supply of substandard drugs if local producers pay bribes and cut corners in production to
avoid oversight. 11 Also see Kohler et al. (2015) and Rose-Ackerman (2015)

increasingly faking pharmaceuticals causing significant problems including recent deaths (Wells
2013).
This also helps explain why many of the fake products are allegedly made by Brazilian
manufacturers. Brazil is the largest market in South Africa and its locally produced medicines have
a good reputation, so passing ones products off as Brazilian is rational for counterfeiters.
Furthermore, while Brazil has a good drug regulator it shares large and fairly porous borders with
key counterfeiting nations (Paraguay and Argentina). Notably on the Paraguayan side of border is
Ciudad Del Este, which is a large city and border zone, and a key transit point for counterfeit
products in the whole of South America. Ongoing research in Paraguay found that two of the fake
treatments in our sample, bought in Asuncion, were passed off as Brazilian made products were in
fact made locally, probably in Ciudad Del Este. It is possible that other fakes were made there too.
Brazilian authorities cannot do anything about products made in Ciudad del Este until they
enter Brazil, and since its own law enforcement efforts are sometimes compromised by corruption,
faked products passed off as Brazilian are trade widely within Brazil. Nevertheless, Sao Paolo
does not have as bad a problem with poor quality medicines as other nations, partly because other
Latin American enforcement is far worse than Brazil. When it comes to substandard medicines,
Brazil is also well off, since its drug regulator compares favorably with other mid-income countries
(Bate, Mooney & Hess 2010).
India is most implicated in the production of substandard medicines, partly because of poor
quality ingredients (Pugatch et al. 2015). India is one of the largest producers of cheap generics
across the world and these generics are in demand everywhere. So it is no surprise that they are
the single largest source of generics in our sample, 170 of 518 (33%) treatments. But 60% (14 of

25) of substandard medicines were made in India. This is in keeping with our other research where
India was the largest source of medicines and an even larger source of substandards.
So how should countries proceed with tackling the issue of corruption in healthcare?
Several initiatives around the world seem relevant. As detailed in a recent paper by Vian (2007),
the first step is to introduce more transparency, since without transparency it is difficult to know
which policy changes are required and when implemented which are working. Transparency
policies may include government-mandated disclosure of information. Strategies to increase
transparency include public service ‘report cards’, price monitoring and release of government
documents or decisions through web sites, public databases, public meetings and the media (World
Bank 2003). An example can be found in Argentina. The Ministry of Health in Argentina created
a price monitoring system that tracked prices paid by 33 public hospitals for common drugs. The
effect of the transparency policy was that purchase prices fell immediately by an average of 12%,
and stayed below the baseline for over a year (Schargrodsky, Mera & Weinschelbaum 2001). A
second step might be better detection and enforcement. Detection and enforcement includes steps
taken to collect evidence that corruption has occurred, and to punish those who engage in
corruption. Mechanisms of enforcement can function within the bureaucracy or externally through
policing and the criminal justice system. Enforcement includes such activities as surveillance,
internal security, fraud control, investigation (including investigative journalism), and punishment.
Such disciplinary systems can potentially increase accountability and deter corruption.
V. Conclusion
Using original, self-collected data from nine countries in Latin America, we test whether
the samples of 518 Ciprofloxacin drugs pass the Minilab Test, or fail. If they fail, we classify them

into counterfeit or substandard contingent upon the amount of active ingredient. In terms of
quality, 93 percent of drugs were good quality. Within the drugs that failed the quality test, the
majority were substandard rather than fake. About 26.5% of the poor quality drugs were fake i.e.
had zero active ingredient, while the rest were substandard i.e. they had less than 80% API. In line
with results from our earlier studies, we find that products that were locally registered, as well as
those with SRA or WHO pre-qualification, were more likely to pass the test. A new finding in this
paper is the role of corruption in influencing the quality of drugs. As highlighted in the literature,
corruption can play a large, negative role in the healthcare system, particularly adversely impacting
those with very low incomes. Bribery of regulators and public officials can affect the procurement
process for drugs and allow counterfeit producers to supply low quality drugs without facing the
consequences. Our study finds that corruption is strongly correlated with poor quality drugs. Less
corrupt countries on the other hand, had higher levels of passing drugs.
While drugs may be locally manufactured, our sample suggests that a large share of drugs
come in from places like UK, USA, India, China and several countries in Europe. We find that all
the drugs that were listed as being manufactured in UK, USA and Europe were good quality.
Further, the quality of drugs manufactured in India and China were on average better than those
manufactured within Latin America. To see if this was linked to effective customs practices,
another variable that we tested was the percent of shipments that were inspected at the border. In
general, we find that countries with higher levels of poor quality drugs also had higher levels of
shipment inspections and lower percentages of good quality shipments.
While our sample size is currently inadequate to allow large scale generalizations about the
role of corruption in driving the quality of drugs in these countries, it does suggest that this is an
avenue for further research and exploration.

References
Afzar, O. & Gurgur, T. (2008). Does corruption affect health and education outcomes in the
Philippines? Economics of Governance, 9(3): 197-244.
Akunyili, D. (2006). The fight against counterfeit drugs in Nigeria. In Transparency
International, Global Corruption Report 2006.
Echeverría, J.F. (2016). Mejores Ciudades para hacer Negocios 2016. Coral Gables, FL:
América Economía.
Attaran, A., Barry, D., Basheer, S., Bate, R., Benton, D., Chauvin, J., … McKee, M. (2012).
How to achieve international action on falsified and substandard medicines. British
Medical Journal, 345.
Bate, R., Mooney, L., & Hess, K. (2010). Medicine registration and medicine quality: a
preliminary analysis of key cities in emerging markets. Research and Reports in Tropical
Medicine, 1: 89-93.
Bate, R., Putze, E., Naoshy, S., McPherson, A., & Mooney, L. (2010). Drug Registration - a
necessary but not sufficient condition for good quality drugs – a preliminary analysis of
12 countries. (Working Paper). Congella, South Africa: Africa Fighting Malaria.
Bate, R. (2012). Phake: The Deadly World of Falsified and Substandard Medicines. Washington,
DC: AEI Press.
Bate, R., Jin, G.Z., & Mathur, A. (2012). Counterfeit or substandard? Assessing price and non-
price signals of drug quality. (NBER Working Paper No. 18073). Cambridge, MA:
National Bureau of Economic Research.
——— . (2015). Falsified or substandard? Assessing price and non-price signals of drug quality.
Journal of Economics and Management Strategy, 24(24).
Bate, R., Jin, G.Z., Mathur, A., & Attaran, A. (2016). Poor-quality drugs and global trade: a pilot
study. American Journal of Heath Economics, 2(3), 373-398.
Caudron, J.M., Ford, N., Henkens, M., Mace, C., Kiddle-Monroe, R., & Pin, J. (2008).
Substandard medicines in resource-poor settings: a problem that can no longer be
ignored. Tropical Medicine & International Health, 13(8).
Cockburn, R., Newton, P.N., Agyarko, E.K., Akunyili, D., & White, N.J. (2005). The Global
Threat of Counterfeit Drugs: Why Industry and Governments Must Communicate the
Dangers. Plos Med, 2(4).
Cohen, J.C. (2005). Pharmaceuticals and corruption: a risk assessment. Washington, DC: World
Bank.

Davoodi, H., Gupta, S., & Tiongson, E. (2000). Corruption and the Provision of Health Care and
Education Services. (IMF Working Paper No. 00/116). Washington, DC: International
Monetary Fund.
Global Health Intelligence (2016). Opportunities in Latin America's Healthcare Sector: Looking
Ahead to 2016. Retrieved from http://globalhealthintelligence.com/opportunities-in-latin-
americas-healthcare-sector-2016/.
Hunt, J. (2007). Bribery in Health Care in Peru and Uganda. (NBER Working Paper No. 13034).
Cambridge, MA: National Bureau of Economic Research.
Institute of Medicine (2013). Countering the Problem of Falsified and Substandard Drugs.
Washington, DC: National Academy of Sciences.
Jähnke, R.W.O., Küsters, G., & Fleischer, K. Low-cost quality assurance of medicines using the
GPHF-Minilab. Drug Information Journal, 35: 941-945.
Kohler, J.C., Mitsakakis, N., Saadat, F., Bynh, D., & Martinez, M.G. (2015). Does
Pharmaceutical Pricing Transparency Matter? Examining Brazil’s Public Procurement
System. Globalization and Health, 11(34):
Mackey, T.K., Liang, B.A., York, P., & Kubic, T. (2015). Counterfeit Drug Penetration into
Global Legitimate Medicine Supply Chains: A Global Assessment. American Journal of
Tropical Medicine and Hygiene, 92(Suppl 6): 59-67.
Morris, J. & Stevens, P. (2006). Counterfeit medicines in less developed countries. International
Policy Network.
Oxfam. (2011). Oxfam Annual Report 2010-2011. Oxford, United Kingdom.
Pugatch, M., Tortensson, D., & Laufer, M. (2015). The next frontier in ensuring the quality of
medicines. Pugatch Consortium.
Rose-Ackerman, S. (2015). Corruption in the Procurement of Pharmaceuticals and Medical
Equipment in China: The Incentives Facing Multinationals, Domestic Firms and Hospital
Officials. Yale Faculty Scholarship Series. Paper 4945.
Rose, R. (2006). Corruption is bad for your health: findings from Central and Eastern Europe. In
Transparency International, Global Corruption Report 2006.
Savedoff, W. (2007). Transparency and Corruption in the Health Sector: A Conceptual
Framework and Ideas for Action in Latin American and the Caribbean. Sustainable
Development Department, Inter-American Development Bank, Health Technical Note
03/2007.
Schargrodsky, E., Mera, J., & Weinschelbaum, F. (2001). Transparency and accountability in
Argentina's hospitals. In Di Tella, R. & Savedoff, W. Diagnosis Corruption: Fraud in
Latin American Public Hospitals. Washington, DC: Inter-American Development Bank.
Tortensson, D. & Pugatch, M. (2010). What lies within?: Procurement processes and the risk of
substandard medicines. Stockholm Network.
Transparency International. (2015). Corruption Perceptions Index 2015. Berlin, Germany.
U.S. Trade Representative. (2016). Special 301 Report. Washington, DC: Office of the United
States Trade Representative.
Vian, T. (2002). Corruption and the Health Care Sector: Sectoral Perspectives on Corruption.
USAID, Washington, DC i-34.
Wells, M. (2013, June 24). Criminals Flooding Paraguay with Counterfeit Drugs. InSight Crime.
Retrieved from http://www.insightcrime.org/news-briefs/criminals-killing-paraguayans-
with-counterfeit-drugs.
———. (2007). Review of corruption in the health sector: theory, methods and interventions.
Health Policy and Planning, 23(2): 83-94.
Webster, P.C. (2012). Health in Colombia: a system in crisis. Canadian Medical Association
Journal, 184(6), E289-E290.
World Bank. (2003). Poverty net tool and practices. Washington, DC.
———. (2016). Logistics Performance Index 2016. Data file. Washington, DC.

Table 1: Summary Statistics
(1) (2) (3) (4) (5)
Variable name Description N mean Sd min Max
large_chain Large Chain 518 0.793 0.405 0 1
pharmassess Pharmacy Assessment 518 0.875 0.332 0 1
sra_whopq SRA/WHO Registration 518 0.187 0.390 0 1
innovator Innovator Brand 518 0.0521 0.222 0 1
Drug Price (Nominal $) 518 31.75 20.25 9.200 104.4
Drug Price (Real $) 518 31.93 20.53 9.200 107.8
quality Quality 518 0.934 0.248 0 1
prodregis Local Registration 518 0.865 0.342 0 1
known_fake Known_Fake? 518 0.0174 0.131 0 1
known_sub Known_Substandard? 518 0.0483 0.215 0 1
gdp_city City GDP per capita 518 12,066 5,593 3,627 20,981
literacy Adult literacy rate 518 92.89 5.211 79.31 98.43
max_penalty Maximum Penalty 518 106.0 59.04 30 180
pricereg Price Regulation 518 0.542 0.499 0 1
cpi Corruption Perception Index 518 35.04 12.53 17 74
before2016 Collected pre-2016 518 0.135 0.342 0 1
phys_inspect Pct. physical inspection 427 16.45 14.31 1.58 35.57
q_criteria Pct. meeting local criteria 427 79.17 15.80 40.00 92.13
Table 2: Quality Test Results
City of Purchase N Passing Counterfeit Substandard
Asuncion 55 87.3% 7.2% 5.4%
Buenos Aires 45 100% 0% 0%
Caracas 36 83.3% 5.5% 11.1%
Guatemala 52 92.3% 1.9% 5.7%
Guayaquil 43 95.3% 0% 4.7%
La Paz 34 91.2% 0% 8.8%
Lima 56 92.8% 1.8% 5.3%
Montevideo 40 97.5% 0 2.5%
Sao Paolo 112 96.4% 0% 3.5%
Tegucigalpa 45 93.3% 2.2% 4.4%
Total 518 484 9 25
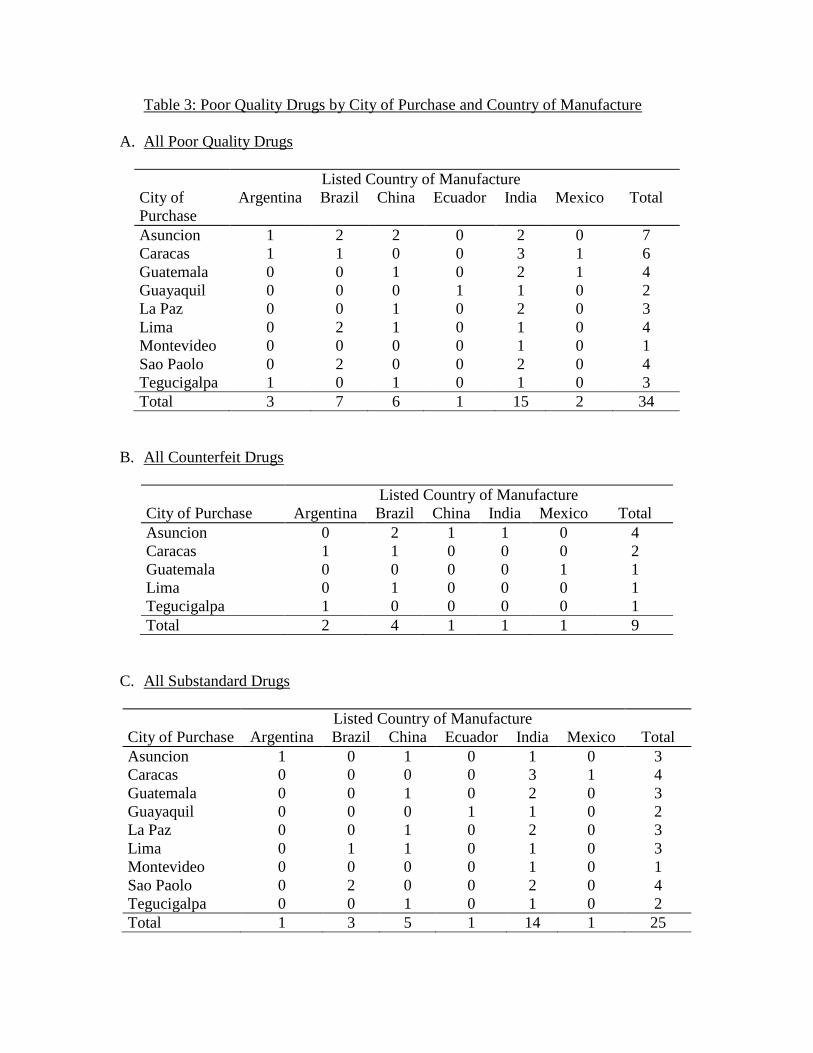
Table 3: Poor Quality Drugs by City of Purchase and Country of Manufacture
A. All Poor Quality Drugs
Listed Country of Manufacture
City of
Purchase
Argentina Brazil China Ecuador India Mexico Total
Asuncion 1 2 2 0 2 0 7
Caracas 1 1 0 0 3 1 6
Guatemala 0 0 1 0 2 1 4
Guayaquil 0 0 0 1 1 0 2
La Paz 0 0 1 0 2 0 3
Lima 0 2 1 0 1 0 4
Montevideo 0 0 0 0 1 0 1
Sao Paolo 0 2 0 0 2 0 4
Tegucigalpa 1 0 1 0 1 0 3
Total 3 7 6 1 15 2 34
B. All Counterfeit Drugs
Listed Country of Manufacture
City of Purchase Argentina Brazil China India Mexico Total
Asuncion 0 2 1 1 0 4
Caracas 1 1 0 0 0 2
Guatemala 0 0 0 0 1 1
Lima 0 1 0 0 0 1
Tegucigalpa 1 0 0 0 0 1
Total 2 4 1 1 1 9
C. All Substandard Drugs
Listed Country of Manufacture
City of Purchase Argentina Brazil China Ecuador India Mexico Total
Asuncion 1 0 1 0 1 0 3
Caracas 0 0 0 0 3 1 4
Guatemala 0 0 1 0 2 0 3
Guayaquil 0 0 0 1 1 0 2
La Paz 0 0 1 0 2 0 3
Lima 0 1 1 0 1 0 3
Montevideo 0 0 0 0 1 0 1
Sao Paolo 0 2 0 0 2 0 4
Tegucigalpa 0 0 1 0 1 0 2
Total 1 3 5 1 14 1 25

Table 4: Drug Prices, by Quality of Drug Across Cities
City of Purchase Passing Drugs
(2016 $US)
Substandard Drugs
(2016 $US)
Counterfeit
(2016 $US)
Comparator Price
of Drug
Asuncion 24.75 17.1 19.6 19.68
Buenos Aires 32.38 - - -
Caracas 52.28 19.07 33.2 33.2
Guatemala 27.93 12.66 22.3 22.3
Guayaquil 24.97 16.2 - -
La Paz 18.86 10.16 - -
Lima 27.39 24.83 28.8 28.8
Montevideo 31.51 13.2 - -
Sao Paolo 40.64 19.55 - -
Tegucigalpa 26.65 15.15 28.2 -
Table 5: Corruption Perception Index, Logistics Performance Index and Drug Quality
Passing
Drugs
Substandard
Drugs
Counterfeit
Drugs
Corruption Perception
Index
35.37 31.8 26.33
Pct. of shipments receiving
physical inspection
16.28 17.83 30.61
Pct. of shipments meeting
local quality criteria
79.47 73.63 71.41

Table 6: Regression of Drug Quality on Regulatory Factors and Demographics
(1) (2) (3) (4) (5)
VARIABLES quality quality quality quality quality
cpi 0.0165*** 0.0128** 0.303***
(0.00622) (0.00634) (0.0129)
sra_whopq 0.553 0.495 0.181 0.153
(0.521) (0.510) (0.418) (0.422)
prodregis 1.013*** 0.970** 1.178*** 1.166***
(0.385) (0.388) (0.394) (0.399)
max_penalty -0.000465 -0.000271 -0.00566*** -0.00562**
(0.00182) (0.00183) (0.00218) (0.00224)
pricereg 0.380** 0.338* 0.208 0.321
(0.177) (0.184) (0.270) (0.251)
literacy -0.0136 -0.0106 -0.0115 -0.0175*
(0.0117) (0.0127) (0.0135) (0.00918)
log(gdp_city) -0.00171 -0.0281 0.401** 0.854*
(0.190) (0.200) (0.176) (0.454)
madeinasia 0.591* 0.598* 0.327 0.322 -0.269*
(0.323) (0.314) (0.347) (0.353) (0.141)
before2016 -0.374 -0.308 -0.169 -0.428 -0.364***
(0.284) (0.327) (0.127) (0.293) (0.0555)
pharmassess 1.132*** 0.948*** 1.030*** 1.050***
(0.187) (0.227) (0.347) (0.328)
large_chain 0.493 0.283 0.268
(0.320) (0.397) (0.389)
phys_inspect 0.00676
(0.0116)
q_criteria -0.0172
(0.0120)
Constant 0.204 0.146 -2.520 -4.682 -4.040***
(1.987) (2.070) (2.542) (3.280) (0.226)
Observations 518 518 427 427 518
Robust standard errors in parentheses
*** p<0.01, ** p<0.05, * p<0.1
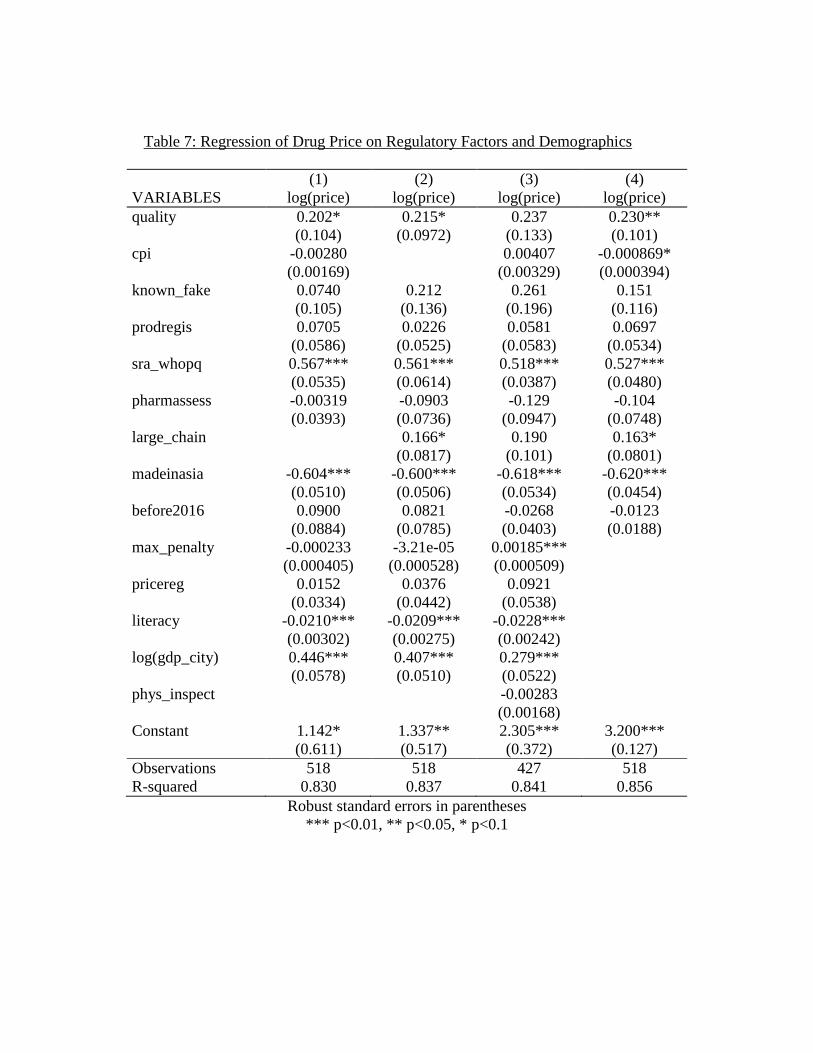
Table 7: Regression of Drug Price on Regulatory Factors and Demographics
(1) (2) (3) (4)
VARIABLES log(price) log(price) log(price) log(price)
quality 0.202* 0.215* 0.237 0.230**
(0.104) (0.0972) (0.133) (0.101)
cpi -0.00280 0.00407 -0.000869*
(0.00169) (0.00329) (0.000394)
known_fake 0.0740 0.212 0.261 0.151
(0.105) (0.136) (0.196) (0.116)
prodregis 0.0705 0.0226 0.0581 0.0697
(0.0586) (0.0525) (0.0583) (0.0534)
sra_whopq 0.567*** 0.561*** 0.518*** 0.527***
(0.0535) (0.0614) (0.0387) (0.0480)
pharmassess -0.00319 -0.0903 -0.129 -0.104
(0.0393) (0.0736) (0.0947) (0.0748)
large_chain 0.166* 0.190 0.163*
(0.0817) (0.101) (0.0801)
madeinasia -0.604*** -0.600*** -0.618*** -0.620***
(0.0510) (0.0506) (0.0534) (0.0454)
before2016 0.0900 0.0821 -0.0268 -0.0123
(0.0884) (0.0785) (0.0403) (0.0188)
max_penalty -0.000233 -3.21e-05 0.00185***
(0.000405) (0.000528) (0.000509)
pricereg 0.0152 0.0376 0.0921
(0.0334) (0.0442) (0.0538)
literacy -0.0210*** -0.0209*** -0.0228***
(0.00302) (0.00275) (0.00242)
log(gdp_city) 0.446*** 0.407*** 0.279***
(0.0578) (0.0510) (0.0522)
phys_inspect -0.00283
(0.00168)
Constant 1.142* 1.337** 2.305*** 3.200***
(0.611) (0.517) (0.372) (0.127)
Observations 518 518 427 518
R-squared 0.830 0.837 0.841 0.856
Robust standard errors in parentheses
*** p<0.01, ** p<0.05, * p<0.1