corruption perception index 2015 power-point presentation
DESCRIPTION
Today, the Transparency International movement released the Corruption Perception index 2015. This is a presentation made by Executive Director, Samuel Kimeu, of Transparency International Kenya. this was during a press release held in Nairobi, Kenya, to launch the Corruption Perceptions Index 2015TRANSCRIPT

@TIKenya #cpi2015
Toll free line : 0800 720 721 SMS: 22129

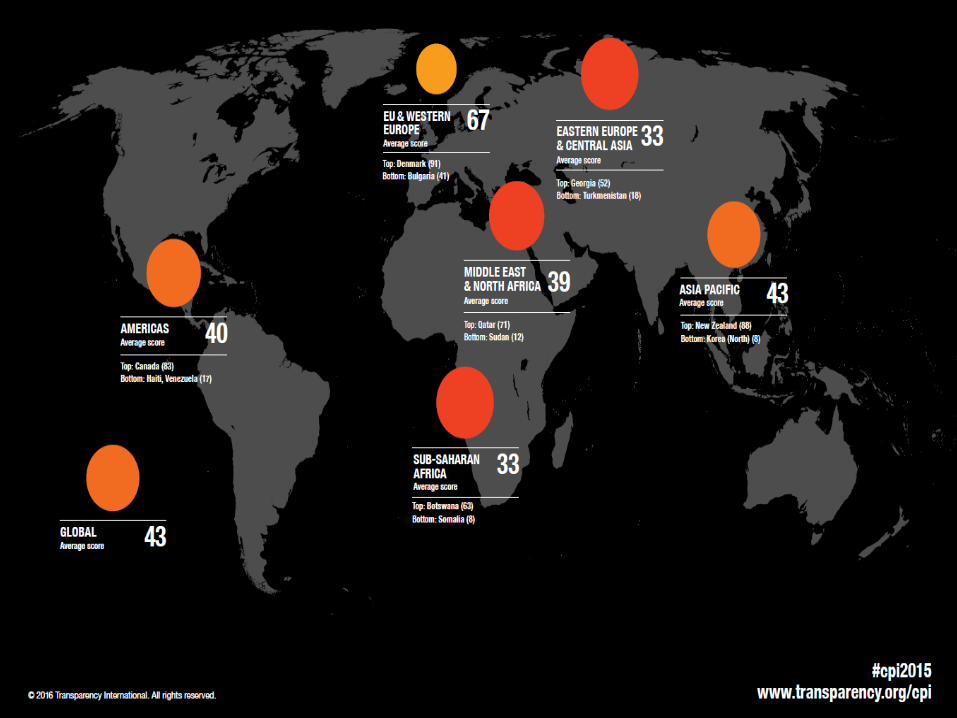
The perceived levels of public sector corruption in 168 countries/territories around the world.
#cpi2015

THE CORRUPTION PERCEPTIONS
INDEX IS:
A global (168 countries/territories)
aggregate Index (up to 12 different data sources)
capturing perceptions (experts/business people)
of corruption (abuse of power for private gain)
in the public sector (public officials and institutions)

CPI 2015

THE METHOD
STEP 1 – Select data sources
STEP 2 – Rescale data sources
STEP 3 – Calculate the average
STEP 4 – Report uncertainty

INTERPRETING THE RESULTS
Score:
On a scale of 0 – 100, where 0 means highly corrupt and 100 means very clean.
Allows for comparison with scores from previous years (2014, 2013, 2012): The CPI
scores from 2015 can be compared with the CPI scores from the previous 3 years
and changes in scores can be interpreted appropriately.
Rank:
Out of the 168 countries globally, a change in rank could be due to:
a) Change in CPI score for the country between 2014 and 2015
b) Change in scores of other countries included in the CPI
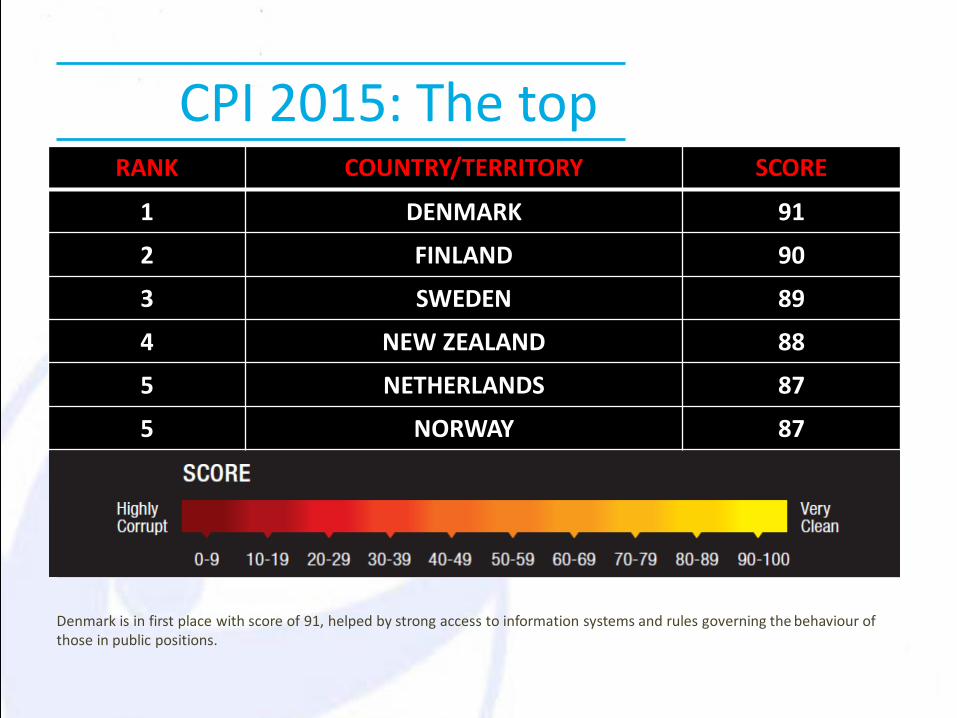
CPI 2015: The top
Denmark is in first place with score of 91, helped by strong access to information systems and rules governing the behaviour of those in public positions.
RANK COUNTRY/TERRITORY SCORE
1 DENMARK 91
2 FINLAND 90
3 SWEDEN 89
4 NEW ZEALAND 88
5 NETHERLANDS 87
5 NORWAY 87

CPI 2015: The bottom RANK COUNTRY/TERRITORY SCORE
161 IRAQ 16
161 LIBYA 16
163 ANGOLA 15
163 SOUTH SUDAN 15
165 SUDAN 12
166 AFGHANISTAN 11
167 KOREA (NORTH) 8
167 SOMALIA 8


CPI 2015: Kenya and EAC
2015 Rank
2015 Score Country
2014 Rank
2014 Score
44 54 Rwanda 55 49
117 30 Tanzania 119 31
139 25 Kenya 145 25
139 25 Uganda 142 26
150 21 Burundi 159 20

Kenya’s Performance: CPI 2012-15
27 27
25 25
24
25
25
26
26
27
27
28
Y2012 Y2013 Y2014 Y2015
SCO
RE
YEAR
CPI TREND FOR KENYA SINCE 2012

• An independent audit of corruption complaints handled by EACC since its inception.
• Strengthen corruption investigations and prosecutions to increase the rate of convictions and asset recovery.
• Establishment of an elaborate lifestyle audit system supported by robust wealth declaration system.
What needs to happen..

• A system that identifies the beneficial owners of all legal persons operative in the country be established.
• Implementation of the recommendations of the Taskforce on the review of the legal, policy and institutional framework for fighting corruption.
• Public vigilance in the implementation of the Constitution to protect the gains of the constitutional reform process.
What needs to happen..

Questions

@TIKenya #cpi2015