corsa coal corp.corsacoal.com/_resources/presentations/corsa_website_investor... · corsa coal...
TRANSCRIPT

December 2016
Corsa Coal Corp.Investor Presentation

Forward Looking Statements
1
Certain statements and information set forth in this presentation constitute “forward-looking statements” and “forward-looking information” underapplicable securities laws (collectively, “forward-looking statements”). Except for statements of historical fact, certain information contained hereinconstitutes forward-looking statements which include management’s assessment of future plans and operations and are based on current internalexpectations, estimates, projections, assumptions and beliefs, which may prove to be incorrect. Some of the forward-looking statements include, but is notlimited to, statements regarding the pro forma projections and information for Corsa and future oriented financial information. When used in thispresentation, forward-looking statements may be identified by words such as “estimates”, “expects” “anticipates”, “believes”, “projects”, “plans”, “proforma” and similar expressions. These statements are not guarantees of future performance and undue reliance should not be placed on them. Suchforward-looking statements necessarily involve known and unknown risks and uncertainties, many of which are beyond Corsa’s control and may causeCorsa’s actual performance and financial results in future periods to differ materially from any projections of future performance or results expressed orimplied by such forward-looking statements. These risks and uncertainties include, but are not limited to: liabilities inherent in coal mine development andproduction; geological, mining and processing technical problems; inability to obtain required mine licenses, mine permits and regulatory approvals orrenewals required in connection with the mining and processing of coal; unexpected changes in coal quality and specification; risks that the coalpreparation plants will not operate at production capacity during the relevant period; variations in the coal preparation plants’ recovery rates; dependenceon third party coal transportation systems; competition for, among other things, capital, acquisitions of reserves, undeveloped lands and skilled personnel;incorrect assessments of the value of acquisitions; changes in commodity prices and exchange rates; changes in the regulations in respect to the use,mining and processing of coal; changes in regulations on refuse disposal; the effects of competition and pricing pressures in the coal market; theoversupply of, or lack of demand for, coal; currency and interest rate fluctuations; various events which could disrupt operations and/or the transportationof coal products, including labor stoppages and severe weather conditions; the demand for and availability of rail, port and other transportation services;and management’s ability to anticipate and manage the foregoing factors and risks. The forward-looking statements and information contained in thispresentation are based on certain assumptions regarding, among other things, coal sales being consistent with expectations; future prices for coal; futurecurrency and exchange rates; Corsa’s ability to generate sufficient cash flow from operations and access capital markets to meet its future obligations; theregulatory framework representing royalties, taxes and environmental matters in the countries in which Corsa conducts business; coal production levels;and Corsa’s ability to retain qualified staff and equipment in a cost-efficient manner to meet its demand. While these assumptions, risks and uncertaintiesdo not represent a complete list of factors which may cause events to be materially different than those expressed or implied by forward-lookingstatements in this presentation, they should be considered carefully. There can be no assurance that forward-looking statements will prove to be accurate,as actual results and future events could differ materially from those anticipated in such statements. The forward looking statements will not be updatedunless required by law. The reader is cautioned not to place undue reliance on forward-looking statements.
Unless otherwise specifically indicated, all references in this presentation to dollars or to “$” or “$USD” are to the currency of the United States, and allreferences to “$CAD” are to the currency of Canada.

Corsa Coal – Overview
2
Description – TSX Venture Exchange Listed (TSXV:CSO)
Growth-oriented premium quality metallurgical (“met”) coalproducer with a strong balance sheet
Corsa has approximately 360 employees in two operating divisions:
NAPP Division – Met coal producer based in Somerset, PA withoperations in Maryland and Pennsylvania
CAPP Division – Thermal and industrial coal producer based inKnoxville, Tennessee
Vision: To build a low-cost producer of scale of premium qualitymetallurgical coal
Metallurgical Sales: 2016E: 700,000 tons; 2017E: >1.2 million tons
Corsa NAPP
Corsa CAPPHigh Quality Equity Sponsors
Quintana Capital Group (50% fully diluted ownership)
Quintana affiliates are the largest private owner of coalreserves in the United States
Sold Kopper Glo (now the CAPP Division) to Corsa to acquirecontrol in 2013
Sprott Resource Corporation (17% fully diluted ownership)
Leading resource-focused investor and prior Investor of PBSCoals (sold PBS to Severstal in 2008)
Lundin Family (16% fully diluted ownership)
Highly successful mining and oil & gas investor & operator;prior investor in PBS Coals (sold PBS to Severstal in 2008)
Map of Operations
Note: Market data as of November 25, 2016. Pro forma for October 2016 private placement.
Ohio
Pennsylvania
West Virginia
Virginia
Kentucky
IndianaIllinois
Tennessee
North CarolinaMissouri
Capitalization (Balance Sheet as of Q3'16)
Share Price ($CAD) $0.120
Share Price ($USD) 0.089
Common Shares (mm) 1,888
Redeemable Units 170
Fully Diluted Units (mm) 2,058
Market Cap ($USD mm) $183
Net Debt $19
Enterprise Value ($USD mm) $202
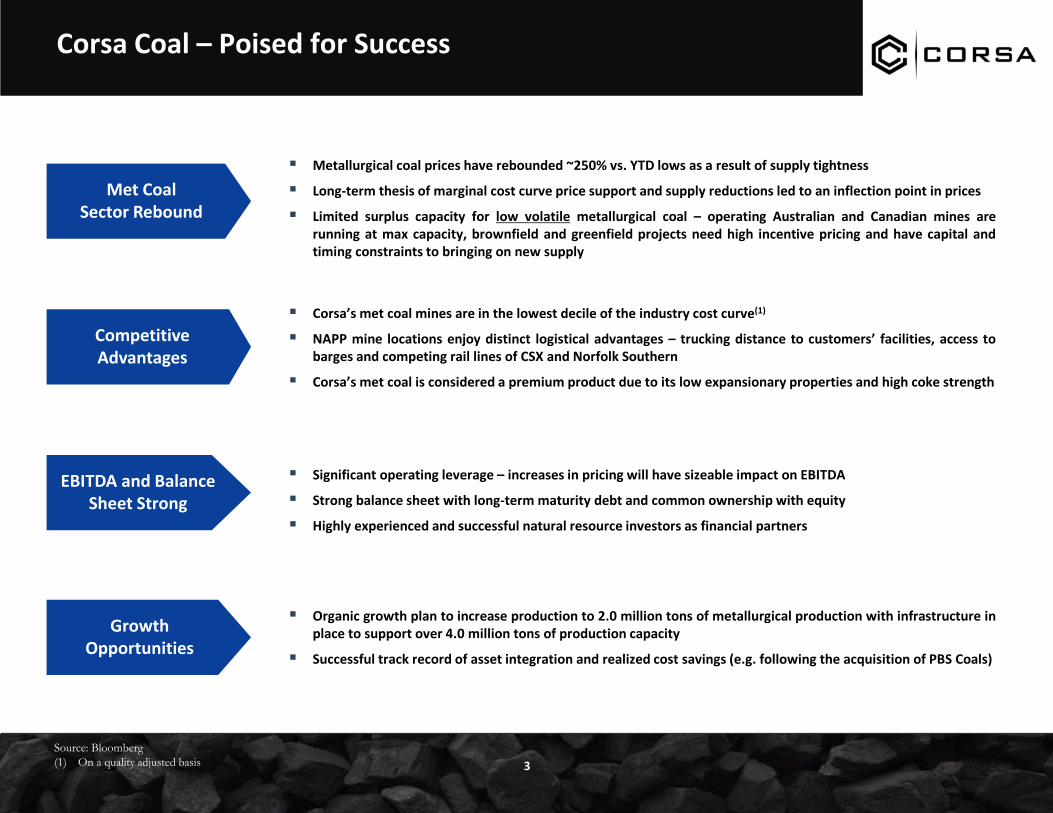
Corsa Coal – Poised for Success
3
Met Coal Sector Rebound
Metallurgical coal prices have rebounded ~250% vs. YTD lows as a result of supply tightness
Long-term thesis of marginal cost curve price support and supply reductions led to an inflection point in prices
Limited surplus capacity for low volatile metallurgical coal – operating Australian and Canadian mines arerunning at max capacity, brownfield and greenfield projects need high incentive pricing and have capital andtiming constraints to bringing on new supply
Competitive Advantages
Corsa’s met coal mines are in the lowest decile of the industry cost curve(1)
NAPP mine locations enjoy distinct logistical advantages – trucking distance to customers’ facilities, access tobarges and competing rail lines of CSX and Norfolk Southern
Corsa’s met coal is considered a premium product due to its low expansionary properties and high coke strength
EBITDA and Balance Sheet Strong
Significant operating leverage – increases in pricing will have sizeable impact on EBITDA
Strong balance sheet with long-term maturity debt and common ownership with equity
Highly experienced and successful natural resource investors as financial partners
Growth Opportunities
Organic growth plan to increase production to 2.0 million tons of metallurgical production with infrastructure inplace to support over 4.0 million tons of production capacity
Successful track record of asset integration and realized cost savings (e.g. following the acquisition of PBS Coals)
Source: Bloomberg
(1) On a quality adjusted basis

$50
$100
$150
$200
$250
$300
$350
Q4
'14
Q1
'15
Q2
'15
Q3
'15
Q4
'15
Q1
'16
Q2
'16
Q3
'16
Q4
'16
Oct
No
v
2-Year Met Coal Prices ($/Mt)(1)
$0
$50
$100
$150
$200
$250
$300
$350
$400
2005 2006 2007 2008 2009 2010 2011 2012 2013 2014 2015 2016
$ /
Met
ric
Ton
4
Source: Industry Research, Bloomberg
(1) Green line reflects spot prices for October and November 2016.
(2) Based on historical differentials. See slide 20 for details.
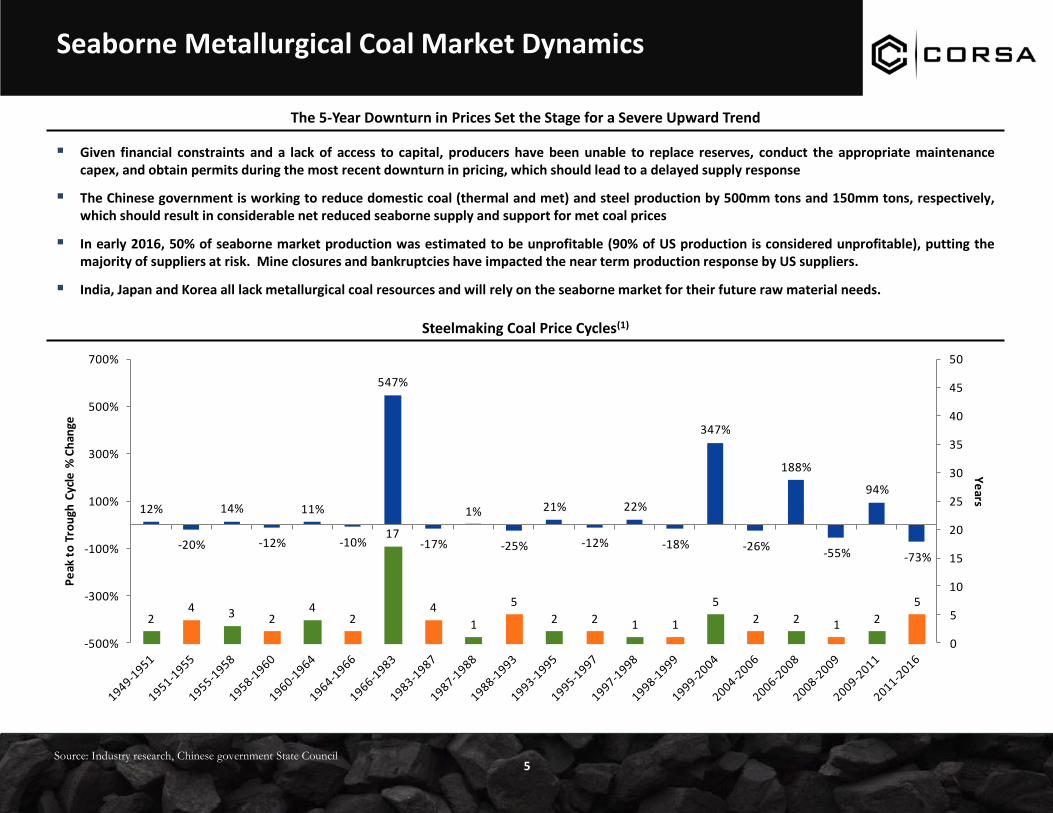
The coal price spike in 2011 caused a large amount of new production to be approved by large producers, which came online over thefollowing three years. This created an oversupplied situation which led to 14-year lows in pricing. The 5-year downturn in prices haveresulted in mine closures, a lack of reinvestment in capital equipment, and a lack of reserve replacement.
Metallurgical Coal Price History
Historical Metallurgical Coal Pricing (2005 – 2016)
Implied Q3’16 Realized Corsa Benchmark(2)
Seaborne Metallurgical Coal Market Dynamics
5
Given financial constraints and a lack of access to capital, producers have been unable to replace reserves, conduct the appropriate maintenancecapex, and obtain permits during the most recent downturn in pricing, which should lead to a delayed supply response
The Chinese government is working to reduce domestic coal (thermal and met) and steel production by 500mm tons and 150mm tons, respectively,which should result in considerable net reduced seaborne supply and support for met coal prices
In early 2016, 50% of seaborne market production was estimated to be unprofitable (90% of US production is considered unprofitable), putting themajority of suppliers at risk. Mine closures and bankruptcies have impacted the near term production response by US suppliers.
India, Japan and Korea all lack metallurgical coal resources and will rely on the seaborne market for their future raw material needs.
The 5-Year Downturn in Prices Set the Stage for a Severe Upward Trend
Source: Industry research, Chinese government State Council
12%
-20%
14%
-12%
11%
-10%
547%
-17%
1%
-25%
21%
-12%
22%
-18%
347%
-26%
188%
-55%
94%
-73%
24 3 2
42
17
4
1
5
2 2 1 1
5
2 2 1 2
5
0
5
10
15
20
25
30
35
40
45
50
-500%
-300%
-100%
100%
300%
500%
700%
Ye
arsP
eak
to
Tro
ugh
Cyc
le %
Ch
ange
Steelmaking Coal Price Cycles(1)

Near-Term Met Coal Fundamentals and Pricing Catalysts
6
Supply Determinants LTM NTM
Announced Supply Cuts Taking Place
Australia Production Growth
Mitigating
Weakening Financial Conditions of
Met Producers
Chinese Met Coal Production
Demand Determinants LTM NTM
US Steel Demand Weakness,
Oil & Gas Rig Count
Chinese Coke and Steel Exports
Chinese and US Infrastructure
Spending
Indian Imports
Supply Disruptions in the U.S. from Financially Distressed Producers
Recent Catalysts
Weather Events in Australia and China
Global Supply Interruptions (Geologic, Issues, Labor Strikes, Rail Issues, Port Congestion)
Chinese Coal Supply Reductions, India’s Continued Increase in Imports
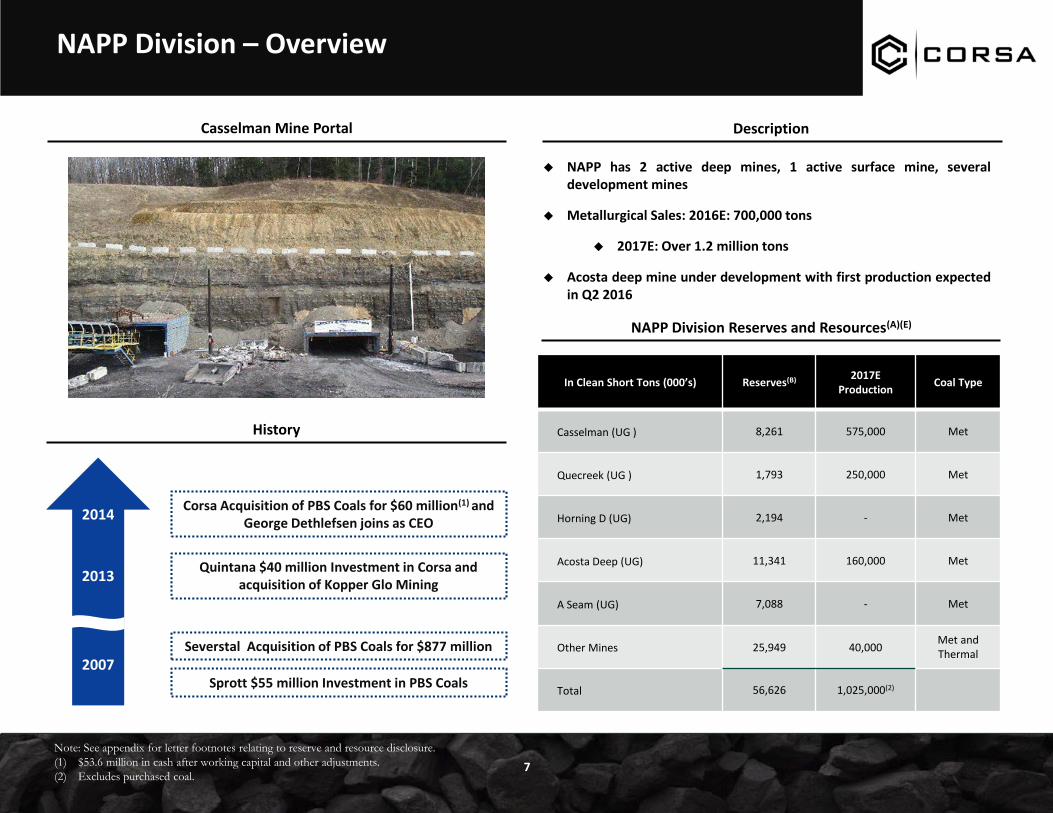
NAPP Division – Overview
7
NAPP Division Reserves and Resources(A)(E)
Description
NAPP has 2 active deep mines, 1 active surface mine, severaldevelopment mines
Metallurgical Sales: 2016E: 700,000 tons
2017E: Over 1.2 million tons
Acosta deep mine under development with first production expectedin Q2 2016
History
2014
2013
2007
Corsa Acquisition of PBS Coals for $60 million(1) and George Dethlefsen joins as CEO
Quintana $40 million Investment in Corsa and acquisition of Kopper Glo Mining
Severstal Acquisition of PBS Coals for $877 million
Sprott $55 million Investment in PBS Coals
Note: See appendix for letter footnotes relating to reserve and resource disclosure.
(1) $53.6 million in cash after working capital and other adjustments.
(2) Excludes purchased coal.
Casselman Mine Portal
In Clean Short Tons (000’s) Reserves(B) 2017E Production
Coal Type
Casselman (UG ) 8,261 575,000 Met
Quecreek (UG ) 1,793 250,000 Met
Horning D (UG) 2,194 - Met
Acosta Deep (UG) 11,341 160,000 Met
A Seam (UG) 7,088 - Met
Other Mines 25,949 40,000Met and Thermal
Total 56,626 1,025,000(2)
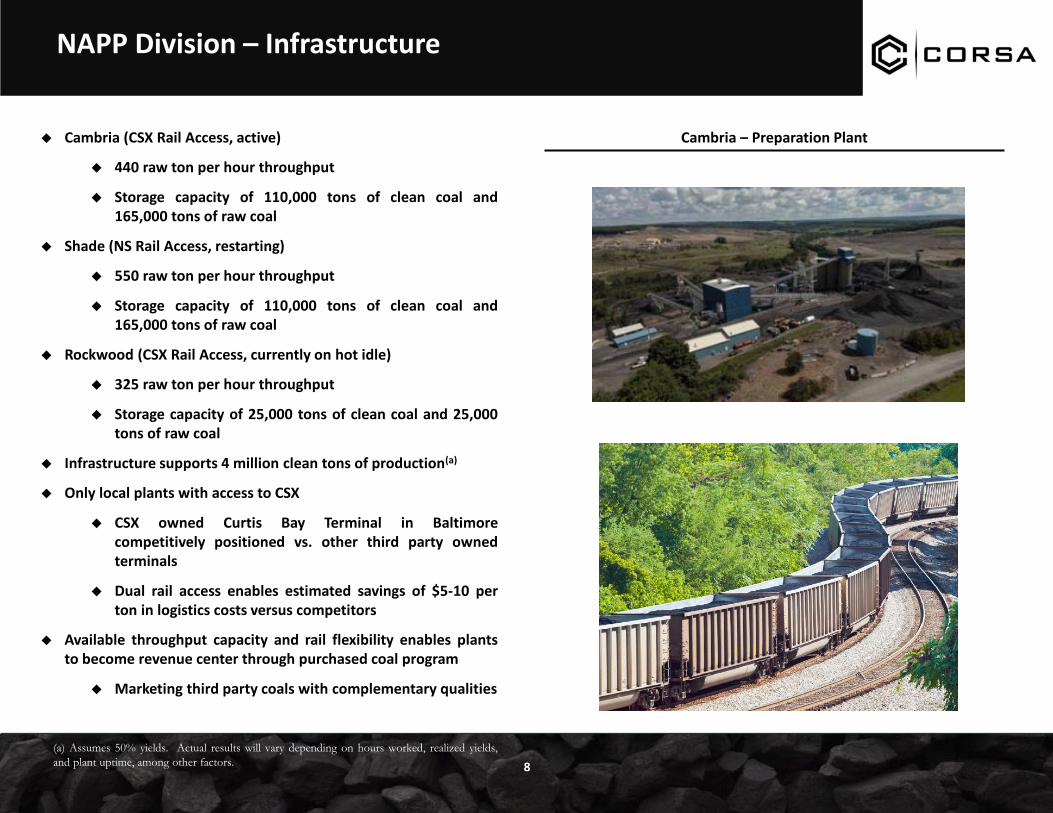
NAPP Division – Infrastructure
8
Cambria (CSX Rail Access, active)
440 raw ton per hour throughput
Storage capacity of 110,000 tons of clean coal and165,000 tons of raw coal
Shade (NS Rail Access, restarting)
550 raw ton per hour throughput
Storage capacity of 110,000 tons of clean coal and165,000 tons of raw coal
Rockwood (CSX Rail Access, currently on hot idle)
325 raw ton per hour throughput
Storage capacity of 25,000 tons of clean coal and 25,000tons of raw coal
Infrastructure supports 4 million clean tons of production(a)
Only local plants with access to CSX
CSX owned Curtis Bay Terminal in Baltimorecompetitively positioned vs. other third party ownedterminals
Dual rail access enables estimated savings of $5-10 perton in logistics costs versus competitors
Available throughput capacity and rail flexibility enables plantsto become revenue center through purchased coal program
Marketing third party coals with complementary qualities
(a) Assumes 50% yields. Actual results will vary depending on hours worked, realized yields,
and plant uptime, among other factors.
Cambria – Preparation Plant
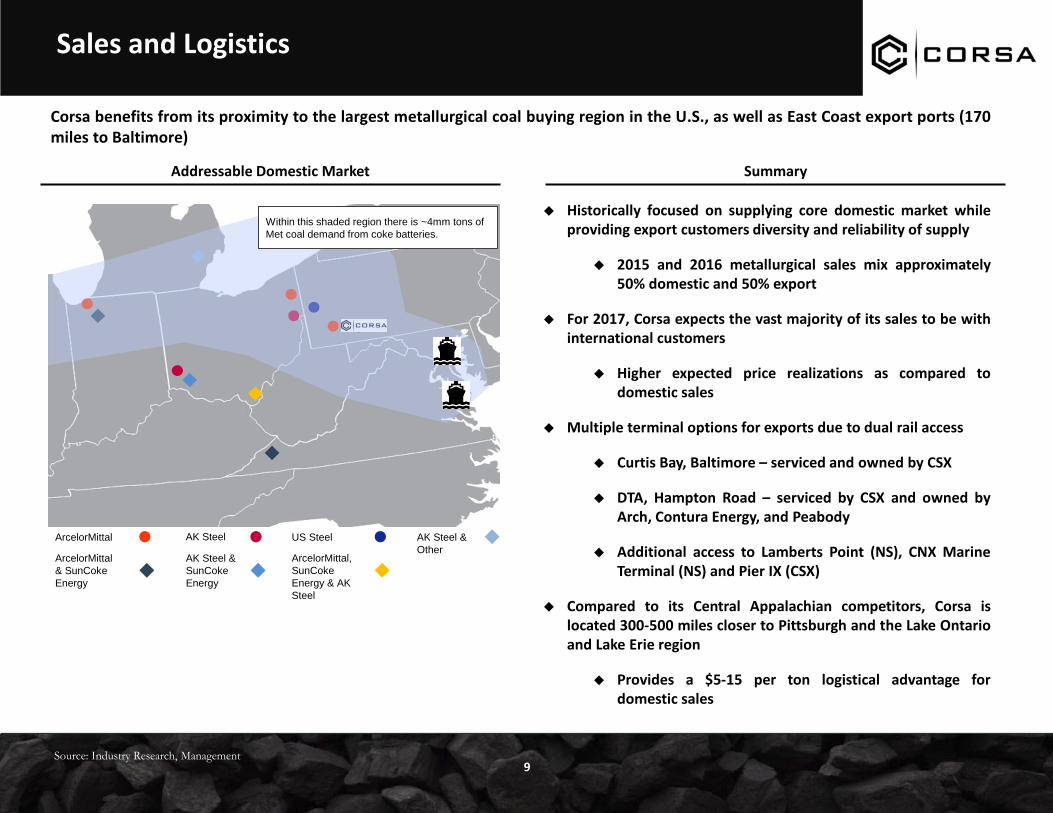
Sales and Logistics
9
Summary
Corsa benefits from its proximity to the largest metallurgical coal buying region in the U.S., as well as East Coast export ports (170miles to Baltimore)
Historically focused on supplying core domestic market whileproviding export customers diversity and reliability of supply
2015 and 2016 metallurgical sales mix approximately50% domestic and 50% export
For 2017, Corsa expects the vast majority of its sales to be withinternational customers
Higher expected price realizations as compared todomestic sales
Multiple terminal options for exports due to dual rail access
Curtis Bay, Baltimore – serviced and owned by CSX
DTA, Hampton Road – serviced by CSX and owned byArch, Contura Energy, and Peabody
Additional access to Lamberts Point (NS), CNX MarineTerminal (NS) and Pier IX (CSX)
Compared to its Central Appalachian competitors, Corsa islocated 300-500 miles closer to Pittsburgh and the Lake Ontarioand Lake Erie region
Provides a $5-15 per ton logistical advantage fordomestic sales
Source: Industry Research, Management
Addressable Domestic Market
ArcelorMittal US SteelAK Steel
ArcelorMittal
& SunCoke
Energy
ArcelorMittal,
SunCoke
Energy & AK
Steel
AK Steel &
SunCoke
Energy
AK Steel &
Other
Within this shaded region there is ~4mm tons of
Met coal demand from coke batteries.
$0
$15
$30
$45
$60
$75
$90
$105
$120
$135
$150
0% 10% 20% 30% 40% 50% 60% 70% 80% 90% 100%
$U
SD p
er T
on
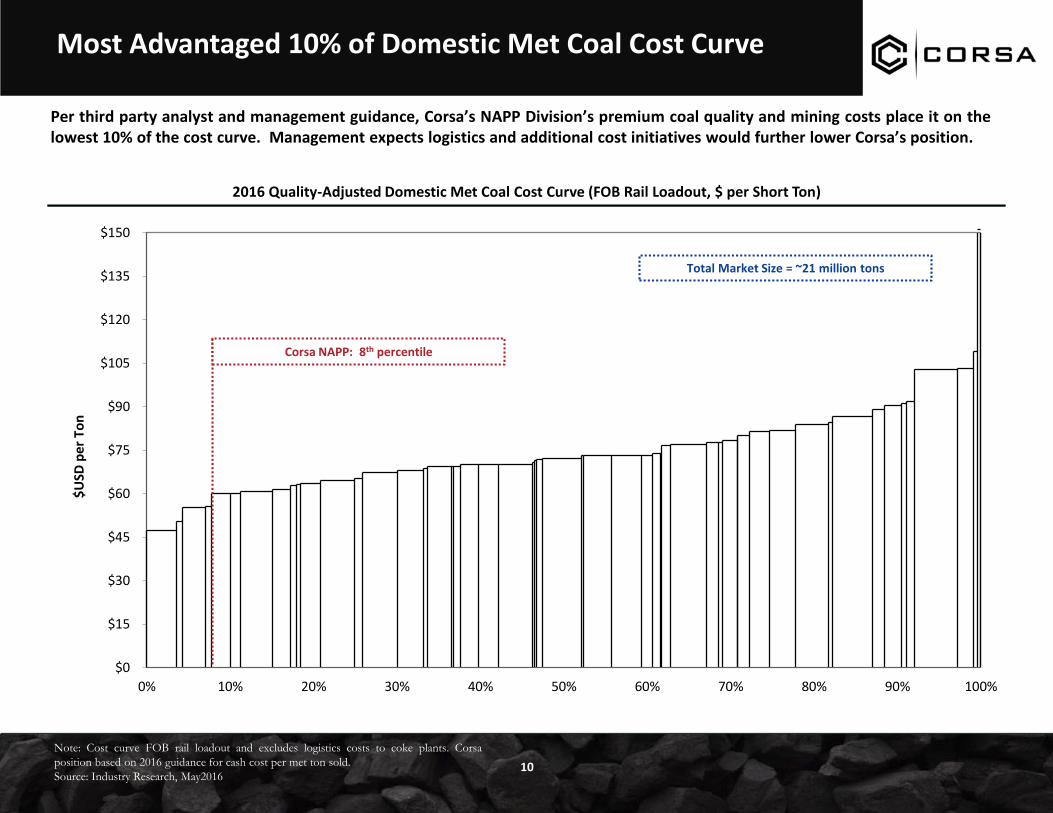
Most Advantaged 10% of Domestic Met Coal Cost Curve
Per third party analyst and management guidance, Corsa’s NAPP Division’s premium coal quality and mining costs place it on thelowest 10% of the cost curve. Management expects logistics and additional cost initiatives would further lower Corsa’s position.
Note: Cost curve FOB rail loadout and excludes logistics costs to coke plants. Corsa
position based on 2016 guidance for cash cost per met ton sold.
Source: Industry Research, May2016
2016 Quality-Adjusted Domestic Met Coal Cost Curve (FOB Rail Loadout, $ per Short Ton)
Corsa NAPP: 8th percentile
Total Market Size = ~21 million tons
10

11
Producing MinesAdvanced-Stage Mines With Permits
• Casselman
• Quecreek
• Ash Surface Mine
• Acosta Deep
• Horning D
• A-Seam
• Keyser
• Schrock Run Surface
Advanced-Stage Mines Without Permits
NAPP Division Mine Development Pipeline
Exploration / Idle Mines
• Over 50 million tons of reserves and ~200 million tons of resources(B)(C)(D)
(1) Unlevered mine-level returns using futures pricing as of November 2016 and historical
quality and logistics differentials.
(2) Gross of $3mm state grant that will offset capex.
($US in mm)Anticipated Capital
ExpendituresTime to Market for
ProjectExpected Annual
Production CapacityAnticipated Capital
IntensityPotential Gross
Returns(1)
Acosta Deep Mine $13-$15 million(2) Started, Expected Production Q2 2016
400,000 $29 / ton >100%
Horning D Mine $6-8 million 2 months 175,000 $43 / ton >40%
A Seam Mine $25-27 million 8 months 615,000 $42 / ton >70%
Note: See Appendix - Coal Reserves Footnotes
Source: Industry Research and Management Estimates
Organic Growth Projects with Attractive Returns

Growth Project: Acosta Deep Mine
12
11-year reserve life, fully permitted, and no preparation plant or refusedisposal capacity investments required
Actively being developed with expected first production in Q2 2016
Received $3mm state grant to offset capital expenditure
Coal quality already approved by Corsa’s existing met coal customers
Total Recoverable Reserves: 11.3 million tons
Initial Target: Middle Kittanning seam
4.5 million tons reserves, reserves owned ~80% in fee
Qualities: 9% ash and 1.0% sulfur, 48% plant yield
Upper & Lower Kittanning increases reserves to 11.3 million tons
Located 20 miles from Corsa’s Cambria preparation plant
Annual production capacity: 389,000 saleable tons with two units
First quartile normalized cash mining costs
Highly attractive project-level IRR
Note: See Appendix – Corsa Reserves Footnotes and report entitled “Technical Report on the
Coal Resource and Coal Reserves controlled by PBA Coals, Inc. Pennsylvania, USA:
13(1) Depending on market conditions.
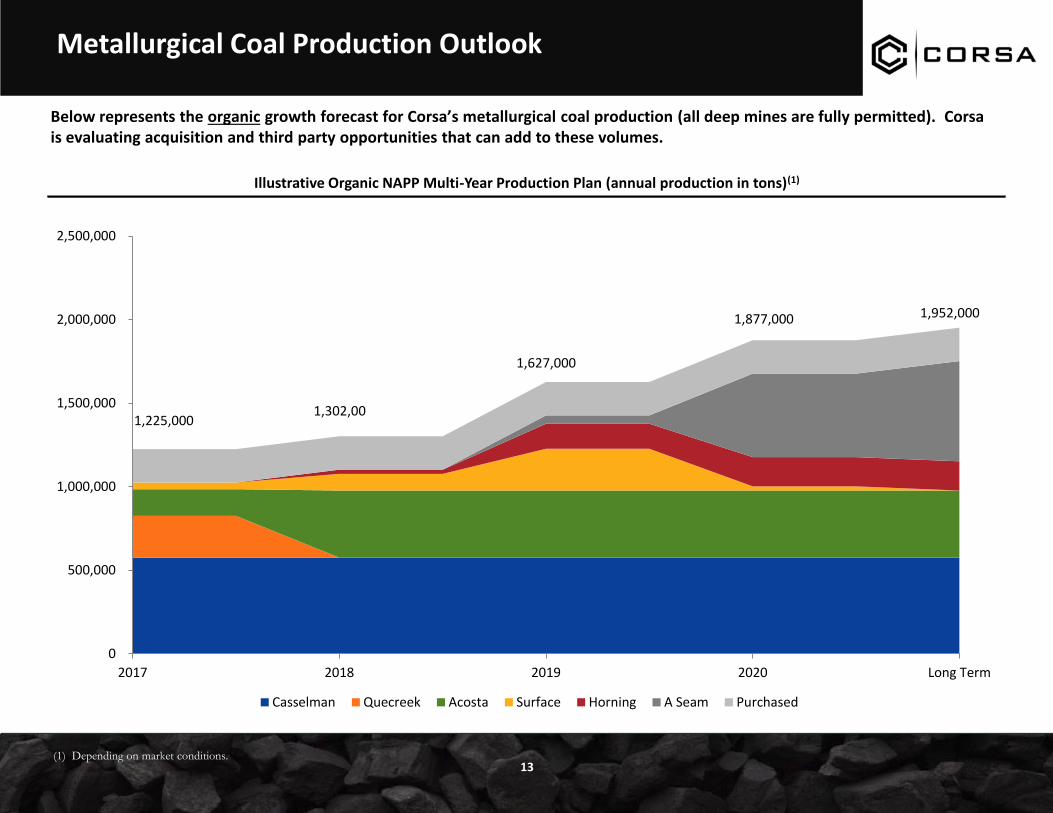
Metallurgical Coal Production Outlook
Below represents the organic growth forecast for Corsa’s metallurgical coal production (all deep mines are fully permitted). Corsa is evaluating acquisition and third party opportunities that can add to these volumes.
Illustrative Organic NAPP Multi-Year Production Plan (annual production in tons)(1)
1,225,000
0
500,000
1,000,000
1,500,000
2,000,000
2,500,000
2017 2018 2019 2020 Long Term
Casselman Quecreek Acosta Surface Horning A Seam Purchased
1,627,000
1,877,000 1,952,000
1,302,00
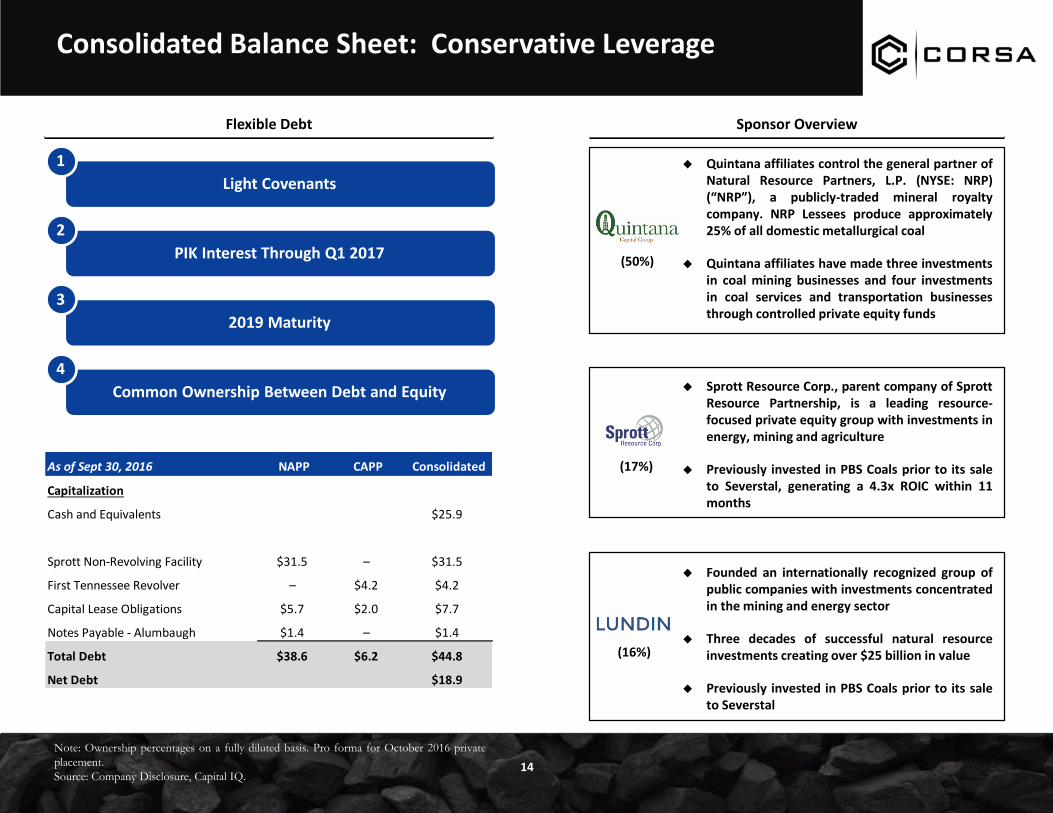
Consolidated Balance Sheet: Conservative Leverage
14
Note: Ownership percentages on a fully diluted basis. Pro forma for October 2016 private
placement.
Source: Company Disclosure, Capital IQ.
Light Covenants
1
PIK Interest Through Q1 2017
2
2019 Maturity
3
Common Ownership Between Debt and Equity
4
Sponsor OverviewFlexible Debt
Quintana affiliates control the general partner ofNatural Resource Partners, L.P. (NYSE: NRP)(“NRP”), a publicly-traded mineral royaltycompany. NRP Lessees produce approximately25% of all domestic metallurgical coal
Quintana affiliates have made three investmentsin coal mining businesses and four investmentsin coal services and transportation businessesthrough controlled private equity funds
(50%)
Sprott Resource Corp., parent company of SprottResource Partnership, is a leading resource-focused private equity group with investments inenergy, mining and agriculture
Previously invested in PBS Coals prior to its saleto Severstal, generating a 4.3x ROIC within 11months
(17%)
Founded an internationally recognized group ofpublic companies with investments concentratedin the mining and energy sector
Three decades of successful natural resourceinvestments creating over $25 billion in value
Previously invested in PBS Coals prior to its saleto Severstal
(16%)
As of Sept 30, 2016 NAPP CAPP Consolidated
Capitalization
Cash and Equivalents $25.9
Sprott Non-Revolving Facility $31.5 – $31.5
First Tennessee Revolver – $4.2 $4.2
Capital Lease Obligations $5.7 $2.0 $7.7
Notes Payable - Alumbaugh $1.4 – $1.4
Total Debt $38.6 $6.2 $44.8
Net Debt $18.9

Updated 2016 and Fourth Quarter Guidance
15
Note: See Appendix for non-GAAP financial measures.
(1) Non-GAAP financial measure.
(2) Exclusive of stock based compensation.
2016 Guidance NAPP Division CAPP Division CorporateNAPP Division
3 Months Ending Q3 2016
2016 Coal Sales (tons)650,000 – 750,000 (Met)
200,000 – 250,000 (Thermal)450,000 – 550,000 (Thermal)
Q4 2016 Coal Sales (tons)250,000 (Met)
75% Increase QoQ50,000 – 100,000 (Thermal)
125,000 – 175,000 (Thermal) 143,000 (Met)
Q4 2016 Revenue /
Ton Sold (1 (tons)
100% Fixed at $100 (Met)44% improvement QoQ
$69.48 (Met)
2016 Cash Production Cost /
Ton Sold(1)
$57.00 – $62.00 (Met)$32.00 – $37.00 (Thermal)
$56.00 – $61.00 (Thermal)
2016 General and
Administrative(2)$4.0-4.5 million $1.3-1.8 million $2.5-3.0 million
Long-Term Maintenance
Capex per Ton Sold$4.00 $4.00
Note: Corsa expects Q1 2017 metallurgical prices to improve further relative to Q4 2016 as lower-priced, legacy domestic 2016 contracts expire(these legacy contracts represent approximately 45% of Q4 metallurgical sales volumes)
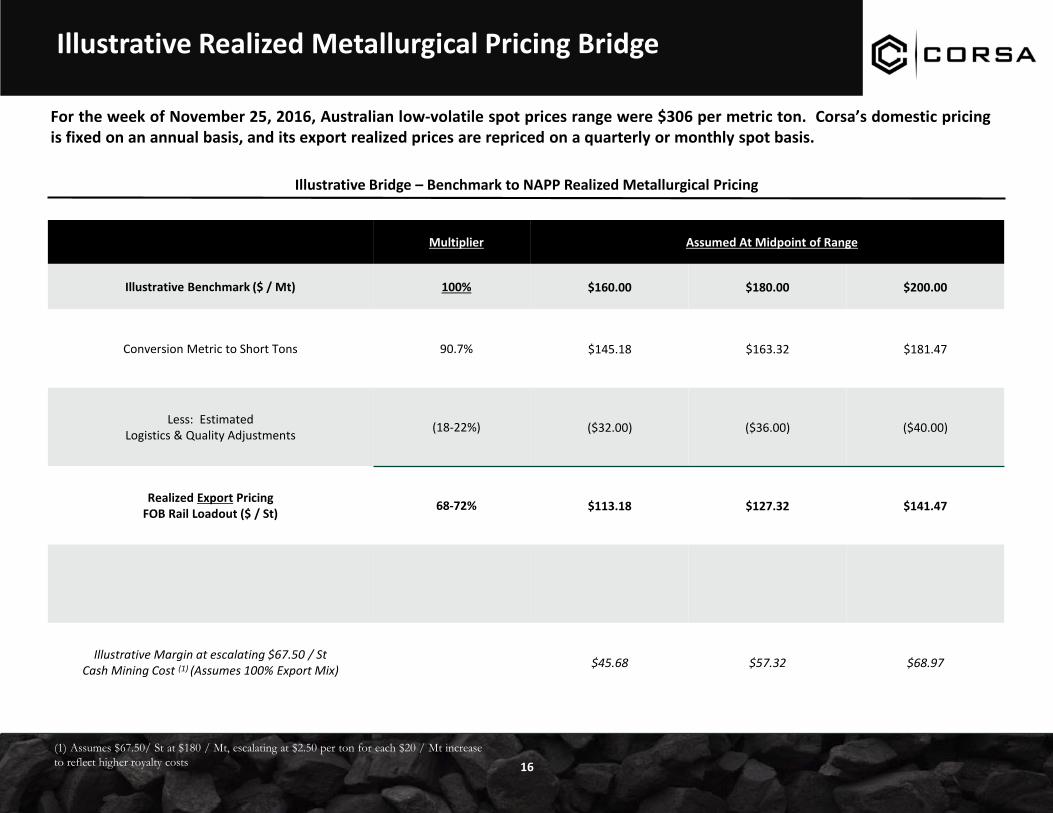
Illustrative Realized Metallurgical Pricing Bridge
16
For the week of November 25, 2016, Australian low-volatile spot prices range were $306 per metric ton. Corsa’s domestic pricingis fixed on an annual basis, and its export realized prices are repriced on a quarterly or monthly spot basis.
Illustrative Bridge – Benchmark to NAPP Realized Metallurgical Pricing
Multiplier Assumed At Midpoint of Range
Illustrative Benchmark ($ / Mt) 100% $160.00 $180.00 $200.00
Conversion Metric to Short Tons 90.7% $145.18 $163.32 $181.47
Less: Estimated Logistics & Quality Adjustments
(18-22%) ($32.00) ($36.00) ($40.00)
Realized Export Pricing FOB Rail Loadout ($ / St)
68-72% $113.18 $127.32 $141.47
Illustrative Margin at escalating $67.50 / St Cash Mining Cost (1) (Assumes 100% Export Mix)
$45.68 $57.32 $68.97
(1) Assumes $67.50/ St at $180 / Mt, escalating at $2.50 per ton for each $20 / Mt increase
to reflect higher royalty costs

Illustrative NAPP EBITDA Bridge
17
Assumes Q4’16 and 2017 cash mining costs based on YTD costs and adjusted for inflation and higher royalty costs. Pricing assumes a $180 /Mt benchmark price (FOBT) for 2017 based on historical differentials. These figures are for illustrative purposes only and do not reflectguidance unless explicitly stated.
Illustrative Bridge – NAPP EBITDA
($ in 000’s unless stated) Q1'16A Q2'16A Q3'16A Q4'16 Illustrative 2017 Illustrative
NAPP Metallurgical Tons Sold (St) 107,000 143,000 177,000 250,000(1) 1,225,000
Metallurgical Realized Price per Ton Sold ($ / St) $68.82 $60.73 $69.48 $100.00(1) $127.32
Cash Production Cost Per Metallurgical Ton Sold $62.23 $59.34 $60.07 $62.50 $70.04
NAPP Cash Margin Per Metallurgical Ton Sold ($ / St) $6.59 $1.39 $9.41 $37.50 $57.28
NAPP Thermal Tons Sold (St) 42,000 66,000 61,000 50,000(1) 100,000
Cash Margin Per Thermal Ton Sold ($ / St) ($1.26) ($2.50) ($3.43) $0.00 $0.00
NAPP Cash Gross Margin ($ in 000's) $652 $34 $1,456 $9,374 $70,172
Corporate and administrative expense ($1,178) ($1,204) ($1,121)
Idle Mine Expense(2) ($269) ($510) ($138)
Other Income (Expense) (2) $188 $491 $267
NAPP Adjusted EBITDA(3) ($607) ($1,189) $464
(1) Represents Q4 2016 guidance
(2) See appendix for additional notes and breakout
(3) Differences due to rounding
($20,000)
$20,000
$60,000
$100,000
$140,000
$180,000
$220,000
$260,000
2011
SV
S P
BS
2012
SV
S P
BS
2013
SV
S P
BS
2014
SV
S P
BS
2015
CSO
NA
PP
$160
Ben
chm
ark
$180
Ben
chm
ark
$200
Ben
chm
ark
NA
PP
Seg
me
nt
EBIT
DA
($
in 0
00
's)
Operating Leverage to Rebound in Metallurgical Coal Prices
18
Historical NAPP Segment EBITDA and Sensitivity to Prices(1)
Note: Market Data as of November 25, 2016
(1) Figures 2014 and earlier represent PBS metallurgical segment EBITDA. Figures past 2015
represent illustrative NAPP segment contributions based on 1.1mm tons of production
Acquisition byCorsa
Illustrative 2017 NAPP EBITDA assumes1.225 million tons of met sales, 100%export sales mix, quality & logisticsdifferentials in line with historical levels.
Competitive valuation based onillustrative EBITDA multiple.
Corsa Current Enterprise Value

Corsa Share Price Has Lagged the Price Recovery
19
Note: Market data as of November 25, 2016.
(1) Gross margin plus D&A. CSO based on midpoint Q4’16 sales tons and pricing
guidance. Canadian met comparable based on Q3’16 actual.
Mine-level Cash Margin Contribution(1) Relative Share Price Performance
93%
7%
TSXV:CSO
Metallurgical Coal Other
50
100
150
200
250
300
350
400
Re
lati
ve P
rice
Ind
exe
d t
o M
arch
20
16
TSXV:CSO Canadian Met Coal Peer Spot Benchmark Price
38%
62%
Canadian Met Comparable
Metallurgical Coal Other

Appendix – CAPP Division
20
Short Tons in 000’s Reserves(B) Resources(C)
Surface Mines 2,568 -
Double Mountain Underground 1,803 675
Cooper Ridge Underground 4,065 -
Cumberland Gap Underground 10,745 22,424
Other Underground Mines 2,325 -
Total 21,506 23,099
Description
Thermal and Industrial Coal Reserves and Resources(D)
Map of Kopper Glo Mining Operations
Infrastructure Details
350 raw ton per hour preparation plant
Dual access to CSX and Norfolk Southern Railroads
Supports 110 car unit trains
Storage areas for 20,000 raw tons and 40,000 clean tons of coal
Disposal site capacity of 22 million tons
Commenced operations in 1959
Currently producing from 1 surface and 2 underground mines
Annualized sales rate of ~715,000 tons(1)
Cooper Ridge Underground mine
Higher coal qualities from the Jellico seam match thespecifications of the niche industrial and specialty markets
Actively sold as high vol metallurgical crossover coal
Short-term plans to potentially reach two productionsections with 400,000 tons production capacity
Approximately 50% of production volumes are contracted with aninvestment-grade utility
Virginia
Clairfield
90
Clear Fork
Double
Mountain
Back Creek
Ben’s Branch
K E N T U C K Y
T E N N E S S E E
Cooper Ridge
Surface / Deep Kentucky
Tennessee Straight Creek
Deep
Straight Creek
Surface
Cumberland
Gap
Rich Gap -
Mason
Surface Mine
Underground Mine
Preparation Plant
Projects
(1) Includes purchased coal.
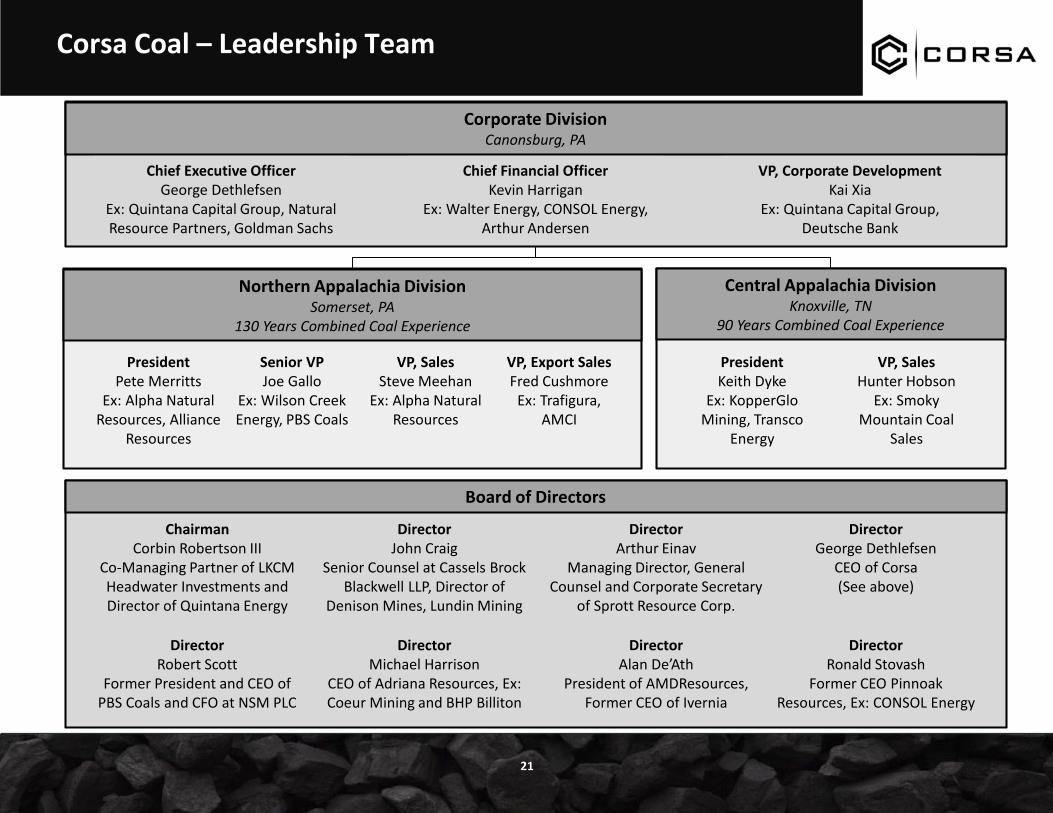
Corsa Coal – Leadership Team
21
Corporate DivisionCanonsburg, PA
Chief Executive OfficerGeorge Dethlefsen
Ex: Quintana Capital Group, Natural Resource Partners, Goldman Sachs
Chief Financial OfficerKevin Harrigan
Ex: Walter Energy, CONSOL Energy, Arthur Andersen
VP, Corporate DevelopmentKai Xia
Ex: Quintana Capital Group, Deutsche Bank
Northern Appalachia DivisionSomerset, PA
130 Years Combined Coal Experience
PresidentPete Merritts
Ex: Alpha Natural Resources, Alliance
Resources
Senior VPJoe Gallo
Ex: Wilson Creek Energy, PBS Coals
VP, SalesSteve Meehan
Ex: Alpha Natural Resources
Central Appalachia DivisionKnoxville, TN
90 Years Combined Coal Experience
PresidentKeith Dyke
Ex: KopperGlo Mining, Transco
Energy
VP, SalesHunter Hobson
Ex: Smoky Mountain Coal
Sales
Board of Directors
DirectorArthur Einav
Managing Director, General Counsel and Corporate Secretary
of Sprott Resource Corp.
DirectorMichael Harrison
CEO of Adriana Resources, Ex: Coeur Mining and BHP Billiton
DirectorRobert Scott
Former President and CEO of PBS Coals and CFO at NSM PLC
DirectorRonald Stovash
Former CEO Pinnoak Resources, Ex: CONSOL Energy
ChairmanCorbin Robertson III
Co-Managing Partner of LKCM Headwater Investments and Director of Quintana Energy
DirectorJohn Craig
Senior Counsel at Cassels Brock Blackwell LLP, Director of
Denison Mines, Lundin Mining
DirectorAlan De’Ath
President of AMDResources, Former CEO of Ivernia
DirectorGeorge Dethlefsen
CEO of Corsa(See above)
VP, Export SalesFred Cushmore
Ex: Trafigura, AMCI
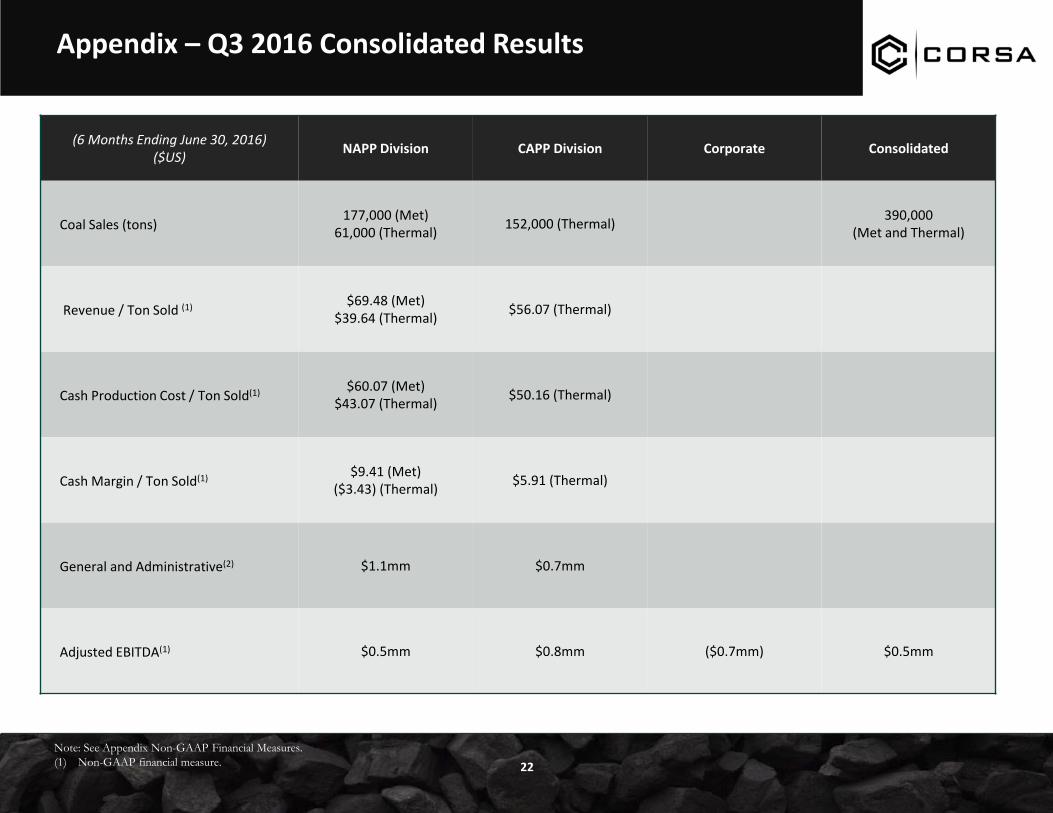
Appendix – Q3 2016 Consolidated Results
22
(6 Months Ending June 30, 2016)($US)
NAPP Division CAPP Division Corporate Consolidated
Coal Sales (tons)177,000 (Met)
61,000 (Thermal)152,000 (Thermal)
390,000 (Met and Thermal)
Revenue / Ton Sold (1)$69.48 (Met)
$39.64 (Thermal)$56.07 (Thermal)
Cash Production Cost / Ton Sold(1)$60.07 (Met)
$43.07 (Thermal)$50.16 (Thermal)
Cash Margin / Ton Sold(1)$9.41 (Met)
($3.43) (Thermal)$5.91 (Thermal)
General and Administrative(2) $1.1mm $0.7mm
Adjusted EBITDA(1) $0.5mm $0.8mm ($0.7mm) $0.5mm
Note: See Appendix Non-GAAP Financial Measures.
(1) Non-GAAP financial measure.
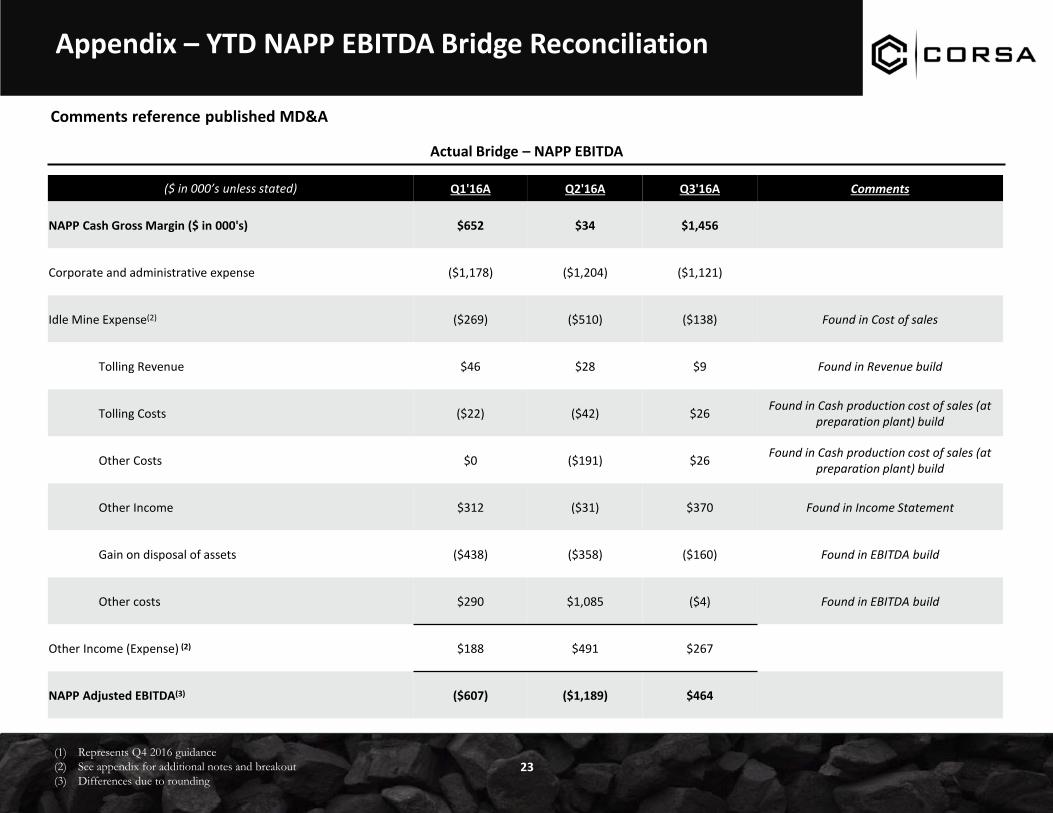
Appendix – YTD NAPP EBITDA Bridge Reconciliation
23
Actual Bridge – NAPP EBITDA
($ in 000’s unless stated) Q1'16A Q2'16A Q3'16A Comments
NAPP Cash Gross Margin ($ in 000's) $652 $34 $1,456
Corporate and administrative expense ($1,178) ($1,204) ($1,121)
Idle Mine Expense(2) ($269) ($510) ($138) Found in Cost of sales
Tolling Revenue $46 $28 $9 Found in Revenue build
Tolling Costs ($22) ($42) $26 Found in Cash production cost of sales (at
preparation plant) build
Other Costs $0 ($191) $26 Found in Cash production cost of sales (at
preparation plant) build
Other Income $312 ($31) $370 Found in Income Statement
Gain on disposal of assets ($438) ($358) ($160) Found in EBITDA build
Other costs $290 $1,085 ($4) Found in EBITDA build
Other Income (Expense) (2) $188 $491 $267
NAPP Adjusted EBITDA(3) ($607) ($1,189) $464
(1) Represents Q4 2016 guidance
(2) See appendix for additional notes and breakout
(3) Differences due to rounding
Comments reference published MD&A
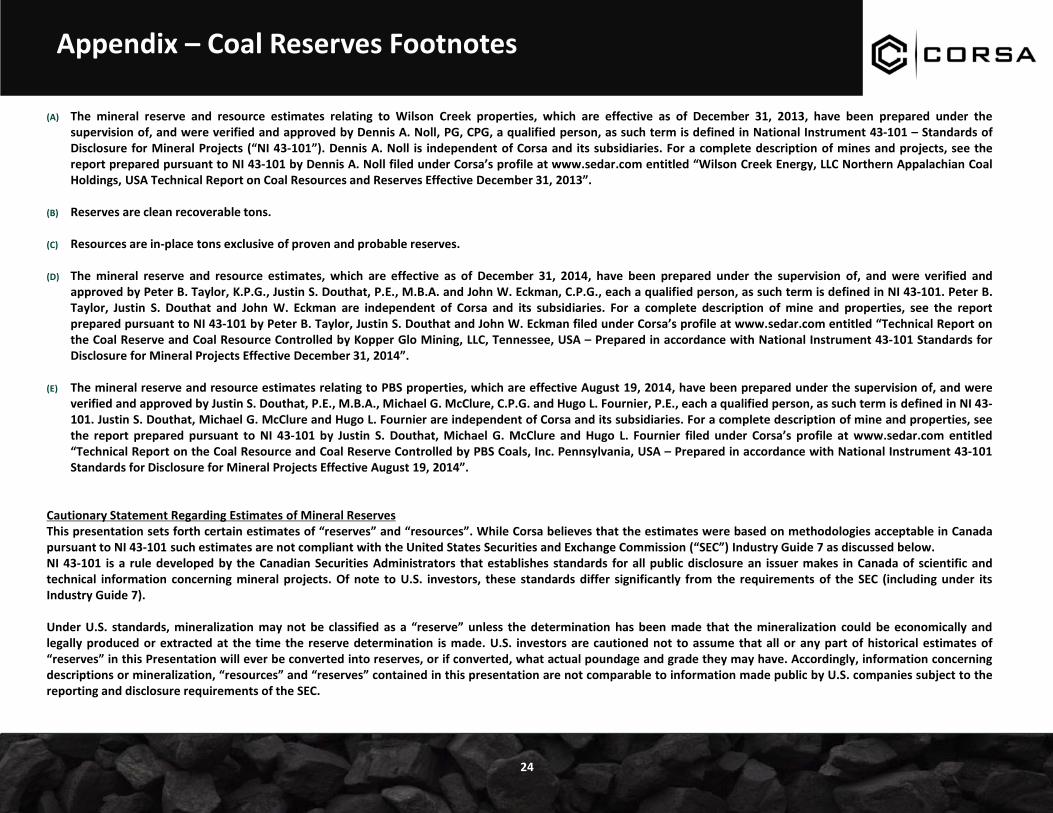
Appendix – Coal Reserves Footnotes
24
(A) The mineral reserve and resource estimates relating to Wilson Creek properties, which are effective as of December 31, 2013, have been prepared under thesupervision of, and were verified and approved by Dennis A. Noll, PG, CPG, a qualified person, as such term is defined in National Instrument 43-101 – Standards ofDisclosure for Mineral Projects (“NI 43-101”). Dennis A. Noll is independent of Corsa and its subsidiaries. For a complete description of mines and projects, see thereport prepared pursuant to NI 43-101 by Dennis A. Noll filed under Corsa’s profile at www.sedar.com entitled “Wilson Creek Energy, LLC Northern Appalachian CoalHoldings, USA Technical Report on Coal Resources and Reserves Effective December 31, 2013”.
(B) Reserves are clean recoverable tons.
(C) Resources are in-place tons exclusive of proven and probable reserves.
(D) The mineral reserve and resource estimates, which are effective as of December 31, 2014, have been prepared under the supervision of, and were verified andapproved by Peter B. Taylor, K.P.G., Justin S. Douthat, P.E., M.B.A. and John W. Eckman, C.P.G., each a qualified person, as such term is defined in NI 43-101. Peter B.Taylor, Justin S. Douthat and John W. Eckman are independent of Corsa and its subsidiaries. For a complete description of mine and properties, see the reportprepared pursuant to NI 43-101 by Peter B. Taylor, Justin S. Douthat and John W. Eckman filed under Corsa’s profile at www.sedar.com entitled “Technical Report onthe Coal Reserve and Coal Resource Controlled by Kopper Glo Mining, LLC, Tennessee, USA – Prepared in accordance with National Instrument 43-101 Standards forDisclosure for Mineral Projects Effective December 31, 2014”.
(E) The mineral reserve and resource estimates relating to PBS properties, which are effective August 19, 2014, have been prepared under the supervision of, and wereverified and approved by Justin S. Douthat, P.E., M.B.A., Michael G. McClure, C.P.G. and Hugo L. Fournier, P.E., each a qualified person, as such term is defined in NI 43-101. Justin S. Douthat, Michael G. McClure and Hugo L. Fournier are independent of Corsa and its subsidiaries. For a complete description of mine and properties, seethe report prepared pursuant to NI 43-101 by Justin S. Douthat, Michael G. McClure and Hugo L. Fournier filed under Corsa’s profile at www.sedar.com entitled“Technical Report on the Coal Resource and Coal Reserve Controlled by PBS Coals, Inc. Pennsylvania, USA – Prepared in accordance with National Instrument 43-101Standards for Disclosure for Mineral Projects Effective August 19, 2014”.
Cautionary Statement Regarding Estimates of Mineral ReservesThis presentation sets forth certain estimates of “reserves” and “resources”. While Corsa believes that the estimates were based on methodologies acceptable in Canadapursuant to NI 43-101 such estimates are not compliant with the United States Securities and Exchange Commission (“SEC”) Industry Guide 7 as discussed below.NI 43-101 is a rule developed by the Canadian Securities Administrators that establishes standards for all public disclosure an issuer makes in Canada of scientific andtechnical information concerning mineral projects. Of note to U.S. investors, these standards differ significantly from the requirements of the SEC (including under itsIndustry Guide 7).
Under U.S. standards, mineralization may not be classified as a “reserve” unless the determination has been made that the mineralization could be economically andlegally produced or extracted at the time the reserve determination is made. U.S. investors are cautioned not to assume that all or any part of historical estimates of“reserves” in this Presentation will ever be converted into reserves, or if converted, what actual poundage and grade they may have. Accordingly, information concerningdescriptions or mineralization, “resources” and “reserves” contained in this presentation are not comparable to information made public by U.S. companies subject to thereporting and disclosure requirements of the SEC.
Appendix – Non-GAAP Financial Measures
25
This presentation references certain financial measures, not recognized under International Financial Reporting Standards (“IFRS” or “GAAP”):
• EBITDA: Earnings before deductions for interest, taxes, depreciation and amortization
• Adjusted EBITDA: EBITDA adjusted for change in estimate of reclamation provisions for non-operating properties, impairment and write-off of mineral properties andadvance royalties, gain (loss) on sale of assets and other costs, stock-based compensation, non-cash finance expenses and other non-cash adjustments
• Revenue per ton sold: Net coal sales divided by tons of coal sold
• Cash production cost per ton sold: Cash production costs of sales divided by tons of coal sold
• Cash margin per ton sold: Difference between realized price per ton sold and cash production cost per ton sold
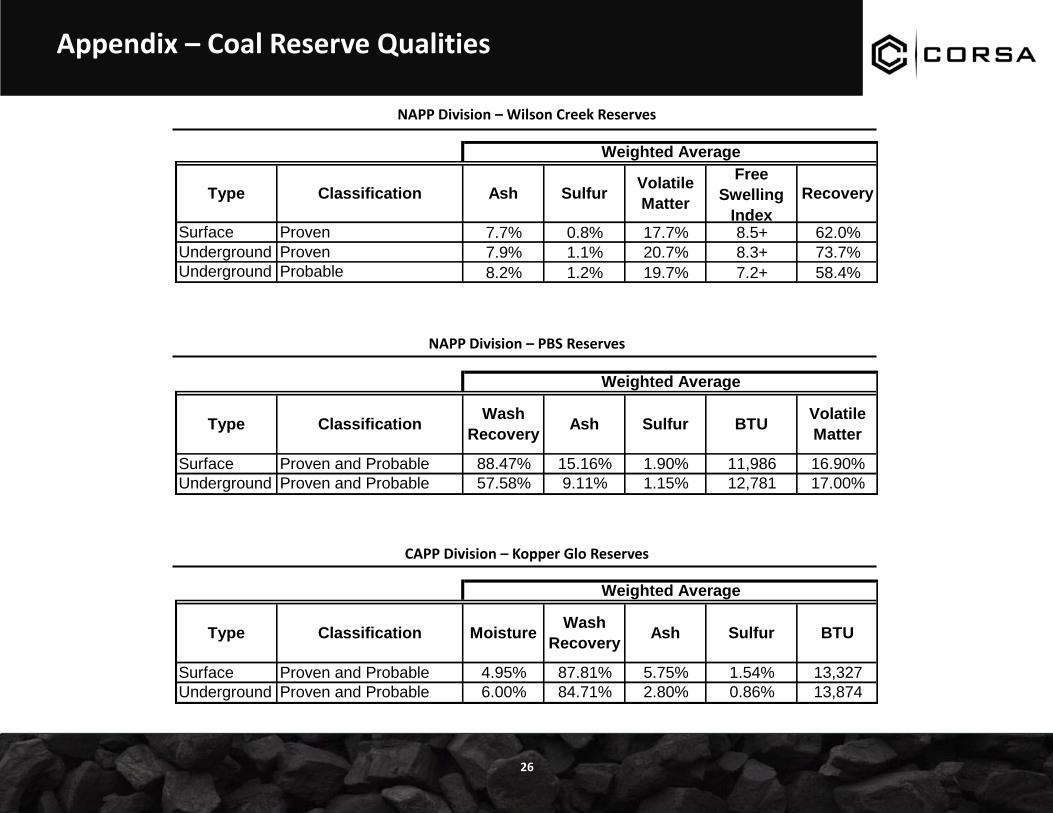
Appendix – Coal Reserve Qualities
26
NAPP Division – Wilson Creek Reserves
Weighted Average
Type Classification Ash SulfurVolatile
Matter
Free
Swelling
Index
Recovery
Surface Proven 7.7% 0.8% 17.7% 8.5+ 62.0%
Underground Proven 7.9% 1.1% 20.7% 8.3+ 73.7%
Underground Probable 8.2% 1.2% 19.7% 7.2+ 58.4%
NAPP Division – PBS Reserves
Weighted Average
Type ClassificationWash
RecoveryAsh Sulfur BTU
Volatile
Matter
Surface Proven and Probable 88.47% 15.16% 1.90% 11,986 16.90%
Underground Proven and Probable 57.58% 9.11% 1.15% 12,781 17.00%
CAPP Division – Kopper Glo Reserves
Weighted Average
Type Classification MoistureWash
RecoveryAsh Sulfur BTU
Surface Proven and Probable 4.95% 87.81% 5.75% 1.54% 13,327
Underground Proven and Probable 6.00% 84.71% 2.80% 0.86% 13,874
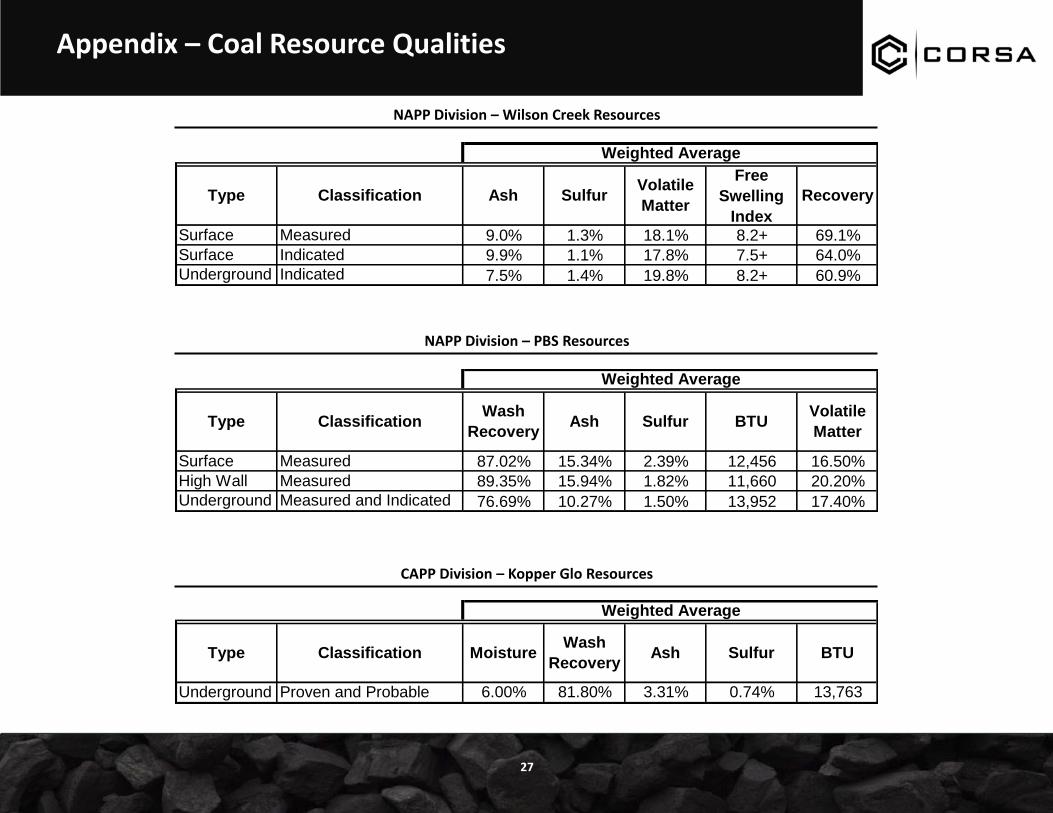
Appendix – Coal Resource Qualities
27
NAPP Division – Wilson Creek Resources
Weighted Average
Type Classification Ash SulfurVolatile
Matter
Free
Swelling
Index
Recovery
Surface Measured 9.0% 1.3% 18.1% 8.2+ 69.1%
Surface Indicated 9.9% 1.1% 17.8% 7.5+ 64.0%
Underground Indicated 7.5% 1.4% 19.8% 8.2+ 60.9%
NAPP Division – PBS Resources
Weighted Average
Type ClassificationWash
RecoveryAsh Sulfur BTU
Volatile
Matter
Surface Measured 87.02% 15.34% 2.39% 12,456 16.50%
High Wall Measured 89.35% 15.94% 1.82% 11,660 20.20%
Underground Measured and Indicated 76.69% 10.27% 1.50% 13,952 17.40%
CAPP Division – Kopper Glo Resources
Weighted Average
Type Classification MoistureWash
RecoveryAsh Sulfur BTU
Underground Proven and Probable 6.00% 81.80% 3.31% 0.74% 13,763